Attached files
Table of Contents
UNITED STATES
SECURITIES AND EXCHANGE COMMISSION
Washington, D.C. 20549
FORM 10-K
Annual Report Pursuant to Section 13 or 15(d) of the
Securities Exchange Act of 1934
| For the fiscal year ended December 31, 2009 | Commission File Number 0-13823 |
FNB UNITED CORP.
(Exact name of Registrant as specified in its Charter)
| North Carolina | 56-1456589 | |
| (State of Incorporation) | (I.R.S. Employer Identification No.) | |
| 150 South Fayetteville Street | ||
| Asheboro, North Carolina | 27203 | |
| (Address of principal executive offices) | (Zip Code) | |
(336) 626-8300
(Registrant’s telephone number, including area code)
Securities Registered Pursuant to Section 12(g) of the Securities Exchange Act of 1934:
Title of each class
Common Stock, $2.50 par value
Indicate by check mark if the registrant is a well-known seasoned issuer as defined in Rule 405 of the Securities Act. Yes¨ Nox
Indicate by check mark if the registrant is not required to file reports pursuant to Section 13 or Section 15(d) of the Exchange Act. Yes¨ Nox
Indicate by check mark whether the Registrant (1) has filed all reports required to be filed by Section 13 or 15(d) of the Securities Exchange Act of 1934 during the preceding 12 months (or for such shorter period that the Registrant was required to file such reports), and (2) has been subject to such filing requirements for the past 90 days. Yesx No¨
Indicate by check mark whether the registrant (1) has submitted electronically and posted on its corporate Website, if any, every Interactive Data File required to be submitted and posted pursuant to Rule 405 of Regulation S-T (§232.405 of this chapter) during the preceding 12 months (or for such shorter period that the registrant was required to submit and post such files.) Yes¨ No¨
Indicate by check mark if disclosure of delinquent filers pursuant to Item 405 of Regulation S-K is not contained herein, and will not be contained, to the best of the Registrant’s knowledge, in definitive proxy or information statements incorporated by reference to Part III of this Form 10-K or any amendment to this Form 10-K. ¨
Indicate by check mark whether the registrant is a large accelerated filer, an accelerated filer, a non-accelerated filer or a smaller reporting company. See the definitions of “large accelerated filer,” “accelerated filer,” and “smaller reporting company” in Rule 12b-2 of the Exchange Act. (Check one)
| Large accelerated filer ¨ |
Accelerated filer ¨ |
Non-accelerated filer ¨ |
Smaller reporting company x | |||
| (Do not check if a smaller |
||||||
| reporting company) |
Indicate by check mark whether the registrant is a shell company (as defined in Rule 12b-2 of the Exchange Act). Yes¨ Nox
The aggregate market value of the Registrant’s common stock held by nonaffiliates of the Registrant, assuming, without admission, that all directors and officers of the Registrant may be deemed affiliates, was approximately $28.0 million as of June 30, 2009, the last business day of the Registrant’s most recently completed second fiscal quarter. As of April 12, 2010 (the most recent practicable date), the Registrant had outstanding 11,426,413 shares of Common Stock.
Portions of the Proxy Statement of the Registrant for the Annual Meeting of Shareholders to be held on May 25, 2010, are incorporated by reference in Part III of this report.
Table of Contents
Form 10-K
Table of Contents
| Index |
Page | |||
| PART I |
||||
| Item 1. |
1 | |||
| Item 1A. |
9 | |||
| Item 1B. |
16 | |||
| Item 2. |
16 | |||
| Item 3. |
16 | |||
| Item 4. |
16 | |||
| PART II |
||||
| Item 5. |
17 | |||
| Item 6. |
19 | |||
| Item 7. |
MANAGEMENT’S DISCUSSION AND ANALYSIS OF FINANCIAL CONDITION AND RESULTS OF OPERATIONS |
20 | ||
| Item 7A. |
46 | |||
| Item 8. |
48 | |||
| Item 9. |
CHANGES IN AND DISAGREEMENTS WITH ACCOUNTANTS ON ACCOUNTING AND FINANCIAL DISCLOSURE |
98 | ||
| Item 9A. |
98 | |||
| Item 9B. |
99 | |||
| PART III |
||||
| Item 10. |
100 | |||
| Item 11. |
100 | |||
| Item 12. |
SECURITY OWNERSHIP OF CERTAIN BENEFICIAL OWNERS AND MANAGEMENT AND RELATED SHAREHOLDER MATTERS |
100 | ||
| Item 13. |
CERTAIN RELATIONSHIPS AND RELATED TRANSACTIONS AND DIRECTOR INDEPENDENCE |
100 | ||
| Item 14. |
100 | |||
| PART IV |
||||
| Item 15. |
100 | |||
| 104 | ||||
Table of Contents
Cautionary Statement Regarding Forward-Looking Statements
The statements contained in this Annual Report on Form 10-K of FNB United Corp. (“FNB United”) that are not historical facts are forward-looking statements, as such term is defined in the Private Securities Litigation Reform Act of 1995. These statements can be identified by the use of forward-looking terminology, such as “believes,” “expects,” “plans,” “projects,” “goals,” “estimates,” “may,” “should,” “could,” “would,” “intends,” “outlook” or “anticipates,” or the negative of such terms, variations of these and similar words, or by discussions of strategy that involve risks and uncertainties. In addition, from time to time FNB United or its representatives have made or may make forward-looking statements, orally or in writing. Such forward-looking statements may be included in, but are not limited to, various filings made by FNB United with the Securities and Exchange Commission, or press releases or oral statements made by or with the approval of an authorized officer of FNB United. Forward-looking statements are based on management’s current views and assumptions and involve risks and uncertainties that could significantly affect expected results.
FNB United wishes to caution the reader that factors, such as those listed below, in some cases have affected and could affect FNB United’s actual results, causing actual results to differ materially from those in any forward-looking statement. These factors include, without limitation: (i) competitive pressures in the banking industry or in FNB United’s markets may increase significantly; (ii) inflation, interest rate, market and monetary fluctuations; (iii) general economic conditions, either nationally or regionally, may be less favorable than expected, resulting in, among other things, credit quality deterioration or a reduced demand for credit or other services; (iv) the effects of and changes in trade, monetary and fiscal policies and laws, including interest rate policies of the Board of Governors of the Federal Reserve System; (v) adverse changes in the securities markets; (vi) changes may occur in banking and other applicable legislation and regulation; (vii) changes in accounting principles and standards; (viii) adverse changes in financial performance or condition of FNB United’s borrowers, which could affect repayment of such borrowers’ outstanding loans; (ix) changes in general business conditions; (x) competitors of FNB United may have greater financial resources and develop products that enable them to compete more successfully than FNB United; (xi) unpredictable natural and other disasters could have an adverse effect on FNB United in that such events could materially disrupt its operations or the ability or willingness of its customers to access the financial services offered by FNB United; (xii) local, state or federal taxing authorities may take tax positions that are adverse to FNB United; and (xiii) FNB United’s success at managing the risks involved in the foregoing. FNB United cautions that this list of factors is not exclusive. Our forward-looking statements may also be subject to other risks and uncertainties, including those discussed elsewhere in this report, such as in Item 1A, “Risk Factors,” and in the “Management’s Discussion and Analysis of Financial Condition and Results of Operations” in Item 7, or in our other filings with the Securities and Exchange Commission.
All forward-looking statements speak only as of the date on which such statements are made, and FNB United undertakes no obligation to update any statement, whether written or oral, to reflect events or circumstances after the date on which such statement is made or to reflect the occurrence of unanticipated events.
i
Table of Contents
PART I
| Item 1. | BUSINESS |
General
FNB United Corp. (“FNB United”), formerly known as FNB Corp. prior to April 28, 2006, is a bank holding company incorporated under the laws of the State of North Carolina in 1984. On July 2, 1985, through an exchange of stock, FNB United acquired a wholly owned bank subsidiary, CommunityONE Bank, National Association (the “Bank”), a national banking association founded in 1907 and formerly known as First National Bank and Trust Company. First National Bank and Trust Company changed its name to CommunityONE Bank, National Association as of June 4, 2007. The Bank has two operating subsidiaries, Dover Mortgage Company (“Dover”) and First National Investor Services, Inc.; and an inactive subsidiary, Premier Investment Services, Inc., acquired through its merger with Alamance Bank. On November 4, 2005, FNB United acquired, through its merger with United Financial, Inc. (“United”), another wholly owned bank subsidiary, Alamance Bank, a North Carolina-chartered bank organized in 1998 as a national bank. Alamance Bank was merged into the Bank effective February 1, 2006. On April 28, 2006, FNB United acquired through its merger with Integrity Financial Corporation (“Integrity”), an additional bank subsidiary, First Gaston Bank of North Carolina, including its divisions Catawba Valley Bank and Northwestern Bank. On August 1, 2006, First Gaston Bank was merged into the Bank. FNB United is parent to FNB United Statutory Trust I, FNB United Statutory Trust II, and Catawba Valley Capital Trust II, the latter trust formerly being an Integrity subsidiary. FNB United and its subsidiaries are collectively referred to as the “Company.”
The Bank, which is a full-service bank, currently conducts all of its operations in Alamance, Alexander, Ashe, Catawba, Chatham, Gaston, Guilford, Iredell, Mecklenburg, Montgomery, Moore, Orange, Randolph, Richmond, Rowan, Scotland, Watauga and Wilkes counties in North Carolina. The Bank has forty-five offices, including the headquarters office in the City of Asheboro. Some of the major banking services offered include regular checking accounts, interest checking accounts (including package account versions that offer a variety of products and services), money market accounts, savings accounts, certificates of deposit, individual retirement accounts, debit cards, credit cards (offered through an agent relationship), and loans — both secured and unsecured — for business, agricultural and personal use. Other services offered include home mortgages, online and mobile banking, cash management, investment management and trust services. The Bank also has automated teller machines and is a member of Plus, a national automated teller machine network, and Star, a regional network.
Dover, acquired by FNB United in 2003, originates, underwrites and closes mortgage loans for sale into the secondary market. Dover has a retail origination network based in Charlotte and also conducts wholesale operations in Georgia, Maine, Maryland, New Hampshire, North Carolina, South Carolina, Tennessee and Virginia.
First National Investor Services, Inc., which does business as Marketplace Finance, is engaged in servicing loans purchased by the Bank from automobile dealers.
In the 2006 fourth quarter, FNB United and the Bank significantly expanded their headquarters facilities in Asheboro, North Carolina, adding a separate facility for certain executive and administrative functions and an operating center for loan and deposit operations.
In November 2005 and April 2006, FNB United formed FNB United Statutory Trust I and FNB United Statutory Trust II, respectively, to facilitate the issuance of trust preferred securities. FNB United Statutory Trust I is a statutory business trust formed under the laws of the State of Connecticut. FNB United Statutory Trust II is a statutory business trust formed under the laws of the State of Delaware. All common securities of the trusts are owned by FNB United. Similar trust arrangements, Catawba Valley Capital Trust I and Catawba Valley Capital Trust II, were acquired by FNB United on April 28, 2006 through its merger with Integrity. FNB United caused the redemption of the securities issued by Catawba Valley Trust I as of December 30, 2007, and that trust was subsequently dissolved.
Competition
The banking industry within the Bank’s marketing area is extremely competitive. The Bank faces direct competition in the counties in which it maintains offices from approximately 115 different financial institutions, including commercial banks, savings institutions and credit unions. Although no one of these entities is dominant, the Bank
1
Table of Contents
considers itself to be one of the significant financial institutions in the area in terms of total assets and deposits. Further competition is provided by banks located in adjoining counties, as well as other types of financial institutions, such as insurance companies, finance companies, pension funds and brokerage houses and other money funds. The principal methods of competing in the commercial banking industry are improving customer service through the quality and range of services provided, improving cost efficiencies and pricing services competitively.
Dover faces competition within its market area from other mortgage banking companies and from all types of financial institutions engaged in the mortgage loan business. The principal methods of competing in the mortgage banking business are offering competitively priced mortgage loan products and providing prompt and efficient customer service.
Regulation and Supervision
The following discussion sets forth material elements of the regulatory framework applicable to bank holding companies and their subsidiaries. It also provides certain specific information relevant to FNB United. This regulatory framework is intended primarily for the protection of customers and depositors and the deposit insurance funds that insure deposits of banks and savings institutions, and not for the protection of security holders. To the extent that the following information describes statutory and regulatory provisions, it is qualified in its entirety by reference to those provisions. A change in the statutes, regulations or regulatory policies applicable to FNB United or its subsidiaries may have a material effect on the business of the Company. Additional information related to regulatory matters is contained in “Management’s Discussion and Analysis of Financial Condition and Results of Operations” below.
General
As a bank holding company, FNB United is subject to regulation under the Bank Holding Company Act of 1956, as amended, and to inspection, examination and supervision by the Federal Reserve Board. Under the Bank Holding Company Act, bank holding companies, such as FNB United, that have not elected to become financial holding companies under the Gramm-Leach-Bliley Act generally may not acquire ownership or control of more than 5% of the voting shares or substantially all the assets of any company, including a bank, without the Federal Reserve Board’s prior approval. With limited exceptions, bank holding companies may engage only in the business of banking or managing or controlling banks or furnishing services to or performing services for their subsidiary banks. A significant exception is that a bank holding company may own shares in a company whose activities the Federal Reserve Board has determined to be closely related to banking or managing or controlling banks.
As a national banking association, the Bank is subject to regulation and examination primarily by the Office of the Comptroller of the Currency (“OCC”). It is also regulated by the Federal Deposit Insurance Corporation (“FDIC”) and the Federal Reserve Board. The Bank’s deposits are insured by the FDIC through the Deposit Insurance Fund. The OCC and the FDIC impose various requirements and restrictions on the Bank, including requirements to maintain reserves against deposits, restrictions on the types and amounts of loans that may be granted and the interest that may be charged on loans, limitations on the types of investments that may be made and the types of services that may be offered, and requirements governing capital adequacy, liquidity, earnings, dividends, management practices and branching. As a member of the Federal Reserve System, the Bank is subject to the applicable provisions of the Federal Reserve Act, which imposes restrictions on loans by subsidiary banks to a holding company and its other subsidiaries and on the use of stock or securities as collateral security for loans.
Dover, as an operating subsidiary of the Bank, is regulated by the OCC. Because Dover underwrites mortgages guaranteed by the government, it is subject to other audits and examinations as required by the government agencies or the investors who purchase the mortgages.
Various consumer laws and regulations also affect the operations of the Company. In addition to the impact of regulation, financial institutions may be significantly affected by legislation, which can change the statutes affecting them in substantial and unpredictable ways and by the actions of the Federal Reserve Board as it attempts to control the money supply and credit availability to influence the economy. The instruments of monetary policy used by the Federal Reserve Board include its open market operations in U.S. Government securities, changes in the discount rate on member bank borrowings, and changes in reserve requirements on member bank deposits. The actions of the Federal Reserve Board influence the growth of bank loans, investments and deposits and also affect interest rates charged on loans or paid on deposits.
2
Table of Contents
In view of changing conditions in the national economy and money markets, as well as the effect of actions by monetary and fiscal authorities, no prediction can be made as to possible future changes in interest rates, deposit levels, loan demand or the business and earnings of the Company.
Liability for Bank Subsidiaries
Under current Federal Reserve Board policy, a bank holding company is expected to act as a source of financial and managerial strength to its subsidiary banks and to maintain resources adequate to support each subsidiary bank. This support may be required at times when the bank holding company may not have the resources to provide it. Similarly, the cross-guaranty provisions of the Federal Deposit Insurance Act provide that if the FDIC suffers or anticipates a loss as a result of a default by a banking subsidiary or by providing assistance to a subsidiary in danger of default, then any other bank subsidiaries may be assessed for the FDIC’s loss. Federal law authorizes the OCC to order an assessment of FNB United if the capital of the Bank were to become impaired. If the assessment were not paid within three months, the OCC could order the sale of FNB United’s stock in the Bank to cover the deficiency.
Any capital loans by a bank holding company to any of its bank subsidiaries are subordinate in right of payment to deposits and to certain other indebtedness of such bank subsidiaries. In the event of a bank holding company’s bankruptcy, any commitment by the bank holding company to a federal bank regulatory agency to maintain the capital of a subsidiary bank will be assumed by the bankruptcy trustee and entitled to a priority of payment.
Transactions with Affiliates
There are certain restrictions on the ability of FNB United and certain of its nonbank affiliates to borrow from, and engage in other transactions with, its bank subsidiary and on the ability of its bank subsidiary to pay dividends to FNB United. In general, these restrictions require that any extensions of credit must be secured by designated amounts of specified collateral and are limited, as to any one of FNB United or a nonbank affiliate, to 10% of the lending bank’s capital stock and surplus, and, as to FNB United and all such nonbank affiliates in the aggregate, to 20% of such lending bank’s capital stock and surplus. These restrictions, other than the 10% of capital limit on covered transactions with any one affiliate, are also applied to transactions between national banks and their financial subsidiaries. In addition, certain transactions with affiliates must be on terms and conditions, including credit standards, that are substantially the same, or at least as favorable to the institution, as those prevailing at the time for comparable transactions involving other nonaffiliated companies or, in the absence of comparable transactions, on terms and conditions, including credit standards, that in good faith would be offered to, or would apply to, nonaffiliated companies.
Unsafe and Unsound Practices
The OCC has authority under the Financial Institutions Advisory Act to prohibit national banks from engaging in any activity that, in the OCC’s opinion, constitutes an unsafe or unsound practice in conducting their businesses. The Federal Reserve Board has similar authority with respect to FNB United.
Capital Requirements
FNB United and the Bank are required to comply with federal regulations on capital adequacy. There are two measures of capital adequacy: a risk-based measure and a leverage measure. All capital standards must be satisfied for an institution to be considered in compliance. The risk-based capital standards are designed to make regulatory capital requirements more sensitive to differences in risk profile among banks and bank holding companies, to account for off-balance sheet exposure, and to minimize disincentives for holding liquid assets. Assets and off-balance sheet items are assigned to broad risk categories, each with appropriate weights. The resulting capital ratios represent capital as a percentage of total risk-weighted assets and off-balance sheet items. For additional information, see “Capital Adequacy” in “Management’s Discussion and Analysis of Financial Condition and Results of Operations” below.
Dividend Restrictions
FNB United is a legal entity separate and distinct from its bank and other subsidiaries. Because the principal source of FNB United’s revenues is dividends from the subsidiary bank, the ability of FNB United to pay dividends to its shareholders and to pay service on its own debt depends largely upon the amount of dividends its subsidiaries may
3
Table of Contents
pay to FNB United. There are statutory and regulatory limitations on the payment of dividends by the Bank to FNB United, as well as by FNB United to its shareholders.
The Bank must obtain the prior approval of the OCC to pay dividends if the total of all dividends declared by the Bank in any calendar year will exceed the sum of its net income for that year and its retained net income for the preceding two calendar years, less any transfers required by the OCC or to be made to retire any preferred stock. Currently, any dividend declaration by the Bank would require OCC approval. Federal law also prohibits the Bank from paying dividends that in the aggregate would be greater than its undivided profits after deducting statutory bad debts in excess of its loan loss allowance.
FNB United and the Bank are also subject to various general regulatory policies and requirements relating to the payment of dividends, including requirements to maintain adequate capital above regulatory minimums. If, in the opinion of the appropriate federal regulatory authority, a bank under its jurisdiction is engaged in or is about to be engaged in an unsafe or unsound practice, the authority may require that the bank cease and desist from such practice. The Federal Reserve Board, the OCC and the FDIC have indicated that paying dividends that deplete a bank’s capital base to an inadequate level would be an unsafe and unsound banking practice. Under the FDICIA, an insured bank may not pay any dividend if payment would cause it to become undercapitalized or if it already is undercapitalized. Further, the Federal Reserve Board, OCC and FDIC have each indicated that banking institutions should generally pay dividends only out of current operating earnings.
FDIC Insurance
The deposits of the Bank are insured by the Deposit Insurance Fund (DIF) of the FDIC up to the limits set forth under applicable law and are subject to the deposit insurance premium assessments of the DIF. The FDIC imposes a risk-based deposit premium assessment system, which was amended pursuant to the Federal Deposit Insurance Reform Act of 2005 (the “Reform Act”). Under this system, as amended, the assessment rates for an insured depository institution vary according to the level of risk incurred in its activities. To arrive at an assessment rate for a banking institution, the FDIC places it in one of four risk categories determined by reference to its capital levels and supervisory ratings. In addition, in the case of those institutions in the lowest risk category, the FDIC further determines its assessment rate based on certain specified financial ratios or, if applicable, its long-term debt ratings. The assessment rate schedule can change from time to time, at the discretion of the FDIC, subject to certain limits. Under the current system, premiums are assessed quarterly. The FDIC has published guidelines under the Reform Act on the adjustment of assessment rates for certain institutions. In addition, insured depository institutions have been required to pay a pro rata portion of the interest due on the obligations issued by the Financing Corporation (FICO) to fund the closing and disposal of failed thrift institutions by the Resolution Trust Corporation.
On November 12, 2009, the FDIC adopted a final rule imposing a 13-quarter prepayment of FDIC premiums to replenish the depleted insurance fund. This regulation required insured depository institutions to prepay their estimated quarterly regular risk-based assessments for the fourth quarter of 2009, through the fourth quarter of 2012 on December 30, 2009, at the same time that institutions pay their regular quarterly deposit insurance assessments for the third quarter of 2009. The estimated prepayment amount will be used to offset future FDIC premiums beginning on March 30, 2010, which represents payment of the regular insurance assessment for the 2009 fourth quarter.
On October 3, 2008 and pursuant to the Emergency Economic Stabilization Act of 2008, the maximum deposit insurance amount per depositor was increased from $100,000 to $250,000 until December 31, 2009. On May 20, 2009, the Helping Families Save Their Homes Act extended the temporary increase in the standard coverage limit to $250,000 through December 31, 2013. Additionally, on October 14, 2008, the FDIC established its Temporary Liquidity Guarantee Program to strengthen confidence and encourage liquidity in the banking system by providing a temporary guarantee of noninterest-bearing deposit transaction accounts, regardless of dollar amount (the “TAG Program”) and by guaranteeing newly issued senior unsecured debt (the “Debt Guarantee Program”). Under the TAG Program, the FDIC will fully guarantee until June 30, 2010, all noninterest-bearing transaction accounts, including NOW accounts with interest rates of 0.5 percent or less and IOLTAs (lawyer trust accounts). Coverage under the TAG Program is in addition to and separate from the coverage available under the FDIC’s general deposit insurance rules. As originally enacted, the TAG Program expired on December 31, 2009, and participating institutions were assessed at the annual rate of 10 basis points for transaction account balances in excess of $250,000. On October 1, 2009, the FDIC extended the TAG Program for six months until June 30, 2010. Any insured depository institution that was participating in the TAG Program as of October 1, 2009 was permitted to
4
Table of Contents
continue in the TAG Program during the extension period. The assessment rate that applies to participating institutions during the extension period is either 15 basis points, 20 basis points or 25 basis points, depending on the “Risk Category” assigned to the institution under the FDIC’s risk based premium system. Any institution participating in the TAG Program as of October 1, 2009 that desired to opt out of the TAG Program extension was required to do so on or before November 2, 2009. FNB United did not opt out of the TAG Program.
The Debt Guarantee Program guarantees certain senior unsecured debt of insured depository institutions or their qualified holding companies issued within certain specified time frames with a stated maturity greater than 30 days. The Company has not issued qualifying senior unsecured debt within the relevant time periods. On October 20, 2009, the FDIC established a limited six-month emergency guarantee facility upon expiration of the Debt Guarantee Program. Under the facility, participating entities can apply to the FDIC for permission to issue FDIC-guaranteed debt during the period starting on October 31, 2009 through April 30, 2010. FNB United has not elected to participate in this emergency guarantee facility.
Under the Federal Deposit Insurance Act, insurance of deposits may be terminated by the FDIC upon a finding that the institution has engaged in unsafe and unsound practices, is in an unsafe or unsound condition to continue operations or has violated any applicable law, regulation, rule, order or condition imposed by a bank’s federal regulatory agency.
Community Reinvestment Act
The Bank is subject to the provisions of the Community Reinvestment Act of 1977, as amended (CRA). Under the CRA, all financial institutions have a continuing and affirmative obligation consistent with their safe and sound operation to help meet the credit needs for their entire communities, including low- and moderate-income neighborhoods. The CRA does not establish specific lending requirements or programs for financial institutions, nor does it limit an institution’s discretion to develop the types of products and services that it believes are best suited to its particular community, consistent with the CRA.
The CRA requires the appropriate federal bank regulatory agency, in connection with its examination of the bank, to assess the bank’s record in meeting the credit needs of the community served by the bank, including low- and moderate-income neighborhoods. The regulatory agency’s assessment of the bank’s record is made available to the public. Should the Company fail to serve the community adequately, potential penalties are regulatory denials to expand branches, relocate, add subsidiaries and affiliates, expand into new financial activities and merge with or purchase other financial institutions.
Interstate Banking and Branching
The Riegle-Neal Interstate Banking and Branching Efficiency Act of 1994 (“Interstate Banking Act”) permits interstate acquisitions of banks by bank holding companies. FNB United and any other bank holding company located in North Carolina may acquire a bank located in any other state, and any bank holding company located outside North Carolina may lawfully acquire any North Carolina-based bank, regardless of state law to the contrary, in either case subject to certain deposit-percentage limitations, aging requirements and other restrictions. The Interstate Banking Act also generally provides that national and state-chartered banks may branch interstate through acquisitions of banks in other states. It allowed, however, any state to elect prior to June 1, 1997 either to “opt in” and accelerate the date after which interstate branching was permissible or to “opt out” and prohibit interstate branching altogether. North Carolina enacted “opt in” legislation permitting interstate branching. The Interstate Banking Act may have the effect of increasing competition within the markets in which FNB United operates.
Depositor Preference Statute
Under federal law, depositors and certain claims for administrative expenses and employee compensation against an insured depository institution would be afforded a priority over other general unsecured claims against such an institution, including federal funds and letters of credit, in the “liquidation or other resolution” of such an institution by any receiver.
Gramm-Leach-Bliley Act
The Gramm-Leach-Bliley Act allows bank holding companies to engage in a wider range of nonbanking activities, including greater authority to engage in the securities and insurance businesses. Under the Gramm-Leach-Bliley
5
Table of Contents
Act, a bank holding company that elects to become a financial holding company may engage in any activity that is financial in nature, is incidental to financial activity or complements financial activity and does not pose a substantial risk to the safety or soundness of depository institutions or the financial system generally. Activities cited by the law as being “financial in nature” include securities underwriting, dealing in securities and market making, insurance underwriting and agency, providing financial, investment or economic advisory services, and activities that the Federal Reserve Board has determined to be closely related to banking. FNB United has not elected to become a financial holding company.
Subject to certain limitations on investment, a national bank or its financial subsidiary may also engage in activities that are financial in nature, other than insurance underwriting, insurance company portfolio investment, real estate development and real estate investment, so long as the bank is well-capitalized, well-managed and has at least a satisfactory Community Reinvestment Act rating. Subsidiary banks of a financial holding company or national banks with financial subsidiaries must continue to be well-capitalized and well-managed to continue to engage in activities that are financial in nature. In addition, a financial holding company or a bank may not acquire a company that is engaged in activities that are financial in nature unless each of the subsidiary banks of the financial holding company or the bank has at least a satisfactory Community Reinvestment Act rating.
Privacy and Consumer Protection Laws
The Gramm-Leach-Bliley Act also modified other financial laws, including laws related to financial privacy. Under the act, federal banking regulators adopted rules limiting the ability of banks and other financial institutions to disclose nonpublic information about consumers to nonaffiliated third parties. The rules require disclosure of privacy policies to consumers and, in some circumstances, allow consumers to prevent disclosure of certain personal information to nonaffiliated third parties. The Fair Credit Reporting Act restricts information sharing among affiliates and was amended in December 2003 to restrict further affiliate sharing of information for marketing purposes.
In connection with their lending activities, the Bank and Dover are subject to a number of federal laws designed to protect borrowers. These laws include the Equal Credit Opportunity Act, the Trust in Lending Act, the Home Mortgage Disclosure Act, and the Real Estate Settlement Procedures Act.
International Money Laundering Abatement and Financial Anti-Terrorism Act of 2001
The USA Patriot Act of 2001 contains the International Money Laundering Abatement and Financial Anti-Terrorism Act of 2001 (the “IMLAFA”). The IMLAFA substantially broadens existing anti-money laundering legislation and the extraterritorial jurisdiction of the United States, imposes compliance and due diligence obligations, creates crimes and penalties, compels the production of documents located both inside and outside the United States, including those of foreign institutions that have a correspondent relationship in the United States, and clarifies the safe harbor from civil liability to customers. The U.S. Treasury Department has issued a number of regulations implementing the USA Patriot Act that apply certain of its requirements to financial institutions such as the Bank. The regulations impose obligations on financial institutions to maintain appropriate policies, procedures and controls to detect, prevent and report money laundering and terrorist financing and to verify the identity of their customers. The obligations of financial institutions under the USA Patriot Act have increased and may continue to increase. This increase has resulted in greater costs for the Bank, which may continue to rise and also may subject the Bank to greater liability.
Pursuant to the IMLAFA, the Company established anti-money laundering compliance and due diligence programs.
Sarbanes-Oxley Act of 2002
The Sarbanes-Oxley Act of 2002 addresses, among other issues, corporate governance, auditing and accounting, executive compensation and enhanced and timely disclosure of corporate information. The act is intended to allow shareholders to monitor more easily and efficiently the performance of public companies and their directors.
Emergency Economic Stabilization Act of 2008
In response to recent unprecedented market turmoil, the Emergency Economic Stabilization Act of 2008 (“EESA”) was enacted on October 3, 2008. EESA established the Troubled Asset Relief Program (“TARP”), which authorizes the Secretary of the Treasury to purchase or guarantee up to $700 billion in troubled assets from financial
6
Table of Contents
institutions. Pursuant to authority granted under EESA and as part of the TARP, the Secretary has created the Capital Purchase Program (“CPP”) under which the Treasury Department will invest up to $250 billion in senior preferred stock of U.S. banks and savings associations or their holding companies. Qualifying financial institutions may issue senior preferred stock with a value equal to not less than 1% of risk-weighted assets and not more than the lesser of $25 billion or 3% of risk-weighted assets.
Institutions participating in the TARP or CPP are required to issue warrants for common or preferred stock or senior debt to the Secretary. If an institution participates in the CPP or if the Secretary acquires a meaningful equity or debt position in the institution as a result of TARP participation, the institution is required to meet certain standards for executive compensation and corporate governance, including a prohibition against incentives to take unnecessary and excessive risks, recovery of bonuses paid to senior executives based on materially inaccurate earnings or other statements and prohibition against the payment of golden parachutes. Additional and modified standards with respect to executive compensation and corporate governance for institutions that have participated or will participate in the TARP (including the CPP) were enacted as part of the American Recovery and Reinvestment Act of 2009 (“ARRA”), described below.
CPP Participation
On February 13, 2009, FNB United entered into a Letter Agreement (the “Purchase Agreement”) with the Treasury Department under the CPP, pursuant to which FNB United agreed to issue 51,500 shares of its Fixed Rate Cumulative Perpetual Preferred Stock, Series A (the “Preferred Stock”), having a liquidation amount per share equal to $1,000, for a total price of $51.5 million. The Preferred Stock is to pay cumulative dividends at a rate of 5% per year for the first five years and thereafter at a rate of 9% per year. FNB United may not redeem the Preferred Stock during the first three years except with the proceeds from a “qualified equity offering” (as defined in FNB United’s articles of incorporation). However, under the ARRA, FNB United may redeem the Preferred Stock without a “qualified equity offering,” subject to the approval of its primary federal regulator. After three years, FNB United may, at its option, redeem the Preferred Stock at par value plus accrued and unpaid dividends. The Preferred Stock is generally non-voting, but does have the right to vote as a class on the issuance of any preferred stock ranking senior, any change in its terms or any merger, exchange or similar transaction that would adversely affect its rights. The holder(s) of Preferred Stock also have the right to elect two directors if dividends have not been paid for six periods.
As part of its purchase of the Preferred Stock, the Treasury Department received a warrant (the “Warrant”) to purchase 2,207,143 shares of FNB United’s common stock at an initial per share exercise price of $3.50. The Warrant provides for the adjustment of the exercise price and the number of shares of FNB United’s common stock issuable upon exercise pursuant to customary anti-dilution provisions, such as upon stock splits or distributions of securities or other assets to holders of FNB United’s common stock, and upon certain issuances of FNB United’s common stock at or below a specified price relative to the initial exercise price. The Warrant expires ten years from the issuance date. Pursuant to the Purchase Agreement, the Treasury Department has agreed not to exercise voting power with respect to any shares of common stock issued upon exercise of the Warrant. Under the ARRA, the Warrant would be liquidated upon the redemption by FNB United of the Preferred Stock.
Both the Preferred Stock and the Warrant will be accounted for as components of Tier 1 capital.
Prior to February 13, 2012, unless FNB United has redeemed the Preferred Stock or the Treasury Department has transferred the Preferred Stock to a third party, the consent of the Treasury Department will be required for FNB United to (1) declare or pay any dividend or make any distribution on its common stock (other than regular quarterly cash dividends of not more than $0.10 per share of common stock) or (2) redeem, purchase or acquire any shares of its common stock or other equity or capital securities, other than in connection with benefit plans consistent with past practice and certain other circumstances specified in the Purchase Agreement.
American Recovery and Reinvestment Act of 2009
The ARRA was enacted on February 17, 2009. The ARRA includes a wide variety of programs intended to stimulate the economy and provide for extensive infrastructure, energy, health, and education needs. In addition, the ARRA amends the EESA and imposes certain new executive compensation and corporate governance obligations on all current and future TARP recipients, including FNB United, until the institution has redeemed the preferred stock, which TARP recipients are now permitted to do under the ARRA without regard to the three-year holding period and without the need to raise new capital, subject to approval of its primary federal regulator. The executive
7
Table of Contents
compensation restrictions under the ARRA (described below) are more stringent than those currently in effect under the CPP, but it is yet unclear how these executive compensation standards will relate to the similar standards recently announced by the Treasury Department, or whether the standards will be considered effective immediately or only after implementing regulations are issued by the Treasury Department.
The ARRA amends Section 111 of the EESA to require the Secretary to adopt additional standards with respect to executive compensation and corporate governance for TARP recipients (including FNB United). The standards required to be established by the Secretary include, in part, (1) prohibitions on making golden parachute payments to senior executive officers and the next five most highly compensated employees during such time as any obligation arising from financial assistance provided under the TARP remains outstanding (the “Restricted Period”), (2) prohibitions on paying or accruing bonuses or other incentive awards for certain senior executive officers and employees, except for awards of long-term restricted stock with a value equal to no greater than one-third of the subject employee’s annual compensation that do not fully vest during the Restricted Period or unless such compensation is pursuant to a valid written employment contract prior to February 11, 2009, (3) requirements that TARP CPP participants provide for the recovery of any bonus or incentive compensation paid to senior executive officers and the next 20 most highly-compensated employees based on statements of earnings, revenues, gains or other criteria later found to be materially inaccurate, with the Secretary having authority to negotiate for reimbursement, and (4) a review by the Secretary of all bonuses and other compensation paid by TARP participants to senior executive employees and the next 20 most highly-compensated employees before the date of enactment of the ARRA to determine whether such payments were inconsistent with the purposes of the Act.
The ARRA also sets forth additional corporate governance obligations for TARP recipients, including requirements for the Secretary to establish standards that provide for semi-annual meetings of compensation committees of the board of directors to discuss and evaluate employee compensation plans in light of an assessment of any risk posed from such compensation plans. TARP recipients are further required by the ARRA to have in place company-wide policies regarding excessive or luxury expenditures and to include non-binding shareholder “say-on-pay” proposals in proxy materials. The chief executive officer and chief financial officer are required to provide written certifications with respect to compliance. The Secretary promulgated regulations to implement the executive compensation and certain corporate governance provisions detailed in the ARRA, which became effective June 15, 2009.
Future Legislation
Changes to the laws and regulations in the United States and North Carolina can affect the Company’s operating environment in substantial and unpredictable ways. FNB United cannot predict whether those changes in laws and regulations will occur, and, if those changes occur, the ultimate effect they would have upon the financial condition or results of operations of the Company. The nature and extent of future legislative, regulatory or other changes affecting financial institutions is highly unpredictable at this time. Due to the current economic environment and issues facing the financial services industry in particular, new legislative and regulatory initiatives may be anticipated over the next several years, including those focused specifically on banking and mortgage lending.
Employees
As of December 31, 2009, FNB United had four officers, all of whom were also officers of the Bank. On that same date, the Bank had 444 full-time employees and 41 part-time employees and Dover had 67 full-time employees and two part-time employees. The Bank and Dover each considers its relationship with its employees to be excellent. The Company provides employee benefit programs, including a matching retirement/savings (“401(k)”) plan, group life, health and dental insurance, paid vacations and sick leave.
The Company’s employee benefit programs formerly included a noncontributory defined benefit pension plan and healthcare and life insurance benefits for retired employees. In September 2006, the Board of Directors of FNB United approved a modified freeze to the pension plan. Effective December 31, 2006, no new employees were eligible to enter the plan. Participants who were at least age 40, had earned 10 years of vesting service as an employee of FNB United and remain an active employee as of December 31, 2006 qualified for continued benefits under a grandfathering provision. Under that provision, the grandfathered participant will continue to accrue benefits under the plan through December 31, 2011. Additionally, the plan’s definition of final average compensation was changed from a 10-year averaging period to a 5-year averaging period as of January 1, 2007. All other eligible participants in the plan had their retirement benefit frozen as of December 31, 2006. Effective January 1, 2007, the 401(k) plan became the primary retirement benefit plan.
8
Table of Contents
In conjunction with the modified freeze of the pension plan, the postretirement medical and life insurance plan was also amended. Effective December 31, 2006, no new employees were eligible to enter the plan. Participants who were at least age 40, had earned 10 years of vesting service as an employee of the Company and remained an active employee as of December 31, 2006 qualified under a grandfathering provision. Under the grandfathering provision, the participant will continue to accrue benefits under the plan through December 31, 2011.
Available Information
The Company makes its annual report on Form 10-K, quarterly reports on Form 10-Q, and current reports on Form 8-K, and amendments to those reports, available free of charge on its internet website at www.MyYesBank.com, as soon as reasonably practicable after the reports are electronically filed or furnished with the Securities and Exchange Commission. Any materials that the Company files with the SEC may be read or copied or both at the SEC’s Public Reference Room at 100 F Street, NE, Washington, DC 20549. Information on the operation of the Public Reference Room may be obtained by calling the SEC at 1-800-SEC-0330. These filings are also accessible on the SEC’s website at www.sec.gov. FNB United will provide without charge a copy of its annual report on Form 10-K to any shareholder by mail. Requests should be sent to FNB United Corp., Attention: Secretary, 150 South Fayetteville Street (27203), P.O. Box 1328, Asheboro, North Carolina 27204.
Additionally, the Company’s corporate governance policies, including the charters of the Audit, Compensation, and Corporate Governance and Nominating Committees; and the Company’s Code of Business Ethics may also be found through the “Investor Relations” link on the Company’s website.
| Item 1A. | RISK FACTORS |
The Company is subject to certain risks and an investment in the Company’s securities may involve risks due to the nature of the Company’s business and activities related to that business. In addition to the factors discussed below, please see the discussion under “Item 7A. Quantitative and Qualitative Disclosure about Market Risk.” These factors, along with the other information in this Annual Report on Form 10-K, should be considered in evaluating forward-looking statements, and undue reliance should not be placed on such statements.
FNB United Is Vulnerable to the Economic Conditions within the Relatively Small Region in Which It Operates
FNB United’s overall success is dependent on the general economic conditions within its market area, which extends from the central and southern Piedmont and Sandhills of North Carolina to the foothills and mountains of western North Carolina. An economic downturn in this fairly small geographic region that negatively affects FNB United’s customers could adversely affect FNB United. For example, an increase in unemployment, a decrease in real estate values or increases in interest rates, as well as other factors, could weaken the economy of the region and depress the Company’s earnings and financial condition.
Overall, during 2009, the North Carolina business environment has been adverse for many households and businesses and continues to deteriorate. It is expected that the business environment will continue to deteriorate for the foreseeable future. There can be no assurance that these conditions will improve in the near term. Such conditions could adversely affect the credit quality of the Company’s loans, the value of collateral securing loans to borrowers, the value of the Company’s investment securities and its overall results of operation and financial condition.
Weaknesses in the Markets for Residential or Commercial Real Estate Could Reduce FNB United’s Net Income and Profitability
Real estate lending (including commercial, construction, land development, and residential) is a large portion of the Bank’s loan portfolio. These categories constitute $1.3 billion, or approximately 85%, of the Bank’s total loan portfolio. These categories are generally affected by changes in economic conditions, fluctuations in interest rates and the availability of loans to potential purchasers, changes in tax and other laws and acts of nature. A downturn in the real estate markets in which the Company originates, purchases, and services mortgage and other loans could hurt its business because these loans are secured by real estate. The softening of the real estate market through 2009 has adversely affected the Company’s net income. If there are further declines in the market, they will adversely affect the Company’s future earnings.
9
Table of Contents
FNB United Faces Significant Operational Risk
FNB United is exposed to many types of operational risk, including reputational risk, legal and compliance risk. Operational risk includes the risk of fraud or theft by employees or persons outside FNB United, unauthorized transactions by employees or operational errors, including clerical or recordkeeping errors or those resulting from faulty or disabled computer or telecommunications systems, and breaches of the internal control system and compliance requirements. Negative public opinion can result from FNB United’s actual or alleged conduct in a variety of areas, including lending practices, corporate governance and acquisitions and from actions taken by government regulators and community organizations in response to those activities. Negative public opinion can adversely affect FNB United’s ability to attract and retain customers and can expose it to litigation and regulatory action. Operational risk also includes potential legal actions that could arise from an operational deficiency or a as a result of noncompliance with applicable regulatory standards.
Because the nature of the banking business involves a high volume of transactions, certain errors may be repeated or compounded before they are found and corrected. FNB United’s necessary reliance upon automated systems to record and process its transactions may further increase the risk that technical flaws or employee tampering or manipulation of those systems will result in losses that are difficult to detect. FNB United may also be subject to disruptions of its operating systems arising from events that are wholly or partially beyond its control (e.g., computer viruses or electrical or telecommunications outages), which may give rise to disruption of service to customers and to financial loss or liability. The Company is further exposed to the risk that its external vendors may be unable to fulfill their contractual obligations (or will be subject to the same risk of fraud or operational errors by their employees as is FNB United) and to the risk that the Company’s (or its vendors’) business continuity and data security systems prove to be inadequate.
FNB United’s Decisions Regarding Credit Risk Could Be Inaccurate and Its Allowance for Loan Losses May Be Inadequate, Which May Adversely Affect FNB United’s Financial Condition and Results of Operations
Borrowers may not repay their loans according to the terms of those loans, and the collateral securing the payment of the loans may not be sufficient to assure repayment. The Company may experience significant loan losses, which could have a material adverse effect on FNB United’s operating results. Management makes various assumptions and judgments about the collectability of the loan portfolio, including the creditworthiness of the borrowers and the value of the real estate, which is obtained from independent appraisers, and other assets serving as collateral for the repayment of the loans. FNB United maintains an allowance for loan losses that it considers adequate to absorb losses inherent in the loan portfolio based on its assessment of all available information. In determining the size of the allowance, FNB United relies on an analysis of the loan portfolio based on, among other things, historical loss experience, volume and types of loans, trends in classification, volume and trends in delinquencies and nonaccruals, and general economic conditions, both local and national. If management’s assumptions are wrong, the loan loss allowance may not sufficient to cover loan losses, and adjustments may be necessary to allow for different economic conditions or adverse developments in the loan portfolio. Material additions to the allowance would materially decrease FNB United’s net income. Banking regulators periodically review the Company’s allowance for loan losses and may require FNB United to increase the allowance or recognize further loan charge-offs based on judgments different from those of management. Any increase in the allowance for loan losses or loan charge-offs required by regulatory authorities could have a negative effect on FNB United’s operating results.
A Decline in FNB United’s Capital Position, and the Unavailability of Additional Regulatory Capital, Could Adversely Its Financial Condition and Operations.
At December 31, 2009, FNB United and the Bank were classified as “well capitalized.” If the Company’s capital levels were to decline to below “well capitalized,” FNB United would not be able to renew or accept brokered deposits without prior regulatory approval and would be required to pay higher insurance premiums to the FDIC, which would reduce earnings. Maintaining sufficient capital to remain well capitalized may require raising additional capital through the sale of equity securities, including common or preferred stock, or reducing the amount of the Bank’s assets.
FNB United’s ability to maintain capital levels, sources of funding and liquidity could be adversely affected by changes in the capital markets in which the Company operates. Loan loss provisions of $15.5 million in the fourth quarter of 2008 and $61.2 million during 2009 contributed to the decrease in total capital to risk-adjusted assets at both FNB United and the Bank. FNB United’s ability to raise additional capital will depend on conditions in the capital markets, which are outside the Company’s control, and on FNB United’s financial performance and its
10
Table of Contents
ability to obtain resolution of nonperforming assets. Failure to meet capital guidelines could subject FNB United or the Bank to a variety of enforcement remedies, including issuance of a capital directive and other restrictions on the Company’s business.
FNB United Is Expected to Enter into a Formal Enforcement Action with Regulatory Authorities, and Such Action May Place Significant Restrictions on FNB United’s Operations.
Under applicable laws, the Federal Reserve Board, as primary regulator of the FNB United, the Comptroller of the Currency (“OCC”), as the regulator of CommunityONE Bank, and the FDIC, as deposit insurer, have the ability to impose substantial sanctions, restrictions and requirements on the Company if they determine, upon examination or otherwise, that the Company has weaknesses or failures with respect to general standards of safety and soundness or is in violation of applicable laws. Applicable law prohibits disclosure of specific examination findings by the Company although formal enforcement actions are routinely disclosed by the regulatory authorities. FNB United expects the issuance of a formal enforcement action due primarily to the high level of nonperforming assets of CommunityONE Bank and the resulting impact on the Company’s financial condition. These actions generally require certain corrective steps, impose limits on activities (such as lending, deposit taking, acquisitions or branching), prescribe lending parameters (such as loan types, volumes and terms), restrict interest rates paid on deposits, and require improved capital ratios or additional capital to be raised. In many cases, policies must be revised by the financial institution and submitted to the regulatory authority for approval within time frames imposed by the regulatory authorities. Failure to meet the requirements of the actions, once issued, can result in more severe penalties. Generally, these enforcement actions can be lifted only after subsequent examinations demonstrate complete remediation of the underlying issues. At this time, FNB United does not know what specific actions will be required of it by the OCC.
Increases in FDIC Insurance Premiums May Adversely Affect FNB United’s Net Income and Profitability.
During 2008 and continuing in 2009, higher levels of bank failures have dramatically increased resolution costs of the FDIC and depleted the deposit insurance fund. In addition, the FDIC instituted two temporary programs to further insure customer deposits at FDIC insured banks: deposit accounts are now insured up to $250,000 per customer (up from $100,000) and noninterest-bearing transactional accounts are currently fully insured (unlimited coverage). These programs have placed additional stress on the deposit insurance fund. To maintain a strong funding position and restore reserve ratios of the deposit insurance fund, the FDIC has increased assessment rates of insured institutions. In addition, on November 12, 2009, the FDIC adopted a rule requiring banks to prepay three years worth of estimated deposit insurance premiums by December 31, 2009. FNB United is generally unable to control the amount of premiums that the Company is required to pay for FDIC insurance. If there are additional bank or financial institution failures, or the cost of resolving prior failures exceeds expectations, the Company may be required to pay even higher FDIC premiums than the recently increased levels. These announced increases and any future increases or required prepayments of FDIC insurance premiums may adversely affect FNB United’s earnings and financial condition.
FNB United’s Liquidity Could Be Impaired by an Inability to Access the Capital Markets or an Unforeseen Outflow of Cash.
Liquidity is essential to FNB United’s businesses and FNB United has a significant base of core deposits. Due to circumstances that FNB United may be unable to control, however, such as a general market disruption or an operational problem that affects third parties or FNB United, the Company’s liquidity could be impaired by an inability to access the capital markets or an unforeseen outflow of cash. A reduction in FNB United’s credit ratings could adversely affect its liquidity and competitive position, increase its borrowing costs, limit its access to the capital markets or trigger unfavorable contractual obligations.
The Capital and Credit Markets Have Experienced Unprecedented Levels of Volatility.
During the economic downturn, the capital and credit markets experienced extended volatility and disruption. In some cases, the markets produced downward pressure on stock prices and credit capacity for certain issuers without regard to those issuers’ underlying financial strength. If these levels of market disruption and volatility continue, worsen or abate and then arise at a later date, the Company’s ability to access capital could be materially impaired. FNB United’s inability to access the capital markets could constrain the Company’s ability to make new loans, to meet the Company’s existing lending commitments and, ultimately jeopardize the Company’s overall liquidity and capitalization.
11
Table of Contents
FNB United Faces Systems Failure Risks as Well as Security Risks, Including “Hacking” and “Identity Theft”
The computer systems and network infrastructure used by FNB United and others could be vulnerable to unforeseen problems. These problems may arise in the Company’s internally developed systems or the systems of its third-party vendors or both. The Company’s operations are dependent upon its ability to protect computer equipment against damage from fire, power loss, or telecommunications failure. Any damage or failure that causes an interruption in the Company’s operations could adversely affect FNB United’s business and financial results. In addition, the Company’s computer systems and network infrastructure present security risks, and could be susceptible to hacking or identity theft.
FNB United May Experience Significant Competition in its Market Area, Which May Adversely Affect its Business
The commercial banking industry within FNB United’s market area is extremely competitive. In addition, FNB United competes with other providers of financial services, such as savings and loan associations, credit unions, insurance companies, consumer finance companies, brokerage firms, the mutual funds industry, and commercial finance and leasing companies, some of which are subject to less extensive regulations than is the Company with respect to the products and services they provide. Some of FNB United’s larger competitors include several large interstate financial holding companies that are among the largest in the nation and are headquartered in North Carolina. These companies have a significant presence in FNB United’s market area, have greater resources than FNB United, may have higher lending limits and may offer products and services not offered by FNB United. These institutions may be able to offer the same products and services at more competitive rates and prices.
FNB United also experiences competition from a variety of institutions outside of the Company’s market area. Some of these institutions conduct business primarily over the Internet and may thus be able to realize certain cost savings and offer products and services at more favorable rates and with greater convenience to the customer who can pay bills and transfer funds directly without going through a bank. This “disintermediation” could result in the loss of fee income, as well as the loss of customer deposits and income generated from those deposits. In addition, changes in consumer spending and saving habits could adversely affect FNB United’s operations, and the Company may be unable to timely develop competitive new products and services in response to these changes.
Changes in Interest Rates May Have an Adverse Effect on FNB United’s Profitability
FNB United’s earnings and financial condition are dependent to a large degree upon net interest income, which is the difference between interest earned from loans and investments and interest paid on deposits and borrowings. The narrowing of the margin between interest rates earned on loans and investments and the interest rates paid on deposits and borrowings could adversely affect FNB United’s earnings and financial condition. FNB United can neither predict with certainty nor control changes in interest rates. These changes can occur at any time and are affected by many factors, including national, regional and local economic conditions and monetary policies of the Federal Reserve Board. FNB United has ongoing policies and procedures designed to manage the risks associated with changes in market interest rates. Notwithstanding these policies and procedures, changes in interest rates may have an adverse effect on FNB United’s profitability. For example, high interest rates could adversely affect FNB United’s mortgage banking business because higher interest rates could cause customers to apply for fewer mortgages or mortgage refinancings, although an increase in interest rates would generally create additional interest income from the repricing of variable rate loans contained in FNB United’s loan portfolio.
FNB United’s Ability to Pay Dividends Is Limited and the Payment of Any Dividend Has Been Suspended, Leaving Appreciation in the Value of the Company’s Common Stock as the Sole Opportunity for Returns on Investments Made in FNB United Common Stock.
The holders of FNB common stock are entitled to receive dividends when and if declared by the board of directors out of funds legally available for the payment of dividends. Because the principal source of FNB United’s revenues is dividends from CommunityONE Bank, the ability of FNB United to pay dividends to its shareholders is dependent upon the amount of dividends the Bank may pay to FNB United. There are statutory and regulatory limitations on the payment of dividends by the Bank to FNB United, as well as by FNB United to its shareholders.
The Bank must obtain the prior approval of the OCC to pay dividends if the total of all dividends declared by the Bank in any calendar year will exceed the sum of its net income for that year and its retained net income for the preceding calendar years, less certain transfers. Currently, any dividend declaration by the Bank would require OCC
12
Table of Contents
approval. In October 2009, FNB United announced the decision of its board of directors to suspend quarterly cash dividends to preserve the Bank’s retained capital.
The Treasury Department’s Investment in FNB United Imposes Restrictions and Obligations Limiting FNB United’s Ability to Increase Dividends, Repurchase Common Stock or Preferred Stock and Access the Equity Capital Markets
In February 2009, FNB United issued preferred stock and a warrant to purchase common stock to the Treasury Department under the CPP. Prior to February 13, 2012, unless FNB United has redeemed all of the preferred stock, or the Treasury Department has transferred all of the preferred stock to a third party, the consent of the Treasury Department will be required for FNB United to, among other things, increase quarterly common stock dividends beyond $0.10 per share or effect repurchases of common stock or other equity or capital securities (with certain exceptions, including the repurchase of FNB United Corp. common stock to offset share dilution from equity-based employee compensation awards). FNB United’s ability to declare or pay dividends or repurchase its common stock or other equity or capital securities is also subject to restrictions in the event that FNB United fails to declare and pay full dividends (or declare and set aside a sum sufficient for payment thereof) on the preferred stock held by the Treasury Department.
FNB United’s Stock Price Can Be Volatile.
FNB United’s stock price can fluctuate widely in response to a variety of factors including actual or anticipated variations in quarterly operating results, recommendations by securities analysts, operating and stock price performance of other companies that investors deem comparable to FNB United, news reports relating to trends, concerns and other issues in the financial services industry, changes in government regulations, and geopolitical conditions such as acts or threats of terrorism or military conflicts.
FNB United’s Business Could Suffer If It Fails to Attract and Retain Skilled People
FNB United’s success depends, in large part, on its ability to attract and retain competent, experienced people. As a result of FNB United’s participation in the CPP, the Company is required to meet certain standards for executive compensation as set forth under the EESA, and related regulations. The imposition of compensation limits resulting from the Treasury Department’s investment in FNB United, in addition to other competitive pressures, may have an adverse effect on the ability of FNB United to attract and retain skilled personnel, resulting in FNB United’s not being able to hire or retain the best people.
Changes in Laws and Regulations and the Regulatory Environment Could Have a Material Adverse Effect on FNB United
FNB United is extensively regulated under federal and state banking laws and regulations that are intended primarily for the protection of depositors, federal deposit insurance funds and the banking system as a whole. In addition, the Company is subject to changes in federal and state laws as well as changes in banking and credit regulations, and governmental economic and monetary policies. FNB United cannot predict whether any of these changes may adversely and materially affect the Company. The current regulatory environment for financial institutions entails significant potential increases in compliance requirements and associated costs, including those related to consumer credit, with a focus on mortgage lending. Federal and state banking regulators possess broad powers to take supervisory actions as they deem appropriate. These actions may result in higher capital requirements, higher insurance premiums and limitations on FNB United’s activities that could have a material adverse effect on the Company’s business and profitability.
In addition, there have been numerous recent actions undertaken by the Treasury Department, Federal Reserve Board, Congress, the FDIC, the Securities and Exchange Commission and others in efforts to address the current liquidity and credit crisis in the financial industry. Among other things, these measures include homeowner relief that encourages loan restructuring and modification; the establishment of significant liquidity and credit facilities for financial institutions and investment banks; the lowering of the federal funds rate; emergency action against short selling practices; a temporary guaranty program for money market funds; the establishment of a commercial paper funding facility to provide back-stop liquidity to commercial paper issuers; and coordinated international efforts to address illiquidity and other weaknesses in the banking sector. The purpose of these legislative and regulatory actions is to help stabilize the U.S. banking system. However, any current or future legislative initiatives may not have their desired effect and could materially and adversely affect FNB United’s financial condition, results of operation, liquidity, or stock price.
13
Table of Contents
Differences in Interpretation of Tax Laws and Regulations May Adversely Affect FNB United’s Financial Statements.
Local, state or federal tax authorities may interpret tax laws and regulations differently than FNB United and challenge tax positions that FNB United has taken on its tax returns. This may result in the disallowance of deductions or credits, differences in the timing of deductions and the payment of additional taxes, interest or penalties that could have a material adverse effect on FNB United’s performance.
Significant Litigation Could Have a Material Adverse Effect on FNB United.
FNB United faces legal risks in its business, and the volume of claims and amount of damages and penalties claimed in litigation and regulatory proceedings against financial institutions remain high. Substantial legal liability or significant regulatory action against FNB United may have material adverse financial effects or cause significant reputational harm to FNB United, which in turn could seriously harm FNB United’s business prospects.
Maintaining or Increasing FNB United’s Market Share May Depend on Lowering Prices and Market Acceptance of New Products and Services.
FNB United’s success depends, in part, on its ability to adapt its products and services to evolving industry standards. There is increasing pressure to provide products and services at lower prices. Lower prices can reduce FNB United’s net interest margin and revenues from its fee-based products and services. In addition, the widespread adoption of new technologies, including internet services, could require the Company to make substantial expenditures to modify or adapt its existing products and services. Also, these and other capital investments in FNB United’s business may not produce expected growth in earnings anticipated at the time of the expenditure. The Company may not be successful in introducing new products and services, achieving market acceptance of its products and services, or developing and maintaining loyal customers.
Market Developments May Adversely Affect FNB United’s Industry, Business and Results of Operations.
Significant declines in the housing market, with falling home prices and increasing foreclosures and unemployment, have resulted in significant write-downs of asset values by many financial institutions, including government-sponsored entities and major commercial and investment banks. These write-downs, initially of mortgage-backed securities but spreading to credit default swaps and other derivative securities, caused many financial institutions to seek additional capital, to merge with larger and stronger institutions and, in some cases, to fail. During this time FNB United has experienced significant challenges, its credit quality has deteriorated and its net income and results of operations have been adversely affected. Reflecting concern about the stability of the financial markets generally and the strength of counterparties, many lenders and institutional investors have reduced, and in some cases, ceased to provide funding to borrowers including other financial institutions. FNB United is part of the financial system and a systemic lack of available credit, a lack of confidence in the financial sector, increased volatility in the financial markets and/or reduced business activity could materially adversely affect the Company’s business, financial condition and results of operations.
The Soundness of Other Financial Institutions Could Adversely Affect FNB United.
Financial services institutions are interrelated as a result of trading, clearing, counterparty, or other relationships. FNB United has exposure to many different industries and counterparties, and FNB United routinely executes transactions with counterparties in the financial services industry, including brokers and dealers, commercial banks, investment banks, mutual and hedge funds, and other institutional clients. Many of these transactions expose the Company to credit risk in the event of default of its counterparty or client. In addition, the Company’s credit risk may be exacerbated when collateral is liquidated at prices not sufficient to recover the full amount of the loan or derivative exposure due FNB United. These types of losses could materially and adversely affect the Company’s results of operations or financial condition.
FNB United’s Reported Financial Results Depend on Management’s Selection of Accounting Methods and Certain Assumptions and Estimates.
FNB United’s accounting policies and methods are fundamental to the methods by which the Company records and reports its financial condition and results of operations. The Company’s management must exercise judgment in selecting and applying many of these accounting policies and methods so they comply with generally accepted
14
Table of Contents
accounting principles and reflect management’s judgment of the most appropriate manner to report FNB United’s financial condition and results. In some cases, management must select the accounting policy or method to apply from two or more alternatives, any of which may be reasonable under the circumstances, yet may result in the Company reporting materially different results than would have been reported under a different alternative.
Certain accounting policies are critical to presenting FNB United’s financial condition and results. They require management to make difficult, subjective or complex judgments about matters that are uncertain. Materially different amounts could be reported under different conditions or using different assumptions or estimates. These critical accounting policies include: the allowance for credit losses; the determination of fair value for financial instruments; the valuation of goodwill and other intangible assets; the accounting for pension and postretirement benefits and the accounting for income taxes. Because of the uncertainty of estimates involved in these matters, the Company may be required to do one or more of the following: significantly increase the allowance for credit losses or sustain credit losses that are significantly higher than the reserve provided or both; recognize significant impairment on its financial instruments and other intangible asset balances; or significantly increase its liabilities for taxes or pension and post retirement benefits.
Changes in Accounting Standards Could Materially Affect FNB United’s Financial Statements.
From time to time accounting standards setters change the financial accounting and reporting standards that govern the preparation of FNB United’s financial statements. These changes can be hard to predict and can materially affect how the Company records and reports its financial condition and results of operations. In some cases, the Company could be required to apply a new or revised standard retroactively, resulting in changes to previously reported financial results, or a cumulative charge to retained earnings.
FNB United Relies on Other Companies to Provide Key Components of Its Business Infrastructure.
Third party vendors provide key components of FNB United’s business infrastructure such as internet connections and network access. While FNB United has selected these third party vendors carefully, it does not control their actions. Any problems caused by these third parties, including those which result from their failure to provide services for any reason or their poor performance of services, could adversely affect FNB United’s ability to deliver products and services to its customers and otherwise to conduct its business. Replacing these third party vendors could also entail significant delay and expense.
There Is a Limited Market for FNB United Common Stock
Although FNB United common stock is traded on the NASDAQ Global Select Market, the volume of trading has historically been limited, averaging 16,000 shares per day. Therefore, there can be no assurance that a holder of FNB United common stock who wishes to sell his or her shares would be able to do so immediately or at an acceptable price.
Certain Provisions of FNB United’s Articles of Incorporation and Bylaws May Discourage Takeovers
FNB United’s articles of incorporation and bylaws contain certain anti-takeover provisions that may discourage or may make more difficult or expensive a tender offer, change in control or takeover attempt that is opposed by FNB United’s board of directors. In particular, FNB United’s articles of incorporation and bylaws:
| • | classify its board of directors into three classes, so that shareholders elect only one-third of its board of directors each year. |
| • | permit FNB United’s board of directors to issue, without shareholder approval unless otherwise required by law, voting preferred stock with such terms as the board may determine, and |
| • | require the affirmative vote of the holders of at least 75% of FNB United’s voting shares to approve major corporate transactions unless the transaction is approved by three-fourths of FNB United’s “disinterested” directors. |
These provisions of FNB United’s articles of incorporation and bylaws could discourage potential acquisition proposals and could delay or prevent a change in control, even though a majority of FNB United’s shareholders may consider such proposal desirable. Such provisions could also make it more difficult for third parties to remove and replace the members of FNB United’s board of directors. They may also inhibit increases in the trading price of FNB United’s common stock that could result from takeover attempts.
15
Table of Contents
Acts or Threats of Terrorism and Political or Military Actions Taken by the United States or Other Governments Could Adversely Affect General Economic or Industry Conditions.
Geopolitical conditions may affect FNB United’s earnings. Acts or threats of terrorism and political or military actions taken by the United States or other governments in response to terrorism, or similar activity, could adversely affect general economic or industry conditions.
Unpredictable Catastrophic Events Could Have a Material Adverse Effect on FNB United.
The occurrence of catastrophic events such as hurricanes, tropical storms, earthquakes, pandemic disease, windstorms, floods, severe winter weather (including snow, freezing water, ice storms and blizzards), fires and other catastrophes could adversely affect FNB United’s consolidated financial condition or results of operations. Unpredictable natural and other disasters could have an adverse effect on the Company in that such events could materially disrupt its operations or the ability or willingness of its customers to access the financial services offered by FNB United. The Company’s property and casualty insurance operations also expose it to claims arising out of catastrophes. The incidence and severity of catastrophes are inherently unpredictable. Although the Company carries insurance to mitigate its exposure to certain catastrophic events, these events could nevertheless reduce FNB United’s earnings and cause volatility in its financial results for any fiscal quarter or year and have a material adverse effect on FNB United’s financial condition or results of operations or both.
Other Risks
There are risks and uncertainties relating to an investment in FNB United common stock or to economic conditions and regulatory matters generally that should affect other financial institutions in similar ways. These aspects are discussed under “Cautionary Statement Regarding Forward-Looking Statements” and “Regulation and Supervision” elsewhere in this Annual Report on Form 10-K.
| Item 1B. | UNRESOLVED STAFF COMMENTS |
None
| Item 2. | PROPERTIES |
The principal executive and administrative offices of FNB United and the Bank are located in an office building at 150 South Fayetteville Street, Asheboro, North Carolina. The Bank also has six other facilities in Asheboro containing three community banking operations and various administrative and operational functions. The Bank has other community banking offices in Archdale, Belmont, Biscoe, Boone, Burlington, China Grove, Cornelius, Dallas, Ellerbe, Gastonia, Graham, Greensboro (two offices), Hickory (three offices), Hillsborough, Jamestown, Kannapolis, Laurinburg, Millers Creek, Mooresville, Mt. Holly, Newton, Pinehurst, Ramseur, Randleman, Rockingham (two offices), Salisbury (two offices), Seagrove, Siler City, Seven Lakes, Southern Pines, Stanley, Statesville, Taylorsville, Trinity, West Jefferson, and Wilkesboro (two offices), North Carolina. Ten of the community banking offices are leased facilities, and four such offices are situated on land that is leased. Two of the facilities housing operational functions in Asheboro are leased.
Dover operates out of a leased office located in Charlotte, North Carolina.
| Item 3. | LEGAL PROCEEDINGS |
In the ordinary course of operations, the Company and the Bank are party to various legal proceedings. Neither the Company nor the Bank is involved in, nor have they terminated during the fourth quarter of 2009, any pending legal proceedings other than routine, nonmaterial proceedings occurring in the ordinary course of business.
| Item 4. | RESERVED |
16
Table of Contents
PART II
| Item 5. | MARKET FOR REGISTRANT’S COMMON EQUITY, RELATED SHAREHOLDER MATTERS AND ISSUER PURCHASES OF EQUITY SECURITIES |
Market Prices and Dividend Policies
FNB United’s common stock is traded on The NASDAQ Global Select Market under the symbol “FNBN.” The following table shows the high and low sale prices of FNB United common stock on The NASDAQ Global Select Market, based on published financial sources, for each of the last two fiscal years. The table also reflects the per share amount of cash dividends paid for each share during the fiscal quarter for each of the last two fiscal years. Only one cash dividend was paid during each of the fiscal quarters listed.
| Dividends Declared | ||||||
| Calendar Period | High | Low | ||||
| Quarter ended March 31, 2008 |
$ 12.50 | $ 10.50 | $ 0.15 | |||
| Quarter ended June 30, 2008 |
11.54 | 7.70 | 0.10 | |||
| Quarter ended September 30, 2008 |
8.74 | 6.35 | 0.10 | |||
| Quarter ended December 31, 2008 |
7.49 | 2.55 | 0.10 | |||
| Quarter ended March 31, 2009 |
$ 4.50 | $ 1.61 | $ 0.025 | |||
| Quarter ended June 30, 2009 |
3.39 | 1.85 | 0.025 | |||
| Quarter ended September 30, 2009 |
2.88 | 1.77 | - | |||
| Quarter ended December 31, 2009 |
2.65 | 1.10 | - | |||
As February 22, 2010, there were approximately 6,719 beneficial holders of FNB United’s common stock. For a discussion as to any restrictions on or the ability of FNB United or the Bank to pay dividends, see Item 1 - Regulation and Supervision. See also Note 13 - Regulatory Matters in the notes to the financial statements set forth in Item 8.
Recent Sales of Unregistered Securities
Except for the issuance and sale to the Treasury Department of 51,500 shares of its Fixed Rate Cumulative Perpetual Stock, Series A and a warrant to purchase 2,207,143 shares of its common stock on February 13, 2009 pursuant to the Capital Purchase Program, FNB United did not sell any of its securities in the three fiscal years ended December 31, 2009, which were not registered under the Securities Act of 1933, as amended.
17
Table of Contents
FIVE-YEAR STOCK PERFORMANCE TABLE
Performance Graph
The following graph and table are furnished with this Annual Report on Form 10-K and compare the cumulative total shareholder return of FNB United common stock for the five-year period ended December 31, 2009 with the SNL Southeast Bank Index and the Russell 3000 Stock Index, assuming an investment of $100 at the beginning of the period and the reinvestment of dividends.
FNB United Corp.
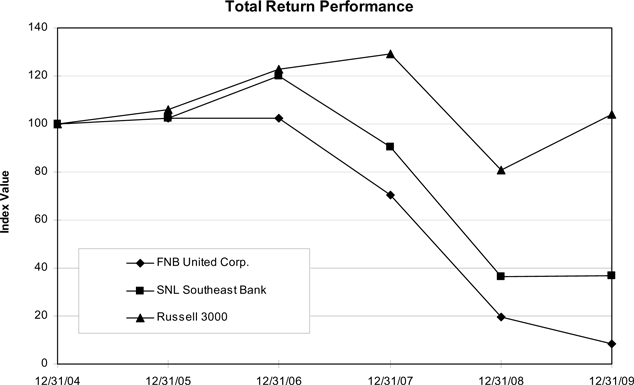
| Period Ending | ||||||||||||
| Index | 12/31/04 | 12/31/05 | 12/31/06 | 12/31/07 | 12/31/08 | 12/31/09 | ||||||
| FNB United Corp. |
100.00 | 102.47 | 102.23 | 70.56 | 19.48 | 8.22 | ||||||
| SNL Southeast Bank |
100.00 | 102.36 | 120.03 | 90.42 | 36.60 | 36.75 | ||||||
| Russell 3000 |
100.00 | 106.12 | 122.80 | 129.11 | 80.94 | 103.88 | ||||||
18
Table of Contents
| Item 6. | SELECTED FINANCIAL DATA |
The annual selected historical financial data presented in the accompanying table is derived from the audited consolidated financial statements for FNB United Corp. and Subsidiary. As this information is only a summary, you should read it in conjunction with the historical financial statements (and related notes) of the Company and “Management’s Discussion and Analysis of Financial Condition and Results of Operations” included elsewhere herein.
| (dollars in thousands, except per share data) | As of and for the Year Ended December 31, | ||||||||||||||||||||||||
| 2009 | 2008 | 2007 | 2006 | 2005 | |||||||||||||||||||||
| Income Statement Data |
|||||||||||||||||||||||||
| Net interest income |
$ | 62,196 | $ | 60,017 | $ | 63,612 | $ | 56,214 | $ | 34,365 | |||||||||||||||
| Provision for loan losses |
61,741 | 27,759 | 5,514 | 2,526 | 2,842 | ||||||||||||||||||||
| Noninterest income |
21,753 | 22,918 | 21,593 | 19,215 | 14,926 | ||||||||||||||||||||
| Noninterest expense |
119,912 | 118,103 | 61,044 | 53,441 | 31,678 | ||||||||||||||||||||
| Net (loss) / income before goodwill impairment charges |
(49,301) | (2,009) | 12,719 | 13,812 | 9,937 | ||||||||||||||||||||
| Net (loss)/income |
(101,696) | (59,809) | 12,361 | 12,187 | 9,937 | ||||||||||||||||||||
| Preferred stock dividends |
(2,871) | - | - | - | - | ||||||||||||||||||||
| Net (loss)/income to common shareholders |
(104,567) | (59,809) | 12,361 | 12,187 | 9,937 | ||||||||||||||||||||
| Period End Balances |
|||||||||||||||||||||||||
| Assets |
$ | 2,101,296 | $ | 2,044,434 | $ | 1,906,506 | $ | 1,814,905 | $ | 1,102,085 | |||||||||||||||
| Loans held for sale |
58,219 | 36,138 | 17,586 | 20,862 | 17,615 | ||||||||||||||||||||
| Loans held for investment (1) |
1,563,021 | 1,585,195 | 1,446,116 | 1,301,840 | 795,051 | ||||||||||||||||||||
| Allowance for loan losses |
49,461 | 34,720 | 17,381 | 15,943 | 9,945 | ||||||||||||||||||||
| Goodwill |
- | 52,395 | 110,195 | 110,956 | 31,381 | ||||||||||||||||||||
| Deposits |
1,722,128 | 1,514,747 | 1,441,042 | 1,421,013 | 841,609 | ||||||||||||||||||||
| Borrowings |
261,459 | 365,757 | 231,125 | 167,018 | 146,567 | ||||||||||||||||||||
| Shareholders’ equity |
98,359 | 147,917 | 216,256 | 207,668 | 102,315 | ||||||||||||||||||||
| Average Balances |
|||||||||||||||||||||||||
| Assets |
$ | 2,158,123 | $ | 2,040,204 | $ | 1,862,602 | $ | 1,575,307 | $ | 935,907 | |||||||||||||||
| Loans held for sale |
57,007 | 21,925 | 19,627 | 18,229 | 19,254 | ||||||||||||||||||||
| Loans held for investment (1) |
1,583,213 | 1,577,038 | 1,376,883 | 1,142,350 | 711,431 | ||||||||||||||||||||
| Allowance for loan losses |
38,283 | 20,493 | 15,882 | 14,213 | 7,979 | ||||||||||||||||||||
| Goodwill |
39,045 | 109,193 | 110,724 | 85,956 | 18,857 | ||||||||||||||||||||
| Deposits |
1,639,830 | 1,483,749 | 1,440,604 | 1,218,071 | 716,750 | ||||||||||||||||||||
| Borrowings |
334,332 | 322,643 | 188,790 | 166,507 | 120,308 | ||||||||||||||||||||
| Shareholders’ equity |
172,217 | 215,571 | 212,841 | 174,135 | 88,368 | ||||||||||||||||||||
| Per Common Share Data |
|||||||||||||||||||||||||
| Net (loss)/income before goodwill impairment charges |
$ | (4.57) | $ | (0.18) | $ | 1.12 | $ | 1.44 | $ | 1.73 | |||||||||||||||
| Net (loss)/income per common share: |
|||||||||||||||||||||||||
| Basic |
(9.16) | (5.24) | 1.09 | 1.27 | 1.73 | ||||||||||||||||||||
| Diluted (2) |
(9.16) | (5.24) | 1.09 | 1.25 | 1.69 | ||||||||||||||||||||
| Cash dividends declared |
0.05 | 0.45 | 0.60 | 0.62 | 0.62 | ||||||||||||||||||||
| Book value |
4.05 | 12.94 | 18.93 | 18.39 | 16.06 | ||||||||||||||||||||
| Tangible book value |
3.61 | 7.85 | 8.71 | 8.56 | 11.13 | ||||||||||||||||||||
| Performance Ratios |
|||||||||||||||||||||||||
| Return on average assets before goodwill impairment charges |
(2.28) | % | (0.10) | % | 0.68 | % | 0.88 | % | 1.06 | % | |||||||||||||||
| Return on average assets |
(4.71) | (2.93) | 0.66 | 0.77 | 1.06 | ||||||||||||||||||||
| Return on average tangible assets |
(4.81) | (3.11) | 0.71 | 0.82 | 1.09 | ||||||||||||||||||||
| Return on average equity before goodwill impairment charges (3) |
(28.63) | (0.93) | 5.98 | 7.93 | 11.25 | ||||||||||||||||||||
| Return on average equity (3) |
(59.05) | (27.74) | 5.81 | 7.00 | 11.25 | ||||||||||||||||||||
| Return on average tangible equity |
(79.59) | (59.78) | 12.99 | 14.75 | 14.58 | ||||||||||||||||||||
| Net interest margin (tax equivalent) |
3.11 | 3.40 | 4.01 | 4.18 | 4.16 | ||||||||||||||||||||
| Dividend payout on common shares (4) |
N/M | N/M | 55.21 | 51.17 | 36.32 | ||||||||||||||||||||
| Asset Quality Ratios |
|||||||||||||||||||||||||
| Allowance for loan losses to period end loans held for investment |
3.16 | % | 2.19 | % | 1.20 | % | 1.22 | % | 1.25 | % | |||||||||||||||
| Nonperforming loans to period end allowance for loan losses |
352.63 | 276.57 | 107.63 | 69.84 | 60.79 | ||||||||||||||||||||
| Net chargeoffs (annualized) to average loans held for investment |
2.97 | 0.67 | 0.27 | 0.17 | 0.22 | ||||||||||||||||||||
| Nonperforming assets to period end loans held for investment and foreclosed property (5) |
13.12 | 6.45 | 1.50 | 1.13 | 0.89 | ||||||||||||||||||||
| Capital and Liquidity Ratios |
|||||||||||||||||||||||||
| Average equity to average assets |
7.98 | % | 10.57 | % | 11.43 | % | 11.05 | % | 9.46 | % | |||||||||||||||
| Leverage capital |
5.68 | 6.30 | 7.50 | 7.20 | 8.80 | ||||||||||||||||||||
| Tier 1 risk based capital |
6.86 | 7.00 | 8.00 | 8.40 | 10.20 | ||||||||||||||||||||
| Total risk based capital |
10.29 | 10.40 | 10.40 | 11.50 | 11.50 | ||||||||||||||||||||
| Average loans to average deposits |
96.55 | 106.29 | 95.58 | 93.79 | 99.26 | ||||||||||||||||||||
| Average loans to average deposits and borrowings |
80.20 | 87.30 | 84.82 | 82.51 | 84.99 | ||||||||||||||||||||
(1) Loans held for investment, net of unearned income, before allowance for loan losses.
(2) Assumes the exercise of outstanding dilutive options to acquire common stock. See Note 14 to FNB United’s
consolidated financial statements included in the annual report on Form 10-K.
(3) Net (loss) income to common shareholders, which excludes preferred stock dividends, divided by average realized
common equity which excludes accumulated other comprehensive income (loss).
(4) Not applicable due to net loss.
(5) Nonperforming loans and nonperforming assets include loans past due 90 days or more that are still accruing interest.
19
Table of Contents
| Item 7. | MANAGEMENT’S DISCUSSION AND ANALYSIS OF FINANCIAL CONDITION AND RESULTS OF OPERATIONS |
The following presents management’s discussion and analysis of the financial condition and results of operations of FNB United and should be read in conjunction with the financial statements and related notes included elsewhere in this Annual Report on Form 10-K. This discussion may contain forward-looking statements that involve risks and uncertainties. Actual results could differ significantly from those anticipated in forward-looking statements as a result of various factors. The following discussion is intended to assist in understanding the financial condition and results of operations of FNB United.
Executive Overview
Description of Operations
FNB United is a bank holding company with a full-service subsidiary bank, CommunityONE Bank, National Association, which offers a complete line of consumer, mortgage and business banking services, including loan, deposit, cash management, investment management and trust services, to individual and business customers. The Bank has offices in Alamance, Alexander, Ashe, Catawba, Chatham, Gaston, Guilford, Iredell, Mecklenburg, Montgomery, Moore, Orange, Randolph, Richmond, Rowan, Scotland, Watauga and Wilkes counties in North Carolina.
The Bank has a mortgage banking subsidiary, Dover Mortgage Company, that originates, underwrites and closes loans for sale into the secondary market. Dover has a retail origination network based in Charlotte, North Carolina with wholesale operations currently in Georgia, Maine, Maryland, New Hampshire, North Carolina, South Carolina, Tennessee and Virginia.
Management’s Plans and Intentions
During the 2009 fourth quarter, the Office of the Comptroller of the Currency (OCC) completed the fieldwork for its regularly scheduled examination of the Bank. The Company has been advised orally by the OCC that a formal agreement with the agency will be required because of the impact of the high level of nonperforming assets on the financial performance of the Bank. Though the particular terms of the formal agreement are not known at this time, the Company expects that it will require corrective action for improvement in Bank earnings, lower nonperforming loan levels, increased minimum capital ratios necessary to be deemed well capitalized, and revisions to various policies. The Company has already been taking aggressive steps consistent with meeting these anticipated requirements. The Company does not expect its trust operations to be subject to enhanced regulatory requirements.
In response to the challenging economic environment and increased regulatory supervision and requirements, the Company plans to take a number of actions aimed at preserving existing capital, reducing its lending exposures and associated capital requirements, and increasing liquidity. The actions include, without limitation, the following: slowing loan originations, growing retail non-maturity deposits, reducing the already low level of brokered deposits, seeking resolution of nonperforming loans through either commercial note sales arrangements with other lenders or private equity sources or completing foreclosure sales, selling investment securities where appropriate, and reducing operating costs. The goal is to achieve profitability by controlling growth, stabilizing losses, managing problem assets and reducing overall expenses. Management is pursuing these four primary objectives as a basis for the long-term success of the Company and, in so doing, is focusing on the following:
Liquidity
The Company has a 45-office system of community offices, commonly referred to as branches, that has provided a significant and stable source of local funding. In addition, the Company has approved a contingency funding plan pursuant to which FNB United and the Bank will review each quarter liquidity needs based on a number of potential stress conditions. These conditions include, but are not limited to, deposit outflow and reductions in wholesale borrowing lines, including brokered deposits. Liquidity sources are stressed to determine if sufficient liquidity is available to meet potential funding needs. In all scenarios determined plausible by management, the Bank is able to meet liquidity needs through remaining borrowing lines, reducing loan originations, sales of assets, and scheduled cash flow that is not redeployed. The Bank is active in maximizing borrowing lines that can be drawn against under all financial conditions, as well as managing asset and liability cash flows to maintain adequate liquidity levels.
20
Table of Contents
Both FNB United and the Bank actively manage liquidity. The Company does not have any debt maturing during 2010 or 2011. FNB United suspended its dividend to shareholders until such time as the Bank returns to profitability and either receives or is not required to receive regulatory approval for the payment of dividends. At December 31, 2009, FNB United had approximately $4.1 million of cash held in deposits with the Bank. Based on current and expected liquidity needs and sources, management expects the Bank to be able to meet its obligations at least through December 31, 2010, and FNB United, with its ability to defer payments on preferred stock and trust preferred securities for extended periods of time, is expected to be able to meet its obligations at least through December 31, 2010. The Company is currently evaluating the possibility of deferring payments on preferred stock and trust preferred securities in order to preserve liquidity.
Cash and cash equivalents at the Bank at December 31, 2009 were approximately $27.7 million. Liquidity at the Bank is dependent upon deposits, which fund 82% of the Company’s assets. Despite reported negative earnings performance during 2009, the Bank’s deposits increased from December 31, 2008 to December 31, 2009 by $209 million. The Company is reducing its assets to improve capital ratios and has also been working to reduce collateralized funding as assets decline. The Bank’s loan portfolio does not have features that could rapidly draw additional funds, which would cause an elevated need for additional liquidity at the Bank.
Other contingency funding sources for the Bank include brokered deposits. The Bank’s internal polices allow for brokered deposits to increase to a maximum of 15% of total deposits. Access to brokered deposits may be eliminated or restricted, however, if the Bank were deemed not well-capitalized. At December 31, 2009, the Bank had sufficient collateral pledged to the Federal Reserve discount window and the Federal Home Loan Bank to allow it to borrow up to $98.5 million and $174.7 million, respectively, on an overnight basis. These amounts are subject to increase with the pledging of additional, available collateral.
As a result of its efforts to control the level of assets, management expects reductions in deposits through the end of 2010 as part of a planned deleveraging of the balance sheet. The reductions in deposits will also be caused in part by anticipated restrictions on interest rates paid on deposits imposed by the expected formal agreement identified above. Stress testing of potential severe deposit outflow demonstrates that the Bank is well positioned to respond to withdrawals without having to utilize significant credit lines available from the Federal Reserve discount window or the Federal Home Loan Bank. Additional sales and maturities of investment securities could provide further liquidity if needed. The Bank is currently considering the reclassification of the entire held-to-maturity investment securities portfolio to available-for-sale investment securities to further enhance the Bank’s liquidity. The reclassification of these securities may be completed in the second or third quarter of 2010.
Capital
The Bank anticipates increased minimum capital requirements from the OCC to be part of the expected formal agreement identified in Note 19. The Company, in anticipation of increased requirements, has begun to take steps to increase capital. The Company plans to control asset growth, which should help reduce its risk profile and improve capital ratios through reductions in the amount of outstanding loans, particularly loans with higher risk weights, and a corresponding reduction of liabilities. Outstanding loans will be reduced by slowing loan originations and through normal principal amortization. The Company may also seek commercial note sales arrangements with other lenders or private equity sources. The Company is reviewing investment securities for potential tax planning strategies that could contribute to improved earnings in 2010. Based on its forecasts and projections, management expects the Bank to remain well capitalized, according to current regulatory guidelines, through December 31, 2010, with both leverage and total risk-based capital ratios improving as a result of improved retained earnings and the deleveraging strategies described above.
The Bank has developed a capital plan that incorporates the measures described above and is aimed at maintaining required levels of regulatory capital. In addition, the Company has worked with various advisors and consultants on planned capital raises, asset sales, and implementing other measures to increase capital. Specific options available to the Company include selling properties obtained through acquisitions that are no longer needed for banking activities, transfer of the warehouse line for subsidiary mortgage operations, potential sales of community offices or groups of offices, as well as public or private equity capital raises. FNB United’s shareholders are being asked to approve an increase in the number of authorized shares of FNB United common stock at the May 2010 annual shareholders’ meeting, and sufficient additional shares are being sought to facilitate when appropriate the redemption of the shares of preferred stock issued under the Capital Purchase Program. The ability to raise additional capital and the success of an offering will depend on conditions in the capital markets at the time of the proposed offering and on the Company’s financial performance. A capital raise would likely not commence prior to
21
Table of Contents
the third or fourth quarter of 2010 due to present conditions in the micro-cap equity markets. Issuance of a large number of additional shares of common stock could significantly dilute the voting power of FNB United’s existing common shareholders.
In anticipation of a formal agreement with the OCC, the Board of Directors of the Bank is forming a compliance committee of some of its members to oversee management’s response to all sections of the expected agreement. The committee will monitor compliance with the anticipated formal agreement, including adherence to deadlines for submission to the OCC of any information required under the agreement.
The Company has engaged legal and regulatory experts to assist it with compliance with the anticipated OCC formal agreement. They will also be advising the Company on additional action plans and strategies to reduce the level of nonperforming assets and improving capital. These experts will work directly with the Board of Directors and Bank management to assure that all opportunities for improvement are considered.
Credit Quality
The Company has taken proactive steps to resolve its nonperforming loans, including negotiating repayment restructuring plans, forbearances, loan modifications and loan extensions with borrowers when appropriate. The Bank also has a separate special assets department to monitor and attempt to reduce exposure to further deterioration in asset quality, to manage OREO properties, and to liquidate property in the most cost-effective manner. The Bank is applying more conservative underwriting practices to new loans, including, among other things, increasing the amount of required collateral or equity requirements, reducing loan-to-value ratios, and increasing interest rates.
To improve its results of operations, the Company’s primary focus is to reduce significantly the amount of its nonperforming assets. Nonperforming assets decrease profitability because they reduce the balance of earning assets, may require additional loan loss provisions or write-downs, and require significant devotion of staff time and financial resources to resolve. The level of nonperforming assets (loans not accruing interest, restructured loans, loans past due 90 days or more and still accruing interest, and other real estate owned) had increased to $209.7 million as of December 31, 2009, as compared to $102.7 million as of December 31, 2008. The Company believes that the increase in the level of nonperforming assets has occurred largely as a result of the severe housing downturn and deterioration in the residential real estate market, as many of the Bank’s commercial loans are for residential real estate projects.
The Company has moved aggressively to address the credit quality issues by increasing its reserves for losses and directing the efforts of a team of experienced workout specialists solely to manage the resolution of nonperforming assets. This group allows the remainder of the Bank’s credit administration and banking personnel to focus on managing the performing loan portfolio, while enhancing objectivity in problem loan resolution by removing from that process the originating or managing lender.
With the assistance of a third-party loan review firm, the Bank conducted a thorough review of the loan portfolio during 2009, including both nonperforming loans and performing loans. The Company believes that the reserves recorded in its allowance for loan losses as of December 31, 2009 are adequate to cover losses inherent in the portfolio as of that date.
It is the Company’s goal to remove the majority of the nonperforming assets from its balance sheet while still obtaining reasonable value for these assets. Given the current conditions in the real estate market, accomplishing this goal is a tremendous undertaking, requiring both time and the considerable effort of staff. The Company is committed to continuing to devote significant resources to these efforts. Sales of real estate in the current market could result in losses.
Continued Expense Control
The Company has made it a priority to identify cost savings opportunities throughout all phases of operations. In 2008, the Bank engaged a third party to review and recommend a cost savings strategy for the Bank. The Bank continues to follow those recommendations and continues to see improvements in expense control. The Company is committed to maintaining these cost control measures and believes that this effort will play a major role in improving its performance. The Company also believes that its technology allows it to be efficient in its back-office operations. In addition, as the level of nonperforming assets is reduced, the operating costs associated with carrying those assets, such as maintenance, insurance and taxes, will decrease.
22
Table of Contents
The Company is focused on expanding its collection of core deposits. Core deposit balances, generated from customers throughout the Bank’s branch network, are generally a stable source of funds similar to long-term funding, but core deposits such as checking and savings accounts are typically much less costly than alternative fixed-rate funding. The Company believes that this cost advantage makes core deposits a superior funding source, in addition to providing cross-selling opportunities and fee income possibilities. The Bank works to increase its level of core deposits by actively cross-selling core deposits to local depositors and borrowers. As the Bank grows its core deposits, the cost of funds should decrease, thereby increasing the Bank’s net interest margin.
Conclusion
Earnings projections for 2010 and 2011 are greatly improved from results posted in preceding years. In the current interest rate environment, earnings will at most be only minimally affected by further declines in interest rates. Any increase in interest rates is expected to have a positive impact on the earnings of the Bank, with the extent of that impact dependent on the amount of increase. Management’s current projections and forecasts for 2010 include an insignificant increases in interest rates, notwithstanding increasing evidence of economic recovery and the heightened possibility of rate increases during the fourth quarter of 2010.
The Company is evaluating various strategic options, including capital raising alternatives and the sale of selective assets. While the Company plans to focus on the above actions and to pursue strategic alternatives, the Company can give no assurance that efforts to raise additional capital in the current economic environment will be successful and result in the Company’s desired capital position. The Bank’s ability to decrease its levels of nonperforming assets is also subject to market conditions as some of its borrowers rely on an active real estate market as a source of repayment, and the sale of loans in this market is difficult. If the real estate market does not improve, the Bank’s level of nonperforming assets may continue to increase.
While the Company believes that it is taking appropriate steps to respond to these economic risks and regulatory actions, continued deterioration in the Bank’s asset quality or anticipated regulatory actions could adversely affect the Company’s operations and the Company’s ability to continue as a going concern.
Primary Financial Data for 2009
FNB United experienced a loss of $104.6 million in 2009, a 75% increase from the net loss of $59.8 million in 2008. Basic and diluted (loss) per share increased 75% from $(5.24) in 2008 to $(9.16) in 2009. Total assets were $2.10 billion at December 31, 2009, up 3% from year-end 2008. Loans amounted to $1.56 billion at December 31, 2009, decreasing 1% from the prior year. Total deposits grew $207.4 million, to $1.72 billion in 2009.
Significant Factors Affecting Earnings
2009 presented challenges for FNB United as well as for the entire banking industry. The strains in the local and national financial and housing markets presented a challenging environment during 2009, particularly in the fourth quarter. This difficult environment required a significant increase in FNB United’s loan loss provision, which depressed operating results but was a necessary response to increased non-performing loans. FNB United has not originated any subprime real estate loans or loans outside its market areas.
The provision for loan losses was $61.7 million in 2009, compared to $27.8 million in 2008, an increase of 122%. This increase resulted primarily from continued deterioration in credit performance of the residential real estate development and construction sectors of the Bank’s commercial portfolio, resulting in loan charge-offs and increased impairment identified in loans determined to be impaired during the year. Nonperforming assets increased 104%, to $209.7 million during 2009 from $102.6 million at the close of 2008. Net loan charge-offs increased to $47.0 million in 2009, compared to $10.4 million in 2008. Loans held for investment decreased $22.2 million during 2009. The allowance for loan losses was increased to 3.16% of loans held for investment at December 31, 2009. The allowance was 2.19% at December 31, 2008.
The provision for loan losses was $27.8 million in 2008, compared to $5.5 million in 2007, an increase of 403%. Nonperforming assets increased 372%, to $102.6 million during 2008 from $21.8 million at the end of 2007.
The Bank established a $6.0 million valuation reserve on deferred tax assets in the third quarter 2009 and also established an additional $16.3 million valuation reserve on deferred tax assets in the fourth quarter 2009. In assessing whether deferred tax assets will be realized, management considers whether it is more likely than not that some portion or all of the deferred tax assets will not be realized. The ultimate realization of deferred tax assets is
23
Table of Contents
dependent upon the generation of future taxable income during the periods in which those temporary differences become deductible. Management considers the scheduled reversal of deferred tax liabilities, projected future taxable income, and tax planning strategies in making this assessment. In evaluating the positive and negative evidence to support the realization of the asset under current guidance, there is insufficient positive evidence to support a conclusion that it is more likely than not this asset will be realized in the foreseeable future. The Bank has fully reserved for its deferred tax assets that are dependent upon future taxable income for realization with a valuation allowance.
Noninterest income decreased 5.1% to $21.8 million, compared to $22.9 million in 2008. Of this decrease, $5.0 million was attributable to an other-than-temporary impairment (“OTTI”) charge on an investment security owned by the Bank that the Bank deemed would be unlikely to recover its investment. Mortgage loan income increased $3.5 million resulting from mortgage loan sale activity exceeding $692.6 million in 2009 versus $317.1 million in 2008. Other service charges, commissions and fees ended 2009 at $1.1 million compared to $0.8 million for 2008. Noninterest income, excluding the OTTI charge, improved to $26.7 million for the year compared to $22.9 million in 2008 thus representing a 16.6% increase.
In 2008, noninterest income was $22.9 million, representing a 6.1% increase when compared to $21.6 million in 2007. Of this increase, $1.2 million resulted from adopting SAB 109 in the first quarter of 2008. Cardholder and merchant services income increased $517,000 in 2008 due to increased interchange fees and surcharge fees. Other income decreased $1.4 million in 2008 due to the credit card portfolio sold in 2007 for a net gain of $1.3 million. Noninterest income was also significantly affected in 2007 by the recovery of $300,000 on the sale of previously charged-off loans partially offset by a mortgage servicing rights impairment charge of $271,000.
Noninterest expense was significantly affected in 2009 and 2008 by goodwill impairment charges of $52.4 million and $57.8 million, respectively, as discussed in Note 2 to the Consolidated Financial Statements. Excluding the goodwill impairment charges, noninterest expense was $67.5 million, compared to $60.3 million in 2008, an increase of $7.2 million or 12.0%. FDIC insurance for 2009 was $4.2 million compared to $0.9 million for 2008, a 366.4% increase year over year. OREO-related expenses increased 469.5% to $3.5 million for 2009 compared to $0.6 million in 2008.
Noninterest expense was also impacted in 2008 and 2007 by goodwill impairment charges of $57.8 million and $358,000, respectively. Excluding the goodwill impairment charges, noninterest expense was $60.3 million compared to $60.7 million in 2008 and 2007, respectively. The Company undertook a major noninterest expense improvement project during the second half of 2008, including consolidation of operational functions, strong vendor management and tighter staffing models. In addition, due to higher costs in 2007 associated with rebranding initiatives, marketing expenses declined by $545,000 in 2008.
Earnings Review
FNB United’s net loss of $104.6 million in 2009 compared to the net loss of $59.8 million in 2008 is primarily a result of the increased provision for loan losses of $34.0 million and goodwill impairment charges of $52.4 million. Certain factors specifically affecting the elements of income and expense and the comparability of operating results on a year-to-date basis between 2009 and 2008 are discussed in “Significant Factors Affecting Earnings.”
FNB United’s net loss in 2008 was $59.8 million compared to net income of $12.4 million in 2007. Earnings were negatively impacted in 2008 by a goodwill charge of $57.8 million and an increase in provision for loan losses of 403%, or $22.2 million.
Return on average assets was (4.71)% in 2009, compared to (2.93)% in 2008 and 0.66% in 2007. Return on average shareholders’ equity decreased from 5.81% in 2007 to (27.74)% in 2008 and (59.05)% in 2009. In 2009, return on tangible assets and equity (calculated by deducting average goodwill and core deposit premiums from average assets and from average equity) amounted to (4.81)% and (79.59)%, respectively, compared to (3.11)% and (59.78)% in 2008 and 0.71% and 12.99% in 2007.
Net Interest Income
Net interest income is the difference between interest income, principally from loans and investments, and interest expense, principally on customer deposits. Changes in net interest income result from changes in interest rates and in the volume, or average dollar level, and mix of earning assets and interest-bearing liabilities.
24
Table of Contents
Table 1
Average Balance Sheet and Net Interest/Dividend Income Analysis
Fully Taxable Equivalent Basis
| Year Ended December 31, | |||||||||||||||||||||||||||
| 2009 | 2008 | 2007 | |||||||||||||||||||||||||
| (dollars in thousands) | Average Balance (3) |
Income / Expense |
Average Yield / Rate |
Average Balance (3) |
Income / Expense |
Average Yield / Rate |
Average Balance (3) |
Income / Expense |
Average Yield / Rate |
||||||||||||||||||
| Interest earning assets: |
|||||||||||||||||||||||||||
| Loans (1)(2) |
$ | 1,640,220 | $ | 84,322 | 5.14 | % | $ | 1,577,038 | $ | 103,567 | 6.57 | % | $ | 1,376,883 | $ | 115,101 | 8.36 | % | |||||||||
| Taxable investment securities |
281,047 | 16,256 | 5.78 | 152,436 | 7,820 | 5.13 | 149,153 | 7,613 | 5.10 | ||||||||||||||||||
| Tax-exempt investment securities (1) |
49,884 | 2,256 | 4.52 | 52,454 | 3,138 | 5.98 | 55,527 | 3,225 | 5.81 | ||||||||||||||||||
| Overnight Federal funds sold |
10,851 | 21 | 0.19 | 1,316 | 25 | 1.90 | 17,736 | 929 | 5.24 | ||||||||||||||||||
| Other earning assets |
19,326 | 377 | 1.95 | 19,728 | 785 | 3.98 | 19,875 | 1,122 | 5.65 | ||||||||||||||||||
| Total earning assets |
2,001,328 | 103,232 | 5.16 | 1,802,972 | 115,335 | 6.40 | 1,619,174 | 127,990 | 7.90 | ||||||||||||||||||
| Non-earning assets: |
|||||||||||||||||||||||||||
| Cash and due from banks |
27,502 | 29,121 | 33,316 | ||||||||||||||||||||||||
| Goodwill and core deposit premium |
44,438 | 115,520 | 117,691 | ||||||||||||||||||||||||
| Other assets, net |
84,855 | 92,591 | 92,421 | ||||||||||||||||||||||||
| Total assets |
$ | 2,158,123 | $ | 2,040,204 | $ | 1,862,602 | |||||||||||||||||||||
| Interest-bearing liabilities: |
|||||||||||||||||||||||||||
| Interest-bearing demand deposits |
$ | 198,343 | $ | 2,250 | 1.13 | % | $ | 168,395 | $ | 2,007 | 1.19 | % | $ | 164,032 | $ | 2,643 | 1.61 | % | |||||||||
| Savings deposits |
40,301 | 106 | 0.26 | 40,803 | 113 | 0.28 | 47,189 | 130 | 0.28 | ||||||||||||||||||
| Money market deposits |
308,690 | 4,381 | 1.42 | 274,818 | 6,389 | 2.32 | 256,841 | 10,395 | 4.05 | ||||||||||||||||||
| Time deposits |
940,138 | 25,753 | 2.74 | 841,741 | 33,702 | 4.00 | 813,337 | 39,426 | 4.85 | ||||||||||||||||||
| Retail repurchase agreements |
18,737 | 127 | 0.68 | 29,954 | 651 | 2.17 | 28,783 | 1,317 | 4.58 | ||||||||||||||||||
| Federal Home Loan Bank advances |
185,284 | 5,933 | 3.20 | 204,877 | 7,223 | 3.53 | 80,111 | 3,468 | 4.33 | ||||||||||||||||||
| Federal funds purchased |
58,609 | 156 | 0.27 | 21,310 | 501 | 2.35 | 3,102 | 162 | 5.22 | ||||||||||||||||||
| Other borrowed funds |
71,702 | 2,269 | 3.16 | 66,502 | 3,432 | 5.16 | 76,794 | 5,487 | 7.15 | ||||||||||||||||||
| Total interest-bearing liabilities |
1,821,804 | 40,975 | 2.25 | 1,648,400 | 54,018 | 3.28 | 1,470,189 | 63,028 | 4.29 | ||||||||||||||||||
| Noninterest-bearing liabilities and shareholders’ equity: |
|||||||||||||||||||||||||||
| Noninterest-bearing demand deposits |
152,358 | 157,992 | 159,205 | ||||||||||||||||||||||||
| Other liabilities |
11,744 | 18,241 | 20,367 | ||||||||||||||||||||||||
| Shareholders’ equity |
172,217 | 215,571 | 212,841 | ||||||||||||||||||||||||
| Total liabilities and equity |
$ | 2,158,123 | $ | 2,040,204 | $ | 1,862,602 | |||||||||||||||||||||
| Net interest income and net yield on earning assets (4) |
$ | 62,257 | 3.11 | % | $ | 61,317 | 3.40 | % | $ | 64,962 | 4.01 | % | |||||||||||||||
| Interest rate spread (5) |
2.91 | % | 3.12 | % | 3.62 | % | |||||||||||||||||||||
(1) The fully tax equivalent basis is computed using a federal tax rate of 35%.
(2) The average loan balances include nonaccruing loans and loans held for sale.
(3) The average balances for all years include market adjustments to fair value for securities and loans held for sale.
(4) Net yield on earning assets is computed by dividing net interest income by average earning assets.
(5) Earning asset yield minus interest bearing liabilities rate.
Table 1 sets forth for the periods indicated information with respect to FNB United’s average balances of assets and liabilities, as well as the total dollar amounts of interest income (taxable equivalent basis) from earning assets and interest expense on interest-bearing liabilities, resultant rates earned or paid, net interest income, net interest spread and net yield on earning assets. Net interest spread refers to the difference between the average yield on earning assets and the average rate paid on interest-bearing liabilities. Net yield on earning assets, or net interest margin, refers to net interest income divided by average earning assets and is influenced by the level and relative mix of earning assets and interest-bearing liabilities.
Net interest income according to the Consolidated Statements of (Loss)/Income was $62.2 million in 2009, compared to $60.0 million in 2008. This increase of $2.2 million, or 3.6%, resulted primarily from an 11% increase in the level of average earning assets partially offset by a decline in the net yield on earning assets, or net interest margin, from 3.40% in 2008 to 3.11% in 2009. In 2008, the decrease of $3.6 million, or 5.7%, resulted primarily from a decline in the net yield on earning assets, or net interest margin, from 4.01% in 2007 to 3.40% in 2008 partially offset by an 11% increase in the level of average earning assets. On a taxable equivalent basis, the changes in net interest income in 2009 and 2008 were $0.9 million $3.6 million, respectively reflecting changes in the relative mix of taxable and non-taxable earning assets in each year.
25
Table of Contents
Table 2 analyzes net interest income on a taxable equivalent basis, as measured by volume and rate variances. The table reflects the extent to which changes in the interest income and interest expense are attributable to changes in volume (changes in volume multiplied by prior year rate) and changes in rate (changes in rate multiplied by prior year volume).
Table 2
Volume and Rate Variance Analysis
| (dollars in thousands) | 2009 vs 2008 | 2008 vs 2007 | ||||||||||||||||
| Volume Variance |
Rate Variance |
Total Variance |
Volume Variance |
Rate Variance |
Total Variance | |||||||||||||
| Interest income: |
||||||||||||||||||
| Loans, net |
$ | 4,149 | $ | (23,394) | $ | (19,245) | $ | 16,732 | $ | (28,267) | $ | (11,535) | ||||||
| Taxable investment securities |
6,598 | 1,838 | 8,436 | 168 | 39 | 207 | ||||||||||||
| Tax exempt investment securities |
(154) | (728) | (882) | (178) | 92 | (86) | ||||||||||||
| Overnight Federal funds sold |
181 | (185) | (4) | (860) | (44) | (904) | ||||||||||||
| Other earning assets |
(16) | (392) | (408) | (43) | (294) | (337) | ||||||||||||
| Total interest income |
10,758 | (22,861) | (12,103) | 15,819 | (28,474) | (12,655) | ||||||||||||
| Interest expense: |
||||||||||||||||||
| Interest-bearing demand deposits |
357 | (114) | 243 | 70 | (706) | (636) | ||||||||||||
| Savings deposits |
(1) | (6) | (7) | (18) | 1 | (17) | ||||||||||||
| Money market deposits |
787 | (2,795) | (2,008) | 728 | (4,734) | (4,006) | ||||||||||||
| Time deposits |
3,940 | (11,889) | (7,949) | 1,377 | (7,101) | (5,724) | ||||||||||||
| Retail repurchase agreements |
(244) | (280) | (524) | 54 | (720) | (666) | ||||||||||||
| Federal Home Loan Bank advances |
(691) | (599) | (1,290) | 5,401 | (1,646) | 3,755 | ||||||||||||
| Federal funds purchased |
877 | (1,222) | (345) | 951 | (612) | 339 | ||||||||||||
| Other borrowed funds |
268 | (1,431) | (1,163) | (735) | (1,320) | (2,055) | ||||||||||||
| Total interest expense |
5,293 | (18,336) | (13,043) | 7,828 | (16,838) | (9,010) | ||||||||||||
| Increase (decrease) in net interest income |
$ | 5,465 | $ | (4,525) | $ | 940 | $ | 7,991 | $ | (11,636) | $ | (3,645) | ||||||
In 2009, the net interest spread decreased by 21 basis points from 3.12% in 2008, to 2.91% in 2009, reflecting the net effect of decreases in both the average total yield on earning assets and the average rate paid on interest-bearing liabilities, or cost of funds. The yield on earning assets decreased by 124 basis points, from 6.40% in 2008 to 5.16% in 2009, while the cost of funds decreased by 103 basis points, from 3.28% to 2.25%. In 2008, the 50 basis points decrease in net interest spread resulted from a 151 basis points decrease in the yield on earning assets, which was partially offset by a 101 basis points decrease in the cost of funds.
Changes in the net interest margin and net interest spread tend to correlate with movements in the prime rate of interest. There are variations, however, in the degree and timing of rate changes, compared to prime, for the different types of earning assets and interest-bearing liabilities.
As a result, interest-bearing assets repriced downward faster than interest-bearing liabilities. During 2007, interest rates remained constant for more than a year until the Federal Reserve, responding to recessionary concerns, exacerbated by the subprime mortgage crisis, cut the target federal funds rate by 50 basis points in September 2007. This action was followed by two additional cuts of 25 basis points each in October and December 2007, to 4.00% at December 31, 2007. Regular cuts to the target federal funds rate continued through 2008 with year-end rates at 0.25% and remained at this level for all of 2009.
Provision for Loan Losses
This provision is the charge against earnings to provide an allowance for probable losses inherent in the loan portfolio. The amount of each year’s charge is affected by several considerations, including management’s evaluation of various risk factors in determining the adequacy of the allowance (see “Asset Quality”), actual loan loss experience and loan portfolio growth. The provision for loan losses was $61.7 million in 2009, $27.8 million in 2008 and $5.5 million in 2007. This increase in the level of the provision for loan losses is discussed and analyzed in detail as part of the discussions in the “Significant Factors Affecting Earnings” and “Asset Quality” sections.
26
Table of Contents
Noninterest Income
Noninterest income decreased $1.2 million, or 5%, in 2009, due primarily to a $5.0 million OTTI charge on an investment security owned by the Bank for which the Bank deemed it would be unlikely to recover its investment. Additional information concerning factors which specifically affected noninterest income in 2009 is discussed under “Significant Factors Affecting Earnings.”
Noninterest income increased $1.3 million, or 6%, in 2008, due primarily to $1.2 million recognized from the adoption of SAB 109 in 2008 as well as $0.5 million of increased interchange fees and surcharge fees in 2008 offset by the $1.3 million sale of the credit card portfolio in 2007.
| (dollars in thousands) | December 31, | ||||||||
| 2009 | 2008 | 2007 | |||||||
| Service charges on deposit accounts |
$ | 8,956 | $ | 9,167 | $ | 9,012 | |||
| Mortgage loan income |
9,888 | 6,340 | 4,543 | ||||||
| Cardholder and merchant services income |
2,514 | 2,395 | 1,878 | ||||||
| Trust and investment services |
1,741 | 1,827 | 1,686 | ||||||
| Bank owned life insurance |
1,068 | 983 | 945 | ||||||
| Other service charges, commissions and fees |
1,147 | 796 | 998 | ||||||
| Security gains |
1,055 | 646 | - | ||||||
| Gain on sale of credit card portfolio |
- | - | 1,302 | ||||||
| Total other than temporary impairment loss |
(4,985) | - | - | ||||||
| Portion of loss recognized in other comprehensive income |
- | - | - | ||||||
| Net impairment loss recognized in earnings |
(4,985) | - | - | ||||||
| Other income |
369 | 764 | 1,229 | ||||||
| Total noninterest income |
$ | 21,753 | $ | 22,918 | $ | 21,593 | |||
In 2009, the Federal Reserve adopted amendments to its Regulation E that will restrict the Bank’s ability to charge customers overdraft fees beginning in July 2010. Pursuant to the adopted regulation, customers must opt-in to an overdraft service for the Bank to collect overdraft fees. Additional legislation is being considered in Congress that would further restrict the Bank from collecting overdraft fees or limit the amount of overdraft fees that may be collected. These changes could have a significant negative impact on the Bank’s noninterest income.
Noninterest Expense
Noninterest expense was $1.8 million, or 2% higher in 2009 due to a $3.3 million increase in FDIC insurance premiums and a $2.9 million increase in OREO related expenses, which is partially offset by a $5.4 million decrease in goodwill impairment charges. Goodwill impairment charges of $52.4 million and $57.8 million for 2009 and 2008, respectively, significantly impacted noninterest expense and is further discussed in Note 2 to the Consolidated Financial Statements. Excluding the goodwill impairment charges of $52.4 million in 2009 and $57.8 million in 2008, noninterest expense was $7.2 million higher in 2009 than in 2008. FDIC insurance for 2009 was $4.2 million compared to $0.9 million for 2008, a 366.4% increase year over year. OREO related expenses increased 469.5% to $3.5 million for 2009 compared to $0.6 million in 2008.
Noninterest expense was $57.1 million, or 93%, higher in 2008 compared to 2007. In 2007, noninterest expense was $61.0 million. The major component of the increase from 2007 to 2008 was a goodwill impairment charge of $57.8 million. Excluding the goodwill charge, noninterest expense decreased $400,000 in 2008 from 2007.
On November 12, 2009, the FDIC adopted a final rule imposing a 13-quarter prepayment of FDIC premiums to replenish the depleted insurance fund. This regulation required insured depository institutions to prepay their estimated quarterly regular risk-based assessments for the fourth quarter of 2009, through the fourth quarter of 2012 on December 30, 2009, at the same time that institutions pay their regular quarterly deposit insurance assessments for the third quarter of 2009. The estimated prepayment amount will be used to offset future FDIC premiums beginning on March 30, 2010, which represents payment of the regular insurance assessment for the 2009 fourth quarter. As part of the prepayment assessment, approximately $0.7 million was expensed in 2009. The Bank’s remaining prepaid assessment equated to approximately $9.6 million and will be expensed over the remaining three-year period for which premiums were prepaid, resulting in quarterly FDIC insurance expense of approximately $0.8 million.
27
Table of Contents
| NONINTEREST EXPENSE (dollars in thousands) |
December 31, | ||||||||
| 2009 | 2008 | 2007 | |||||||
| Personnel expense |
$ | 32,932 | $ | 33,081 | $ | 33,169 | |||
| Net occupancy expense |
5,522 | 5,343 | 5,303 | ||||||
| Furniture, equipment, and data processing expense |
7,121 | 6,705 | 6,556 | ||||||
| Professional fees |
2,070 | 2,552 | 1,872 | ||||||
| Stationery, printing and supplies |
703 | 1,174 | 1,266 | ||||||
| Advertising and marketing |
2,056 | 1,371 | 1,924 | ||||||
| Other real estate owned expense |
3,472 | 610 | 109 | ||||||
| Credit/debit card expense |
1,672 | 1,716 | 1,613 | ||||||
| Goodwill impairment |
52,395 | 57,800 | 358 | ||||||
| FDIC insurance |
4,170 | 894 | 166 | ||||||
| Other expense |
7,799 | 6,857 | 8,708 | ||||||
| Total noninterest expense |
$ | 119,912 | $ | 118,103 | $ | 61,044 | |||
Provision for Income Taxes
The effective income tax rate decreased from 5.0% in 2008 to (4.1)% in 2009 due principally to lower net interest income and the higher level of nondeductible expenses in 2009. Nondeductible expenses included a goodwill impairment charge of $52.4 million in 2009 compared to $57.8 million in 2008. The effective income tax rate decreased from 33.7% in 2007 to 5.0% in 2008 due principally to a higher level of nondeductible expenses in 2008, including a goodwill impairment charge of $57.8 million in 2008 compared to $0.4 million in 2007.
During 2009, the deferred tax asset had to be evaluated and to the extent that it was determined that recovery was not likely, a valuation allowance was established. It was determined that a valuation allowance of $22.3 million was required at December 31, 2009. Although a valuation allowance was required for deferred tax assets at year end, there is no guarantee that an additional valuation allowance will not be required in the future. Adjustments to increase or decrease the valuation allowance are charged or credited, respectively, to income tax expense.
Liquidity
Liquidity for the Bank refers to its continuing ability to meet deposit withdrawals, fund loan and capital expenditure commitments, maintain reserve requirements, pay operating expenses and provide funds to FNB United for payment of dividends, debt service and other operational requirements. Liquidity is immediately available from five major sources: (a) cash on hand and on deposit at other banks, (b) the outstanding balance of federal funds sold, (c) the line of credit established through the Discount Window at the Federal Reserve Bank, less charges against that line for existing borrowings, (d) the line of credit established at the Federal Home Loan Bank, less charges against that line for existing advances and letters of credit used to secure public funds on deposit, and (e) the investment securities portfolio.
Consistent with the general approach to liquidity, loans and other assets of the Bank are based primarily on a core of local deposits and the Bank’s capital position. To date, the steady increase in deposits, supplemented by Federal Home Loan Bank advances, federal funds purchased, and a modest amount of brokered deposits, has been adequate to fund loan demand in the Bank’s market area, while maintaining the desired level of immediate liquidity and a substantial investment securities portfolio available for both immediate and secondary liquidity purposes.
Liquidity for Dover refers to its continuing ability to fund mortgage loan commitments and pay operating expenses. Liquidity is principally available from a line of credit with the Bank, established in 2007. Prior to that date, the line of credit was with a large national bank.
Contractual Obligations
Under existing contractual obligations, FNB United will be required to make payments in future periods. Table 3 presents aggregated information about the payments due under such contractual obligations at December 31, 2009. Transaction deposit accounts with indeterminate maturities have been classified as having payments according to an expected decay rate. Benefit plan payments cover estimated amounts due through 2019.
28
Table of Contents
Table 3
Contractual Obligations
| (dollars in thousands) | Payments Due by Period at December 31, 2009 | ||||||||||||||
| One Year or Less |
One to Three Years |
Three to Five Years |
Over Five Years |
Total | |||||||||||
| Deposits |
$ | 847,225 | $ | 315,647 | $ | 149,933 | $ | 409,323 | $ | 1,722,128 | |||||
| Retail repurchase agreements |
13,592 | - | - | - | 13,592 | ||||||||||
| Federal Home Loan Bank advances |
18,000 | 65,000 | 14,887 | 68,278 | 166,165 | ||||||||||
| Federal funds purchased |
10,000 | - | - | - | 10,000 | ||||||||||
| Subordinated debt |
- | - | - | 15,000 | 15,000 | ||||||||||
| Trust preferred securities |
- | - | - | 56,702 | 56,702 | ||||||||||
| Lease obligations |
1,451 | 2,294 | 2,191 | 11,259 | 17,195 | ||||||||||
| Estimated benefit plan payments: |
|||||||||||||||
| Pension |
542 | 1,166 | 1,305 | 3,967 | 6,980 | ||||||||||
| Other |
168 | 391 | 427 | 1,813 | 2,799 | ||||||||||
| Total contractual cash obligations |
$ | 890,978 | $ | 384,498 | $ | 168,743 | $ | 566,342 | $ | 2,010,561 | |||||
Commitments, Contingencies and Off-Balance Sheet Risk
Information about FNB United’s off-balance sheet risk exposure is presented in Note 15 to the accompanying consolidated financial statements.
Asset/Liability Management and Interest Rate Sensitivity
One of the primary objectives of asset/liability management is to maximize the net interest margin while minimizing the earnings risk associated with changes in interest rates. One method used to manage interest rate sensitivity is to measure, over various time periods, the interest rate sensitivity positions, or gaps; however, this method addresses only the magnitude of timing differences and does not address earnings or market value. Therefore, management uses an earnings simulation model to prepare, on a monthly basis, earnings projections based on a range of interest rate scenarios in order to more accurately measure interest rate risk.
Table 4 presents information about the periods in which the interest-sensitive assets and liabilities at December 31, 2009 will mature, prepay, or be subject to repricing in accordance with market rates, and the resulting interest-sensitivity gaps. This table shows the sensitivity of the balance sheet at one point in time and is not necessarily indicative of what the sensitivity will be on other dates. As a simplifying assumption concerning repricing behavior, 50% of the interest-bearing demand, savings and money market deposits are assumed to reprice immediately and 50% are assumed to reprice beyond one year.
29
Table of Contents
Table 4
Interest Rate Sensitivity Analysis
| December 31, 2009 | ||||||||||||||||||
| (dollars in thousands) | Rate Maturity in Days | |||||||||||||||||
| 1-90 | 91-180 | 181-365 | Beyond One Year |
Total | ||||||||||||||
| Earning Assets |
||||||||||||||||||
| Loans |
$ | 1,041,593 | $ | 51,891 | $ | 89,039 | $ | 380,498 | $ | 1,563,021 | ||||||||
| Loans held for sale |
58,219 | - | - | - | 58,219 | |||||||||||||
| Investment securities (1) |
85,589 | 30,505 | 36,690 | 168,680 | 321,464 | |||||||||||||
| Interest-bearing bank balances |
98 | - | - | - | 98 | |||||||||||||
| Other earning assets |
18,247 | - | - | - | 18,247 | |||||||||||||
| Total interest-earning assets |
1,203,746 | 82,396 | 125,729 | 549,178 | 1,961,049 | |||||||||||||
| Interest-Bearing Liabilities |
||||||||||||||||||
| Interest-bearing deposits: |
||||||||||||||||||
| Demand deposits |
113,348 | - | - | 113,348 | 226,696 | |||||||||||||
| Savings deposits |
20,362 | - | - | 20,361 | 40,723 | |||||||||||||
| Money market deposits |
163,479 | - | - | 163,479 | 326,958 | |||||||||||||
| Time deposits of $100,000 or more |
120,784 | 83,624 | 138,447 | 83,003 | 425,858 | |||||||||||||
| Other time deposits |
186,338 | 75,203 | 189,738 | 98,092 | 549,371 | |||||||||||||
| Retail repurchase agreements |
13,592 | - | - | - | 13,592 | |||||||||||||
| Federal Home Loan Bank advances |
15,000 | - | 3,000 | 148,165 | 166,165 | |||||||||||||
| Federal funds purchased |
10,000 | - | - | - | 10,000 | |||||||||||||
| Subordinated debt |
15,000 | - | - | - | 15,000 | |||||||||||||
| Trust preferred securities |
56,702 | - | - | - | 56,702 | |||||||||||||
| Total interest-bearing liabilities |
714,605 | 158,827 | 331,185 | 626,448 | 1,831,065 | |||||||||||||
| Interest Sensitivity Gap |
$ | 489,141 | $ | (76,431 | ) | $ | (205,456 | ) | $ | (77,270 | ) | $ | 129,984 | |||||
| Cumulative gap |
$ | 489,141 | $ | 412,710 | $ | 207,254 | $ | 129,984 | $ | 129,984 | ||||||||
| Ratio of interest-sensitive assets to interest-sensitive liabilities |
168% | 52% | 38% | 88% | 107% | |||||||||||||
(1) Securities are based on amortized cost.
FNB United’s balance sheet was asset-sensitive at December 31, 2009. An asset sensitive position means that in a declining rate environment, FNB United’s assets will reprice down faster than liabilities, resulting in a reduction in net interest income. Conversely, when interest rates rise, FNB United’s earnings position should improve. Included in interest-bearing liabilities subject to rate changes within 90 days is a portion of the interest-bearing demand, savings and money market deposits. These types of deposits historically have not repriced coincidentally with or in the same proportion as general market indicators.
Market Risk
Market risk is the possible chance of loss from unfavorable changes in market prices and rates. These changes may result in a reduction of current and future period net interest income, which is the favorable spread earned from the excess of interest income on interest-earning assets, over interest expense on interest-bearing liabilities.
FNB United’s market risk arises primarily from interest rate risk inherent in its lending and deposit-taking activities. The structure of FNB United’s loan and deposit portfolios is such that a significant decline in interest rates may adversely impact net market values and net interest income. FNB United does not maintain a trading account nor is FNB United subject to currency exchange risk or commodity price risk. Interest rate risk is monitored as part of FNB United’s asset/liability management function, which is discussed in “Asset/Liability Management and Interest Rate Sensitivity” above. The use of interest rate swaps in conjunction with asset/liability management objectives is discussed in Note 1 to the accompanying consolidated financial statements.
Table 5 presents information about the contractual maturities, average interest rates and estimated values at current rates of financial instruments considered market risk sensitive at December 31, 2009.
30
Table of Contents
Table 5
Market Risk Analysis of Financial Instruments
| (dollars in thousands) | Contractual Maturities at December 31, 2009 | |||||||||||||||||||||||||
| 2010 | 2011 | 2012 | 2013 | 2014 | Beyond Five Years |
Total | Average Interest Rate (1) |
Estimated Value at Current Rates | ||||||||||||||||||
| Financial Assets |
||||||||||||||||||||||||||
| Debt securities (2): |
||||||||||||||||||||||||||
| Fixed rate |
$ | 13,602 | $ | 10,015 | $ | 23,531 | $ | 13,676 | $ | 3,670 | $ | 206,867 | $ | 271,361 | 6.42% | $ | 277,556 | |||||||||
| Variable rate |
- | - | - | - | - | 47,436 | 47,436 | 8.71% | 49,427 | |||||||||||||||||
| Equity securities (2) |
- | - | - | - | - | 2,667 | 2,667 | 15.56% | 2,168 | |||||||||||||||||
| Loans (3): |
||||||||||||||||||||||||||
| Fixed rate |
65,553 | 45,656 | 63,285 | 52,001 | 74,466 | 156,506 | 457,467 | 6.70% | 459,114 | |||||||||||||||||
| Variable rate |
520,378 | 141,166 | 45,546 | 41,480 | 41,095 | 315,889 | 1,105,554 | 3.82% | 1,032,462 | |||||||||||||||||
| Held for sale |
58,219 | - | - | - | - | - | 58,219 | 1.99% | 58,219 | |||||||||||||||||
| Interest-bearing bank balances |
98 | - | - | - | - | - | 98 | 1.01% | 98 | |||||||||||||||||
| Federal funds sold |
- | - | - | - | - | - | - | 0.00% | - | |||||||||||||||||
| Other earning assets |
18,247 | - | - | - | - | - | 18,247 | 2.00% | 18,247 | |||||||||||||||||
| Total |
$ | 676,097 | $ | 196,837 | $ | 132,362 | $ | 107,157 | $ | 119,231 | $ | 729,365 | $ | 1,961,049 | 4.91% | $ | 1,897,291 | |||||||||
| Financial Liabilities |
||||||||||||||||||||||||||
| Interest-bearing demand deposits |
$ | - | $ | - | $ | - | $ | - | $ | - | $ | 226,696 | $ | 226,696 | 1.13% | $ | 199,620 | |||||||||
| Savings deposits |
- | - | - | - | - | 40,723 | 40,723 | 0.26% | 29,758 | |||||||||||||||||
| Money market deposits |
- | - | - | - | - | 326,958 | 326,958 | 1.42% | 319,783 | |||||||||||||||||
| Time deposits: |
||||||||||||||||||||||||||
| Fixed rate |
790,317 | 95,063 | 62,450 | 1,551 | 10,810 | 492 | 960,683 | 2.04% | 971,545 | |||||||||||||||||
| Variable rate |
3,817 | 10,489 | 240 | - | - | - | 14,546 | 5.24% | 14,717 | |||||||||||||||||
| Retail repurchase agreements |
- | - | - | - | - | - | 13,592 | 0.70% | 13,592 | |||||||||||||||||
| Federal Home Loan Bank advances |
||||||||||||||||||||||||||
| Fixed rate |
9,000 | 20,000 | 25,000 | 20,000 | 14,887 | 68,278 | 157,165 | 3.35% | 162,529 | |||||||||||||||||
| Variable rate |
9,000 | - | - | - | - | - | 9,000 | 0.36% | 9,000 | |||||||||||||||||
| Federal funds purchased |
10,000 | - | - | - | - | - | 10,000 | 0.25% | 10,000 | |||||||||||||||||
| Subordinated debt |
- | - | - | - | - | - | 15,000 | 4.44% | 15,000 | |||||||||||||||||
| Trust preferred securities |
- | - | - | - | - | - | 56,702 | 3.03% | 43,257 | |||||||||||||||||
| Total |
$ | 822,134 | $ | 125,552 | $ | 87,690 | $ | 21,551 | $ | 25,697 | $ | 663,147 | $ | 1,831,065 | 1.94% | $ | 1,788,801 | |||||||||
(1) The average interest rate related to debt securities is stated on a fully taxable equivalent basis, assuming a 35% federal income tax rate.
(2) Contractual maturities of debt and equity securities are based on amortized cost.
(3) Nonaccrual loans are included in the balance of loans. The allowance for loan losses is excluded.
For a further discussion on market risk and how FNB United addresses this risk, see Item 7A of this Annual Report on Form 10-K.
Capital Adequacy
Under guidelines established by the Board of Governors of the Federal Reserve System, capital adequacy is currently measured for regulatory purposes by certain risk-based capital ratios, supplemented by a leverage capital ratio. The risk-based capital ratios are determined by expressing allowable capital amounts, defined in terms of Tier 1 and Tier 2, as a percentage of risk-weighted assets, which are computed by measuring the relative credit risk of both the asset categories on the balance sheet and various off-balance sheet exposures. Tier 1 capital consists primarily of common shareholders’ equity and qualifying perpetual preferred stock and qualifying trust preferred securities, net of goodwill and other disallowed intangible assets. Tier 2 capital, which is limited to the total of Tier 1 capital, includes allowable amounts of subordinated debt, mandatory convertible debt, preferred stock, trust preferred securities and the allowance for loan losses. Total capital, for risk-based purposes, consists of the sum of Tier 1 and Tier 2 capital. Under current requirements, the minimum total risk based capital ratio is 8.0% and the minimum Tier 1 capital ratio is 4.0%. The Company anticipates that it will be subject to increased minimum capital requirements as part of an expected formal agreement with the Comptroller of the Currency. At December 31, 2009, FNB United and the Bank had total risk based capital ratios of 10.3% and 10.1%, respectively, and Tier 1 risk based capital ratios of 6.9% and 8.0%, respectively. For further discussion on capital strategies, refer to “Management’s Plans and Intentions” above.
31
Table of Contents
Table 6
Regulatory Capital
| (dollars in thousands) | For year ended December 31, | ||||||||||||||
| 2009 | 2008 | 2007 | |||||||||||||
| Total capital to risk-weighted assets |
|||||||||||||||
| Consolidated |
$ | 181,990 | 10.3 % | $ | 185,312 | 10.4 % | $ | 172,893 | 10.4 % | ||||||
| Subsidiary Bank |
178,023 | 10.1 | 182,084 | 10.2 | 172,061 | 10.4 | |||||||||
| Tier 1 capital to risk-weighted assets |
|||||||||||||||
| Consolidated |
121,207 | 6.9 | 123,796 | 6.9 | 133,114 | 8.0 | |||||||||
| Subsidiary Bank |
140,604 | 8.0 | 144,654 | 8.1 | 154,098 | 9.3 | |||||||||
| Tier 1 capital to average assets |
|||||||||||||||
| Consolidated |
121,207 | 5.7 | 123,796 | 6.1 | 133,114 | 7.5 | |||||||||
| Subsidiary Bank |
140,604 | 6.6 | 144,654 | 7.2 | 154,098 | 8.8 | |||||||||
The leverage capital ratio, which serves as a minimum capital standard, considers Tier 1 capital only and is expressed as a percentage of average total assets for the most recent quarter, after reduction of those assets for goodwill and other disallowed intangible assets at the measurement date. As currently required, the minimum leverage capital ratio is 4.0%. At December 31, 2009, FNB United and the Bank had leverage capital ratios of 5.7% and 6.6%, respectively.
The Bank is also required to comply with prompt corrective action provisions established by the Federal Deposit Insurance Corporation Improvement Act. To be categorized as well-capitalized, a bank must have a minimum ratio for total capital of 10.0%, for Tier 1 capital of 6.0% and for leverage capital of 5.0%. As noted above, the Bank met all of those ratio requirements at December 31, 2009 and, accordingly, is well-capitalized under the regulatory framework for prompt corrective action.
Balance Sheet Review
Total assets increased $56.9 million, or 3%, in 2009 and $137.9 million, or 7%, in 2008. By similar comparison, deposits increased $207.4 million, or 14%, and $73.7 million, or 5%, respectively in 2009 and 2008. The level of total assets was also affected in 2009 by a net increase of $93.0 million as a direct result of a leveraging strategy through the investment portfolio to offset the cost of dividends payable on the preferred stock issued through the Capital Purchase Program. The average asset growth rates were 6% in 2009 and 10% in 2008. The corresponding average deposit growth rates were 11% and 3% in 2009 and 2008, respectively. The Company also recorded an impairment charge of $52.4 million to write down the final portion of goodwill, leaving no balance on the Company’s consolidated balance sheet as of year-end 2009. In addition the Company recorded $22.3 million in deferred tax valuation allowance.
Investment Securities
Investments are carried on the consolidated balance sheet at estimated fair value for available-for-sale securities and at amortized cost for held-to-maturity securities. Table 7 presents information, on the basis of selected maturities, about the composition of the investment securities portfolio for each of the last two years.
Table 7
Investment Securities Portfolio Analysis
The following table presents the amortized costs, fair value and weighted-average yield of securities by contractual maturity at December 31, 2009. The average yields are based on the amortized cost. In some cases, the issuers may have the right to call or prepay obligations without call or prepayment penalties prior to the contractual maturity date. Rates are calculated on a fully tax-equivalent basis using a 35% federal income tax rate.
32
Table of Contents
Available-for-Sale
| (dollars in thousands) | Within 1 Year |
1 to 5 Years | 5 to 10 Years |
Over 10 Years |
Total | ||||||||||
| Amortized Cost |
|||||||||||||||
| Obligations of: |
|||||||||||||||
| U.S. Treasury and government agencies |
$ | - | $ | 61 | $ | - | $ | - | $ | 61 | |||||
| U.S. government sponsored agencies |
- | 32,395 | 33,031 | 6,270 | 71,696 | ||||||||||
| States and political subdivisions |
4,043 | 6,833 | 15,806 | 18,582 | 45,264 | ||||||||||
| Residential mortgage-backed securities |
- | - | - | 99,307 | 99,307 | ||||||||||
| Equity securities |
- | - | - | 2,667 | 2,667 | ||||||||||
| Corporate notes |
7,971 | 5,939 | - | - | 13,910 | ||||||||||
| Total available-for-sale securities |
$ | 12,014 | $ | 45,228 | $ | 48,837 | $ | 126,826 | $ | 232,905 | |||||
| Fair Value |
|||||||||||||||
| Obligations of: |
|||||||||||||||
| U.S. Treasury and government agencies |
$ | - | $ | 63 | $ | - | $ | - | $ | 63 | |||||
| U.S. government sponsored agencies |
- | 33,278 | 33,406 | 6,283 | 72,967 | ||||||||||
| States and political subdivisions |
4,057 | 6,989 | 15,763 | 19,619 | 46,428 | ||||||||||
| Residential mortgage-backed securities |
- | - | - | 101,613 | 101,613 | ||||||||||
| Collateralized debt obligations |
- | - | - | 45 | 45 | ||||||||||
| Equity securities |
- | - | - | 2,168 | 2,168 | ||||||||||
| Corporate notes |
8,081 | 6,265 | - | - | 14,346 | ||||||||||
| Total available-for-sale securities |
$ | 12,138 | $ | 46,595 | $ | 49,169 | $ | 129,728 | $ | 237,630 | |||||
| Total average yield |
4.91% | 4.42% | 4.55% | 4.46% | 4.49% | ||||||||||
| Held-to-Maturity | |||||||||||||||
| (dollars in thousands)
|
Within 1 Year |
1 to 5 Years | 5 to 10 Years |
Over 10 Years |
Total | ||||||||||
| Amortized Cost |
|||||||||||||||
| Obligations of: |
|||||||||||||||
| States and political subdivisions |
$ | 1,555 | $ | 4,678 | $ | 5,906 | $ | 1,779 | $ | 13,918 | |||||
| Residential mortgage-backed securities |
- | - | - | 52,127 | 52,127 | ||||||||||
| Commercial mortgage-backed securities |
- | - | - | 21,513 | 21,513 | ||||||||||
| Corporate notes |
- | 1,001 | - | - | 1,001 | ||||||||||
| Total held-to-maturity securities |
$ | 1,555 | $ | 5,679 | $ | 5,906 | $ | 75,419 | $ | 88,559 | |||||
| Fair Value |
|||||||||||||||
| Obligations of: |
|||||||||||||||
| States and political subdivisions |
$ | 1,566 | $ | 4,884 | $ | 6,136 | $ | 1,818 | $ | 14,404 | |||||
| Residential mortgage-backed securities |
- | - | - | 53,022 | 53,022 | ||||||||||
| Commercial mortgage-backed securities |
- | - | - | 23,232 | 23,232 | ||||||||||
| Corporate notes |
- | 863 | - | - | 863 | ||||||||||
| Total held-to-maturity securities |
$ | 1,566 | $ | 5,747 | $ | 6,136 | $ | 78,072 | $ | 91,521 | |||||
| Total average yield |
2.67% | 3.39% | 3.75% | 8.80% | 8.01% | ||||||||||
The following table presents the amortized costs, fair value and weighted-average yield of securities by contractual maturity at December 31, 2008. The average yields are based on the amortized cost. In some cases, the issuers may have the right to call or prepay obligations without call or prepayment penalties prior to the contractual maturity date. Rates are calculated on a fully tax-equivalent basis using a 35% federal income tax rate.
33
Table of Contents
Available-for-Sale
| (dollars in thousands) | Within 1 Year |
1 to 5 Years | 5 to 10 Years |
Over 10 Years |
Total | ||||||||||
| Amortized Cost |
|||||||||||||||
| Obligations of: |
|||||||||||||||
| U.S. Treasury and government agencies |
$ | - | $ | 101 | $ | - | $ | - | $ | 101 | |||||
| U.S. government sponsored agencies |
11,957 | 32,278 | 47,740 | - | 91,975 | ||||||||||
| States and political subdivisions |
1,716 | 11,286 | 13,308 | 12,026 | 38,336 | ||||||||||
| Residential mortgage-backed securities |
- | - | - | 66,583 | 66,583 | ||||||||||
| Collateralized debt obligations |
- | - | - | 4,962 | 4,962 | ||||||||||
| Equity securities |
- | - | - | 2,667 | 2,667 | ||||||||||
| Corporate notes |
1,448 | - | - | - | 1,448 | ||||||||||
| Total available-for-sale securities |
$ | 15,121 | $ | 43,665 | $ | 61,048 | $ | 86,238 | $ | 206,072 | |||||
| Fair Value |
|||||||||||||||
| Obligations of: |
|||||||||||||||
| U.S. Treasury and government agencies |
$ | - | $ | 101 | $ | - | $ | - | $ | 101 | |||||
| U.S. government sponsored agencies |
12,147 | 33,152 | 49,063 | - | 94,362 | ||||||||||
| States and political subdivisions |
1,727 | 11,559 | 13,594 | 12,034 | 38,914 | ||||||||||
| Residential mortgage-backed securities |
- | - | - | 68,118 | 68,118 | ||||||||||
| Collateralized debt obligations |
- | - | - | 652 | 652 | ||||||||||
| Equity securities |
- | - | - | 1,829 | 1,829 | ||||||||||
| Corporate notes |
1,450 | - | - | - | 1,450 | ||||||||||
| Total available-for-sale securities |
$ | 15,324 | $ | 44,812 | $ | 62,657 | $ | 82,633 | $ | 205,426 | |||||
| Total average yield |
4.44% | 4.24% | 4.80% | 5.30% | 4.90% | ||||||||||
| Held-to-Maturity | |||||||||||||||
| (dollars in thousands)
|
Within 1 Year |
1 to 5 Years | 5 to 10 Years |
Over 10 Years |
Total | ||||||||||
| Amortized Cost |
|||||||||||||||
| Obligations of: |
|||||||||||||||
| U.S. government sponsored agencies |
$ | 2,008 | $ | - | $ | - | $ | - | $ | 2,008 | |||||
| States and political subdivisions |
1,770 | 5,134 | 6,768 | 2,694 | 16,366 | ||||||||||
| Residential mortgage-backed securities |
- | - | - | 8,420 | 8,420 | ||||||||||
| Corporate notes |
- | 1,000 | - | - | 1,000 | ||||||||||
| Total held-to-maturity securities |
$ | 3,778 | $ | 6,134 | $ | 6,768 | $ | 11,114 | $ | 27,794 | |||||
| Fair Value |
|||||||||||||||
| Obligations of: |
|||||||||||||||
| U.S. government sponsored agencies |
$ | 2,047 | $ | - | $ | - | $ | - | $ | 2,047 | |||||
| States and political subdivisions |
1,776 | 5,164 | 6,771 | 2,574 | 16,285 | ||||||||||
| Residential mortgage-backed securities |
- | - | - | 8,536 | 8,536 | ||||||||||
| Corporate notes |
- | 712 | - | - | 712 | ||||||||||
| Total held-to-maturity securities |
$ | 3,823 | $ | 5,876 | $ | 6,771 | $ | 11,110 | $ | 27,580 | |||||
| Total average yield |
3.17% | 3.23% | 3.68% | 5.60% | 4.32% | ||||||||||
Additions to the investment securities portfolio depend to a large extent on the availability of investable funds that are not otherwise needed to satisfy loan demand.
Loans
FNB United’s primary source of revenue and largest component of earning assets is the loan portfolio. In 2009, loans decreased $22.2 million, or 1%, due to reduction in loan demand stemming from ongoing uncertainty in the
34
Table of Contents
general economy and the market. In 2008, loans increased $139.1 million, or 10%, due entirely to internal loan generation. In 2007, loans increased $144.3 million, or 11%, also due to internal loan generation.
Table 8 sets forth the major categories of loans for each of the last five years. The maturity distribution and interest rate sensitivity of selected loan categories at December 31, 2009 are presented in Table 9.
Table 8
Loan Portfolio Composition
| (dollars in thousands) | December 31, | |||||||||||||||||||||||||||||
| 2009 | 2008 | 2007 | 2006 | 2005 | ||||||||||||||||||||||||||
| Loans held for sale |
$ | 58,219 | $ | 36,138 | $ | 17,586 | $ | 20,862 | $ | 17,615 | ||||||||||||||||||||
| Loans held for investment: |
||||||||||||||||||||||||||||||
| Commercial and agricultural |
$ | 194,134 | 12.4 | % | $ | 184,909 | 11.7 | % | $ | 182,713 | 12.6 | % | $ | 315,184 | 24.2 | % | $ | 176,286 | 22.2 | % | ||||||||||
| Real estate-construction |
394,427 | 25.2 | 453,668 | 28.6 | 373,401 | 25.8 | 278,124 | 21.4 | 142,096 | 17.9 | ||||||||||||||||||||
| Real estate-mortgage: |
||||||||||||||||||||||||||||||
| 1-4 family residential |
398,134 | 25.5 | 369,948 | 23.3 | 331,194 | 22.9 | 319,182 | 24.5 | 231,071 | 29.1 | ||||||||||||||||||||
| Commercial |
529,822 | 33.9 | 540,192 | 34.1 | 522,737 | 36.2 | 350,261 | 26.9 | 221,457 | 27.8 | ||||||||||||||||||||
| Consumer |
46,504 | 3.0 | 36,478 | 2.3 | 36,071 | 2.5 | 39,089 | 3.0 | 24,141 | 3.0 | ||||||||||||||||||||
| Total |
$ | 1,563,021 | 100.0 | % | $ | 1,585,195 | 100.0 | % | $ | 1,446,116 | 100.0 | % | $ | 1,301,840 | 100.0 | % | $ | 795,051 | 100.0 | % | ||||||||||
In 2009, loans held for sale increased over 61%. This increase is a result of higher mortgage originations due to heavy refinancing activity as rates fell throughout 2009. Held for sale loans do not include any reclassifications from the held for investment portfolio. The held for investment portfolio experienced small composition changes primarily with a 3.4% decrease in real estate construction loans partially offset by a 2.2% increase in 1-4 family residential mortgages and a 0.7% increase in consumer loans. In 2008 the held for investment portfolio experienced small composition changes primarily with a 2.8% increase in real estate construction loans offset by a 2% decrease in commercial real estate mortgages.
Table 9
Selected Loan Maturities
| (dollars in thousands) | December 31, 2009 | |||||||||||
| One Year or Less |
One to Five Years |
Over Five Years |
Total | |||||||||
| Commercial and agricultural |
$ | 87,623 | $ | 34,568 | $ | 71,943 | $ | 194,134 | ||||
| Real estate construction |
238,770 | 139,186 | 16,471 | 394,427 | ||||||||
| Total |
$ | 326,393 | $ | 173,754 | $ | 88,414 | $ | 588,561 | ||||
| Sensitivity to rate changes: |
||||||||||||
| Fixed interest rates |
$ | 24,407 | $ | 48,644 | $ | 17,770 | $ | 90,821 | ||||
| Variable interest rates |
301,986 | 125,110 | 70,644 | 497,740 | ||||||||
| Total |
$ | 326,393 | $ | 173,754 | $ | 88,414 | $ | 588,561 | ||||
Asset Quality
Management considers the asset quality of the Bank to be of primary importance. A formal loan review function, independent of loan origination, is used to identify and monitor problem loans. As part of the loan review function, a third-party assessment group has been employed to review the underwriting documentation and risk grading analysis. Beginning in 2010, the formal loan review function will be brought in-house to provide more timely response. This function will be managed by credit administration, which is independent of loan origination.
Nonperforming assets
Nonperforming assets are comprised of nonaccrual loans, accruing loans past due 90 days or more, repossessed assets and other real estate owned (“OREO”). Nonperforming loans are loans placed in nonaccrual status when, in
35
Table of Contents
management’s opinion, the collection of all or a portion of interest becomes doubtful. Loans are returned to accrual status when the factors indicating doubtful collectability cease to exist and the loan has performed in accordance with its terms for a demonstrated period of time. OREO represents real estate acquired through foreclosure or deed in lieu of foreclosure and is generally carried at fair value, less estimated costs to sell.
The level of nonperforming loans increased significantly from $96.0 million, or 6.06% of loans held for investment at December 31, 2008, to $174.6 million, or 11.16% of loans held for investment at December 31, 2009. OREO was $35.2 million at December 31, 2009, compared to $6.5 million at December 31, 2008. General downward economic trends, increasing unemployment and the depressed housing market in particular have negatively affected the credit performance of the residential real estate development and construction sectors of the Bank’s commercial portfolio in particular, and consumer credit more generally, resulting in additional delinquencies and loans placed on nonaccrual.
The softening of the real estate market through 2009 has adversely affected the Company’s net income. Real estate lending (including commercial, construction, land development, and residential) is a large portion of the Bank’s loan portfolio. These categories constitute $1.3 billion, or approximately 85%, of the Bank’s total loan portfolio. These categories are generally affected by changes in economic conditions, fluctuations in interest rates and the availability of loans to potential purchasers, changes in tax and other laws and acts of nature. A downturn in the real estate markets in which the Company originates, purchases, and services mortgage and other loans could hurt its business because these loans are secured by real estate. Further declines will adversely affect the Company’s future earnings.
Allowance for Loan Losses
In determining the allowance for loan losses and any resulting provision to be charged against earnings, particular emphasis is placed on the results of the loan review process. Consideration is also given to a review of individual loans, historical loan loss experience, the value and adequacy of collateral, and economic conditions in the Bank’s market area. For loans determined to be impaired, the allowance is based on discounted cash flows using the loan’s initial effective interest rate or the fair value of the collateral for certain collateral dependent loans. This evaluation is inherently subjective as it requires material estimates, including the amounts and timing of future cash flows expected to be received on impaired loans, that may be susceptible to significant change. In addition, the Office of the Comptroller of the Currency (OCC), a federal regulatory agency, as an integral part of its examination process, periodically reviews the Bank’s allowance for loan losses. The OCC may require the Bank to recognize changes to the allowance based on its judgments about information available to it at the time of its examinations. Loans are charged off when, in the opinion of management, they are deemed to be uncollectible. Recognized losses are charged against the allowance, and subsequent recoveries are added to the allowance.
Transition to New Allowance for Loan and Lease Losses (ALLL) Model
The Company has implemented a new loan loss software program. It is a modeling tool that automates bulk portfolio data entry and controls the critical processes and calculations necessary to determine a level of reserves that is adequate to protect the Company’s capital from lending risks. The methodology was independently validated by the Bank’s Internal Audit department using the 2006 Interagency Policy Statement on the ALLL and approved by the Audit and Credit Management Committees of the Bank’s Board of Directors for use in the Bank’s ALLL calculation. The methodology and the estimation process for calculating the ALLL using the new model are described below. Some of the features of the model are:
| • | Captures loan data consistently through an automatic download from the Company’s core loan account processing system. |
| • | Automates loan pooling based on the Company’s criteria. |
| • | Stores historical pool information (balances, losses, recoveries). |
| • | Quarantines impaired loans, and the related impairment, from unimpaired pool analysis and calculation of general reserves. |
| • | Provides a framework for storing and applying loss rates assigned to the qualitative and environmental (Q&E) factors incorporated in the ALLL. |
Methodology and Calculation of the ALLL: Estimated credit losses should meet the criteria for accrual of a loss contingency, i.e., a provision to the ALLL, set forth in generally accepted accounting principles (GAAP). The Company’s methodology for determining the ALLL is based on the requirements of GAAP, the Interagency Policy Statement on the Allowance for Loan and Lease Losses and other regulatory and accounting pronouncements. The
36
Table of Contents
ALLL is determined by the sum of three separate components: (i) the impaired loan component, which addresses specific reserves for impaired loans; (ii) the general reserve component, which addresses reserves for pools of homogeneous loans; and (iii) an unallocated reserve component (if any) based on management’s judgment and experience. The loan pools and impaired loans are mutually exclusive; any loan that is impaired should be excluded from its homogenous pool for purposes of that pool’s reserve calculation, regardless of the level of impairment. However, the Bank has established a de minimis threshold for loan exposures, that if found to be impaired, will have impairment determined by applying the same general reserve rate as non-impaired loans within the same pool.
Significant revisions from the methodology of the old allowance model to that of the new model are:
| • | Previously, losses were assigned to “vintage” risk grade coding, as of two years prior to actual charge. In the new model, loss assignment vintage is risk grade as of four quarters prior to the quarter in which the loss occurred. Vintage risk grade loss assignment is a technique of varying practice in the banking industry. A two-year vintage was adopted by the Bank many years ago when historical loss experience was much lighter and problem loans were slower to develop and exhibit deterioration leading to ultimate loss. |
| • | Previously, the Bank employed a modeling technique referred to as “compulsory regression,” that is, within each pool historical loss experience was required to be regressive from the worst passing grade to the highest risk grade. In the new model, the historical loss experience of all passing grades is computed on a consolidated basis, and experientially-derived loss rates for all portfolio segments are purely statistical. |
| • | In the new model, Qualitative and Environmental Factors, on a pool-weighted basis, are presently 4.5 times higher than they were for recent analysis periods’ quarters under the old model. See the following discussion under “Qualitative and Environmental (‘Q&E’) Loss Factors.” |
Management applies two primary components during the loan review process to determine proper allowance levels. The two components are a specific loan loss allocation for loans that are deemed impaired and a general loan loss allocation for those loans not specifically allocated. The methodology to analyze the adequacy of the allowance for loan losses is as follows:
| ¡ | identification of specific impaired loans by loan category; |
| ¡ | specific loans that could have potential loss; |
| ¡ | calculation of specific allowances where required for the impaired loans based on collateral and other objective and quantifiable evidence; |
| ¡ | determination of homogenous pools by loan category and risk grade, reduced by the impaired loans; |
| ¡ | application of historical loss percentages to pools to determine the allowance allocation; and |
| ¡ | application of Q&E factor adjustment percentages to historical losses for trends or changes in the loan portfolio. |
Loans are considered impaired when, based on current information and events, it is probable that the creditor will be unable to collect all interest and principal payments due according to the originally contracted, or reasonably modified, terms of the loan agreement. The Bank has determined that loans that meet the criteria defined below must be reviewed quarterly to determine if they are impaired.
| • | All commercial loans classified substandard or worse. |
| • | Any other delinquent loan that is in a nonaccrual status, or any loan that is delinquent more than 89 days and still accruing interest. |
| • | Any loan which has been modified such that it meets the definition of Troubled Debt Restructure (TDR). |
Any loan determined to be impaired is subjected to an impairment analysis, which is a calculation of the portion of the loan which is probable not to be repaid. This portion is the loan’s “impairment”, and is established as a specific reserve against the loan, or charged against the ALLL. All information related to the calculation of the impairment, including internal or external collateral valuations, assumptions, calculations, etc. is documented.
Individual specific reserve amounts imply probability of loss and may not be carried in the reserve indefinitely. When the amount of the actual loss becomes reasonably quantifiable, the amount of the loss is charged off against the ALLL, whether or not all liquidation and recovery efforts have been completed. If the total amount of the individual specific reserve that will eventually be charged off cannot yet be sufficiently quantified, but some portion of the impairment can be viewed as an imminent loss, that smaller portion should be charged off against the ALLL and the individual specific reserve reduced by a corresponding amount. It is acceptable to retain an estimate of remaining loss as a specific reserve only when said estimate is not reasonably quantifiable.
37
Table of Contents
The ALLL policy for pooled loans is governed in accordance with banking regulatory guidance for homogenous pools of non-impaired loans that have similar risk characteristics. The Company follows a consistent and structured approach for assessing the need for reserves within each individual loan pool.
Historical Loss Rates: The Company has pooled its loans according to the loan segmentation regime employed on schedule RC-C of the FFIEC’s Consolidated Reports of Condition and Income (the “Call Report”). Within each segment, the pools are further divided according to risk grade categories of “pass” (RGs 1-5), special mention (RG 6), substandard (RG 7), and doubtful (RG 8). Individual loan account balances, with their pool data, are downloaded into the model from the Company’s core account processing system and grouped within their respective pools. The summary loan balances are manually re-entered for each pool for purposes of calculating historical loss rates.
Historical loss data have been catalogued by the Company and are manually entered into the model for each pool. The risk-graded pool to which the loss is assigned is the risk-grade assigned to the loan at the quarter end, four quarters earlier. Historical loss recoveries are similarly entered, if significant, and applied against the non-classified pools according to the Call Report designations of the loans originally charged. Historical loss data is also used to estimate the loss horizon for each pool which is entered manually into the model for each pool.
Q&E Loss Factors: The model incorporates various internal and external qualitative and environmental factors as described in the Interagency Policy Statement on the Allowance for Loan and Lease Losses dated December 2006. Input for these factors is determined on the basis of management observation, judgment, and experience. The factors utilized by the Company in the model are as follows:
| a) | Standard – Accounts for inherent uncertainty in using the past as a predictor of the future. Uniform across all segments. |
| b) | Volume – Accounts for historical growth characteristics of the portfolio over the loss recognition period. |
| c) | Terms –Measures risk derived from granting terms outside of policy and underwriting guidelines. |
| d) | Staff – Reflects staff competence in various types of lending. |
| e) | Delinquency – Reflects increased risk deriving from higher delinquency rates. |
| f) | Nonaccrual – Reflects increased risk of loans with characteristics that merit nonaccrual status. |
| g) | Migration – Accounts for the changing level of risk inherent in loans as they migrate into, or away from, more adverse risk grades. |
| h) | Concentration – Measures increased risk derived from concentration of credit exposure in particular industry segments within the portfolio. |
| i) | Production – Measures impact of anticipated growth and potential risk derived from new loan production. |
| j) | Process – Measures increased risk derived from more demanding processing requirements directed towards risk mitigation. |
| k) | Economic – Impact of general and local economic factors are the largest single factor affecting portfolio risk and effect is felt uniformly across pools. |
| l) | Competition – Measures risk associated with bank’s potential response to competitors’ relaxed credit requirements. |
| m) | Regulatory and Legal – Measures risk from exposure to regulations, legislation, and legal code that result in increased risk of loss. |
| n) | Transition Risk – Represents transition risk towards changing ALLL models. It is anticipated that this factor will be reduced to zero in the future. Uniform across all segments. |
Each pool is assigned an “additional” potential loss percentage by assessing its characteristics against each of the factors listed above. These percentages are totaled across all factors for each pool.
Calculation and Summary: The model calculates the general reserve amount for each loan pool by adding the historical loss rate to the total Q&E factors, and applying the combined percentage to the pool loan balances. At the end of the general exercise, the level of general reserves moves from the previous period’s reserves consistently with changing risk levels within the portfolio and the trends in key performance indicators such as the level of nonaccrual loans, past due loans, etc.
Allowance for Loan Losses
The allowance for loan losses, as a percentage of loans held for investment, amounted to 3.16% at December 31, 2009 compared to 2.19% at December 31, 2008. Net charge-offs also significantly increased in 2009. A substantial
38
Table of Contents
portion of 2008 charge-offs were related to impaired loans, and consisted of loans considered wholly impaired and loans with partial impairment. During 2009, net charge-offs totaled $47.0 million, which exceeded the combined net charge-offs for the prior four years. The provision for loan losses recorded in 2009 also exceeded the combined provision recorded in the prior four years. As discussed previously, the increased levels of nonperforming assets and charge-offs resulted largely from loan quality issues driven by worsening macro and micro economic conditions, including strains in housing and real estate markets. Management continually performs thorough analyses of the loan portfolio. As a result of these analyses, certain loans have migrated to higher, more adverse risk grades and an aggressive posture towards the timely charge-off of identified impairment has also continued. Actual past due loans and loan charge-offs have remained at manageable levels and management continues to diligently work to improve asset quality. Management believes the allowance for loan losses of $49.5 million at December 31, 2009 is adequate to cover probable losses inherent in the loan portfolio; however, assessing the adequacy of the allowance is a process that requires considerable judgment.
Troubled debt restructurings generally occur when a borrower is experiencing, or is expected to experience, financial difficulties in the near-term. As a result, the Bank will work with the borrower to prevent further difficulties, and ultimately to improve the likelihood of recovery on the loan. To facilitate this process, a concessionary modification that would not otherwise be considered may be granted resulting in classification as a troubled debt restructuring. The Bank considers all troubled debt restructurings to be impaired loans. Troubled debt restructurings can involve loans remaining on nonaccrual, moving to nonaccrual, or continuing on accruing status, depending on the individual facts and circumstances of the borrower. Generally, a nonaccrual loan that is restructured remains on nonaccrual for a period of six months to demonstrate the borrower can meet the restructured terms. However, performance prior to the restructuring, or significant events that coincide with the restructuring, are considered in assessing whether the borrower can meet the new terms and may result in the loan being returned to accrual status after a shorter performance period. If the borrower’s ability to meet the revised payment schedule is not reasonably assured, the loan remains in a nonaccrual status.
The majority of the Bank’s loan modifications relates to commercial lending and involves extending the term of the loan. In these cases, the Bank does not typically lower the interest rate or forgive principal or interest as part of the loan modification. In addition, it is common for the Bank to seek additional collateral or guarantor support when modifying a loan. The amount of loan restructurings increased during 2009, as the Bank continues to work with borrowers who are experiencing financial difficulties. As a result of continued economic stress, the Bank anticipates that it will have further increases in loan restructurings during 2010.
The Bank’s criteria for nonperforming status, impaired status and troubled debt restructures have been described earlier. The following table presents the Bank’s level and composition of nonperforming loans:
| December 31, 2009 | December 31, 2008 | |||||||||||||||||
| Nonperforming Loans: | Balance | Impaired | Troubled Debt Restructures |
Balance | Impaired | Troubled Debt Restructures | ||||||||||||
| Current, nonaccrual |
$ | 62,471 | $ | 59,236 | $ | 62,471 | $ | 49,866 | $ | 46,126 | $ | - | ||||||
| Delinquent 30-89 days, nonaccrual |
17,626 | 17,626 | 9,504 | 17,699 | - | - | ||||||||||||
| Delinquent 90+ days, nonaccrual |
87,409 | 86,708 | 22,157 | 27,607 | 27,607 | - | ||||||||||||
| Delinquent 90+ days, accruing |
7,085 | 254 | - | 854 | - | - | ||||||||||||
| Total Nonperforming Loans |
$ | 174,592 | $ | 163,824 | $ | 94,133 | $ | 96,026 | $ | 73,734 | $ | - | ||||||
Nonperforming loans and impaired loans are overlapping sets of loans. Impaired loans are problem loans that may, or may not, have been placed into nonaccrual status. The complete repayment of principal and interest is considered probable for those impaired loans that have not been placed into a nonaccrual status, but not within contracted terms. The following table presents the level, composition, and accrual status of impaired loans, and the reserves associated with those loan balances:
| December 31, 2009 | December 31, 2008 | |||||||||||||||||
| Impaired Loans: | Balance | Nonaccrual | Associated Reserves |
Balance | Nonaccrual | Associated Reserves | ||||||||||||
| Impaired loans, not individually reviewed for impairment |
$ | 5,475 | $ | 5,295 | $ | 38 | $ | 33,262 | $ | 12,047 | $ | 299 | ||||||
| Impaired, individually reviewed, with no impairment |
84,751 | 59,903 | - | 48,086 | 46,682 | - | ||||||||||||
| Impaired, individually reviewed, with impairment |
98,372 | 98,372 | 28,868 | 34,660 | 32,704 | 15,032 | ||||||||||||
| Total Impaired Loans |
$ | 188,598 | $ | 163,570 | $ | 28,906 | $ | 116,008 | $ | 91,433 | $ | 15,332 | ||||||
39
Table of Contents
At December 31, 2009, the bank had 48 impaired loans exceeding $1.0 million each, with total impairment of $23.9 million, comprised by 31 borrowing relationships. The average carrying value of impaired loans was $140.7 million in 2009 and $38.1 million in 2008.
Troubled debt restructures are a subset of impaired loans. The following table presents the level, accrual status, and the reserves associated with these loan balances:
| December 31, 2009 | December 31, 2008 | |||||||||||||||||
| Troubled Debt Restructures: | Balance | Nonaccrual | Associated Reserves |
Balance | Nonaccrual | Associated Reserves | ||||||||||||
| TDRs with no impairment |
$ | 58,897 | $ | 34,334 | $ | - | $ | - | $ | - | $ | - | ||||||
| TDRs with impairment |
36,784 | 36,604 | 5,859 | - | - | - | ||||||||||||
| Total Troubled Debt Restructures |
$ | 95,681 | $ | 70,938 | $ | 5,859 | $ | - | $ | - | $ | - | ||||||
| The following table presents the composition of impaired loans across loan types, along with the accrual status and the associated reserves, by type:
| ||||||||||||||||||
| December 31, 2009 | December 31, 2008 | |||||||||||||||||
| Impaired Loans (composition across loan types): | Impaired | Nonaccrual | Associated Reserves |
Impaired | Nonaccrual | Associated Reserves | ||||||||||||
| Commercial and agricultural |
$ | 5,061 | $ | 4,930 | $ | 849 | $ | 3,747 | $ | 3,732 | $ | 900 | ||||||
| Real estate - construction |
100,459 | 99,583 | 17,839 | 67,467 | 66,063 | 11,345 | ||||||||||||
| Real estate - mortgage: |
||||||||||||||||||
| 1 - 4 family residential |
22,495 | 22,283 | 3,339 | 7,197 | 6,606 | 1,546 | ||||||||||||
| Commercial |
60,300 | 36,750 | 6,877 | 36,983 | 14,418 | 1,265 | ||||||||||||
| Consumer |
283 | 24 | 1 | 614 | 614 | 275 | ||||||||||||
| Total Impaired Loans |
$ | 188,598 | $ | 163,570 | $ | 28,906 | $ | 116,008 | $ | 91,433 | $ | 15,332 | ||||||
The Bank designates loans as “Special Mention” when the borrower’s financial condition or performance indicates that the loan may potentially become a problem loan. These loans are not classified as problem loans, nor are they impaired, and they have not been modified under conditions that require designation as troubled debt restructurings. At December 31, 2009, the Bank had designated $244.3 million as Special Mention loans, of which 2.34% were delinquent more than 30 days. Fifty-seven Special Mention loans had balances over $1,000,000 and comprised approximately 76% of the total. Approximately 58% of the total Special Mention loans were categorized as land acquisition, development, and construction loans, with non-owner occupied commercial rental properties approximating another 16% of that total. These categories are generally affected by changes in economic conditions, fluctuations in interest rates and the availability of loans to potential purchasers, changes in tax and other laws and acts of nature. In particular, a continuing trend of adverse economic conditions in the residential real estate market may result in Special Mention loans being individually reclassified as problem loans in the future.
40
Table of Contents
Table 10
Summary of Allowance for Loan Losses
Table 10 presents an analysis of the changes in the allowance for loan losses and of the level of nonperforming assets for each of the last five years as of December 31.
| (dollars in thousands) | 2009 | 2008 | 2007 | 2006 | 2005 | |||||||||||||||
| Balance, beginning of year |
$ | 34,720 | $ | 17,381 | $ | 15,943 | $ | 9,945 | $ | 7,293 | ||||||||||
| Chargeoffs: |
||||||||||||||||||||
| Commercial and agricultural |
3,417 | 6,479 | 1,262 | 1,817 | 747 | |||||||||||||||
| Real estate - construction |
32,737 | 2,000 | 459 | 499 | - | |||||||||||||||
| Real estate - mortgage |
9,789 | 414 | 941 | 210 | 449 | |||||||||||||||
| Consumer |
3,442 | 3,532 | 2,831 | 2,104 | 1,420 | |||||||||||||||
| Total chargeoffs |
49,385 | 12,425 | 5,493 | 4,630 | 2,616 | |||||||||||||||
| Recoveries: |
||||||||||||||||||||
| Commercial and agricultural |
70 | 292 | 415 | 1,123 | 427 | |||||||||||||||
| Real estate - construction |
544 | - | 42 | 120 | - | |||||||||||||||
| Real estate - mortgage |
264 | 197 | 171 | 268 | 7 | |||||||||||||||
| Consumer |
1,507 | 1,516 | 1,091 | 1,231 | 522 | |||||||||||||||
| Leases |
- | - | - | 3 | 65 | |||||||||||||||
| Total recoveries |
2,385 | 2,005 | 1,719 | 2,745 | 1,021 | |||||||||||||||
| Net chargeoffs |
47,000 | 10,420 | 3,774 | 1,885 | 1,595 | |||||||||||||||
| Provision charged to operations |
61,741 | 27,759 | 5,514 | 2,526 | 2,842 | |||||||||||||||
| Purchase accounting acquisition |
- | - | - | 6,038 | 1,405 | |||||||||||||||
| Adjustment for reserve for unfunded commitments |
- | - | - | (677) | - | |||||||||||||||
| Allowance adjustment for loans sold |
- | - | (302) | (4) | - | |||||||||||||||
| Balance, end of year |
$ | 49,461 | $ | 34,720 | $ | 17,381 | $ | 15,943 | $ | 9,945 | ||||||||||
| Nonperforming assets: |
||||||||||||||||||||
| Nonaccrual loans |
$ | 167,507 | $ | 95,173 | $ | 16,022 | $ | 8,282 | $ | 5,398 | ||||||||||
| Past due 90 days or more and still accruing interest |
7,085 | 853 | 2,686 | 2,852 | 648 | |||||||||||||||
| Total nonperforming loans |
174,592 | 96,026 | 18,708 | 11,134 | 6,046 | |||||||||||||||
| Other real estate owned |
35,170 | 6,509 | 2,862 | 3,361 | 929 | |||||||||||||||
| Foreclosed assets |
68 | 92 | 181 | 196 | 108 | |||||||||||||||
| Total nonperforming assets |
$ | 209,830 | $ | 102,627 | $ | 21,751 | $ | 14,691 | $ | 7,083 | ||||||||||
| Asset quality ratios: |
||||||||||||||||||||
| Net loan chargeoffs to average loans |
2.97 | % | 0.67 | % | 0.27 | % | 0.16 | % | 0.22 | % | ||||||||||
| Net loan chargeoffs to allowance for loan losses |
95.02 | 30.01 | 21.71 | 11.82 | 16.04 | |||||||||||||||
| Allowance for loan losses to loans held for investment |
3.16 | 2.19 | 1.20 | 1.22 | 1.25 | |||||||||||||||
| Total nonperforming loans to loans held for investment |
11.17 | 6.06 | 1.29 | 0.86 | 0.76 | |||||||||||||||
Management’s judgments are based on numerous assumptions about current events which it believes to be reasonable, but which may or may not be valid. Thus there can be no assurance that loan losses in future periods will not exceed the current allowance or that future increases in the allowance will not be required. No assurance can be given that management’s ongoing evaluation of the loan portfolio in light of changing economic conditions and other relevant circumstances will not require significant future additions to the allowance, thus adversely affecting the operating results of FNB United.
Information about management’s allocation of the allowance for loan losses by loan category is presented in the following table.
41
Table of Contents
Table 11
Allocations of Allowance for Loan Losses
| (dollars in thousands) | December 31, | |||||||||
| 2009 | 2008 | 2007 | 2006 | 2005 | ||||||
| Commercial and agricultural |
$ 3,678 | $ 4,146 | $ 2,777 | $ 4,474 | $ 3,165 | |||||
| Real estate - construction |
23,647 | 15,238 | 5,254 | 3,829 | 1,939 | |||||
| Real estate - mortgage |
19,435 | 8,853 | 6,599 | 5,745 | 3,892 | |||||
| Consumer |
2,382 | 3,474 | 2,751 | 1,895 | 707 | |||||
| Unallocated |
319 | 3,009 | - | - | 242 | |||||
| Total allowance for loan losses |
$ 49,461 | $ 34,720 | $ 17,381 | $ 15,943 | $ 9,945 | |||||
Deposits
The level and mix of deposits is affected by various factors, including general economic conditions, the particular circumstances of local markets and the specific deposit strategies employed. In general, broad interest rate declines tend to encourage customers to consider alternative investments such as mutual funds and tax-deferred annuity products, while interest rate increases tend to have the opposite effect.
In 2009, deposits increased $207.4 million, or 14%. Noninterest-bearing demand deposits increased slightly while there were increases in all types of interest-bearing accounts (demand, savings, money-market, and time deposits). Certificates of deposit increased 10.2% to $975.2 million, from $885.3 million in 2008 while other deposits increased 18.7% to $746.9 million compared to $629.5 million in 2008. Brokered certificates of deposit were $112.3 million, or 6.52% of total deposits, of which $90.5 million were in the Promontory Interfinancial Network, LLC CDARS program.
In 2008, deposits increased by $73.7 million, or 5%. Although the total balance of deposits changed minimally from 2007 to 2008, the mix of the various deposit categories reflects some shifts among categories. Noninterest-bearing demand deposits decreased while there were increases in all types of interest-bearing accounts (demand, savings, money-market, and time deposits). Certificates of deposit increased 8.3% to $885.3 million, from $817.7 million in 2007 while other deposits increased 1.1% to $629.9 million compared to $623.3 million in 2007. Brokered certificates of deposit were $90.1 million, or 5.95% of total deposits, of which $36.5 million were in the Promontory Interfinancial Network, LLC CDARS program.
Table 12 shows the year-end and average deposit balances for the years 2009, 2008 and 2007 and the changes in 2009 and 2008.
42
Table of Contents
Table 12
Analysis of Deposits
| 2009 | 2008 | 2007 | ||||||||||||||
| (dollars in thousands) | Change from Prior Year | Change from Prior Year |
||||||||||||||
| Balance | Amount | % | Balance | Amount | % | Balance | ||||||||||
| Year End Balances |
||||||||||||||||
| Interest-bearing deposits: |
||||||||||||||||
| Demand deposits |
$ 226,696 | $ 53,082 | 30.6 | $ 173,614 | $ 10,917 | 6.7 | $ 162,697 | |||||||||
| Savings deposits |
40,723 | 2,610 | 6.8 | 38,113 | (3,036) | (7.4 | ) | 41,149 | ||||||||
| Money market deposits |
326,958 | 59,462 | 22.2 | 267,496 | 7,189 | 2.8 | 260,307 | |||||||||
| Total |
594,377 | 115,154 | 24.0 | 479,223 | 15,070 | 3.2 | 464,153 | |||||||||
| Time deposits |
975,229 | 89,978 | 10.2 | 885,251 | 66,926 | 8.2 | 818,325 | |||||||||
| Total interest-bearing deposits |
1,569,606 | 205,132 | 15.0 | 1,364,474 | 81,996 | 6.4 | 1,282,478 | |||||||||
| Noninterest-bearing demand deposits |
152,522 | 2,249 | 1.5 | 150,273 | (8,291) | (5.2 | ) | 158,564 | ||||||||
| Total deposits |
$ 1,722,128 | $ 207,381 | 13.7 | $ 1,514,747 | $ 73,705 | 5.1 | $ 1,441,042 | |||||||||
| Average Balances |
||||||||||||||||
| Interest-bearing deposits: |
||||||||||||||||
| Demand deposits |
$ 198,343 | $ 30,451 | 18.1 | $ 167,892 | $ 4,454 | 2.7 | $ 163,438 | |||||||||
| Savings deposits |
40,301 | (502) | (1.2 | ) | 40,803 | (6,386) | (13.5 | ) | 47,189 | |||||||
| Money market deposits |
308,690 | 33,872 | 12.3 | 274,818 | 17,977 | 7.0 | 256,841 | |||||||||
| Total |
547,334 | 63,821 | 13.2 | 483,513 | 16,045 | 3.4 | 467,468 | |||||||||
| Time deposits |
940,138 | 97,894 | 11.6 | 842,244 | 28,313 | 3.5 | 813,931 | |||||||||
| Total interest-bearing deposits |
1,487,472 | 161,715 | 12.2 | 1,325,757 | 44,358 | 3.5 | 1,281,399 | |||||||||
| Noninterest-bearing demand deposits |
152,358 | (5,634) | (3.6 | ) | 157,992 | (1,213) | (0.8 | ) | 159,205 | |||||||
| Total deposits |
$ 1,639,830 | $ 156,081 | 10.5 | $ 1,483,749 | $ 43,145 | 3.0 | $ 1,440,604 | |||||||||
Capital Adequacy and Resources
Under guidelines established by the Board of Governors of the Federal Reserve System, capital adequacy is currently measured for regulatory purposes by certain risk-based capital ratios, supplemented by a leverage capital ratio. The risk-based capital ratios are determined by expressing allowable capital amounts, defined in terms of Tier 1 and Tier 2, as a percentage of risk-weighted assets, which are computed by measuring the relative credit risk of both the asset categories on the balance sheet and various off-balance sheet exposures. Tier 1 capital consists primarily of common shareholders’ equity and qualifying perpetual preferred stock and qualifying trust preferred securities, net of goodwill and other disallowed intangible assets. Tier 2 capital, which is limited to the total of Tier 1 capital, includes allowable amounts of subordinated debt, mandatory convertible debt, preferred stock, trust preferred securities and the allowance for loan losses. Total capital, for risk-based purposes, consists of the sum of Tier 1 and Tier 2 capital. Under current requirements, the minimum total capital ratio is 8.00% and the minimum Tier 1 capital ratio is 4.00%. At December 31, 2009, FNB United and the Bank had total risk-based capital ratios of 10.29% and 10.08%, respectively, and Tier 1 capital ratios of 6.86% and 7.96%, respectively. The Company anticipates that it will be subject to increased minimum capital requirements as part of an expected formal agreement with the Comptroller of the Currency. See “Management’s Plans and Intentions” above.
As shown in the accompanying table, FNB United and its wholly owned banking subsidiary have capital levels exceeding the minimum levels for “well capitalized” bank holding companies and banks as of December 31, 2009.
| Regulatory Guidelines | ||||||||
| Well Capitalized |
Adequately Capitalized |
FNB United | CommunityONE | |||||
| Total Capital |
10.00 % | 8.00 % | 10.29 % | 10.08 % | ||||
| Tier 1 Capital |
6.00 | 4.00 | 6.86 | 7.96 | ||||
| Leverage Capital |
5.00 | 4.00 | 5.68 | 6.60 | ||||
On February 13, 2009, the Company entered into a Letter Agreement and Securities Purchase Agreement (the “Purchase Agreement”) with the U.S. Treasury Department (“Treasury”) under the TARP Capital Purchase Program (the “CPP”) discussed below, pursuant to which the Company sold (i) 51,500 shares of Fixed Rate Cumulative
43
Table of Contents
Perpetual Preferred Stock, Series A (the “Series A Preferred Stock”) for $51,500,000 and (ii) a warrant (the “Warrant”) to purchase 2,207,143 shares of the Company’s common stock for an exercise price of $3.50 per share, or $7.7 million in the aggregate, in cash.
The warrant is immediately exercisable and expires 10 years from the date of issuance. Proceeds from this sale of the preferred stock are expected to be used for general corporate purposes, including supporting the capital needs of the Company. The CPP preferred stock is generally non-voting, other than having class voting rights on certain matters, and pays cumulative dividends quarterly at a rate of 5% per annum for the first five years and 9% thereafter. The preferred shares are redeemable at the option of the Company, subject to the approval of its primary federal regulator.
Pursuant to the terms of the Purchase Agreement, the ability of the Company to declare or pay dividends or distributions on its common stock is subject to restrictions, including a restriction against increasing dividends from the last quarterly cash dividend per share ($.10) declared on the common stock prior to October 14, 2008, as adjusted for subsequent stock dividends and other similar actions. In addition, as long as Series A Preferred Stock is outstanding, dividend payments are prohibited until all accrued and unpaid dividends are paid on such preferred stock, subject to certain limited exceptions.
The proceeds from the offering of the Series A Preferred Stock and related Warrant were allocated between the Series A Preferred Stock and Warrant based on their relative fair values. The Warrant was assigned a fair value of $1.76 per share, or $3.9 million in the aggregate. As a result, $3.9 million was recorded as the discount on the preferred stock obtained and will be accreted as a reduction in net income available for common shareholders over the next five years at approximately $0.1 million to $0.9 million per year. For purposes of these calculations, the fair value of the shares subject to the Warrant was estimated using the Black-Scholes option pricing model.
Recent Accounting and Reporting Developments
See Note 1 of the Consolidated Financial Statements for a discussion of recently issued or proposed accounting pronouncements.
Effects of Inflation
Inflation affects financial institutions in ways that are different from most commercial and industrial companies, which have significant investments in fixed assets and inventories. The effect of inflation on interest rates can materially impact bank operations, which rely on net interest margins as a major source of earnings. Noninterest expense, such as salaries and wages, occupancy and equipment cost, are also negatively affected by inflation.
Non-GAAP Measures
This Annual Report on Form 10-K contains financial information determined by methods other than in accordance with generally accepted accounting principles (“GAAP”). FNB United’s management uses these non-GAAP measures in their analysis of FNB United’s performance. These non-GAAP measures exclude average and core deposit premiums from the calculations of return on average assets and return on average equity. Management believes presentations of financial measures excluding the impact of goodwill and core deposit premiums provide useful supplemental information that is essential to a proper understanding of the operating results of FNB United’s core businesses. In addition, certain designated net interest income amounts are presented on a taxable equivalent basis. Management believes that the presentation of net interest income on a taxable equivalent basis aids in the comparability of net interest income arising from taxable and tax-exempt sources.
44
Table of Contents
These disclosures should not be viewed as a substitute for results determined in accordance with GAAP, nor are they necessarily comparable to non-GAAP performance measures that may be presented by other companies. The following reconciliation table provides a more detailed analysis of these non-GAAP measures:
| At and for the Years Ended December 31, | |||||||||||||||
| 2009 | 2008 | 2007 | 2006 | 2005 | |||||||||||
| Total shareholders’ equity |
$ | 98,359 | $ | 147,917 | $ | 216,256 | $ | 207,668 | $ | 102,315 | |||||
| Less: Preferred stock |
(48,205) | - | - | - | - | ||||||||||
| Less: Common stock warrant |
(3,891) | - | - | - | - | ||||||||||
| Common shareholders’ equity |
$ | 46,263 | $ | 147,917 | $ | 216,256 | $ | 207,668 | $ | 102,315 | |||||
| Total shareholders’ equity |
$ | 98,359 | $ | 147,917 | $ | 216,256 | $ | 207,668 | $ | 102,315 | |||||
| Less: |
|||||||||||||||
| Goodwill |
- | (52,395) | (110,195) | (110,956) | (31,381) | ||||||||||
| Core deposit and other intangibles |
(4,968) | (5,762) | (6,564) | (7,378) | (1,326) | ||||||||||
| Preferred stock |
(48,205) | - | - | - | - | ||||||||||
| Common stock warrant |
(3,891) | - | - | - | - | ||||||||||
| Tangible common shareholders’ equity |
$ | 41,295 | $ | 89,760 | $ | 99,497 | $ | 89,334 | $ | 69,608 | |||||
| Total shareholders’ equity |
$ | 98,359 | $ | 147,917 | $ | 216,256 | $ | 207,668 | $ | 102,315 | |||||
| Less: |
|||||||||||||||
| Goodwill |
- | (52,395) | (110,195) | (110,956) | (31,381) | ||||||||||
| Core deposit and other intangibles |
(4,968) | (5,762) | (6,564) | (7,378) | (1,326) | ||||||||||
| Tangible shareholders’ equity |
$ | 93,391 | $ | 89,760 | $ | 99,497 | $ | 89,334 | $ | 69,608 | |||||
| Total assets |
$ | 2,101,296 | $ | 2,044,434 | $ | 1,906,506 | $ | 1,815,582 | $ | 1,102,085 | |||||
| Less: |
|||||||||||||||
| Goodwill |
- | (52,395) | (110,195) | (110,956) | (31,381) | ||||||||||
| Core deposit and other intangibles |
(4,968) | (5,762) | (6,564) | (7,378) | (1,326) | ||||||||||
| Tangible assets |
$ | 2,096,328 | $ | 1,986,277 | $ | 1,789,747 | $ | 1,697,248 | $ | 1,069,378 | |||||
| Book value per common share |
$ | 4.05 | $ | 12.94 | $ | 18.93 | $ | 18.39 | $ | 16.06 | |||||
| Effect of intangible assets |
$ | (0.44) | $ | (5.09) | $ | (10.22) | $ | (9.83) | $ | (4.93) | |||||
| Tangible book value per common share |
$ | 3.61 | $ | 7.85 | $ | 8.71 | $ | 8.56 | $ | 11.13 | |||||
Application of Critical Accounting Policies
FNB United’s accounting policies are in accordance with accounting principles generally accepted in the United States and with general practice within the banking industry and are fundamental to understanding management’s discussion and analysis of results of operations and financial condition. FNB United’s significant accounting policies are discussed in detail in Note 1 of the consolidated financial statements.
Material estimates that are particularly susceptible to significant change in the near term relate to the determination of the allowance for loan losses and goodwill impairment. Actual results could differ from those estimates.
Allowance for Loan Losses
The allowance for loan losses, which is utilized to absorb actual losses in the loan portfolio, is maintained at a level consistent with management’s best estimate of probable loan losses incurred as of the balance sheet date. FNB United’s allowance for loan losses is also analyzed quarterly by management. This analysis includes a methodology that separates the total loan portfolio into homogeneous loan classifications for purposes of evaluating risk. The required allowance is calculated by applying a risk adjusted reserve requirement to the dollar volume of loans within a homogenous group. The Company has grouped its loans into pools according to the loan segmentation regime employed on schedule RC-C of the FFIEC’s Consolidated Reports of Condition and Income (the “Call Report”). Management also analyzes the loan portfolio on an ongoing basis to evaluate current risk levels, and risk grades are adjusted accordingly. While management uses the best information available to make evaluations, future adjustments may be necessary, if economic or other conditions differ substantially from the assumptions used. See additional discussion under “Asset Quality.”
45
Table of Contents
Goodwill
For the quarter ended September 30, 2009, the Company recorded an impairment charge of $52.4 million to write down the remaining portion of goodwill. No goodwill balance remains on the Company’s consolidated balance sheet as of year-end 2009.
The deteriorating economic conditions witnessed in 2008 and 2009 have significantly affected the banking industry in general and the Company’s financial results in particular during fiscal years 2008 and 2009. In 2008 and 2009, the Company’s earnings have been negatively affected by continued low short-term interest rates, an increase in credit losses in the Bank’s loan portfolio, recognition of declines in the fair value of certain securities, and elevated levels of FDIC premiums. Due to the ongoing uncertainty in the general economy and the market, which may continue to negatively impact the Company’s performance and its stock price, the Company determined that the carrying value of the Company’s goodwill exceeded its fair value and resulted in a 2008 noncash charge of $57.8 million and a 2009 noncash charge of $52.4 million. The noncash charge in 2009 eliminated the remaining goodwill on the Company’s consolidated balance sheet. These charges have no effect on the Company’s liquidity, regulatory capital, or daily operations and were recorded as a component of noninterest expense on the consolidated statement of operations.
Carrying Value of Securities
Securities designated as available-for-sale are carried at fair value. However, the unrealized difference between amortized cost and fair value of securities available-for-sale is excluded from net income unless there is an other than temporary impairment and is reported, net of deferred taxes, as a component of stockholders’ equity as accumulated other comprehensive income (loss). Securities held-to-maturity are carried at amortized cost, as the Bank has the ability, and management has the positive intent, to hold these securities to maturity. Premiums and discounts on securities are amortized and accreted according to the interest method.
Treatment of Deferred Tax Assets
Management’s determination of the realization of deferred tax assets is based upon its judgment of various future events and uncertainties, including the timing and amount of future income earned by certain subsidiaries and the implementation of various tax plans to maximize realization of the deferred tax assets. In evaluating the positive and negative evidence to support the realization of the asset under current guidance, given the current credit crisis and economic conditions, there is insufficient positive evidence to support a conclusion that it is more likely than not this asset will be realized in the foreseeable future. Examinations of our income tax returns or changes in tax law may impact our tax liabilities and resulting provisions for income taxes.
Summary
Management believes the accounting estimates related to the allowance for loan losses, the valuation allowance for deferred tax assets and the goodwill impairment test are “critical accounting estimates” because: (1) the estimates are highly susceptible to change from period to period as they require management to make assumptions concerning the changes in the types and volumes of the portfolios and anticipated economic conditions, and (2) the impact of recognizing an impairment or loan loss could have a material effect on FNB United’s assets reported on the balance sheet as well as its net earnings.
| Item 7A. | QUANTITATIVE AND QUALITATIVE DISCLOSURES ABOUT MARKET RISK |
The objective of the Bank’s asset/liability management function is to maintain consistent growth in net interest income within Bank guidelines. This objective is accomplished through management of the Bank’s balance sheet composition, liquidity, and interest rate risk exposures arising from changing economic conditions, interest rates and customer preferences.
The goal of liquidity management is to provide adequate funds to meet changes in loan demand or unexpected deposit withdrawals. This is accomplished by maintaining liquid assets in the form of investment securities, maintaining sufficient unused borrowing capacity and achieving consistent growth in core deposits.
Management considers interest rate risk the Bank’s most significant market risk. Interest rate risk is the exposure to adverse changes in net interest income due to changes in interest rates. Consistency of the Bank’s net interest income is largely dependent upon the effective management of interest rate risk.
46
Table of Contents
To identify and manage its interest rate risk, the Bank employs an earnings simulation model to analyze net interest income sensitivity to changing interest rates. The model is based on actual cash flows and repricing characteristics and incorporates market-based assumptions regarding the effect of changing interest rates on the prepayment rates of certain assets and liabilities. The model also includes management projections for activity levels in each of the product lines offered by the Bank. Assumptions are inherently uncertain and the measurement of net interest income or the impact of rate fluctuations on net interest income cannot be precisely predicted. Actual results may differ from simulated results due to timing, magnitude, and frequency of interest changes as well as changes in market conditions and management strategies.
The Bank’s Asset/Liability Management Committee (“ALCO”), which includes senior management representatives and reports to the Bank’s Board of Directors, monitors and manages interest rate risk. The Bank’s current interest rate risk position is determined by measuring the anticipated change in net interest income over a 24-month horizon assuming a ramped increase or decrease in all interest rates equally over the 24 month time horizon.
The following table shows the Bank’s estimated net interest income profile for the 12-month period beginning December 31, 2009:
| Changes in Interest Rates (basis points) |
Percentage Change in Net Interest Income – 12 Months | |
| +200 |
+3.21% | |
| +100 |
+1.64% | |
| -100 |
-1.44% | |
| -200 |
-3.30% |
ALCO also monitors the sensitivity of the Bank’s economic value of equity (“EVE”) due to sudden and sustained changes in market rates. The EVE ratio, measured on a static basis at the current period end, is calculated by dividing the economic value of equity by the economic value of total assets. ALCO monitors the change in EVE on a percentage change basis.
The following table estimates changes in EVE for given changes in interest rates as of December 31, 2009:
| Change in Interest Rates (basis points) |
Percentage Change in EVE | |
| +200 |
+7.83% | |
| +100 |
+3.49% | |
| -100 |
-2.25% | |
| -200 |
-2.47% |
Both changes in net interest income and EVE are within acceptable policy guidelines. Due to the current low level of market interest rates, further decreases in interest rates are limited. Therefore, ALCO believes that market risk at the Bank is low and well within acceptable levels.
47
Table of Contents
| Item 8. | FINANCIAL STATEMENTS AND SUPPLEMENTARY DATA |
QUARTERLY FINANCIAL INFORMATION
The following table sets forth, for the periods indicated, certain of our consolidated quarterly financial information. This information is derived from our unaudited financial statements, which include, in the opinion of management, all normal recurring adjustments which management considers necessary for a fair presentation of the results for such periods. This information should be read in conjunction with our consolidated financial statements included elsewhere in this report. The results for any quarter are not necessarily indicative of results for any future period.
| (dollars in thousands, except per share data) | ||||||||||||
| 2009 | ||||||||||||
| 4th Qtr | 3rd Qtr | 2nd Qtr | 1st Qtr | |||||||||
| Interest income |
$ | 25,274 | $ | 26,498 | $ | 26,053 | $ | 25,346 | ||||
| Interest expense |
8,873 | 10,081 | 10,807 | 11,214 | ||||||||
| Net interest income |
16,401 | 16,417 | 15,246 | 14,132 | ||||||||
| Provision for loan losses |
24,657 | 17,500 | 5,525 | 14,059 | ||||||||
| Net interest (loss)/income after provision for loan losses |
(8,256) | (1,083) | 9,721 | 73 | ||||||||
| Noninterest income |
5,421 | 4,960 | 5,490 | 5,882 | ||||||||
| Noninterest expense |
16,157 | 71,553 | 16,356 | 15,846 | ||||||||
| Loss before income taxes |
(18,992) | (67,676) | (1,145) | (9,891) | ||||||||
| Income taxes (benefit)/expense |
9,043 | (185) | (742) | (4,124) | ||||||||
| Net loss |
(28,035) | (67,491) | (403) | (5,767) | ||||||||
| Preferred stock dividends |
(818) | (813) | (809) | (431) | ||||||||
| Net loss to common shareholders |
$ | (28,853) | $ | (68,304) | $ | (1,212) | $ | (6,198) | ||||
| Net loss per common share: |
||||||||||||
| Basic |
$ | (2.53) | $ | (5.98) | $ | (0.11) | $ | (0.54) | ||||
| Diluted |
$ | (2.53) | $ | (5.98) | $ | (0.11) | $ | (0.54) | ||||
| 2008 | ||||||||||||
| 4th Qtr | 3rd Qtr | 2nd Qtr | 1st Qtr | |||||||||
| Interest income |
$ | 26,644 | $ | 28,856 | $ | 28,325 | $ | 30,210 | ||||
| Interest expense |
12,607 | 13,255 | 13,376 | 14,780 | ||||||||
| Net interest income |
14,037 | 15,601 | 14,949 | 15,430 | ||||||||
| Provision for loan losses |
15,492 | 9,370 | 1,383 | 1,514 | ||||||||
| Net interest (loss)/income after provision for loan losses |
(1,455) | 6,231 | 13,566 | 13,916 | ||||||||
| Noninterest income |
7,231 | 5,920 | 4,743 | 5,024 | ||||||||
| Noninterest expense |
69,818 | 15,432 | 17,318 | 15,535 | ||||||||
| (Loss)/income before income taxes |
(64,042) | (3,281) | 991 | 3,405 | ||||||||
| Income taxes (benefit)/expense |
(3,481) | (1,570) | 851 | 1,082 | ||||||||
| Net (loss)/income |
$ | (60,561) | $ | (1,711) | $ | 140 | $ | 2,323 | ||||
| Net (loss)/income per common share: |
||||||||||||
| Basic |
$ | (5.30) | $ | (0.15) | $ | 0.01 | $ | 0.20 | ||||
| Diluted |
$ | (5.30) | $ | (0.15) | $ | 0.01 | $ | 0.20 | ||||
48
Table of Contents

REPORT OF INDEPENDENT REGISTERED PUBLIC ACCOUNTING FIRM
To the Stockholders and the Board of Directors
FNB United Corp. and Subsidiary
Asheboro, North Carolina
We have audited the accompanying consolidated balance sheets of FNB United Corp. and Subsidiary as of December 31, 2009 and 2008, and the related consolidated statements of income(loss), shareholders’ equity and comprehensive income (loss), and cash flows for each of the years in the three-year period ended December 31, 2009. These consolidated financial statements are the responsibility of the Corporation’s management. Our responsibility is to express an opinion on these consolidated financial statements based on our audits.
We conducted our audits in accordance with the standards of the Public Company Accounting Oversight Board (United States). Those standards require that we plan and perform the audit to obtain reasonable assurance about whether the financial statements are free of material misstatement. An audit includes examining, on a test basis, evidence supporting the amounts and disclosures in the financial statements. An audit also includes assessing the accounting principles used and significant estimates made by management, as well as evaluating the overall financial statement presentation. We believe that our audits provide a reasonable basis for our opinion.
In our opinion, the consolidated financial statements referred to above present fairly, in all material respects, the financial position of FNB United Corp. and Subsidiary at December 31, 2009 and 2008 and the results of their operations and their cash flows for each of the years in the three-year period ended December 31, 2009 in conformity with accounting principles generally accepted in the United States of America.
The accompanying consolidated financial statements have been prepared assuming that the Corporation will continue as a going concern. The Corporation incurred significant net losses in 2009, primarily from the higher provisions for loan losses due to the significant level of non-performing assets and the write-off of goodwill. As discussed in Note 19, the Corporation expects to receive the results from a regulatory examination in April that are anticipated to require higher regulatory capital requirements and a corrective plan for the reduction of non-performing assets, among other matters. These matters raise substantial doubt about the Corporation’s ability to continue as a going concern. Management’s plans in regard to these matters are discussed further in Note 20. The 2009 consolidated financial statements do not include any adjustments that might result from the outcome of this uncertainty.
We have also audited, in accordance with the standards of the Public Company Accounting Oversight Board (United States), FNB United Corp. and Subsidiary’s internal control over financial reporting as of December 31, 2009, based on criteria established in Internal Control–Integrated Framework issued by the Committee of Sponsoring Organizations of the Treadway Commission, and our report dated April 14, 2010 expressed an unqualified opinion on the effectiveness of the Corporation’s internal control over financial reporting.

Charlotte, North Carolina
April 14, 2010
49
Table of Contents
REPORT OF INDEPENDENT REGISTERED PUBLIC ACCOUNTING FIRM
To the Stockholders and the Board of Directors
FNB United Corp. and Subsidiary
Asheboro, North Carolina
We have audited FNB United Corp. and Subsidiary (the “Corporation”)’s internal control over financial reporting as of December 31, 2009, based on criteria established in Internal Control-Integrated Framework issued by the Committee of Sponsoring Organizations of the Treadway Commission. The Corporation’s management is responsible for maintaining effective internal control over financial reporting and for its assessment of the effectiveness of internal control over financial reporting, included in the accompanying Management’s Annual Report on Internal Control Over Financial Reporting. Our responsibility is to express an opinion on the Corporation’s internal control over financial reporting based on our audit.
We conducted our audit in accordance with the standards of the Public Company Accounting Oversight Board (United States). Those standards require that we plan and perform the audit to obtain reasonable assurance about whether effective internal control over financial reporting was maintained in all material respects. Our audit included obtaining an understanding of internal control over financial reporting, assessing the risk that a material weakness exists, and testing and evaluating the design and operating effectiveness of internal control based on the assessed risk. Our audit also included performing such other procedures as we considered necessary in the circumstances. We believe that our audit provides a reasonable basis for our opinion.
A corporation’s internal control over financial reporting is a process designed to provide reasonable assurance regarding the reliability of financial reporting and the preparation of financial statements for external purposes in accordance with generally accepted accounting principles. A corporation’s internal control over financial reporting includes those policies and procedures that (1) pertain to the maintenance of records that, in reasonable detail, accurately and fairly reflect the transactions and dispositions of the assets of the company; (2) provide reasonable assurance that transactions are recorded as necessary to permit preparation of financial statements in accordance with generally accepted accounting principles, and that receipts and expenditures of the company are being made only in accordance with authorizations of management and directors of the company; and (3) provide reasonable assurance regarding prevention or timely detection of unauthorized acquisition, use, or disposition of the corporation’s assets that could have a material effect on the financial statements.
Because of its inherent limitations, internal control over financial reporting may not prevent or detect misstatements. Also, projections of any evaluation of effectiveness to future periods are subject to the risk that controls may become inadequate because of changes in conditions, or that the degree of compliance with the policies or procedures may deteriorate.
In our opinion, FNB United Corp. and Subsidiary maintained, in all material respects, effective internal control over financial reporting as of December 31, 2009, based on criteria established in Internal Control-Integrated Framework issued by the Committee of Sponsoring Organizations of the Treadway Commission.
We have also audited, in accordance with the standards of the Public Company Accounting Oversight Board (United States), the consolidated financial statements of FNB United Corp. and Subsidiary as of December, 31, 2009 and 2008 and for the three-year period ended December 31, 2009, and our report dated April 14, 2010, expressed an unqualified opinion thereon that included an explanatory paragraph relating to the existence of substantial doubt about the Corporation’s ability to continue as a going concern.
50
Table of Contents
Page 2
We do not express an opinion or any other form of assurance on management’s statement referring to compliance with designated laws and regulations related to safety and soundness.
Charlotte, North Carolina
April 14, 2010
51
Table of Contents
FNB United Corp. and Subsidiary
Consolidated Balance Sheets
| (dollars in thousands, except share and per share data) | December 31, 2009 |
December 31, 2008 | ||||
| Assets |
||||||
| Cash and due from banks |
$ | 27,600 | $ | 28,743 | ||
| Interest-bearing bank balances |
98 | 404 | ||||
| Federal funds sold |
- | 206 | ||||
| Investment securities: |
||||||
| Available-for-sale, at estimated fair value (amortized cost of $232,905 in 2009 and $206,072 in 2008) |
237,630 | 205,426 | ||||
| Held-to-maturity (estimated fair value of $91,521 in 2009 and $27,580 in 2008) |
88,559 | 27,794 | ||||
| Loans held for sale |
58,219 | 36,138 | ||||
| Loans held for investment |
1,563,021 | 1,585,195 | ||||
| Less: Allowance for loan losses |
(49,461) | (34,720) | ||||
| Net loans held for investment |
1,513,560 | 1,550,475 | ||||
| Premises and equipment, net |
48,115 | 50,947 | ||||
| Other real estate owned |
35,170 | 6,806 | ||||
| Goodwill |
- | 52,395 | ||||
| Core deposit premiums |
4,968 | 5,762 | ||||
| Bank-owned life insurance |
30,883 | 29,901 | ||||
| Other assets |
56,494 | 49,437 | ||||
| Total Assets |
$ | 2,101,296 | $ | 2,044,434 | ||
| Liabilities |
||||||
| Deposits: |
||||||
| Noninterest-bearing demand deposits |
$ | 152,522 | $ | 150,273 | ||
| Interest-bearing deposits: |
||||||
| Demand, savings and money market deposits |
594,377 | 479,223 | ||||
| Time deposits of $100,000 or more |
425,858 | 407,539 | ||||
| Other time deposits |
549,371 | 477,712 | ||||
| Total deposits |
1,722,128 | 1,514,747 | ||||
| Retail repurchase agreements |
13,592 | 18,145 | ||||
| Federal Home Loan Bank advances |
166,165 | 238,910 | ||||
| Federal funds purchased |
10,000 | 37,000 | ||||
| Subordinated debt |
15,000 | 15,000 | ||||
| Junior subordinated debentures |
56,702 | 56,702 | ||||
| Other liabilities |
19,350 | 16,013 | ||||
| Total Liabilities |
2,002,937 | 1,896,517 | ||||
| Shareholders’ Equity |
||||||
| Preferred stock, $10.00 par value; authorized 200,000 shares, 51,500 shares issued and outstanding at $1,000 stated value |
48,205 | - | ||||
| Common stock warrant |
3,891 | - | ||||
| Common stock, $2.50 par value; authorized 50,000,000 shares, issued 11,426,413 shares in 2009 and 11,428,003 shares in 2008 |
28,566 | 28,570 | ||||
| Surplus |
115,039 | 114,772 | ||||
| Retained earnings (accumulated deficit) |
(96,234) | 8,904 | ||||
| Accumulated other comprehensive loss |
(1,108) | (4,329) | ||||
| Total Shareholders’ Equity |
98,359 | 147,917 | ||||
| Total Liabilities and Shareholders’ Equity |
$ | 2,101,296 | $ | 2,044,434 | ||
See accompanying notes to consolidated financial statements.
52
Table of Contents
FNB United Corp. and Subsidiary
Consolidated Statements of Income (Loss)
| (dollars in thousands, except share and per share data) | Years Ended December 31, | ||||||||
| 2009 | 2008 | 2007 | |||||||
| Interest Income |
|||||||||
| Interest and fees on loans |
$ | 84,261 | $ | 103,365 | $ | 114,880 | |||
| Interest and dividends on investment securities: |
|||||||||
| Taxable income |
16,256 | 7,820 | 7,613 | ||||||
| Non-taxable income |
2,256 | 2,040 | 2,096 | ||||||
| Other interest income |
398 | 810 | 2,051 | ||||||
| Total interest income |
103,171 | 114,035 | 126,640 | ||||||
| Interest Expense |
|||||||||
| Deposits |
32,490 | 42,211 | 52,594 | ||||||
| Retail repurchase agreements |
127 | 651 | 1,317 | ||||||
| Federal Home Loan Bank advances |
5,933 | 7,223 | 3,468 | ||||||
| Federal funds purchased |
156 | 501 | 162 | ||||||
| Other borrowed funds |
2,269 | 3,432 | 5,487 | ||||||
| Total interest expense |
40,975 | 54,018 | 63,028 | ||||||
| Net Interest Income before Provision for Loan Losses |
62,196 | 60,017 | 63,612 | ||||||
| Provision for loan losses |
61,741 | 27,759 | 5,514 | ||||||
| Net Interest (Loss)/Income after Provision for Loan Losses |
455 | 32,258 | 58,098 | ||||||
| Noninterest Income |
|||||||||
| Service charges on deposit accounts |
8,956 | 9,167 | 9,012 | ||||||
| Mortgage loan income |
9,888 | 6,340 | 4,543 | ||||||
| Cardholder and merchant services income |
2,514 | 2,395 | 1,878 | ||||||
| Trust and investment services |
1,741 | 1,827 | 1,686 | ||||||
| Bank owned life insurance |
1,068 | 983 | 945 | ||||||
| Other service charges, commissions and fees |
1,147 | 796 | 998 | ||||||
| Securities gains, net |
1,055 | 646 | - | ||||||
| Gain on sale of credit card portfolio |
- | - | 1,302 | ||||||
| Total other-than-temporary impairment loss |
(4,985) | - | - | ||||||
| Portion of loss recognized in other comprehensive income |
- | - | - | ||||||
| Net impairment loss recognized in earnings |
(4,985) | - | - | ||||||
| Other income |
369 | 764 | 1,229 | ||||||
| Total noninterest income |
21,753 | 22,918 | 21,593 | ||||||
| Noninterest Expense |
|||||||||
| Personnel expense |
32,932 | 33,081 | 33,169 | ||||||
| Net occupancy expense |
5,522 | 5,343 | 5,303 | ||||||
| Furniture, equipment and data processing expense |
7,121 | 6,705 | 6,556 | ||||||
| Professional fees |
2,070 | 2,552 | 1,872 | ||||||
| Stationery, printing and supplies |
703 | 1,174 | 1,266 | ||||||
| Advertising and marketing |
2,056 | 1,371 | 1,924 | ||||||
| Other real estate owned expense |
3,472 | 610 | 109 | ||||||
| Credit/debit card expense |
1,672 | 1,716 | 1,613 | ||||||
| Goodwill impairment |
52,395 | 57,800 | 358 | ||||||
| FDIC insurance |
4,170 | 894 | 166 | ||||||
| Other expense |
7,799 | 6,857 | 8,708 | ||||||
| Total noninterest expense |
119,912 | 118,103 | 61,044 | ||||||
| (Loss)/income before income taxes |
(97,704) | (62,927) | 18,647 | ||||||
| Income taxes (benefit)/expense |
3,992 | (3,118) | 6,286 | ||||||
| Net (Loss)/Income |
(101,696) | (59,809) | 12,361 | ||||||
| Preferred stock dividends |
(2,871) | - | - | ||||||
| Net (Loss)/Income to Common Shareholders |
$ | (104,567) | $ | (59,809) | $ | 12,361 | |||
| Net (loss)/income per common share: |
|||||||||
| Basic |
$ | (9.16) | $ | (5.24) | $ | 1.09 | |||
| Diluted |
$ | (9.16) | $ | (5.24) | $ | 1.09 | |||
| Weighted average number of common shares outstanding: |
|||||||||
| Basic |
11,416,977 | 11,407,616 | 11,321,908 | ||||||
| Diluted |
11,416,977 | 11,407,616 | 11,336,321 | ||||||
See accompanying notes to consolidated financial statements.
53
Table of Contents
FNB United Corp. and Subsidiary
Consolidated Statements of Shareholders’ Equity and Comprehensive Income (Loss)
| (in thousands, |
Preferred Stock | Common Stock | Common Stock |
Retained Earnings (Accumulated |
Accumulated Other Comprehensive |
||||||||||||||||||||
| Shares | Amount | Shares | Amount | Warrant | Surplus | Deficit) | Income (Loss) | Total | |||||||||||||||||
| Balance, December 31, 2006 |
- | $ | - | 11,293,992 | $ | 28,235 | $ | - | $ | 112,213 | $ | 68,662 | $ | (1,442) | $ | 207,668 | |||||||||
| Comprehensive income: |
|||||||||||||||||||||||||
| Net income |
- | - | - | - | - | - | 12,361 | - | 12,361 | ||||||||||||||||
| Other comprehensive income, net of taxes: |
|||||||||||||||||||||||||
| Unrealized holding gains arising during the period on securities available-for-sale, net of tax |
- | - | - | - | - | - | - | 198 | 198 | ||||||||||||||||
| Change in unrealized gains (losses) on securities, net of tax |
- | - | - | - | - | - | - | 198 | 198 | ||||||||||||||||
| Pension and post-retirement liability, net of tax |
- | - | - | - | - | - | - | 615 | 615 | ||||||||||||||||
| Total comprehensive income |
13,174 | ||||||||||||||||||||||||
| Cash dividends declared on common stock, $.60 per share |
- | - | - | - | - | - | (6,824) | - | (6,824) | ||||||||||||||||
| Stock options: |
|||||||||||||||||||||||||
| Proceeds from options exercised |
- | - | 135,581 | 339 | - | 963 | - | - | 1,302 | ||||||||||||||||
| Compensation expense recognized |
- | - | - | - | - | 494 | - | - | 494 | ||||||||||||||||
| Net tax benefit related to option exercises |
- | - | - | - | - | 167 | - | - | 167 | ||||||||||||||||
| Restricted stock: |
|||||||||||||||||||||||||
| Shares issued/terminated, subject to restriction |
- | - | (3,103) | (8) | - | (31) | - | - | (39) | ||||||||||||||||
| Compensation expense recognized |
- | - | - | - | - | 306 | - | - | 306 | ||||||||||||||||
| Other compensatory stock issued |
- | - | 432 | 1 | - | 7 | - | - | 8 | ||||||||||||||||
| Balance, December 31, 2007 |
- | $ | - | 11,426,902 | $ | 28,567 | $ | - | $ | 114,119 | $ | 74,199 | $ | (629) | $ | 216,256 | |||||||||
| Cumulative effect of a change in accounting principle - record postretirement benefit related to split-dollar insurance |
- | - | - | - | - | - | (344) | - | (344) | ||||||||||||||||
| Comprehensive income: |
|||||||||||||||||||||||||
| Net loss |
- | - | - | - | - | - | (59,809) | - | (59,809) | ||||||||||||||||
| Other comprehensive income, net of taxes: |
|||||||||||||||||||||||||
| Unrealized holding (losses) arising during the period on securities available-for-sale, net of tax |
- | - | - | - | - | - | - | (781) | (781) | ||||||||||||||||
| Reclassification adjustment for (losses) on securities available-for-sale included in net income, net of tax |
- | - | - | - | - | - | - | (139) | (139) | ||||||||||||||||
| Change in unrealized (losses) on securities, net of tax |
- | - | - | - | - | - | - | (920) | (920) | ||||||||||||||||
| Interest rate swap, net of tax |
- | - | - | - | - | - | - | (300) | (300) | ||||||||||||||||
| Pension and post-retirement liability, net of tax |
- | - | - | - | - | - | - | (2,480) | (2,480) | ||||||||||||||||
| Total comprehensive (loss) |
(63,509) | ||||||||||||||||||||||||
| Cash dividends declared on common stock, $.45 per share |
- | - | - | - | - | - | (5,142) | - | (5,142) | ||||||||||||||||
| Stock options: |
|||||||||||||||||||||||||
| Proceeds from options exercised |
- | - | 150 | 1 | - | 1 | - | - | 2 | ||||||||||||||||
| Compensation expense recognized |
- | - | - | - | - | 429 | - | - | 429 | ||||||||||||||||
| Restricted stock: |
|||||||||||||||||||||||||
| Shares issued/terminated, subject to restriction |
- | - | 951 | 2 | - | (75) | - | - | (73) | ||||||||||||||||
| Compensation expense recognized |
- | - | - | - | - | 298 | - | - | 298 | ||||||||||||||||
| Balance, December 31, 2008 |
- | $ | - | 11,428,003 | $ | 28,570 | $ | - | $ | 114,772 | $ | 8,904 | $ | (4,329) | $ | 147,917 | |||||||||
| Comprehensive income (loss): |
|||||||||||||||||||||||||
| Net loss |
- | - | - | - | - | - | (101,696) | - | (101,696) | ||||||||||||||||
| Other comprehensive income, net of taxes: |
|||||||||||||||||||||||||
| Unrealized holding gains arising during the period on securities available-for-sale, |
- | - | - | - | - | - | - | 3,767 | 3,767 | ||||||||||||||||
| Reclassification adjustment for (losses) on securities available-for-sale included in net income |
- | - | - | - | - | - | - | (3,548) | (3,548) | ||||||||||||||||
| Unrealized gains on securities for which credit-related portion was recognized in net realized investment gains (losses) |
- | - | - | - | - | - | - | 3,016 | 3,016 | ||||||||||||||||
| Change in unrealized gains on securities, net of tax |
- | - | - | - | - | - | - | 3,235 | 3,235 | ||||||||||||||||
| Interest rate swap, net of tax |
- | - | - | - | - | - | - | 51 | 51 | ||||||||||||||||
| Pension and post-retirement liability, net of tax |
- | - | - | - | - | - | - | (65) | (65) | ||||||||||||||||
| Total comprehensive loss |
(98,475) | ||||||||||||||||||||||||
| Issuance of preferred stock |
51,500 | 47,609 | - | - | 3,891 | - | - | - | 51,500 | ||||||||||||||||
| Accretion of discount on preferred stock |
- | 596 | - | - | - | - | (596) | - | - | ||||||||||||||||
| Cash dividends declared on common stock, $0.05 per share |
- | - | - | - | - | - | (574) | - | (574) | ||||||||||||||||
| Cash dividends declared on Series A preferred stock, $12.50 per share |
- | - | - | - | - | - | (2,272) | - | (2,272) | ||||||||||||||||
| Stock options: |
|||||||||||||||||||||||||
| Compensation expense recognized |
- | - | - | - | - | 211 | - | - | 211 | ||||||||||||||||
| Restricted stock: |
|||||||||||||||||||||||||
| Shares issued/terminated, subject to restriction |
- | - | (1,590) | (4) | - | (138) | - | - | (142) | ||||||||||||||||
| Compensation expense recognized |
- | - | - | - | - | 194 | - | - | 194 | ||||||||||||||||
| Balance, December 31, 2009 |
51,500 | $ | 48,205 | 11,426,413 | $ | 28,566 | $ | 3,891 | $ | 115,039 | $ | (96,234) | $ | (1,108) | $ | 98,359 | |||||||||
See accompanying notes to consolidated financial statements.
54
Table of Contents
FNB United Corp. and Subsidiary
Consolidated Statements of Cash Flows
| (dollars in thousands) | Year Ended December 31, | ||||||||
| 2009 | 2008 | 2007 | |||||||
| Operating Activities |
|||||||||
| Net (loss)/income |
$ | (101,696) | $ | (59,809) | $ | 12,361 | |||
| Adjustments to reconcile net income/(loss) to cash (used in) provided by operatings activities: |
|||||||||
| Depreciation and amortization of premises and equipment |
3,700 | 3,453 | 3,584 | ||||||
| Provision for loan losses |
61,741 | 27,759 | 5,514 | ||||||
| Deferred income taxes |
(18,385) | (5,056) | 623 | ||||||
| Deferred loan fees and costs, net |
(2,060) | (503) | 1,085 | ||||||
| Premium amortization and discount accretion of investment securities, net |
(1,689) | (422) | (254) | ||||||
| Gain on sale of investment securities |
(1,055) | (646) | - | ||||||
| Other-than-temporary impairment charge |
4,985 | - | - | ||||||
| Amortization of core deposit premiums |
794 | 802 | 814 | ||||||
| Stock compensation expense |
405 | 727 | 769 | ||||||
| Increase in cash surrender value of bank-owned life insurance |
(1,187) | (1,045) | (577) | ||||||
| Mortgage loans held for sale: |
|||||||||
| Origination of mortgage loans held for sale |
(762,087) | (260,964) | (351,398) | ||||||
| Proceeds from sale of mortgage loans held for sale |
748,598 | 248,330 | 359,217 | ||||||
| Gain on mortgage loan sales |
(9,888) | (6,340) | (4,543) | ||||||
| Gain on other loan sales |
- | - | (1,302) | ||||||
| Mortgage servicing rights capitalized |
(1,642) | (1,182) | (1,094) | ||||||
| Mortgage servicing rights amortization and impairment |
829 | 38 | 667 | ||||||
| Goodwill impairment |
52,395 | 57,800 | 358 | ||||||
| Net loss on other real estate owned |
2,619 | 531 | 268 | ||||||
| Changes in assets and liabilities: |
|||||||||
| (Increase)/decrease in interest receivable |
(1,254) | 2,435 | (664) | ||||||
| Decrease/(increase) in other assets |
12,579 | (2,289) | 2,953 | ||||||
| Increase/(decrease) in accrued interest and other liabilities |
2,478 | 364 | (1,264) | ||||||
| Net cash (used in) provided by operating activities |
(9,820) | 3,983 | 27,117 | ||||||
| Investing Activities |
|||||||||
| Available-for-sale securities: |
|||||||||
| Proceeds from sales |
40,789 | 28,165 | - | ||||||
| Proceeds from maturities and calls |
85,959 | 105,382 | 87,965 | ||||||
| Purchases |
(158,398) | (197,395) | (117,747) | ||||||
| Held-to-maturity securities: |
|||||||||
| Proceeds from maturities and calls |
20,367 | 12,285 | 7,114 | ||||||
| Purchases |
(78,548) | (4,487) | - | ||||||
| Net increase in loans held for investment |
(55,591) | (154,105) | (155,140) | ||||||
| Proceeds from sales of loans |
- | - | 4,999 | ||||||
| Proceeds from sale of other real estate owned |
4,106 | 2,757 | 3,938 | ||||||
| Improvements to other real estate owned |
(439) | - | - | ||||||
| Proceeds from settlement of bank-owned life insurance |
205 | - | 24 | ||||||
| Purchases of premises and equipment |
(1,040) | (8,751) | (5,265) | ||||||
| Purchases of SBIC investments |
(100) | (75) | (475) | ||||||
| Net cash used in investing activities |
(142,690) | (216,224) | (174,587) | ||||||
| Financing Activities |
|||||||||
| Net increase in deposits |
207,381 | 73,705 | 20,062 | ||||||
| (Decrease)/increase in retail repurchase agreements |
(4,553) | (10,988) | 5,972 | ||||||
| (Decrease)/increase in Federal Home Loan Bank advances |
(72,813) | 106,970 | 65,720 | ||||||
| (Decrease)/increase in Federal funds purchased |
(27,000) | 23,500 | 13,500 | ||||||
| Increase/(decrease) in other borrowings |
- | 15,000 | (21,441) | ||||||
| Proceeds from exercise of stock options |
- | 2 | 1,302 | ||||||
| Tax benefit from exercise of stock options |
- | - | 167 | ||||||
| Proceeds from issuance of Series A preferred stock and common stock warrant |
51,500 | - | - | ||||||
| Cash dividends paid on common stock |
(1,714) | (5,712) | (7,035) | ||||||
| Cash dividends paid on Series A preferred stock |
(1,946) | - | - | ||||||
| Net cash provided by financing activities |
150,855 | 202,477 | 78,247 | ||||||
| Net Decrease in Cash and Cash Equivalents |
(1,655) | (9,764) | (69,223) | ||||||
| Cash and Cash Equivalents at Beginning of Period |
29,353 | 39,117 | 108,340 | ||||||
| Cash and Cash Equivalents at End of Period |
$ | 27,698 | $ | 29,353 | $ | 39,117 | |||
| Supplemental disclosure of cash flow information |
|||||||||
| Cash paid during the period for: |
|||||||||
| Interest |
$ | 42,580 | $ | 54,564 | $ | 63,092 | |||
| Income taxes, net of refunds |
700 | 2,352 | 3,815 | ||||||
| Noncash transactions: |
|||||||||
| Foreclosed loans transferred to other real estate |
34,650 | 6,934 | 3,708 | ||||||
| Unrealized securities gains/(losses), net of income taxes (benefit)/expense |
3,235 | (939) | 198 | ||||||
| Employee benefit plan costs, net of income taxes |
(65) | (2,480) | 615 | ||||||
| Unrealized gains/(losses) on interest rate swaps |
51 | (300) | - | ||||||
| Record postretirement benefit related to split-dollar insurance |
- | (344) | - | ||||||
See accompanying notes to consolidated financial statements.
55
Table of Contents
FNB United Corp. and Subsidiary
Notes to Consolidated Financial Statements
December 31, 2009, 2008, and 2007
Note 1 – Summary of significant accounting policies and nature of operations
Nature of Operations/Consolidation
FNB United Corp. (“FNB United”), formerly known as FNB Corp., is a bank holding company whose wholly owned subsidiary is CommunityONE Bank, National Association (“the Bank”). The Bank has three wholly owned subsidiaries, Dover Mortgage Company (“Dover”), First National Investor Services, Inc., and Premier Investment Services, Inc (an inactive subsidiary acquired as part of the United Financial, Inc. transaction). Through its subsidiaries, FNB United offers a complete line of consumer, mortgage and business banking services, including loan, deposit, cash management, investment management and trust services, to individual and business customers. The Bank has offices in Alamance, Alexander, Ashe, Catawba, Chatham, Gaston, Guilford, Iredell, Mecklenburg, Montgomery, Moore, Orange, Randolph, Richmond, Rowan, Scotland, Watauga and Wilkes counties in North Carolina. Dover has a retail origination network based in Charlotte with wholesale operations currently in Georgia, Maine, Maryland, New Hampshire, North Carolina, South Carolina, Tennessee and Virginia.
The consolidated financial statements include the accounts of FNB United and its subsidiaries (collectively, the “Company”). All significant intercompany balances and transactions have been eliminated.
The preparation of the consolidated financial statements in conformity with accounting principles generally accepted in the United States of America requires management to make estimates and assumptions that affect the reported amounts of assets and liabilities and disclosure of contingent liabilities at the date of the consolidated financial statements and the reported amounts of revenues and expenses during the reporting periods. Actual results could differ from those estimates.
Business Segments
The Company reports business segments in accordance with regulatory guidelines. Business segments are components of an enterprise about which separate financial information is available that is evaluated regularly by the chief operating decision maker in deciding how to allocate resources and assess performance. The guidelines require that a public enterprise report a measure of segment profit or loss, certain specific revenue and expense items, segment assets, information about the way that the business segments were determined and other items. Prior to 2007, the Company had two reportable business segments, the full service subsidiary bank, CommunityONE Bank, and the mortgage banking subsidiary, Dover Mortgage Company. The determination was made in 2007 that there was only one business segment and that Dover no longer is a business segment.
Recent Accounting Pronouncements
Business Combinations. The new guidance requires an acquirer to measure the identifiable assets acquired, the liabilities assumed and any noncontrolling interest in the acquiree at their fair value on the acquisition date, with goodwill being the excess value of consideration paid over the fair value of the net identifiable assets acquired and replaces the cost allocation method used in mergers entered into prior to December 15, 2008. Other key differences that resulted under the new guidance include the expensing of acquisition-related costs as incurred as opposed to the capitalization of those costs in previous mergers. This applies prospectively to business combinations for which the acquisition date is on or after the beginning of the first annual reporting period beginning on or after December 15, 2008.
Noncontrolling Interests in Consolidated Financial Statements. The relevance, comparability and transparency of financial information provided to investors has been improved by requiring all entities to report noncontrolling (minority) interests in subsidiaries in the same way - as equity in the Consolidated Financial Statements. Moreover, the diversity that currently exists in accounting for transactions between an entity and noncontrolling interests has been eliminated by requiring they be treated as equity transactions. This applies to fiscal years, and interim periods within those fiscal years, beginning on or after December 15, 2008. This had no effect on financial position or results of operations.
56
Table of Contents
Disclosures about Derivative Instruments and Hedging Activities. The Company is required to provide enhanced disclosures related to derivative and hedging activities. This requirement is effective as of January 1, 2009 and has been adopted by the Company. See “Derivatives and Financial Instruments” disclosure of Note 1 for additional disclosures.
Recognition and Presentation of Other-Than-Temporary Impairments. A new model for evaluating other-than-temporary impairment (“OTTI”) on debt securities was created. If an entity intends to sell an impaired debt security, or cannot assert it is more likely than not that it will not have to sell the security before recovery, OTTI must be taken. If the entity does not intend to sell the debt security, but the entity does not expect to, or is not more likely than not to be required to sell, then OTTI must be taken, but the amount of impairment is to be bifurcated between impairment due to credit (which is recorded through earnings) and noncredit impairment (which becomes a component of other comprehensive income (“OCI”) for both available-for-sale (“AFS”) and held-to-maturity securities (“HTM”)). For HTM securities, the amount in OCI will be amortized prospectively over the security’s remaining life. Upon adoption, a cumulative effect adjustment must be made to opening retained earnings in the period adopted that reclassifies the noncredit portion of previously taken OTTI from retained earnings to accumulated OCI. The Company is required to present annual disclosures in interim financial statements, and new disclosures are also required. The Company’s adoption required new disclosures that were included in this report on Form 10-K. See Note 3 for additional disclosures.
Subsequent Events. In May 2009, an accounting standards update was adopted for disclosure of events that occur after the balance sheet date but before financial statements are issued or available to be issued. These standards set forth (i) the period after the balance sheet date during which management of a reporting entity should evaluate events or transactions that may occur for potential recognition or disclosure in the financial statements, (ii) the circumstances under which an entity should recognize events or transactions occurring after the balance sheet date in its financial statements and (iii) the disclosures that an entity should make about events or transactions that occurred after the balance sheet date. This pronouncement was effective for the period ended June 30, 2009 and did not have a significant impact on the Company’s financial statements.
Accounting for Transfers of Financial Assets. This requirement eliminates the concept of a qualifying special purpose entity (QSPE), changes the requirements for derecognizing financial assets, and requires additional disclosures, including information about continuing exposure to risks related to transferred financial assets. It is effective for financial asset transfers occurring after the beginning of fiscal years beginning after November 15, 2009. The disclosure requirements must be applied to transfers that occurred before and after the effective date. The Company has not yet completed its assessment of the impact of this requirement.
Special Purpose Entities. The requirement created new criteria for determining the primary beneficiary, eliminates the exception to consolidating QSPEs, requires continual reconsideration of conclusions reached in determining the primary beneficiary, and requires additional disclosures. It is effective as of the beginning of fiscal years beginning after November 15, 2009 and is applied using a cumulative effect adjustment to retained earnings for any carrying amount adjustments (e.g., for newly-consolidated variable interest entities). The Company is currently evaluating the effects of this accounting issuance on its financial position or results of operations.
The FASB Accounting Standards Codification and the Hierarchy of Generally Accepted Accounting Principles. The Codification is the source of authoritative U.S. GAAP recognized by the FASB applied by nongovernmental entities and supersedes all non-SEC accounting and reporting standards. This statement is effective for financial statements issued for interim and annual financial statements ending after September 15, 2009. Since the underlying GAAP guidance for nongovernmental entities did not change, the Company’s adoption did not have an impact on its financial condition or results of operations.
Determining Fair Value When the Volume and Level of Activity for the Asset or Liability Have Significantly Decreased and Identifying Transactions That Are Not Orderly. The Company is required to consider factors to determine whether there has been a significant decrease in the volume and level of activity compared to normal market activity and to consider whether an observed transaction was not orderly based on the weight of available evidence. Additionally, this includes all assets and liabilities subject to fair value measurements and requires enhanced disclosures, including disclosure of investment securities by major security type. The adoption of this guidance required new disclosures that were included in this report on Form 10-K. See Note 16 for additional disclosures.
57
Table of Contents
Fair Value Measurements and Disclosures. In February 2010, the FASB issued new guidance impacting Fair Value Measurements and Disclosures. The new guidance requires a gross presentation of purchases and sales of Level 3 activities and adds a new requirement to disclose transfers in and out of Level 1 and Level 2 measurements. The guidance related to the transfers between level 1 and level 2 measurements is effective on January 1, 2010. The guidance that requires increased disaggregation of the level 3 activities is effective on January 1, 2011.
From time to time the FASB issues exposure drafts for proposed statements of financial accounting standards. Such exposure drafts are subject to comment from the public, to revisions by the FASB and to final issuance by the FASB as statements of financial accounting standards. Management considers the effect of the proposed statements on the consolidated financial statements of the Company and monitors the status of changes to and proposed effective dates of exposure drafts.
Cash and Cash Equivalents
For purposes of reporting cash flows, cash and cash equivalents include the balance sheet captions: cash and due from banks, interest-bearing bank balances and federal funds sold. Generally, federal funds are purchased and sold for one-day periods.
Investment Securities
Investment securities are categorized and accounted for as follows:
| • | Available-for-sale securities - Debt and equity securities not classified as either held-to-maturity securities or trading securities are reported at fair value, with unrealized gains and losses, net of related tax effect, included as an item of accumulated other comprehensive income and reported as a separate component of shareholders’ equity. |
| • | Held-to-maturity securities - Debt securities that the Company has the positive intent and ability to hold to maturity are reported at amortized cost. |
The Company intends to hold its securities classified as available-for-sale securities for an indefinite period of time but may sell them prior to maturity. All other securities, which the Company has the positive intent and ability to hold to maturity, are classified as held-to-maturity securities.
A decline, which is deemed to be other than temporary, in the market value of any available-for-sale or held-to-maturity equity security to a level below cost results in a reduction in carrying amount to fair value. The impairment is charged to earnings and a new cost basis for the security is established.
For debt securities, an impairment loss is recognized in earnings only when (1) the Company intends to sell the debt security; (2) it is more likely than not that the Company will be required to see the security before recovery of its amortized cost basis or (3) the Company does not expect to recover the entire amortized cost basis of the security. In situations where the Company intends to sell or when it is more likely than not that the Company will be required to sell the security, the entire impairment loss must be recognized in earnings. In all other situations, only the portion of the impairment loss representing the credit loss must be recognized in earnings, with the remaining portion being recognized in shareholders’ equity as a component of other comprehensive income, net of deferred taxes.
Interest income on debt securities is adjusted using the level yield method for the amortization of premiums and accretion of discounts. The adjusted cost of the specific security is used to compute gains or losses on the disposition of securities on a trade date basis.
Loans Held–for–Sale
The Company originates loans under various loan programs and other secondary market conventional products which are sold in the secondary market. Additionally, the Company has residential mortgage loans held for sale that were originated through the retail and wholesale mortgage segment. The majority of loans held for sale are carried at the lower of cost or market. The remaining portion is hedged to protect the Company from changes in interest rates during the period of time a loan is held. The loans that are hedged are recorded at market value in accordance with current guidance. The sold loans are beyond the reach of the Company in all respects and the purchasing investor has all rights of ownership, including the ability to pledge or exchange the loans. Most of loans sold are
58
Table of Contents
without recourse. Gains or losses on loan sales are recognized at the time of sale, are determined by the difference between net sales proceeds and the carrying value of the loan sold, and are included in mortgage loan income. Of loans sold, the Company retains rights and obligations to service only those loans sold to Fannie Mae.
Loans
Interest income on loans is generally calculated by using the interest method based on the daily outstanding balance. The recognition of interest income is discontinued when, in management’s opinion, the collection of all or a portion of interest becomes doubtful. Loans are returned to accrual status when the factors indicating doubtful collectibility cease to exist and the loan has performed in accordance with its terms for a demonstrated period of time. The past due status of loans is based on the contractual payment terms.
A loan is considered impaired when, based on current information or events, it is probable that a borrower will be unable to pay amounts due in accordance to the contractual terms of the loan agreement. For loans determined to be impaired, the allowance is based on discounted cash flows using the loan’s initial effective interest rate or the fair value of the collateral for certain collateral dependent loans. When the ultimate collectibility of the impaired loan’s principal is doubtful, all cash receipts are applied to principal. Once the recorded principal balance has been reduced to zero, future cash receipts are first recorded as recoveries of any amounts previously charged-off and are then applied to interest income, to the extent that any interest has been foregone.
Loan fees and the incremental direct costs associated with making loans are deferred and subsequently recognized over the life of the loan as an adjustment of interest income. The premium or discount on purchased loans is amortized over the expected life of the loans and is included in interest and fees on loans.
The majority of residential mortgage loans held for sale are valued at the lower of cost or market as determined by outstanding commitments from investors or current investor yield requirements, calculated on the aggregate loan basis. A portion of loans held for sale are hedged to take advantage of interest rate locks and changes in the market. These loans are carried at fair value.
The Company accounts for impaired loans acquired in a transfer at fair value, which is the net present value of all cash flows expected to be collected over the life of the loan. These cash flows are determined on the date of transfer. At December 31, 2009 and 2008, there were no purchased impaired loans.
Allowance for Loan Losses
The allowance for loan losses represents an amount considered adequate to absorb probable loan losses inherent in the portfolio. Management’s evaluation of the adequacy of the allowance is based on a review of individual loans, historical loan loss experience, the value and adequacy of collateral, and economic conditions in the Bank’s market area. For loans determined to be impaired, the allowance is based on discounted cash flows using the loan’s initial effective interest rate or the fair value of the collateral for certain collateral dependent loans. Losses are charged and recoveries are credited to the allowance for loan losses. This evaluation is inherently subjective as it requires material estimates, including the amounts and timing of future cash flows expected to be received on impaired loans that may be susceptible to significant change.
In addition, the Office of the Comptroller of the Currency (OCC), a federal regulatory agency, as an integral part of its examination process, periodically reviews the Bank’s allowance for loan losses. The OCC may require the Bank to recognize adjustments to the allowance based on its judgment about information available to it at the time of its examination.
Other Real Estate
Other real estate represents properties acquired through foreclosure or deed in lieu thereof. The property is classified as held for sale when the sale is probable and expected to occur within one year. The property is initially carried at fair value based on recent appraisals, less estimated costs to sell. Declines in the fair value of properties included in other real estate below carrying value are recognized by a charge to income.
Premises and Equipment
Premises and equipment are stated at cost less accumulated depreciation and amortization. Depreciation is computed on a straight-line basis over the estimated useful lives of the assets as follows: buildings and
59
Table of Contents
improvements, 10 to 50 years, and furniture and equipment, 3 to 10 years. Leasehold improvements are amortized on a straight-line basis over the shorter of the estimated life of the improvement or the term of the lease.
Intangible Assets
Intangible assets include goodwill and other identifiable assets, such as core deposit premiums, resulting from acquisitions. Core deposit premiums are amortized primarily on a straight-line basis over a ten-year life based upon historical studies of core deposits. Goodwill is not amortized but is tested annually for impairment or at any time an event occurs or circumstances change that may trigger a decline in the value of the reporting unit. Examples of such events or circumstances include adverse changes in legal factors, business climate, unanticipated competition, change in regulatory environment, or loss of key personnel.
FNB United has procedures to test goodwill for impairment on an annual basis or more frequently if necessary. The testing procedures evaluate possible impairment based on the following:
If the fair value of a reporting unit exceeds its carrying amount, goodwill of the reporting unit is considered not impaired and no second step is required. If not, a second test is required to measure the amount of goodwill impairment. The second test of the overall goodwill impairment compares the implied fair value of the reporting unit goodwill with the carrying amount of the goodwill. The impairment loss is equal to the excess of carrying value of goodwill over its implied fair value.
For the year ended December 31, 2008, the Company recorded impairment charges of $57.8 million to write down a portion of goodwill, leaving approximately $52.4 million in goodwill carried as an asset on the Company’s consolidated balance sheet as of year-end 2008.
The deteriorating economic conditions witnessed in 2008 and 2009 have significantly affected the banking industry in general and the Company’s financial results in particular during 2009. For 2009, the Company’s earnings have been negatively affected by continued low short-term interest rates, an increase in credit losses in the Bank’s loan portfolio, recognition of declines in the fair value of certain securities, and elevated levels of FDIC premiums. Due to the ongoing uncertainty in the general economy and the market, which may continue to negatively impact the Company’s performance and its stock price, the Company evaluated during 2009 its remaining goodwill for impairment.
As disclosed in the Company’s report on Form 10-Q for the quarter ended June 30, 2009, the Company determined that it did not meet the first step goodwill test at the second quarter end. The first step test was performed by averaging the net present value of projected earnings per share, the net present value of earnings per share, with consideration of both internal and analyst estimates of projections of earnings per share, and the current stock price multiplied by the estimated current control premium. The resulting average value was lower than the Company’s book value per share, indicating possible goodwill impairment.
Upon determining that the potential for goodwill impairment existed, a second step analysis was performed. In the second step test, the book value of the Company was compared to the aggregate fair values of the Company’s individual assets, liabilities and identified intangibles. The analysis was completed in the third quarter and showed that the carrying value of the Company’s goodwill exceeded its fair value and resulted in a third quarter noncash charge of $52.4 million, eliminating the remaining goodwill on the Company’s consolidated balance sheet. This charge had no effect on the Company’s liquidity, regulatory capital, or daily operations and was recorded as a component of noninterest expense on the consolidated statement of operations.
For a further discussion on impairment, see Note 2 – Intangible Assets.
Mortgage Servicing Rights (MSRs)
The rights to service mortgage loans for others are included in other assets on the consolidated balance sheet. MSRs are recorded at fair value on an ongoing basis, with changes in fair value recorded in the results of operations. A fair value analysis of MSRs is performed on a quarterly basis.
60
Table of Contents
Income Taxes
Income tax expense includes both a current provision based on the amounts computed for income tax return purposes and a deferred provision that results from application of the asset and liability method of accounting for deferred taxes. Under the asset and liability method, deferred tax assets and liabilities are established for the temporary differences between the financial reporting basis and the tax basis of the Company’s assets and liabilities at enacted tax rates expected to be in effect when such amounts are realized or settled. The effect on deferred tax assets and liabilities of a change in tax rates is recognized in income in the period that includes the enactment date.
The Company had a $22.3 million valuation allowance for deferred tax assets at December 31, 2009. In assessing the realization of deferred tax assets, management considers whether it is more likely than not that some portion or all of the deferred tax assets will not be realized. The ultimate realization of deferred income tax assets is dependent upon the generation of future taxable income during the periods in which those temporary differences become deductible and prior to their expiration governed by the federal Internal Revenue Code. Management considers the scheduled reversal of deferred tax liabilities, projected future taxable income, and tax planning strategies in making this assessment. Based upon the level of historical taxable income and projections for future taxable income over the periods during which the deferred income tax assets are expected to be deductible, management believes it is more likely than not the Company will realize the benefits of these deductible differences, net of the existing valuation allowance at December 31, 2009. The remaining amount of the deferred income tax asset is considered realizable. Although a valuation allowance was required for deferred tax assets at year end, there is no guarantee that an additional valuation allowance will not be required in the future. The deferred tax assets will be analyzed quarterly for changes affecting realization.
Earnings per Share (EPS)
As required for entities with complex capital structures, a dual presentation of basic and diluted EPS is included on the face of the income statement, and a reconciliation is provided in a footnote of the numerator and denominator of the basic EPS computation to the numerator and denominator of the diluted EPS computation.
Comprehensive Income
Comprehensive income is defined as the change in equity of an enterprise during a period from transactions and other events and circumstances from nonowner sources and, accordingly, includes both net income and amounts referred to as other comprehensive income. The items of other comprehensive income are included in the consolidated statement of shareholders’ equity and comprehensive income. The accumulated balance of other comprehensive income is included in the shareholders’ equity section of the consolidated balance sheet. The Company’s components of accumulated other comprehensive income at December 31, 2009 include unrealized gains (losses) on investment securities classified as available-for-sale, the effect of the defined benefit pension and other postretirement plans for employees, and the changes in the value of the interest rate swap on one issue of trust preferred securities. Accounting for this was initially applied at its adoption date of December 31, 2006.
For the twelve months ended December 31, 2009 and 2008, total other comprehensive loss was $(98.5) million and $(63.5) million, respectively. The deferred income tax benefit/(liability) related to the components of other comprehensive income amounted to $2.1 million and $2.4 million, respectively, for the same periods as previously mentioned.
The accumulated balances related to each component of other comprehensive loss are as follows:
| (dollars in thousands) | December 31, 2009 | December 31, 2008 | ||||||||||
| Pretax | After-tax | Pretax | After-tax | |||||||||
| Net unrealized securities gains/(losses) |
$ | 4,725 | $ | 2,864 | $ | (646) | $ | (371) | ||||
| Net unrealized gains on cash flow derivatives |
(408) | (249) | (491) | (300) | ||||||||
| Pension, other postretirement and postemployment benefit plan adjustments |
(6,103) | (3,723) | (5,996) | (3,658) | ||||||||
| Accumulated other comprehensive loss |
$ | (1,786) | $ | (1,108) | $ | (7,133) | $ | (4,329) | ||||
61
Table of Contents
Employee Benefit Plans
The Company has a defined benefit pension plan covering substantially all full-time employees. Pension costs, which are actuarially determined using the projected unit credit method, are charged to current operations. Annual funding contributions are made up to the maximum amounts allowable for Federal income tax purposes.
In September 2006, the Board of Directors of FNB United approved a modified freeze to the pension plan. Effective December 31, 2006, no new employees are eligible to enter the plan. Participants who were at least age 40, had earned 10 years of vesting service as an employee of FNB United and remained an active employee as of December 31, 2006 qualified for a grandfathering provision. Under the grandfathering provision, the participant will continue to accrue benefits under the plan through December 31, 2011. Additionally, the plan’s definition of final average compensation was improved from a 10-year averaging period to a 5-year averaging period as of January 1, 2007. All other eligible participants in the plan had their retirement benefit frozen as of December 31, 2006.
The Company has a noncontributory, nonqualified supplemental executive retirement plan (the “SERP”) covering certain executive employees. Annual benefits payable under the SERP are based on factors similar to those for the pension plan, with offsets related to amounts payable under the pension plan and social security benefits. SERP costs, which are actuarially determined using the projected unit credit method and recorded on an unfunded basis, are charged to current operations and credited to a liability account on the consolidated balance sheet.
Medical and life insurance benefits are provided by the Company on a postretirement basis under defined benefit plans covering substantially all full-time employees. Postretirement benefit costs, which are actuarially determined using the attribution method and recorded on an unfunded basis, are charged to current operations and credited to a liability account on the consolidated balance sheet.
In conjunction with the modified freeze of the pension plan, the postretirement medical and life insurance plan was also amended. Effective December 31, 2006, no new employees are eligible to enter the postretirement medical and life insurance plan. Participants who were at least age 40, had earned 10 years of vesting service as an employee of the Company and remained an active employee as of December 31, 2006 qualified for a grandfathering provision. Under the grandfathering provision, the participant will continue to accrue benefits under the plan through December 31, 2011.
Derivatives and Financial Instruments
A derivative is a financial instrument that derives its cash flows, and therefore its value, by reference to an underlying instrument, index or referenced interest rate. The Company uses derivatives primarily to manage interest rate risk related to mortgage servicing rights, and long-term debt. The fair value of derivatives in a gain or loss position is included in other assets or liabilities, respectively, on the Consolidated Balance Sheets.
The Company classifies its derivative financial instruments as either a hedge of an exposure to changes in the fair value of a recorded asset or liability (“fair value hedge”) or a hedge of an exposure to changes in the cash flows of a recognized asset, liability or forecasted transaction (“cash flow hedge”). The Company has master netting agreements with the derivatives dealers with which it does business, but reflects gross gains and losses on the Consolidated Balance Sheets.
The Company uses the long-haul method to assess hedge effectiveness. The Company documents, both at inception and over the life of the hedge, at least quarterly, its analysis of actual and expected hedge effectiveness. This analysis includes techniques such as regression analysis and hypothetical derivatives to demonstrate that the hedge has been, and is expected to be, highly effective in off-setting corresponding changes in the fair value or cash flows of the hedged item. For a qualifying fair value hedge, changes in the value of the derivatives that have been highly effective as hedges are recognized in current period earnings along with the corresponding changes in the fair value of the designated hedged item attributable to the risk being hedged. For a qualifying cash flow hedge, the portion of changes in the fair value of the derivatives that have been highly effective are recognized in other comprehensive income until the related cash flows from the hedged item are recognized in earnings.
For either fair value hedges or cash flow hedges, ineffectiveness may be recognized in noninterest income to the extent that changes in the value of the derivative instruments do not perfectly offset changes in the value of the hedged items attributable to the risk being hedged. If the hedge ceases to be highly effective, the Company discontinues hedge accounting and recognizes the changes in fair value in current period earnings. If a derivative
62
Table of Contents
that qualifies as a fair value or cash flow hedge is terminated or the designation removed, the realized or then unrealized gain or loss is recognized into income over the original hedge period (fair value hedge) or period in which the hedged item affects earnings (cash flow hedge). Immediate recognition in earnings is required upon sale or extinguishment of the hedged item (fair value hedge) or if it is probable that the hedged cash flows will not occur (cash flow hedge).
See Note 16 for additional information related to derivatives and financial instruments.
Other Than Temporary Impairment of Investment Securities
The Company’s policy regarding other than temporary impairment (OTTI) of investment securities requires continuous monitoring of those securities. The evaluation includes an assessment of both qualitative and quantitative measures to determine whether, in management’s judgment, the investment is likely to recover its original value. If the evaluation concludes that the investment is not likely to recover its original value, the unrealized loss is reported as an OTTI, and the loss is recorded as a securities transaction on the Consolidated Statement of (Loss) Income. If the evaluation indicates a loss of asset value, management may elect to record an OTTI immediately.
For debt securities, an impairment loss is recognized in earnings only when (1) the Company intends to sell the debt security; (2) it is more likely than not that the Company will be required to see the security before recovery of its amortized cost basis or (3) the Company does not expect to recover the entire amortized cost basis of the security. In situations where the Company intends to sell or when it is more likely than not that the Company will be required to sell the security, the entire impairment loss must be recognized in earnings. In all other situations, only the portion of the impairment loss representing the credit loss must be recognized in earnings, with the remaining portion being recognized in shareholders’ equity as a component of other comprehensive income, net of deferred taxes.
See Note 3 for additional information related to impairment testing.
Reclassification
Certain items for 2008 and 2007 have been reclassified to conform to the 2009 presentation. Such reclassifications had no effect on net income or shareholders’ equity as previously reported.
Note 2 – Intangible Assets
Business Combinations
For intangible assets related to business combinations, the following is a summary of the gross carrying amount and accumulated amortization of amortized intangible assets and the carrying amount of unamortized intangible assets:
| (dollars in thousands) | December 31, | |||||
| 2009 | 2008 | |||||
| Amortized intangible assets: |
||||||
| Core deposit premium related to whole bank acquisitions: |
||||||
| Carrying amount |
$ | 8,202 | $ | 8,202 | ||
| Accumulated amortization |
3,234 | 2,440 | ||||
| Net core deposit premium |
$ | 4,968 | $ | 5,762 | ||
| Unamortized intangible assets: |
||||||
| Goodwill |
$ | - | $ | 52,395 | ||
Amortization of intangibles totaled approximately $794,000 for core deposit premiums in 2009, $802,000 in 2008 and $814,000 in 2006. The estimated amortization expense for core deposit premiums is approximately $795,000 per year for years ending December 31, 2010 through 2014.
63
Table of Contents
The changes in the carrying amount of goodwill in 2009 and 2008 were as follows:
| (dollars in thousands) | Gross Balance | Accumulated Impairment Loss |
Net Balance | ||||||
| Balance, December 31, 2007 |
$ | 110,195 | $ | - | $ | 110,195 | |||
| Impairment losses |
- | (57,800) | (57,800) | ||||||
| Balance, December 31, 2008 |
110,195 | (57,800) | 52,395 | ||||||
| Impairment losses |
- | (52,395) | (52,395) | ||||||
| Balance, December 31, 2009 |
$ | 110,195 | $ | (110,195) | $ | - | |||
Goodwill represents the excess of the cost of an acquisition over the fair value of the net assets acquired. The Company is required to test for impairment on an annual basis, or more frequently if circumstances indicate that an asset might be impaired, by comparing the fair value of such goodwill to its recorded or carrying amount. If the carrying amount of goodwill exceeds the fair value, an impairment charge must be recorded in an amount equal to the excess.
The deteriorating economic conditions witnessed in 2008 and 2009 have significantly affected the banking industry in general and the Company’s financial results in particular during fiscal year 2009. During 2009, the Company’s earnings were negatively affected by continued low short-term interest rates, an increase in credit losses in the Bank’s loan portfolio, recognition of declines in the fair value of certain securities, and elevated levels of FDIC premiums. Due to the ongoing uncertainty in the general economy and the market, which may continue to negatively impact the Company’s performance and its stock price, the Company evaluated during the third quarter 2009 its remaining goodwill for impairment.
Upon determining that the potential for goodwill impairment existed, a second step analysis was performed. In the second step test, the book value of the Company was compared to the aggregate fair values of the Company’s individual assets, liabilities and identified intangibles. The analysis was completed in the third quarter and showed that the carrying value of the Company’s goodwill exceeded its fair value and resulted in a third quarter noncash charge of $52.4 million, eliminating the remaining goodwill on the Company’s consolidated balance sheet. This charge had no effect on the Company’s liquidity, regulatory capital, or daily operations and was recorded as a component of noninterest expense on the consolidated statement of operations.
Mortgage Servicing Rights
Mortgage loans serviced for others are not included in the consolidated balance sheet. The unpaid principal balance of mortgage loans serviced for others amounted to $453.3 million, $353.9 million and $287.2 million at December 31, 2009, 2008 and 2007, respectively.
The following is an analysis of mortgage servicing rights included in other assets on the consolidated balance sheet:
| (dollars in thousands) | Years Ended December 31, | ||||||||
| 2009 | 2008 | 2007 | |||||||
| Balance at beginning of year |
$ | 4,043 | $ | 2,900 | $ | 2,473 | |||
| Servicing rights capitalized |
1,642 | 1,182 | 1,094 | ||||||
| Amortization expense |
(1,019) | (616) | (461) | ||||||
| Change in valuation allowance |
191 | 577 | (206) | ||||||
| Balance at end of year |
$ | 4,857 | $ | 4,043 | $ | 2,900 | |||
The estimated amortization expense for mortgage servicing rights for the years ending December 31 is as follows: $760,101 in 2010, $663,237 in 2011, $567,237 in 2012, $481,462 in 2013, $407,150 in 2014, and $1,976,513 combined for all subsequent years. The estimated amortization expense is based on current information regarding loan payments and prepayments. Amortization expense could change in future periods based on changes in the volume of prepayments and economic factors.
64
Table of Contents
Note 3 – Investment Securities
The following table summarizes the amortized cost and estimated fair value of available-for-sale investment securities and the related gross unrealized gains and losses are presented below:
| (dollars in thousands) | Amortized Cost | Gross Unrealized Gains |
Gross Unrealized Losses |
Estimated Fair Value | ||||||||
| December 31, 2009 |
||||||||||||
| Obligations of: |
||||||||||||
| U.S. Treasury and government agencies |
$ | 61 | $ | 2 | $ | - | $ | 63 | ||||
| U.S. government sponsored agencies |
71,696 | 1,460 | 189 | 72,967 | ||||||||
| States and political subdivisions |
45,264 | 1,494 | 330 | 46,428 | ||||||||
| Residential mortgage-backed securities |
99,307 | 2,427 | 121 | 101,613 | ||||||||
| Collateralized debt obligations |
- | 45 | - | 45 | ||||||||
| Equity securities |
2,667 | - | 499 | 2,168 | ||||||||
| Corporate notes |
13,910 | 436 | - | 14,346 | ||||||||
| Total |
$ | 232,905 | $ | 5,864 | $ | 1,139 | $ | 237,630 | ||||
| December 31, 2008 |
||||||||||||
| Obligations of: |
||||||||||||
| U.S. Treasury and government agencies |
$ | 101 | $ | - | $ | - | $ | 101 | ||||
| U.S. government sponsored agencies |
91,975 | 2,596 | 230 | 94,341 | ||||||||
| States and political subdivisions |
38,336 | 943 | 343 | 38,936 | ||||||||
| Residential mortgage-backed securities |
66,583 | 1,544 | 11 | 68,116 | ||||||||
| Collateralized debt obligations |
4,962 | - | 4,309 | 653 | ||||||||
| Equity securities |
2,667 | - | 838 | 1,829 | ||||||||
| Corporate notes |
1,448 | 2 | - | 1,450 | ||||||||
| Total |
$ | 206,072 | $ | 5,085 | $ | 5,731 | $ | 205,426 | ||||
The following table summarizes the amortized cost and estimated fair value of held-to-maturity investment securities and the related gross unrealized gains and losses are presented below:
| (dollars in thousands) | Amortized Cost | Gross Unrealized Gains |
Gross Unrealized Losses |
Estimated Fair Value | ||||||||
| December 31, 2009 |
||||||||||||
| Obligations of: |
||||||||||||
| States and political subdivisions |
$ | 13,918 | $ | 486 | $ | - | $ | 14,404 | ||||
| Residential mortgage-backed securities |
52,127 | 1,155 | 260 | 53,022 | ||||||||
| Commercial mortgage-backed securities |
21,513 | 1,719 | - | 23,232 | ||||||||
| Corporate notes |
1,001 | - | 138 | 863 | ||||||||
| Total |
$ | 88,559 | $ | 3,360 | $ | 398 | $ | 91,521 | ||||
| December 31, 2008 |
||||||||||||
| Obligations of: |
||||||||||||
| U.S. government sponsored agencies |
$ | 2,008 | $ | 39 | $ | - | $ | 2,047 | ||||
| States and political subdivisions |
16,366 | 171 | 252 | 16,285 | ||||||||
| Residential mortgage-backed securities |
8,420 | 117 | 1 | 8,536 | ||||||||
| Corporate notes |
1,000 | - | 288 | 712 | ||||||||
| Total |
$ | 27,794 | $ | 327 | $ | 541 | $ | 27,580 | ||||
The amortized cost and estimated fair value of investment securities at December 31, 2009, by contractual maturity, are shown in the accompanying table. Actual maturities may differ from contractual maturities because issuers may have the right to prepay obligations with or without prepayment penalties.
65
Table of Contents
| (dollars in thousands) | Available-for-Sale | Held-to-Maturity | ||||||||||
| Amortized Cost |
Estimated Fair Value |
Amortized Cost |
Estimated Fair Value | |||||||||
| Due in one year or less |
$ | 12,014 | $ | 12,138 | $ | 1,555 | $ | 1,566 | ||||
| Due after one one year through five years |
45,228 | 46,595 | 5,679 | 5,747 | ||||||||
| Due after five years through 10 years |
48,837 | 49,169 | 5,906 | 6,136 | ||||||||
| Due after 10 years |
27,519 | 28,115 | 1,779 | 1,818 | ||||||||
| Total |
133,598 | 136,017 | 14,919 | 15,267 | ||||||||
| Mortgage-backed securities |
99,307 | 101,613 | 73,640 | 76,254 | ||||||||
| Total |
$ | 232,905 | $ | 237,630 | $ | 88,559 | $ | 91,521 | ||||
Debt securities with an estimated fair value of $104.3 million at December 31, 2009 and $104.6 million at December 31, 2008 were pledged to secure public funds and trust funds on deposit. Debt securities with an estimated fair value of $12.1 million at December 31, 2009 and $27.7 million at December 31, 2008 were pledged to secure retail repurchase agreements. Debt securities with an estimated fair value of $71.0 million at December 31, 2009 and $49.4 million at December 31, 2008 were pledged to secure advances from the Federal Home Loan Bank. Debt securities with an estimated fair value of $41.0 million at December 31, 2009 and $1.4 million at December 31, 2008 were pledged for other purposes.
Gross gains and losses recognized (by specific identification) on the sale of securities are summarized as follows:
| (dollars in thousands) | Years ended December 31, | ||||||||
| 2009 | 2008 | 2007 | |||||||
| Gains on sales of investment securities available-for-sale |
$ | 1,136 | $ | 664 | $ | - | |||
| Losses on sales of investment securities available-for-sale |
(147) | (18) | - | ||||||
| Net gains on other security activity |
66 | - | - | ||||||
| Total securities gains |
$ | 1,055 | $ | 646 | $ | - | |||
The Bank, as a member of the Federal Home Loan Bank (the “FHLB”) of Atlanta, is required to own capital stock in the FHLB of Atlanta based generally upon the balances of total assets and FHLB advances. FHLB capital stock is pledged to secure FHLB advances. This investment is carried at cost since no ready market exists for FHLB stock and there is no quoted market value. However, redemption of this stock has historically been at par value. At December 31, 2009 and 2008, the Bank owned a total of $12.9 million and $14.2 million, respectively, of FHLB stock. Due to the redemption provisions of FHLB stock, the Company estimated that fair value approximated to cost and that this investment was not impaired at December 31, 2009. FHLB stock is included in other assets at its original cost basis.
The Bank, as a member bank of the Federal Reserve Bank (the “FRB”) of Richmond, is required to own capital stock of the FRB of Richmond based upon a percentage of the Bank’s common stock and surplus. This investment is carried at cost since no ready market exists for FRB stock and there is no quoted market value. At December 31, 2009 and 2008, the Bank owned a total of $5.4 million and $5.3 million, respectively of FRB stock. Due to the nature of this investment in an entity of the U.S. Government, the Company estimated that fair value approximated the cost and that this investment was not impaired at December 31, 2009. FRB stock is included in other assets at its original cost basis.
Other investments are recorded at cost and are composed of the following:
| (dollars in thousands) | December 31, | |||||
| 2009 | 2008 | |||||
| Federal Home Loan Bank stock |
$ | 12,867 | $ | 14,184 | ||
| Federal Reserve Bank stock |
5,358 | 5,341 | ||||
| Silverton Bank stock |
- | 290 | ||||
| Other investments |
10 | 11 | ||||
| Total other investments |
$ | 18,235 | $ | 19,826 | ||
66
Table of Contents
The following table presents a summary of available-for-sale investment securities that had an unrealized loss at December 31:
| Less than 12 Months | 12 Months or More | Total | ||||||||||||||||
| (dollars in thousands) | Estimated Fair Value |
Gross Unrealized Losses |
Estimated Fair Value |
Gross Unrealized Losses |
Estimated Fair Value |
Gross Unrealized Losses | ||||||||||||
| December 31, 2009 |
||||||||||||||||||
| Obligations of: |
||||||||||||||||||
| U.S. government sponsored agencies |
$ | 11,289 | $ | 189 | $ | - | $ | - | $ | 11,289 | $ | 189 | ||||||
| States and political subdivisions |
15,077 | 263 | 799 | 67 | 15,876 | 330 | ||||||||||||
| Residential mortgage-backed securities |
4,334 | 121 | - | - | 4,334 | 121 | ||||||||||||
| Equity securities |
- | - | 2,667 | 499 | 2,667 | 499 | ||||||||||||
| Total |
$ | 30,700 | $ | 573 | $ | 3,466 | $ | 566 | $ | 34,166 | $ | 1,139 | ||||||
| December 31, 2008 |
||||||||||||||||||
| Obligations of: |
||||||||||||||||||
| U.S. Treasury and government agencies |
$ | 42 | $ | - | $ | - | $ | - | $ | 42 | $ | - | ||||||
| U.S. government sponsored agencies |
19,899 | 221 | 1,289 | 9 | 21,188 | 230 | ||||||||||||
| States and political subdivisions |
6,348 | 343 | - | - | 6,348 | 343 | ||||||||||||
| Residential mortgage-backed securities |
4,475 | 11 | - | - | 4,475 | 11 | ||||||||||||
| Collaterialized debt obligations |
- | - | 644 | 4,309 | 644 | 4,309 | ||||||||||||
| Equity securities |
52 | 11 | 2,615 | 827 | 2,667 | 838 | ||||||||||||
| Total |
$ | 30,816 | $ | 586 | $ | 4,548 | $ | 5,145 | $ | 35,364 | $ | 5,731 | ||||||
The following table presents a summary of held-to-maturity investment securities that had an unrealized loss at December 31:
| Less than 12 Months | 12 Months or More | Total | ||||||||||||||||
| (dollars in thousands) | Estimated Fair Value |
Gross Unrealized Losses |
Estimated Fair Value |
Gross Unrealized Losses |
Estimated Fair Value |
Gross Unrealized Losses | ||||||||||||
| December 31, 2009 |
||||||||||||||||||
| Residential mortgage-backed securities |
$ | 8,788 | $ | 260 | $ | - | $ | - | $ | 8,788 | $ | 260 | ||||||
| Corporate notes |
- | - | 863 | 138 | 863 | 138 | ||||||||||||
| Total |
$ | 8,788 | $ | 260 | $ | 863 | $ | 138 | $ | 9,651 | $ | 398 | ||||||
| December 31, 2008 |
||||||||||||||||||
| Obligations of: |
||||||||||||||||||
| States and political subdivisions |
$ | 1,916 | $ | 57 | $ | 4,126 | $ | 195 | $ | 6,042 | $ | 252 | ||||||
| Residential mortgage-backed securities |
4,488 | - | 227 | 1 | 4,715 | 1 | ||||||||||||
| Corporate notes |
- | - | 712 | 288 | 712 | 288 | ||||||||||||
| Total |
$ | 6,404 | $ | 57 | $ | 5,065 | $ | 484 | $ | 11,469 | $ | 541 | ||||||
Investment securities with an aggregate fair value of $4.3 million have had continuous unrealized losses of $0.7 million for more than twelve months as of December 31, 2009. These securities include county and municipal securities and corporate securities. The unrealized losses relate to fixed-rate debt securities that have incurred fair value reductions due to higher market interest rates and for certain securities, increased credit risk since the respective purchase date. The unrealized losses are not likely to reverse unless and until market interest rates and credit risk decline to the levels that existed when the securities were purchased. Since none of the unrealized losses relate to the marketability of the securities or the issuer’s ability to honor redemption obligations, and the Company has determined that it is not more likely than not that the Company will be required to sell the security before recovery of its amortized cost basis, none of the securities are deemed to be other than temporarily impaired.
Unrealized losses for all investment securities are reviewed to determine whether the losses are OTTI. Investment securities are evaluated on at least a quarterly basis and more frequently when economic or market conditions warrant such an evaluation to determine whether a decline in their value below amortized cost is other-than-temporary. In conducting this assessment, the Company evaluates a number of factors including, but not limited to:
67
Table of Contents
| • | How much fair value has declined below amortized cost; |
| • | How long the decline in fair value has existed; |
| • | The financial condition of the issuer; |
| • | Contractual or estimated cash flows of the security; |
| • | Underlying supporting collateral; |
| • | Past events, current conditions, forecasts; |
| • | Significant rating agency changes on the issuer; and |
| • | The Company’s intent and ability to hold the security for a period of time sufficient to allow for any anticipated recovery in fair value. |
The Company analyzed its securities portfolio at December 31, 2009, paying particular attention to its mortgage-backed securities, corporate bonds and municipal bonds. After considering ratings, fair value, cash flows and other factors, the Company does not believe securities to be OTTI except as discussed below.
Impairment of securities rated below investment grade was evaluated to determine if the Bank expects to not recover the entire amortized cost basis of the security. This evaluation was based on projections of estimated cash flows based on individual loans or issuers underlying each security using anticipated default rates and severities at foreclosure or default. Collectively, all non-rated securities are considered immaterial.
During 2009, the Bank identified one security with a principal amount of $5.0 million where expected cash flows were less than contractual cash flows. This security is backed by a pool of issuers of trust preferred securities. As of this date, issuers within the pool were either deferring or had defaulted on approximately 30% of the outstanding pool balance. The security owned by the Bank is in a subordinated position to other securities backed by the trust preferred pool and was not paying dividends since the second quarter; the Company does not expect to receive any further dividend.
The Bank performed two separate impairment tests assuming that current issuers in default would have no recovery, that a substantial amount of issuers currently deferring would default with a lower severity rate and that additional issuers would default. As a result of the impairment tests, the entire book value was considered impaired with the full amount written off. Though the Bank does not know what the ultimate default and severity rates will be, management determined that this evaluation represented the best estimate of expected loss under a severe stress scenario.
The following table, as of December 31, 2009, shows a roll forward of the amount related to credit losses recognized on debt securities held by the Company. There was no portion of an other-than-temporary impairment recognized in other comprehensive income as of December 31, 2009.
| (dollars in thousands) | December 31, 2009 | ||
| Balance of credit losses on debt securities at January 1, 2009 |
$ | - | |
| Increase related to the credit loss for an other-than-temporary impairment |
4,985 | ||
| Charge off of impaired security |
(4,985) | ||
| Balance of credit losses on debt securities at December 31, 2009 |
$ | - | |
68
Table of Contents
Note 4 – Loans
Major classifications of loans at December 31, are as follows:
| (dollars in thousands) | 2009 | 2008 | ||||
| Loans held for sale |
$ | 58,219 | $ | 36,138 | ||
| Loans held for investment: |
||||||
| Commercial and agricultural |
$ | 194,134 | $ | 184,909 | ||
| Real estate - construction |
394,427 | 453,668 | ||||
| Real estate - mortgage: |
||||||
| 1-4 family residential |
398,134 | 369,948 | ||||
| Commercial and other |
529,822 | 540,192 | ||||
| Consumer |
46,504 | 36,478 | ||||
| Gross loans held for investment |
1,563,021 | 1,585,195 | ||||
| Less: allowance for loan losses |
49,461 | 34,720 | ||||
| Loans held for investment, net of allowance |
$ | 1,513,560 | $ | 1,550,475 | ||
Loans as presented are reduced by net deferred loan fees of $0.4 million and $2.4 million at December 31, 2009 and 2008, respectively. Accruing loans past due 90 days or more amounted to $7.1 million at December 31, 2009 and $0.9 million at December 31, 2008. Nonaccrual loans amounted to $167.5 million at December 31, 2009 and $95.2 million at December 31, 2008. Interest income that would have been recorded on nonaccrual loans for the years ended December 31, 2009, 2008 and 2007, had they performed in accordance with their original terms, amounted to approximately $6.9 million, $6.0 million and $2.2 million, respectively. Interest income on all such loans included in the results of operations amounted to approximately $5.1 million in 2009, $4.4 million in 2008 and $0.8 million in 2007. Interest income on nonperforming loans is recorded when cash is actually received.
The following table presents the Bank’s investment in loans considered to be impaired and related information on those impaired loans as of December 31, 2009 and December 31, 2008:
| (dollars in thousands) | December 31, 2009 | December 31, 2008 | ||||
| Impaired loans without a related allowance for loan loss |
$ | 90,588 | $ | 82,838 | ||
| Impaired loans with a related allowance for loan loss |
98,010 | 33,262 | ||||
| Total impaired loans |
$ | 188,598 | $ | 116,100 | ||
| Allowance for loan loss related to impaired loans |
$ | 28,868 | $ | 15,032 | ||
The average carrying value of impaired loans was $140.7 million in 2009 and $38.1 million in 2008. Interest income recognized on impaired loans, exclusive of nonaccrual loans, amounted to approximately $1.7 million in 2009 $1.3 million in 2008 and $0.3 million in 2007.
Loans with outstanding balances of $34.7 million in 2009 and $6.9 million in 2008 were transferred from loans to other real estate acquired through foreclosure. Other real estate acquired through loan foreclosures amounted to $35.2 million at December 31, 2009 and $6.5 million at December 31, 2008.
Loans held for investment are primarily made in the region of North Carolina that includes Alamance, Alexander, Ashe, Catawba, Chatham, Gaston, Guilford, Iredell, Mecklenburg, Montgomery, Moore, Orange, Randolph, Richmond, Rowan, Scotland, Watauga and Wilkes counties. The real estate loan portfolio can be affected by the condition of the local real estate markets.
The Bank had loans outstanding to executive officers and directors and their affiliated companies during each of the past three years. Such loans were made substantially on the same terms, including interest rates and collateral, as those prevailing at the time for comparable transactions with other borrowers and do not involve more than the normal risks of collectability. The following table summarizes the transactions for the past two years.
69
Table of Contents
| (dollars in thousands) | 2009 | 2008 | ||||
| Balance at beginning of year |
$ | 10,302 | $ | 12,924 | ||
| Advances during year |
25,333 | 23,551 | ||||
| Repayments during year |
(20,853) | (26,173) | ||||
| Balance at end of year |
$ | 14,782 | $ | 10,302 | ||
Note 5 – Allowance for Loan Losses
Changes in the allowance for loan losses for the years ended December 31 were as follows:
| (dollars in thousands) | 2009 | 2008 | 2007 | ||||||
| Balance at beginning of year |
$ | 34,720 | $ | 17,381 | $ | 15,943 | |||
| Provision for losses charged to operations |
61,741 | 27,759 | 5,514 | ||||||
| Loans charged off |
(49,385) | (12,425) | (5,493) | ||||||
| Recoveries on loans previously charged off |
2,385 | 2,005 | 1,719 | ||||||
| Allowance adjustment for loans sold |
- | - | (302) | ||||||
| Balance at end of year |
$ | 49,461 | $ | 34,720 | $ | 17,381 | |||
Note 6 – Premises and Equipment
Premises and equipment at December 31 is summarized as follows:
| (dollars in thousands) | 2009 | 2008 | ||||
| Land |
$ | 11,675 | $ | 11,410 | ||
| Building and improvements |
37,476 | 38,567 | ||||
| Furniture and equipment |
31,247 | 29,781 | ||||
| Leasehold improvements |
1,655 | 1,848 | ||||
| Subtotal |
82,053 | 81,606 | ||||
| Less: accumulated depreciation and amortization |
33,938 | 30,659 | ||||
| Balance at end of year |
$ | 48,115 | $ | 50,947 | ||
Depreciation and amortization expense totaled $3.7 million, $3.5 million, and $3.6 million for the years ended December 31, 2009, 2008 and 2007, respectively.
Note 7 – Commitments
In the ordinary course of operations, the Company and the Bank are party to various legal proceedings. Neither the Company nor the Bank is involved in, nor have they terminated during the fourth quarter of 2009, any pending legal proceedings other than routine, nonmaterial proceedings occurring in the ordinary course of business.
The Company leases certain facilities and equipment for use in its business. The lease for facilities generally runs for periods of 10 to 20 years with various renewal options, while leases for equipment generally have terms not in excess of 5 years. The majority of the leases for facilities contain rental escalation clauses tied to changes in price indices. Certain real property leases contain purchase options. Management expects that most leases will be renewed or replaced with new leases in the normal course of business.
70
Table of Contents
Future obligations at December 31, 2009 for minimum rentals under non-cancelable operating lease commitments, primarily relating to premises, are as follows:
| (dollars in thousands) | |||
| Year ending December 31, |
|||
| 2010 |
$ | 1,451 | |
| 2011 |
1,157 | ||
| 2012 |
1,137 | ||
| 2013 |
1,123 | ||
| 2014 |
1,068 | ||
| Thereafter |
11,259 | ||
| Total lease commitments |
$ | 17,195 | |
Net rental expense for all operating leases amounted to $1,612,000, $1,530,000, and $1,538,000 for the years ended December 31, 2009, 2008 and 2007, respectively.
Note 8 – Income Taxes
The components of income tax expense for the years ended December 31 are as follows:
| (dollars in thousands) | 2009 | 2008 | 2007 | ||||||
| Current: |
|||||||||
| Federal |
$ | - | $ | 1,695 | $ | 4,873 | |||
| State |
32 | 243 | 790 | ||||||
| Total current taxes |
32 | 1,938 | 5,663 | ||||||
| Deferred |
|||||||||
| Federal |
(15,433) | (4,160) | 476 | ||||||
| State |
(2,952) | (896) | 147 | ||||||
| Total deferred taxes |
(18,385) | (5,056) | 623 | ||||||
| Increase in valuation allowance |
22,345 | - | - | ||||||
| Total income taxes |
$ | 3,992 | $ | (3,118) | $ | 6,286 | |||
A reconciliation of income tax expense computed at the statutory federal income tax rate to actual income tax expense is presented in the following table:
| (dollars in thousands) | 2009 | 2008 | 2007 | ||||||
| Amount of tax computed using Federal statutory tax rate of 35% in 2009, 2008 and 2007 |
$ | (34,196) | $ | (22,024) | $ | 6,527 | |||
| Increases (decreases) resulting from effects of: |
|||||||||
| Non-taxable income |
(648) | (740) | (746) | ||||||
| State income taxes, net of federal benefit |
(1,927) | (425) | 609 | ||||||
| Goodwill impairment |
18,338 | 20,230 | - | ||||||
| Other |
80 | (159) | (104) | ||||||
| Valuation allowance on deferred tax assets |
22,345 | - | - | ||||||
| Total |
$ | 3,992 | $ | (3,118) | $ | 6,286 | |||
71
Table of Contents
The components of deferred tax assets and liabilities and the tax effect of each are as follows:
| (dollars in thousands)
|
2009 | 2008 | ||||
| Deferred tax assets: |
||||||
| Allowance for loan losses |
$ | 19,833 | $ | 13,981 | ||
| Net operating loss |
13,384 | - | ||||
| Compensation and benefit plans |
2,192 | 2,144 | ||||
| Fair value basis of loans |
356 | 1,077 | ||||
| Pension and other post-retirement benefits |
1,878 | 1,836 | ||||
| Interest rate swap |
134 | 155 | ||||
| Net unrealized securities gains |
- | 430 | ||||
| Other |
877 | 237 | ||||
| Subtotal deferred tax assets |
38,654 | 19,860 | ||||
| Less: Valuation allowance |
(22,345) | - | ||||
| Total deferred tax assets |
16,309 | 19,860 | ||||
| Deferred tax liabilities: |
||||||
| Core deposit intangible |
1,962 | 2,275 | ||||
| Mortgage servicing rights |
1,918 | 1,596 | ||||
| Depreciable basis of premises and equipment |
1,490 | 1,561 | ||||
| Net deferred loan fees and costs |
969 | 636 | ||||
| Net unrealized securities gains |
1,869 | - | ||||
| SAB 109 valuation |
512 | 487 | ||||
| Other |
1,074 | 708 | ||||
| Total deferred tax liabilities |
9,794 | 7,263 | ||||
| Net deferred tax assets |
$ | 6,515 | $ | 12,597 | ||
Changes in net deferred tax asset were as follows:
| (dollars in thousands)
|
2009 | 2008 | ||||
| Balance at beginning of year |
$ | 12,597 | $ | 4,979 | ||
| Income tax effect from change in unrealized losses/(gains) on available-for-sale securities |
(2,299) | 788 | ||||
| Employee benefit plan |
43 | 1,642 | ||||
| Deferred income tax benefit/(expense) on continuing operations |
18,519 | 5,188 | ||||
| Valuation allowance on deferred tax assets |
(22,345) | - | ||||
| Balance at end of year |
$ | 6,515 | $ | 12,597 | ||
Under accounting principles generally accepted in the United States of America, the Company is not required to provide a deferred tax liability for the tax effect of additions to the tax bad debt reserve through 1987, the base year. Retained earnings at December 31, 2009 include approximately $2.7 million for which no provision for federal income tax has been made. These amounts represent allocations of income to bad debt deductions for tax purposes only. Reductions of such amounts for purposes other than bad debt losses could create income for tax purposes in certain remote instances, which would then be subject to the then current corporate income tax rate.
72
Table of Contents
Note 9 – Deposits
Deposits at December 31 are summarized as follows:
| (dollars in thousands) | 2009 | 2008 | ||||
| Noninterest-bearing demand deposits |
$ | 152,522 | $ | 150,273 | ||
| Interest-bearing demand deposits |
226,696 | 173,614 | ||||
| Savings deposits |
40,723 | 38,113 | ||||
| Money market deposits |
326,958 | 267,496 | ||||
| Brokered deposits |
112,340 | 90,108 | ||||
| Time deposits |
862,889 | 795,143 | ||||
| Total deposits |
$ | 1,722,128 | $ | 1,514,747 | ||
The aggregate amount of jumbo certificates of deposit, each with a minimum denomination of $100,000, was approximately $426 million and $408 million in 2009 and 2008, respectively. The accompanying table presents the scheduled maturities of time deposits at December 31, 2009.
| (dollars in thousands) | |||
| Year ending December 31, |
|||
| 2010 |
$ | 794,134 | |
| 2011 |
105,552 | ||
| 2012 |
62,690 | ||
| 2013 |
1,551 | ||
| 2014 |
10,810 | ||
| Thereafter |
492 | ||
| Total time deposits |
$ | 975,229 | |
Interest expense on time deposits of $100,000 or more amounted to $11.3 million in 2009, $15.5 million in 2008 and $18.0 million in 2007.
Note 10 – Short-Term Borrowings and Long-Term Debt
The following table stratifies the Bank’s borrowings as short-term and long-term as of December 31, 2009 and 2008:
| December 31, | ||||||||||
| (dollars in thousands) | 2009 | 2008 | ||||||||
| Balance | Rate | Balance | Rate | |||||||
| SHORT-TERM DEBT |
||||||||||
| Retail customer repurchase agreements |
$ | 13,592 | 0.70% | $ | 18,145 | 0.63% | ||||
| Federal funds purchased |
10,000 | 0.25% | 37,000 | 0.47% | ||||||
| Total short-term borrowings |
$ | 23,592 | $ | 55,145 | ||||||
| LONG-TERM DEBT |
||||||||||
| Federal Home Loan Bank advances |
$ | 166,165 | 3.19% | $ | 238,910 | 2.72% | ||||
| Subordinated debt |
15,000 | 3.75% | 15,000 | 4.96% | ||||||
| Junior subordinated debt |
56,702 | 1.77% | 56,702 | 3.25% | ||||||
| Total long-term debt |
$ | 237,867 | $ | 310,612 | ||||||
Retail Repurchase Agreements and Federal Funds Purchased
Funds are borrowed on an overnight basis through retail repurchase agreements with bank customers and federal funds purchased from other financial institutions. Retail repurchase agreement borrowings are collateralized by securities of the U.S. Treasury and U.S. Government agencies and corporations.
73
Table of Contents
At December 31, 2009, the Bank had a line of credit at the Federal Reserve Bank totaling $108.5 million, of which there was $10.0 million outstanding at year end.
Information concerning retail repurchase agreements and federal funds purchased is as follows:
| (dollars in thousands) | 2009 | 2008 | 2007 | |||||||||||||||||||||||||||
| Retail Repurchase Agreements |
Federal Funds Purchased |
Retail Repurchase Agreements |
Federal Funds Purchased |
Retail Repurchase Agreements |
Federal Funds Purchased |
|||||||||||||||||||||||||
| Balance at December 31 |
$ | 13,592 | $ | 10,000 | $ | 18,145 | $ | 37,000 | $ | 29,133 | $ | 13,500 | ||||||||||||||||||
| Average balance during the year |
18,737 | 58,609 | 29,954 | 21,310 | 28,783 | 3,102 | ||||||||||||||||||||||||
| Maximum month end balance |
22,693 | 90,000 | 35,815 | 62,400 | 33,354 | 13,500 | ||||||||||||||||||||||||
| Weighted average interest rate: |
||||||||||||||||||||||||||||||
| At December 31 |
0.70 | % | 0.25 | % | 0.63 | % | 0.47 | % | 4.20 | % | 4.25 | % | ||||||||||||||||||
| During the year |
0.68 | 0.27 | 2.17 | 2.35 | 4.58 | 5.22 | ||||||||||||||||||||||||
Federal Home Loan Bank (“FHLB”) Advances
The Bank had a $330.3 million line of credit with the FHLB at December 31, 2009, secured by blanket collateral agreements on qualifying mortgage loans and, as required, by other qualifying collateral. At December 31, 2009, FHLB advances under these lines amounted to $166.2 million and were at interest rates ranging from 0.36% to 6.15%. At December 31, 2008, FHLB advances amounted to $238.9 million and were at interest rates ranging from 0.46% to 6.15%.
At December 31, 2009, the scheduled maturities of FHLB advances payable over the next five years and thereafter, certain of which are callable at the option of the FHLB before scheduled maturity, are as follows:
| (dollars in thousands) | |||
| Year ending December 31, |
|||
| 2010 |
$ | 18,000 | |
| 2011 |
20,000 | ||
| 2012 |
25,000 | ||
| 2013 |
20,000 | ||
| 2014 |
14,887 | ||
| 2015 and thereafter |
68,278 | ||
| Total FHLB advances |
$ | 166,165 | |
74
Table of Contents
At December 31, 2009 the Company had additional borrowings outstanding as shown in the table below:
| (dollars in thousands) | December 31, 2009 | December 31, 2008 | |||||||||||
| Type of Borrowing |
Amount |
Maturity |
Rate |
Next |
Amount | ||||||||
| Retail customer repurchase agreements |
$ | 13,592 | Daily | 0.7025% | - | $ | 18,145 | ||||||
| Federal funds purchased - term |
10,000 | 01/14/10 | 0.2500% | - | - | ||||||||
| Federal funds purchased - overnight |
- | - | - | - | 37,000 | ||||||||
| SunTrust subordinated note |
15,000 | 06/30/15 | 3.7506% | - | 15,000 | ||||||||
| Junior subordinated debt to FNB Trust I |
20,619 | 12/15/35 | 1.6236% | - | 20,619 | ||||||||
| Junior subordinated debt to FNB Trust II |
30,928 | 06/30/36 | 1.5706% | - | 30,928 | ||||||||
| Junior subordinated debt to Catawba Trust II |
5,155 | 12/30/32 | 3.6006% | - | 5,155 | ||||||||
| Federal Home Loan Bank Advances |
|||||||||||||
| Convertible rate credit |
5,000 | 03/17/10 | 5.9200% | - | 5,000 | ||||||||
| Convertible rate credit |
1,000 | 03/17/10 | 5.7100% | - | 1,000 | ||||||||
| Convertible rate credit |
3,000 | 09/29/10 | 5.8700% | 03/29/10 | 3,000 | ||||||||
| Overnight daily rate credit |
9,000 | 12/03/10 | 0.3600% | - | 9,000 | ||||||||
| Convertible rate credit |
10,000 | 01/04/11 | 3.7825% | 01/04/10 | 10,000 | ||||||||
| Fixed rate credit |
10,000 | 06/20/11 | 4.1500% | - | 10,000 | ||||||||
| Fixed rate credit |
10,000 | 01/31/12 | 3.2810% | - | 10,000 | ||||||||
| Convertible rate credit |
15,000 | 09/04/12 | 3.2600% | 03/04/10 | 15,000 | ||||||||
| Fixed rate credit |
10,000 | 01/07/13 | 3.9000% | - | 10,000 | ||||||||
| Fixed rate credit |
10,000 | 03/04/13 | 3.4275% | - | 10,000 | ||||||||
| Convertible rate credit |
10,000 | 03/17/14 | 2.9850% | - | 10,000 | ||||||||
| Convertible rate credit |
5,000 | 12/29/14 | 3.3125% | 03/29/10 | 5,000 | ||||||||
| Fixed rate credit |
15,000 | 01/22/15 | 3.7810% | - | 15,000 | ||||||||
| Convertible rate credit |
3,000 | 09/08/15 | 3.7100% | 03/01/10 | 3,000 | ||||||||
| Convertible rate credit |
10,000 | 03/19/18 | 2.8100% | 03/29/12 | 10,000 | ||||||||
| Convertible rate credit |
20,000 | 07/16/18 | 2.4300% | 01/19/10 | 20,000 | ||||||||
| Convertible rate credit |
20,000 | 07/18/18 | 2.3300% | 01/19/10 | 20,000 | ||||||||
| Principal reducing credit |
445 | 08/27/18 | 6.1500% | - | 478 | ||||||||
| Fair value hedge adjustment |
(167 | ) | 01/22/15 | 1.3130% | - | - | |||||||
| Fair value hedge adjustment |
(63 | ) | 03/17/14 | 0.8430% | - | - | |||||||
| Fair value hedge adjustment |
(50 | ) | 03/04/13 | 1.7000% | - | - | |||||||
Junior Subordinated Deferrable Interest Debentures
FNB United has Junior Subordinated Deferrable Interest Debentures (“Junior Subordinated Debentures”) outstanding. Two issues of Junior Subordinated Debentures resulted from funds invested from the sale of trust preferred securities by FNB United Statutory Trust I (“FNB Trust I”) and by FNB United Statutory Trust II (“FNB Trust II”), which are owned by FNB United. Two additional issues of Junior Subordinated Debentures were acquired on April 28, 2006 as a result of the merger with Integrity Financial Corporation. These acquired issues resulted from funds invested from the sale of trust preferred securities by Catawba Valley Capital Trust I (“Catawba Trust I”) and by Catawba Valley Capital Trust II (“Catawba Trust II”), which were owned by Integrity and acquired by FNB United in the merger. FNB United initiated the redemption of the securities issued by Catawba Valley Trust I as of December 30, 2007 and that trust was subsequently dissolved.
FNB United fully and unconditionally guarantees the preferred securities issued by each trust through the combined operation of the debentures and other related documents. Obligations under these guarantees are unsecured and subordinate to senior and subordinated indebtedness of the Company. The preferred securities qualify as Tier 1 and Tier 2 capital for regulatory capital purposes.
75
Table of Contents
Information concerning the Junior Subordinated Debentures at December 31, 2009 and 2008 is as follows:
| Issuer | Stated Date |
Commencement Period |
Principal
Amount (in thousands) |
Interest Rate | ||||||||
| 12/31/09 | 12/31/08 | |||||||||||
| FNB Trust I |
12/15/35 | 12/15/10 | $ | 20,619 | $ | 20,619 | 3 month LIBOR + 1.37% = 1.623630% at 12/31/09 | |||||
| FNB Trust II |
06/30/36 | 06/30/11 | 30,928 | 30,928 |
3 month LIBOR + 1.32% = 1.570630% at 12/31/09 | |||||||
| Catawba Trust II |
12/30/32 | 12/30/07 | 5,155 | 5,155 |
3 month LIBOR + 3.35% = 3.600630% at 12/31/09 | |||||||
| Total Junior Subordinated Debentures |
$ | 56,702 | $ | 56,702 | ||||||||
Note 11 – Employee Benefit Plans
Pension Plan
The Company has a noncontributory defined benefit pension plan covering substantially all full-time employees who qualify as to age and length of service. Benefits are based on the employee’s compensation, years of service and age at retirement. The Company’s funding policy is to contribute annually to the plan an amount which is not less than the minimum amount required by the Employee Retirement Income Security Act of 1974 and not more than the maximum amount deductible for income tax purposes.
In September 2006, the Board of Directors of the Company approved a modified freeze to the pension plan. Effective December 31, 2006, no new employees are eligible to enter the plan. Participants who were at least age 40, had earned 10 years of vesting service as an employee of the Company and remained an active employee as of December 31, 2006 qualified for a grandfathering provision. Under the grandfathering provision, the participant will continue to accrue benefits under the plan through December 31, 2011. Additionally, the plan’s definition of final average compensation was improved from a 10-year averaging period to a 5-year averaging period as of January 1, 2007. All other eligible participants in the plan had their retirement benefit frozen as of December 31, 2006.
76
Table of Contents
The following table sets forth the plan’s change in benefit obligation, plan assets and the funded status of the pension plan, using a December 31 measurement date, and amounts recognized in the consolidated statements as of December 31:
| (dollars in thousands) | 2009 | 2008 | ||||
| Change in Benefit Obligation |
||||||
| Benefit obligation at beginning of year |
$ | 10,868 | $ | 10,421 | ||
| Service cost |
199 | 213 | ||||
| Interest cost |
675 | 665 | ||||
| Net actuarial loss |
470 | 61 | ||||
| Benefits paid |
(512) | (492) | ||||
| Benefit obligation at end of year |
$ | 11,700 | $ | 10,868 | ||
| Change in Plan Assets |
||||||
| Fair value of plan assets at beginning of year |
$ | 7,168 | $ | 10,681 | ||
| Actual return on plan assets |
157 | (3,021) | ||||
| Employer contributions |
632 | - | ||||
| Benefits paid |
(512) | (492) | ||||
| Fair value of plan assets at December 31 |
$ | 7,445 | $ | 7,168 | ||
| Funded Status at End of Year |
$ | (4,255) | $ | (3,700) | ||
| Amounts Recognized in the Consolidated Balance Sheets |
||||||
| Other Assets |
$ | - | $ | - | ||
| Other Liabilities |
(4,255) | (3,700) | ||||
| Total liabilities recognized in consolidated balance sheets |
$ | (4,255) | $ | (3,700) | ||
| Amounts Recognized in Accumulated Other Comprehensive Income |
||||||
| Net actuarial loss |
$ | 5,654 | $ | 5,096 | ||
| Prior service credit |
1 | 5 | ||||
| Net amount recognized |
$ | 5,655 | $ | 5,101 | ||
| Weighted-Average Allocation of Plan Assets at End of Year |
||||||
| Equity securities |
48.00% | 39.00% | ||||
| Debt securities |
47.00% | 52.00% | ||||
| Cash and cash equivalents |
3.00% | 9.00% | ||||
| Fixed income funds |
2.00% | - | ||||
| Total |
100.00% | 100.00% | ||||
| Weighted-Average Plan Assumptions at End of Year |
||||||
| Discount rate |
6.00% | 6.50% | ||||
| Expected long-term rate of return on plan assets |
8.00% | 8.00% | ||||
| Rate of increase in compensation levels |
5.50% | 5.50% | ||||
The expected long-term rate of return on plan assets considers the portfolio as a whole and not on the sum of the returns on individual asset categories. The return is based exclusively on historical returns, without adjustments.
77
Table of Contents
Components of net periodic pension cost (income) and other amounts recognized in other comprehensive income are as follows:
| (dollars in thousands) | 2009 | 2008 | 2007 | ||||||
| Net Periodic Pension Cost/(Income) |
|||||||||
| Service cost |
$ | 199 | $ | 212 | $ | 267 | |||
| Interest cost |
675 | 665 | 627 | ||||||
| Expected return on plan assets |
(553) | (838) | (944) | ||||||
| Amortization of prior service cost |
4 | 4 | 4 | ||||||
| Amortization of net actuarial loss |
307 | 11 | 26 | ||||||
| Total pension cost/(income) |
$ | 632 | $ | 54 | $ | (20) | |||
| Other Changes in Plan Assets and Benefit Obligations |
|||||||||
| Recognized in Other Comprehensive Income: |
|||||||||
| Net actuarial (gain)/loss |
$ | 558 | $ | 3,910 | $ | (546) | |||
| Amortization of prior service credit |
(4) | (4) | (4) | ||||||
| Total recognized in other comprehensive income |
554 | 3,906 | (550) | ||||||
| Total Recognized in Net Periodic Pension Cost/(Income) and Other Comprehensive Income |
$ | 1,186 | $ | 3,960 | $ | (570) | |||
The estimated net loss and prior service cost that will be amortized from accumulated other comprehensive income into net periodic pension cost over the next year are approximately $363,000 and $1,000 respectively.
The Company’s investment policies and strategies for the pension plan use a target allocation of 50% to 60% for equity securities and 40% to 50% for debt securities. The investment goals attempt to maximize returns while remaining within specific risk management policies. While the risk management policies permit investment in specific debt and equity securities, a significant percentage of total plan assets is maintained in mutual funds, approximately 9.7% at December 31, 2009, to assist in investment diversification. Generally the investments are readily marketable and can be sold to fund benefit payment obligations as they become payable.
The following table provides the fair values of investments held in the pension plan by major asset category:
| December 31, 2009 | Quoted Prices in Active Markets for Identical Assets |
Significant Other Observable Inputs | |||||||
| (dollars in thousands) | Fair Value | (Level 1) | (Level 2) | ||||||
| Equity securities |
$ | 3,559 | $ | 3,559 | $ | - | |||
| Debt securities |
3,643 | - | 3,643 | ||||||
| Other |
243 | - | 243 | ||||||
| Total fair value of pension assets |
$ | 7,445 | $ | 3,559 | $ | 3,886 | |||
| December 31, 2008 | Quoted Prices in Active Markets for Identical Assets |
Significant Other Observable Inputs | |||||||
| (dollars in thousands) | Fair Value | (Level 1) | (Level 2) | ||||||
| Equity securities |
$ | 2,809 | $ | 2,809 | $ | - | |||
| Debt securities |
3,793 | - | 3,793 | ||||||
| Other |
566 | - | 566 | ||||||
| Total fair value of pension assets |
$ | 7,168 | $ | 2,809 | $ | 4,359 | |||
78
Table of Contents
The equity securities measured at fair value consist primarily of stock mutual funds (Level 1 inputs) and common and collective trust funds (Level 2 inputs). Debt securities include corporate bonds and bond mutual funds (Level 1 inputs), U.S. government and agency securities and obligations of state and political subdivisions (Level 2 input). Other investments consist of cash, money market deposits and certificates of deposit (Level 2 inputs). For further information regarding levels of input used to measure fair value, refer to Note 16.
In 2009, the Company contributed $632,000 to its pension plan. The Company does not expect to contribute any funds to its pension plan in 2010.
The estimated benefit payments for each year ending December 31 from 2010 through 2014 are as follows: $542,000 in 2010, $573,000 in 2011, $593,000 in 2012, $619,000 in 2013 and $686,000 in 2014. The estimated benefit payments to be paid in the aggregate for the five year period from 2015 through 2019 are $3,967,000. The estimated benefit payments are based on the same assumptions used to measure the benefit obligation at December 31, 2009 and include estimated future employee service.
Supplemental Executive Retirement Plan
The Company has a noncontributory, nonqualified supplemental executive retirement plan (the “SERP”) covering certain executive employees. Annual benefits payable under the SERP are based on factors similar to those for the pension plan, with offsets related to amounts payable under the pension plan and social security benefits.
The following table sets forth the plan’s change in benefit obligation, plan assets and the funded status of the SERP plan, using a December 31 measurement date, and amounts recognized in the consolidated statements as of December 31:
| (dollars in thousands) | 2009 | 2008 | ||||
| Change in Benefit Obligation |
||||||
| Benefit obligation at beginning of year |
$ | 2,677 | $ | 2,269 | ||
| Service cost |
200 | 257 | ||||
| Interest cost |
133 | 150 | ||||
| Amendments to plan |
- | 83 | ||||
| Net actuarial gain |
(466) | (11) | ||||
| Benefits paid |
(71) | (71) | ||||
| Benefit obligation at end of year |
$ | 2,473 | $ | 2,677 | ||
| Change in Plan Assets |
||||||
| Fair value of plan assets at beginning of year |
$ | - | $ | - | ||
| Actual return on plan assets |
- | - | ||||
| Employer contributions |
71 | 71 | ||||
| Benefits paid |
(71) | (71) | ||||
| Fair value of plan assets at end of year |
$ | - | $ | - | ||
| Funded Status at December 31 |
$ | (2,473) | $ | (2,677) | ||
| Amounts Recognized in the Consolidated Balance Sheets |
||||||
| Other Liabilities |
$ | 2,473 | $ | 2,677 | ||
| Amounts Recognized in Accumulated Other |
||||||
| Comprehensive Income |
||||||
| Net actuarial (gain)/loss |
$ | (140) | $ | 318 | ||
| Prior service cost |
283 | 330 | ||||
| Net amount recognized |
$ | 143 | $ | 648 | ||
| Weighted-Average Plan Assumption at End of Year: |
||||||
| Discount rate |
6.00% | 6.50% | ||||
79
Table of Contents
Components of net periodic SERP cost and other amounts recognized in other comprehensive income are as follows:
| (dollars in thousands) | 2009 | 2008 | 2007 | ||||||
| Net Periodic SERP Cost |
|||||||||
| Service cost |
$ | 200 | $ | 257 | $ | 139 | |||
| Interest cost |
133 | 150 | 132 | ||||||
| Expected return on plan assets |
- | - | - | ||||||
| Amortization of prior service cost |
47 | 78 | 70 | ||||||
| Amortization of net actuarial loss |
(7) | 8 | 27 | ||||||
| Net periodic SERP cost |
$ | 373 | $ | 493 | $ | 368 | |||
| Other Changes in Plan Assets and Benefit Obligations |
|||||||||
| Recognized in Other Comprehensive Income |
|||||||||
| Net actuarial gain |
$ | (458) | $ | 63 | $ | (234) | |||
| Prior service cost |
- | - | - | ||||||
| Amortization of prior service credit |
(47) | (78) | (70) | ||||||
| Total recognized in other comprehensive loss |
(505) | (15) | (304) | ||||||
| Total Recognized in Net Periodic SERP Cost and Other Comprehensive (Loss) Income |
$ | (132) | $ | 478 | $ | 64 | |||
The estimated net loss and prior service cost that will be amortized from accumulated other comprehensive income into net periodic SERP cost over the next year are approximately $0 and $48,000 respectively.
The SERP is an unfunded plan. Consequently, there are no plan assets or cash contribution requirements other than for the direct payment of benefits.
The estimated benefit payments for each year ending December 31 from 2010 through 2014 are as follows: $93,000 in 2010, $92,000 in 2011, $105,000 in 2012, $103,000 in 2013 and $102,000 in 2014. The estimated benefit payments to be paid in the aggregate for the five year period from 2015 through 2019 are $1,227,000. The estimated benefit payments are based on the same assumptions used to measure the benefit obligation at December 31, 2009 and include estimated future employee service.
As a result of the merger with Integrity, the Bank assumed the obligations of a non-qualifying deferred compensation plan for the former president of Integrity. Under the plan provisions, benefit payments began in 2006 and are payable for 10 years. During 2009, 2008 and 2007 provisions of $43,000, $2,000 and $34,000, respectively, were expensed for future benefits to be provided under this plan. The total liability under this plan was $435,000 at December 31, 2009 and is included in other liabilities in the accompanying consolidated balance sheets. Payments amounting to $60,000 in 2009, $57,000 in 2008 and $49,000 in 2007 were made under the provisions of the plan.
Other Postretirement Defined Benefit Plans
The Company has postretirement medical and life insurance plans covering substantially all full-time employees who qualify as to age and length of service. The medical plan is contributory, with retiree contributions adjusted whenever medical insurance rates change. The life insurance plan is noncontributory.
In conjunction with the modified freeze of the pension plan, the postretirement medical and life insurance plan was also amended. Effective December 31, 2006, no new employees are eligible to enter the plan. Participants who were at least age 40, had earned 10 years of vesting service as an employee of the Company and remained an active employee as of December 31, 2006 qualified for a grandfathering provision. Under the grandfathering provision, the participant will continue to accrue benefits under the plan through December 31, 2011.
80
Table of Contents
The following table sets forth the plans change in benefit obligation, plan assets and the funded status of the postretirement plans, using a December 31 measurement date, and amounts recognized in the consolidated statements as of December 31:
| (dollars in thousands) | ||||||
| 2009 | 2008 | |||||
| Change in Benefit Obligation |
||||||
| Benefit obligation at beginning of year |
$ | 1,435 | $ | 1,139 | ||
| Service cost |
22 | 23 | ||||
| Interest cost |
91 | 86 | ||||
| Net actuarial loss |
74 | 225 | ||||
| Plan participant contributions |
59 | 55 | ||||
| Benefits paid |
(94) | (93) | ||||
| Benefit obligation at end of year |
$ | 1,587 | $ | 1,435 | ||
| Change in Plan Assets |
||||||
| Fair value of plan assets at beginning of year |
$ | - | $ | - | ||
| Actual return on plan assets |
- | - | ||||
| Employer contributions |
35 | 38 | ||||
| Plan participant contributions |
59 | 55 | ||||
| Benefits paid |
(94) | (93) | ||||
| Fair value of plan assets at end of year |
$ | - | $ | - | ||
| Funded Status at December 31 |
$ | (1,587) | $ | (1,435) | ||
| Amounts Recognized in the Consolidated Balance Sheets |
||||||
| Other Liabilities |
$ | 1,587 | $ | 1,435 | ||
| Amounts Recognized in Accumulated Other |
||||||
| Comprehensive Income |
||||||
| Net actuarial loss |
$ | 387 | $ | 333 | ||
| Prior service credit |
(33) | (38) | ||||
| Net amount recognized |
$ | 354 | $ | 295 | ||
| Weighted-Average Plan Assumption at End of Year: |
||||||
| Discount rate |
6.00% | 6.50% | ||||
Increasing or decreasing the assumed medical cost trend rate by one percentage point would not have a significant effect on either the postretirement benefit obligation at December 31, 2009 or the aggregate of the service and interest cost components of net periodic postretirement benefit cost for the year ended December 31, 2009.
81
Table of Contents
Components of net postretirement benefit cost and other amounts recognized in other comprehensive income are as follows:
| (dollars in thousands) | 2009 | 2008 | 2007 | ||||||
| Net Periodic Postretirement Benefit Cost |
|||||||||
| Service cost |
$ | 22 | $ | 23 | $ | 15 | |||
| Interest cost |
91 | 86 | 68 | ||||||
| Expected return on plan assets |
- | - | - | ||||||
| Amortization of prior service cost/(credit) |
(4) | (4) | (4) | ||||||
| Amortization of transition obligation |
- | - | - | ||||||
| Amortization of net actuarial loss |
19 | 23 | 8 | ||||||
| Net periodic postretirement benefit cost |
$ | 128 | $ | 128 | $ | 87 | |||
| Other Changes in Plan Assets and Benefit Obligations |
|||||||||
| Recognized in Other Comprehensive Income |
|||||||||
| Net actuarial (gain)/loss |
$ | 55 | $ | 202 | $ | (166) | |||
| Prior service cost |
- | - | - | ||||||
| Amortization of prior service cost |
4 | 4 | 4 | ||||||
| Total recognized in other comprehensive income |
59 | 206 | (162) | ||||||
| Total Recognized in Net Periodic Postretirement Benefit Cost/(Income) and Other Comprehensive Income |
$ | 187 | $ | 334 | $ | (75) | |||
The estimated net loss and prior service credit that will be amortized from accumulated other comprehensive income into net periodic postretirement benefit cost over the next year are approximately $25,000 and $(4,000), respectively.
The postretirement medical and life insurance plans are unfunded plans. Consequently, there are no plan assets or cash contribution requirements other than for the direct payment of benefits.
The estimated benefit payments for each year ending December 31 from 2010 through 2014 are as follows: $75,000 in 2010, $91,000 in 2011, $103,000 in 2012, $112,000 in 2013 and $110,000 in 2014. The estimated benefit payments to be paid in the aggregate for the five year period from 2015 through 2019 are $586,000. The estimated benefit payments are based on the same assumptions used to measure the benefit obligation at December 31, 2009 and include estimated future employee service.
There have been amendments to several existing pronouncements that address employers’ accounting and reporting for defined benefit pension and other postretirement plans and represent the initial phase of a comprehensive project on employers’ accounting for these plans. An employer is required to recognize the overfunded or underfunded status of defined benefit pension and other postretirement plans, measured solely as the difference between the fair value of plan assets and the benefit obligation, as an asset or liability on the balance sheet. Unrecognized actuarial gains and losses and unrecognized prior service costs, which have previously been recorded as part of the postretirement asset or liability, are to be included as a component of accumulated other comprehensive income. Actuarial gains and losses and prior service costs and credits that arise during a period will be included in other comprehensive income to the extent they are not included in net periodic pension cost (a component of salaries and employee benefits expense for the Company). The Company adopted the governing pronouncement on its effective date of December 31, 2006.
Matching Retirement/Savings Plan
The Company has a matching retirement/savings plan which permits eligible employees to make contributions to the plan up to a specified percentage of compensation as defined by the plan. A portion of the employee contributions are matched by the Company based on the plan formula. Additionally, commencing in 2007, the Company on a discretionary basis may make an annual contribution up to a specified percentage of compensation as defined by the plan to the account of each eligible employee. During 2009, the Company lowered its matching contribution from
82
Table of Contents
6 % to 3%. The matching and discretionary contributions amounted to $701,000 in 2009, $1,161,000 in 2008, and $1,749,000 in 2007.
Note 12 – FNB United Corp. (Parent Company)
The parent company’s principal asset is its investment in its bank subsidiary, CommunityONE Bank. The principal source of income of the parent company is dividends received from the Bank.
| (dollars in thousands) | 2009 | 2008 | 2007 | ||||||
| Condensed Balance Sheets |
|||||||||
| Assets: |
|||||||||
| Cash |
$ | 4,106 | $ | 3,712 | |||||
| Investment in wholly-owned subsidiary, the Bank |
149,421 | 200,024 | |||||||
| Other assets |
2,157 | 2,377 | |||||||
| Total Assets |
$ | 155,684 | $ | 206,113 | |||||
| Liabilities and shareholders’ equity: |
|||||||||
| Accrued liabilities |
$ | 623 | $ | 1,494 | |||||
| Borrowed funds |
56,702 | 56,702 | |||||||
| Shareholder’s equity |
98,359 | 147,917 | |||||||
| Total Shareholders’ Equity and Liabilities |
$ | 155,684 | $ | 206,113 | |||||
| Condensed Statements of Income |
|||||||||
| Dividends from subsidiary |
$ | 1,200 | $ | 9,525 | $ | 10,900 | |||
| Noninterest income |
42 | 86 | 130 | ||||||
| Interest expense |
(1,741) | (2,903) | (4,425) | ||||||
| Noninterest expense |
(406) | (160) | (323) | ||||||
| Income before tax benefit |
(905) | 6,548 | 6,282 | ||||||
| Income tax benefit |
(744) | (1,049) | (1,616) | ||||||
| Income before equity in undistributed net income of subsidiary |
(161) | 7,597 | 7,898 | ||||||
| Equity in undistributed net (loss)/income of subsidiary |
(101,535) | (67,406) | 4,463 | ||||||
| Net (loss)/income |
(101,696) | (59,809) | 12,361 | ||||||
| Preferred stock dividends |
(2,871) | - | - | ||||||
| Net (Loss)/Income to Common Shareholders |
$ | (104,567) | $ | (59,809) | $ | 12,361 | |||
| Condensed Statements of Cash Flows |
|||||||||
| Cash flows from operating activities |
|||||||||
| Net (loss)/income |
$ | (101,696) | $ | (59,809) | $ | 12,361 | |||
| Adjustments to reconcile net income to net cash provided by operating activities: |
|||||||||
| Equity in undistributed net loss/(income) of subsidiary |
101,535 | 67,406 | (4,463) | ||||||
| Other, net |
215 | (1,236) | 5,300 | ||||||
| Net cash provided by operating activities |
54 | 6,361 | 13,198 | ||||||
| Cash flows from investing activities |
|||||||||
| Net cash (used in) investing activities |
- | - | - | ||||||
| Cash flows from financing activities |
|||||||||
| Increase/(decrease) in borrowed funds |
4,000 | - | (5,000) | ||||||
| Common stock issued |
- | 2 | 1,302 | ||||||
| Cash dividends paid |
(3,660) | (5,712) | (7,035) | ||||||
| Net cash provided by (used in) financing activities |
340 | (5,710) | (10,733) | ||||||
| Net increase in cash |
394 | 651 | 2,465 | ||||||
| Cash at beginning of period |
3,712 | 3,061 | 596 | ||||||
| Cash at end of period |
$ | 4,106 | $ | 3,712 | $ | 3,061 | |||
83
Table of Contents
Note 13 – Regulatory Matters
FNB United and the Bank are required to comply with capital adequacy standards established by the Board of Governors of the Federal Reserve System. In addition, the Bank is subject to various regulatory capital requirements administered by federal banking agencies. Failure to meet minimum capital requirements can initiate certain mandatory – and possible additional discretionary – actions by regulators that, if undertaken, could have a direct material effect on the Bank’s financial statements. Under capital adequacy guidelines and the regulatory framework for prompt corrective action, the Bank must meet specific capital guidelines that involve quantitative measures of assets, liabilities, and certain off-balance-sheet items as calculated under regulatory accounting practices. The Bank’s capital amounts and classification are also subject to qualitative judgments by the regulators about components, risk weighting, and other factors.
Quantitative measures established by regulation to ensure capital adequacy require the Bank to maintain minimum amounts and ratios (set forth in the accompanying table) of total and Tier 1 capital (as defined in the regulations) to risk-weighted assets (as defined), and of Tier 1 capital to average assets (as defined). Management believes, as of December 31, 2009, that the Bank meets all capital adequacy requirements to which they are subject. The Company anticipates that it will be subject to increased minimum capital requirements as part of an expected formal agreement with the Comptroller of the Currency. See Note 19.
The Bank is well-capitalized under the prompt corrective action provisions established by the Federal Deposit Insurance Corporation Improvement Act. To be categorized as well capitalized the Bank must maintain minimum total risk-based, Tier 1 risk-based, and Tier 1 leverage ratios as set forth in the accompanying table.
| (dollars in thousands) | Actual | For Capital Adequacy Purposes |
To Be Well Capitalized Under Prompt Corrective Action Provisions | ||||||||||||
| Amount | Ratio | Amount | Ratio | Amount | Ratio | ||||||||||
| December 31, 2009 |
|||||||||||||||
| Total Capital (to Risk Weighted Assets) |
|||||||||||||||
| Consolidated |
$ | 181,990 | 10.3 % | $ | 141,452 | ³8.0 % | $ | N/A | |||||||
| Bank |
178,023 | 10.1 | 141,265 | ³8.0 | 176,582 | ³10.0 % | |||||||||
| Tier 1 Capital (to Risk Weighted Assets) |
|||||||||||||||
| Consolidated |
121,207 | 6.9 | 70,726 | ³4.0 | N/A | ||||||||||
| Bank |
140,604 | 8.0 | 70,633 | ³4.0 | 105,949 | ³6.0 % | |||||||||
| Tier 1 Capital (to Average Assets) |
|||||||||||||||
| Consolidated |
121,207 | 5.7 | 85,283 | ³4.0 | N/A | ||||||||||
| Bank |
140,604 | 6.6 | 85,164 | ³4.0 | 106,455 | ³5.0 % | |||||||||
| December 31, 2008 |
|||||||||||||||
| Total Capital (to Risk Weighted Assets) |
|||||||||||||||
| Consolidated |
$ | 185,312 | 10.4 % | $ | 142,738 | ³8.0 % | $ | N/A | |||||||
| Bank |
182,084 | 10.2 | 142,513 | ³8.0 | 178,142 | ³10.0 % | |||||||||
| Tier 1 Capital (to Risk Weighted Assets) |
|||||||||||||||
| Consolidated |
123,796 | 6.9 | 71,369 | ³4.0 | N/A | ||||||||||
| Bank |
144,654 | 8.1 | 71,257 | ³4.0 | 106,885 | ³6.0 % | |||||||||
| Tier 1 Capital (to Average Assets) |
|||||||||||||||
| Consolidated |
123,796 | 6.1 | 81,051 | ³4.0 | N/A | ||||||||||
| Bank |
144,654 | 7.2 | 80,904 | ³4.0 | 101,131 | ³5.0 % | |||||||||
Certain regulatory requirements restrict the lending of funds by the Bank to FNB United and the amount of dividends which can be paid to FNB United. Beginning in 2009, the Bank cannot declare dividends payable to FNB United, without the approval of the Comptroller of the Currency.
The Bank is required to maintain average reserve balances with the Federal Reserve Bank based on a percentage of deposits. For the reserve maintenance period in effect at December 31, 2009, the average daily reserve requirement was $3,500,000.
84
Table of Contents
Note 14 – Shareholders’ Equity
Earnings per Share (“EPS”)
Basic net income per share, or basic EPS, is computed by dividing net income by the weighted average number of common shares outstanding for the period. Diluted EPS reflects the potential dilution that could occur if the Company’s potential common stock and contingently issuable shares, which consist of dilutive stock options and restricted stock, were exercised. The numerator of the basic EPS computation is the same as the numerator of the diluted EPS computation for all periods presented. A reconciliation of the denominators of the basic and diluted EPS computations is as follows:
| For the year ended December 31, | |||||||||
| 2009 | 2008 | 2007 | |||||||
| Basic: |
|||||||||
| Net (loss)/income to common shareholders |
$ | (104,567,000) | $ | (59,809,000) | $ | 12,361,000 | |||
| Weighted average shares outstanding |
11,416,977 | 11,407,616 | 11,321,908 | ||||||
| Net (loss)/income per share, basic |
$ | (9.16) | $ | (5.24) | $ | 1.09 | |||
| Diluted: |
|||||||||
| Net (loss)/income to common shareholders |
$ | (104,567,000) | $ | (59,809,000) | $ | 12,361,000 | |||
| Weighted average shares outstanding |
11,416,977 | 11,407,616 | 11,321,908 | ||||||
| Effect of dilutive equity-based awards |
- | - | 14,412 | ||||||
| Weighted average shares outstanding and dilutive potential shares outstanding |
11,416,977 | 11,407,616 | 11,336,320 | ||||||
| Net (loss)/income per share, diluted |
$ | (9.16) | $ | (5.24) | $ | 1.09 | |||
For the years 2009, 2008 and 2007, there were 2,554,639, 672,554 and 444,449 shares, respectively, related to stock options, stock warrants related to CPP and restricted stock that were antidilutive since the exercise price exceeded the average market price, and for 2008 and 2009 also due to the net loss. These common stock equivalents were omitted from the calculations of diluted EPS for their respective years. For 2009 and 2008, all common stock equivalents were antidilutive due to loss.
Stock based compensation
For the years ended December 31, 2009, 2008 and 2007, the Company had five share-based compensation plans in effect. The compensation expense charged against income for those plans was $404,724, $726,845 and $808,000 respectively, and the related income tax benefit was $85,436, $139,720 and $150,000, respectively.
The Company adopted stock compensation plans in 1993 and 2003 that allow for the granting of incentive and nonqualified stock options to key employees and directors. The 2003 stock compensation plan also allows for the granting of restricted stock. Under terms of both the 1993 and 2003 plans, options are granted at prices equal to the fair market value of the common stock on the date of grant. Options become exercisable after one year in equal, cumulative installments over a five-year period. No option shall expire later than ten years from the date of grant. No further grants can be made under the 1993 stock compensation plan after March 10, 2003. Based on the stock options outstanding at December 31, 2009, a maximum of 237,505 shares of common stock has been reserved for issuance under the 1993 stock compensation plan. A maximum of 1,098,534 shares of common stock has been reserved for issuance under the 2003 stock compensation plan. At December 31 2009, there were 839,534 shares available under the 2003 plan for the granting of additional options or stock awards.
The Company assumed three stock compensation plans in its merger acquisition of Integrity Financial Corporation on April 28, 2006. Qualified and nonqualified stock options are outstanding under these plans for grants issued from 1997 to 2004 to key employees and directors at a price equal to fair market value on the date of grant. No additional grants will be made under these plans. Based on the stock options outstanding at December 31, 2009, a maximum of 38,727 shares of common stock has been reserved for issuance under these stock compensation plans.
85
Table of Contents
The fair market value of each option award is estimated on the date of grant using the Black-Scholes option pricing model. The risk-free interest rate is based on a U.S. Treasury instrument with a life that is similar to the expected life of the option grant. Expected volatility is based on the historical volatility of the Company’s common stock over approximately the previous 6 years. The expected life of the options has historically been considered to be approximately 6 years. The expected dividend yield is based upon the current yield in effect at the date of grant. Forfeitures are estimated at a 3.00% rate, adjusted to 1.75% for 5-year vesting.
The weighted-average fair value per share of options granted in 2009, 2008 and 2007 amounted to $0.00 (since there were no grants issued), $1.48, and $3.39, respectively. Fair values were estimated on the date of grant using the Black-Scholes option-pricing model with the following weighted-average assumptions:
| 2009 | 2008 | 2007 | |||||||
| Risk-free interest rate |
- | % | 3.47 | % | 4.58 | % | |||
| Dividend yield |
- | 4.16 | 3.60 | ||||||
| Volatility |
- | 24.00 | 26.00 | ||||||
| Expected life |
- | 6 years | 6 years |
The following is a summary of stock option activity:
| For the year ended December 31, | |||||||||||||||
| 2009 | 2008 | 2007 | |||||||||||||
| Shares | Weighted Average Exercise Price |
Shares | Weighted Average Exercise Price |
Shares | Weighted Average Exercise Price | ||||||||||
| Outstanding at beginning of year |
662,612 | $ | 16.65 | 698,848 | $ | 16.11 | 874,879 | $ | 15.59 | ||||||
| Granted |
- | - | 1,000 | 8.78 | 18,000 | 15.42 | |||||||||
| Exercised |
- | - | (150) | 11.75 | (135,581) | 9.61 | |||||||||
| Forfeited/expired |
(127,380) | 15.15 | (37,086) | 15.63 | (58,450) | 17.22 | |||||||||
| Outstanding at end of year |
535,232 | 17.01 | 662,612 | 16.65 | 698,848 | 16.61 | |||||||||
| Options exercisable at end of year |
525,432 | 17.05 | 615,703 | 16.56 | 579,902 | 16.11 | |||||||||
| Aggregate intrinsic value at end of year |
|||||||||||||||
| (in thousands): |
|||||||||||||||
| Options outstanding |
- | - | 161 | ||||||||||||
| Options exercisable |
- | - | 161 | ||||||||||||
At December 31, 2009, information concerning stock options outstanding and exercisable is as follows:
| Options Outstanding | Options Exercisable | |||||||||||
| Range of Exercise Prices |
Shares | Weighted Average Remaining Contractual Life (Years) |
Weighted Average Exercise Price |
Number Exercisable |
Weighted Average Exercise Price | |||||||
| $7.51-$10.00 | 11,542 | 1.77 | $ | 9.42 | 11,142 | $ | 9.48 | |||||
| $10.01-$15.00 | 154,420 | 1.74 | 12.19 | 152,520 | 12.19 | |||||||
| $15.01-$20.00 | 248,770 | 3.99 | 17.94 | 241,270 | 18.00 | |||||||
| $20.01-$25.00 | 119,500 | 3.96 | 21.95 | 119,500 | 21.95 | |||||||
| $25.01-$26.03 | 1,000 | 3.64 | 26.03 | 1,000 | 26.03 | |||||||
In 2009 and 2008 there was no intrinsic value of options exercised. In 2007, the intrinsic value of options exercised was $785,000. The 2009, 2008, and 2007 grant-date fair value of options vested was $170,566, $379,703 and $474,000, respectively. There were no options exercised in 2009.
86
Table of Contents
The following is a summary of non-vested restricted stock activity:
| For the year ended December 31, | ||||||||||
| 2009 | 2008 | |||||||||
| Shares | Weighted Average |
Shares | Weighted Average Grant Date Fair Value | |||||||
| Non-vested at beginning of year |
30,223 | $ | 16.60 | 40,216 | $ | 18.16 | ||||
| Granted |
1,200 | 2.60 | 6,000 | 10.68 | ||||||
| Vested |
(21,223) | 18.29 | (12,994) | 18.30 | ||||||
| Forfeited/Expired |
- | 0.00 | (2,999) | 18.26 | ||||||
| Non-vested at end of year |
10,200 | $ | 11.44 | 30,223 | $ | 16.60 | ||||
The fair value of restricted stock vested in 2009, 2008 and 2007 were $388,000, $238,000 and $226,000, respectively.
As of December 31, 2009, there was $75,954 of total unrecognized compensation cost related to non-vested share-based compensation arrangements granted under all of the Company’s stock benefit plans. That cost is expected to be recognized over a weighted-average period of 1.6 years.
The Company funds the option shares and restricted stock from authorized but unissued shares. The Company does not typically purchase shares to fulfill the obligations of the stock benefit plans. Company policy does allow option holders under certain plans to exercise options with seasoned shares.
Note 15 – Off-Balance Sheet Arrangements
In the normal course of business, various commitments are outstanding that are not reflected in the consolidated financial statements. Significant commitments at December 31, 2009 are discussed below.
Commitments by the Bank to extend credit and undisbursed advances on customer lines of credit are agreements to lend to a customer as long as there is no violation of any condition established in the contract. At December 31, 2009, total commitments to extend credit and undisbursed advances on customer lines of credit amounted to $301.2 million. Commitments generally have fixed expiration dates or other termination clauses and may require payment of a fee. Since many commitments expire without being fully drawn, the total commitment amounts do not necessarily represent future cash requirements. The Company evaluates each customer’s creditworthiness on a case-by-case basis. The amount of collateral obtained, if deemed necessary, upon extension of credit is based on the credit evaluation of the borrower.
The Bank issues standby letters of credit whereby it guarantees the performance of a customer to a third party if a specified triggering event or condition occurs. The guarantees generally expire within one year and may be automatically renewed depending on the terms of the guarantee. All standby letters of credit provide for recourse against the customer on whose behalf the letter of credit was issued, and this recourse may be further secured by a pledge of assets. The maximum potential amount of undiscounted future payments related to standby letters of credit was $14.9 million at December 31, 2009 and $16.1 million at December 31, 2008.
Dover originates certain residential mortgage loans with the intention of selling these loans. Between the time that Dover enters into an interest rate lock or a commitment to originate a residential mortgage loan with a potential borrower and the time the closed loan is sold, the Company is subject to variability in market prices related to these commitments. The Company believes that it is prudent to limit the variability of expected proceeds from the future sales of these loans by entering into forward sales commitments and commitments to deliver loans into a mortgage-backed security. The commitments to originate residential mortgage loans and the forward sales commitments are freestanding derivative instruments. They do not qualify for hedge accounting treatment so their fair value adjustments are recorded through the income statement in income from mortgage loan sales. The commitments to originate residential mortgage loans totaled $72.1 million at December 31, 2009, and the related forward sales commitments totaled $53.7 million with fair values of $86.5 million and $54.9 million, respectively. Loans held for sale by Dover totaled $54.1 million at December 31, 2009 of which $28.0 million was valued at lower of cost or
87
Table of Contents
market and $26.1 million valued at fair market. The related forward sales commitments totaled $54.1 million with a fair value of $54.3 million.
The Bank had loans held for sale of $4.6 million at December 31, 2009. Binding commitments of the Bank for the origination of mortgage loans intended to be held for sale at December 31, 2009 totaled $7.0 million, and the related forward sales commitments also totaled $4.6 million. At December 31, 2008, the Bank had loans held for sale of $5.7 million and binding commitments for the origination of mortgage loans intended to be held for sale of $40.5 million with related forward sales commitments also totaling $40.5 million.
The Bank’s exposure to credit loss in the event of nonperformance by the other party to the financial instrument for commitments to extend is represented by the contractual notional amount of those instruments. The Bank uses the same credit policies in making commitments and conditional obligations as it does for on-balance-sheet instruments. The fair value of these commitments was not considered material.
The Company does not have any special purpose entities or other similar forms of off-balance sheet financing.
Note 16 – Derivatives and Financial Instruments
A derivative is a financial instrument that derives its cash flows, and therefore its value, by reference to an underlying instrument, index or referenced interest rate. These instruments include interest rate swaps, caps, floors, collars, options or other financial instruments designed to hedge exposures to interest rate risk or for speculative purposes.
Accounting guidance requires an entity to recognize all derivatives as either assets or liabilities in the balance sheet, and measure those instruments at fair value. Changes in the fair value of those derivatives are reported in current earnings or other comprehensive income depending on the purpose for which the derivative is held and whether the derivative qualifies for hedge accounting.
In 2009, the Bank entered into three interest rate swaps totaling $35.0 million, using a receive-fixed swap to mitigate the exposure to changes in the fair value attributable to the benchmark interest rate (3-month LIBOR) of the hedged items (FHLB advances) from the effective date to the maturity date of the hedged instruments. As structured, the pay-variable, receive-fixed swaps are evaluated as fair value hedges and are considered highly effective. As highly effective hedges, all fair value designated hedges and the underlying hedged instrument are recorded on the balance sheet at fair value with the periodic changes of the fair value reported in the income statement.
For the twelve months ended December 31, 2009, the interest rate swaps resulted in decreased interest expense of $138,090 on FHLB advances than would otherwise have been reported for the liability. The fair value of the swaps at December 31, 2009 was recorded on the consolidated balance sheet as a liability in the amount of $(213,953).
On March 14, 2008, FNB United entered into an interest rate swap to convert the floating rate cash flows on a $20 million trust preferred security to a fixed rate cash flow. As structured, the pay-fixed, receive-floating swap is evaluated, using the long-haul method, as being a cash flow hedge in which the ineffectiveness would be determined by any difference in valuation of the fair value of the derivative and the underlying hedged item. Consequently, the difference in cash flows in each period between the fixed rate interest payments that the Company makes and the variable interest payments received is currently reported in earnings while gains and losses on the value of the swap instrument are recorded in shareholders’ equity.
For the twelve months ended December 31, 2008, the interest rate swap resulted in a net decrease of $18,292 in the interest expense that would otherwise have been reported. The fair value of the swap at December 31, 2008 was recorded on the consolidated balance sheet as a liability in the amount of $455,414 offset by other comprehensive loss of $300,573, net of $154,841 deferred taxes. Changes in fair value will remain in other comprehensive income until the swap maturity date of December 15, 2010, which corresponds to the initial call date of the related trust preferred security.
For the twelve months ended December 31, 2009, the interest rate swap resulted in a net increase of $335,884 in the interest expense on FNB United Statutory Trust I than would otherwise have been reported. The fair value of the swap at December 31, 2009 was recorded on the consolidated balance sheet as a liability in the amount of $383,075 offset by other comprehensive loss of $248,999, net of $134,076 deferred taxes. Changes in fair value will remain
88
Table of Contents
in other comprehensive income, net of any ineffectiveness, until the swap maturity date of December 15, 2010, which corresponds to the initial call date of the related trust preferred security.
The Company has also identified the following derivative instruments that were recorded on the consolidated balance sheet at December 31, 2009: commitments to originate residential mortgage loans and forward sales commitments.
Mortgage banking derivatives used in the ordinary course of business consist of mandatory forward sales contracts (“forward contracts”) and rate lock loan commitments. The fair value of the Company’s derivative instruments is primarily measured by obtaining pricing from broker-dealers recognized to be market participants.
The table below provides data about the carrying values of derivative instruments:
| As of December 31, 2009 | As of December 31, 2008 | |||||||||||||||||
| Assets | (Liabilities) | Assets | (Liabilities) | |||||||||||||||
| (dollars in thousands) | Carrying Value |
Carrying Value |
Derivative Net Carrying Value |
Carrying Value |
Carrying Value |
Derivative Net Carrying Value | ||||||||||||
| Derivatives designated as hedging instruments: |
||||||||||||||||||
| Interest rate swap contracts - trust preferred (1) |
$ | - | $ | (383) | $ | (383) | $ | - | $ | (457) | $ | (457) | ||||||
| Interest rate swap contracts - FHLB advances (2) |
280 | - | 280 | - | - | - | ||||||||||||
| Derivatives not designated as hedging instruments: |
||||||||||||||||||
| Mortgage loan rate lock commitments (1) |
$ | - | $ | (83) | $ | (83) | $ | - | $ | - | $ | - | ||||||
| Mortgage loan forward sales and MBS (3) |
251 | - | 251 | - | - | - | ||||||||||||
(1) Included in “Other liabilities” on the Company’s consolidated balance sheets.
(2) Included in “Federal Home Loan Bank advances” on the Company’s consolidated balance sheets.
(3) Included in “Other assets” on the Company’s consolidated balance sheets.
The table below provides data about the amount of gains and losses related to derivative instruments designated as hedges included in the “Accumulated other comprehensive income (loss)” section of “Shareholders’ Equity” on the Company’s Consolidated Balance Sheets, and in “Other income” in the Company’s Consolidated Statements of Income:
| (dollars in thousands) | Gain or (Loss), Net of
Tax Recognized in Accumulated Other Comprehensive Loss (Effective Portion) | |||||
| As
of December 31, 2009 |
As of December 31, 2008 | |||||
| Derivatives designated as hedging instruments: |
||||||
| Interest rate swap contracts |
$ | (249) | $ | (301) | ||
| (dollars in thousands) | Gain or (Loss), Net of Tax Recognized in Income | |||||
| As
of December 31, 2009 |
As
of December 31, 2008 | |||||
| Derivatives designated as hedging instruments: |
||||||
| Interest rate swap contracts/FHLB advances |
$ | 40 | $ | - | ||
On April 7, 2009, Dover irrevocably opted to elect fair value for the initial and subsequent measurement for certain financial assets and liabilities on a contract-by-contract basis. This election allowed Dover to enter into a hedging arrangement for the purpose of limiting risk inherent in the closed but unlocked mortgage loan pipeline and loans held for sale portfolio. These loans have interest rate locks but have not yet settled.
89
Table of Contents
The table below provides data about the amount of gains and losses recognized in income on derivative instruments not designated as hedging instruments:
| (dollars in thousands) | Gain or (Loss) During Twelve Months Ended | |||||
| December 31, 2009 | December 31, 2008 | |||||
| Derivatives not designated as hedging instruments: |
||||||
| Mortgage loan rate lock commitments (1) |
$ | (83) | $ | - | ||
| Mortgage loan forward sales and MBS (2) |
251 | - | ||||
| Total |
$ | 167 | $ | - | ||
(1) Recognized in “Other expense” in the Company’s consolidated statements of income.
(2) Recognized in “Mortgage loan sales” in the Company’s consolidated statements of income.
Dover originates certain residential mortgage loans with the intention of selling these loans. Between the time that Dover enters into an interest rate lock or a commitment to originate a residential mortgage loan with a potential borrower and the time the closed loan is sold, the Company is subject to variability in market prices related to these commitments. The Company believes that it is prudent to limit the variability of expected proceeds from the future sales of these loans by entering into forward sales commitments and commitments to deliver loans into a mortgage-backed security. The commitments to originate residential mortgage loans and the forward sales commitments are freestanding derivative instruments. They do not qualify for hedge accounting treatment so their fair value adjustments are recorded through the income statement in income from mortgage loan sales.
Note 17 – Fair Value of Assets and Liabilities
The Company utilizes fair value measurements to record fair value adjustments to certain assets and liabilities and to determine fair value disclosures. Securities available-for-sale, certain loans held for sale at Dover, derivatives and mortgage servicing rights are recorded at fair value on a recurring basis. Additionally, from time-to-time, the Company may be required to record at fair value other assets and liabilities on a non-recurring basis, such as loans held for sale, loans held for investment and certain other assets and liabilities. These non-recurring fair value adjustments typically involve application of lower or cost or market accounting or write-downs of individuals’ assets or liabilities.
Fair Value Hierarchy
The Company groups assets and liabilities at fair value in three levels, based on the markets in which the assets and liabilities are traded and the reliability of the assumptions used to determine fair value. These levels are:
Level 1: Valuation is based upon quoted prices for identical instruments traded in active markets.
Level 2: Valuation is based upon quoted prices for similar instruments in active markets, quoted prices for identical or similar instruments in markets that are not active, and model-based valuation techniques for which all significant assumptions are observable in the market.
Level 3: Valuation is generated from model-based techniques that use at least one significant assumption not observable in the market. These unobservable assumptions reflect estimates of assumptions that market participants would use in pricing the asset or liability. Valuation techniques include use of option pricing models, discounted cash flow models and similar techniques.
Following is a description of valuation methodologies used for assets and liabilities recorded at fair value.
Investments Securities Available-for-Sale
Investment securities available-for-sale are recorded at fair value on a recurring basis. Fair value measurement is based upon quoted prices, if available. If quoted prices are not available, fair values are measured using independent pricing models or other model-based valuation techniques such as the present value of future cash flows, adjusted for the security’s credit rating, prepayment assumptions and other factors such as credit loss assumptions. Level 1 securities include those traded on an active exchange, such as the New York Stock Exchange, U.S. Treasury securities that are traded by dealers or brokers in active over-the-counter markets and money market funds. Level 2 securities include mortgage-backed securities issued by government sponsored entities, municipal bonds and corporate debt securities. Securities classified as Level 3 may include asset-backed securities in less liquid markets.
90
Table of Contents
Loans Held for Sale
The Company originates loans under various loan programs and other secondary market conventional products which are sold in the secondary market. Additionally, the Company has residential mortgage loans held for sale which were originated through the retail and wholesale mortgage segment. The majority of loans held for sale are carried at the lower of cost or market. The remaining portion is hedged to protect the Company from changes in interest rates during the period of time a loan is held. The loans that are hedged are recorded at market value in accordance with current guidance. The sold loans are beyond the reach of the Bank in all respects and the purchasing investor has all rights of ownership, including the ability to pledge or exchange the loans. Most of loans sold are without recourse. Gains or losses on loan sales are recognized at the time of sale, are determined by the difference between net sales proceeds and the carrying value of the loan sold, and are included in mortgage loan income. The Company only retains rights and obligations to service the loans sold to Fannie Mae.
Since loans held for sale are carried at the lower of cost or market value, the market value of loans held for sale is based on what secondary markets are currently offering for portfolios with similar characteristics. As such, the Company classifies loans subjected to nonrecurring fair value adjustments as Level 2.
Loans
The Company does not record loans at fair value on a recurring basis. However, from time to time, a loan is considered impaired and the related impairment is charged against the allowance or a specific allowance is established. Loans for which it is probable that payment of interest and principal will not be made in accordance with the contractual terms of the loan agreement are considered impaired. Once a loan is identified as individually impaired, management measures impairment. The fair value of impaired loans is estimated using one of several methods, including collateral net liquidation value, market value of similar debt, enterprise value, and discounted cash flows. Those impaired loans not requiring a specific allowance represent loans for which the fair value of the expected repayments or collateral meet or exceed the recorded investments in such loans. At December 31, 2009 and December 31, 2008, substantially all of the total impaired loans were evaluated based on the fair value of the collateral. Impaired loans where an allowance is established based on the fair value of collateral require classification in the fair value hierarchy. When the fair value of the collateral is based on an observable market price or a current appraised value, the Company records the impaired loan as nonrecurring Level 2. When an appraised value is not available or management determines the fair value of the collateral is further impaired below the appraised value and there is no observable market price, the Company records the impaired loans as nonrecurring Level 3.
Other Real Estate Owned
Other real estate owned (“OREO”) is adjusted to fair value upon transfer of the loans to OREO. Subsequently, OREO is carried at the lower of carrying value or fair value. Fair value is based upon independent market prices, appraised values of the collateral or management’s estimation of the value of the collateral. When the fair value of the collateral is based on an observable market price or a current appraised value, the Company records the foreclosed asset as nonrecurring Level 2. When an appraised value is not available or management determines the fair value of the collateral is further impaired below the appraised value and there is no observable market price, the Company records the OREO as nonrecurring Level 3.
Derivative Assets and Liabilities
Substantially all derivative instruments held or issued by the Company for risk management or customer-initiated activities are traded in over-the-counter markets where quoted market prices are not readily available. For those derivatives, the Company measures fair value using models that use primarily market observable inputs, such as yield curves and option volatilities, and include the value associated with counterparty credit risk. The Company classifies derivatives instruments held or issued for risk management or customer-initiated activities as Level 2.
Mortgage Servicing Rights
Mortgage servicing rights are recorded at fair value on a recurring basis, with changes in fair value recorded as a component of mortgage loan sales. A valuation model, which utilizes a discounted cash flow analysis using interest rates and prepayment speed assumptions currently quoted for comparable instruments and a discount rate, is used to
91
Table of Contents
determine fair value. Loan servicing rights are adjusted to fair value through a valuation allowance as determined by the model. As such, the Company classifies mortgage servicing rights as Level 3.
Assets and Liabilities Recorded at Fair Value on a Recurring Basis
The following tables present the recorded amount of assets and liabilities measured at fair value on a recurring basis:
December 31, 2009
| (dollars in thousands)
|
Total | Level 1 | Level 2 | Level 3 | ||||||||
| Investment securities available-for-sale |
$ | 237,630 | $ | 2,168 | $ | 235,462 | $ | - | ||||
| Derivative assets - Bank |
280 | - | 280 | - | ||||||||
| Derivative assets - Dover |
251 | - | 251 | - | ||||||||
| Loans held for sale |
26,135 | - | 26,135 | - | ||||||||
| Mortgage servicing rights |
4,857 | - | - | 4,857 | ||||||||
| Total assets at fair value |
$ | 269,153 | $ | 2,168 | $ | 262,128 | $ | 4,857 | ||||
| Derivative liabilities - Bank |
$ | (383) | $ | - | $ | (383) | $ | - | ||||
| Total liabilities at fair value |
$ | (383) | $ | - | $ | (383) | $ | - | ||||
|
December 31, 2008
|
||||||||||||
| (dollars in thousands)
|
Total | Level 1 | Level 2 | Level 3 | ||||||||
| Investment securities available-for-sale |
$ | 205,426 | $ | 1,829 | $ | 203,597 | $ | - | ||||
| Mortgage servicing rights |
4,043 | - | - | 4,043 | ||||||||
| Total assets at fair value |
$ | 209,469 | $ | 1,829 | $ | 203,597 | $ | 4,043 | ||||
| Derivative liabilities |
$ | (457) | $ | - | $ | (457) | $ | - | ||||
| Total liabilities at fair value |
$ | (457) | $ | - | $ | (457) | $ | - | ||||
The following are reconciliations of the beginning and ending balances for assets and liabilities measured at fair value on a recurring basis using significant unobservable inputs (Level 3):
| December 31, 2009 | Fair Value Measurements Using Significant Unobservable Inputs (Level 3) |
| (dollars in thousands) | Mortgage Servicing Rights |
||||
| Beginning balance at January 1, 2009 |
$ | 4,043 | |||
| Total gains or losses (realized/unrealized): |
|||||
| Included in earnings |
(828) | ||||
| Purchases, issuances and settlements |
1,642 | ||||
| Ending balance at December 31, 2009 |
$ | 4,857 | |||
92
Table of Contents
| December 31, 2008 | Fair Value Measurements Using Significant Unobservable Inputs (Level 3) |
| (dollars in thousands) | Mortgage Servicing Rights |
||||
| Beginning balance at January 1, 2008 |
$ | 2,900 | |||
| Total gains or losses (realized/unrealized): |
|||||
| Included in earnings |
(39) | ||||
| Purchases, issuances and settlements |
1,182 | ||||
| Ending balance at December 31, 2008 |
$ | 4,043 | |||
Assets and Liabilities Recorded at Fair Value on a Nonrecurring Basis
The Company may be required, from time to time, to measure certain assets at fair value on a nonrecurring basis in accordance with U.S. generally accepted accounting principles. These include assets that are measured at the lower of cost or market that were recognized at fair value below cost at the end of the period. Assets measured at fair value on a nonrecurring basis are included in the following tables.
December 31, 2009
| (dollars in thousands) | Total | Level 1 | Level 2 | Level 3 | ||||||||
| Impaired loans |
$ | 69,142 | $ | - | $ | - | $ | 69,142 | ||||
| Other real estate owned |
2,836 | - | - | 2,836 | ||||||||
| Total assets at fair value |
$ | 71,978 | $ | - | $ | - | $ | 71,978 | ||||
|
December 31, 2008
|
||||||||||||
| (dollars in thousands) | Total | Level 1 | Level 2 | Level 3 | ||||||||
| Impaired loans |
$ | 18,230 | $ | - | $ | - | $ | 18,230 | ||||
| Total assets at fair value |
$ | 18,230 | $ | - | $ | - | $ | 18,230 | ||||
Fair Value of Financial Instruments
The following methods and assumptions were used to estimate the fair value for each class of the Company’s financial instruments.
Cash and cash equivalents. The carrying amounts for cash and due from banks approximate fair value because of the short maturities of those instruments.
Investment securities. The fair value of investment securities is based on quoted market prices, if available. If a quoted market price is not available, fair value is estimated using quoted market prices for similar securities. The fair value of equity investments in the restricted stock of the Federal Reserve Bank and Federal Home Loan Bank equals the carrying value.
Loans. The fair value of fixed rate loans is estimated by discounting the future cash flows using the current rates at which similar loans would be made to borrowers with similar credit ratings and for the same remaining maturities. Substantially all residential mortgage loans held for sale are pre-sold and their carrying value approximates fair value. The fair value of variable rate loans with frequent repricing and negligible credit risk approximates book value.
Investment in bank-owned life insurance. The carrying value of bank-owned life insurance approximates fair value because this investment is carried at cash surrender value, as determined by the insurer.
Deposits. The fair value of noninterest-bearing demand deposits and NOW, savings, and money market deposits are the amounts payable on demand at the reporting date. The fair value of time deposits is estimated using the rates currently offered for deposits of similar remaining maturities.
93
Table of Contents
Borrowed funds. The carrying value of retail repurchase agreements and federal funds purchased is considered to be a reasonable estimate of fair value. The fair value of Federal Home Loan Bank advances and other borrowed funds is estimated using the rates currently offered for advances of similar remaining maturities.
Accrued interest. The carrying amounts of accrued interest approximate fair value.
Financial instruments with off-balance sheet risk. The fair value of financial instruments with off-balance sheet risk is considered to approximate carrying value, since the large majority of these future financing commitments would result in loans that have variable rates and/or relatively short terms to maturity. For other commitments, generally of a short-term nature, the carrying value is considered to be a reasonable estimate of fair value. The various financial instruments were disclosed in Note 15.
The estimated fair values of financial instruments at December 31 are as follows:
| 2009 | 2008 | |||||||||||
| (dollars in thousands) | Carrying Value |
Estimated Fair Value |
Carrying Value |
Estimated Fair Value | ||||||||
| Financial Assets |
||||||||||||
| Cash and cash equivalents |
$ | 27,698 | $ | 27,698 | $ | 29,353 | $ | 29,353 | ||||
| Investment securities: |
||||||||||||
| Available-for-sale |
237,630 | 237,630 | 205,426 | 205,426 | ||||||||
| Held-to-maturity |
88,559 | 91,521 | 27,794 | 27,580 | ||||||||
| Loans held for sale |
58,219 | 58,219 | 36,138 | 36,138 | ||||||||
| Net loans |
1,513,560 | 1,442,115 | 1,550,475 | 1,480,270 | ||||||||
| Accrued interest receivable |
8,071 | 8,071 | 7,196 | 7,196 | ||||||||
| Bank-owned life insurance |
30,883 | 30,883 | 29,901 | 29,901 | ||||||||
| Other earning assets |
18,332 | 18,332 | 19,825 | 19,825 | ||||||||
| Financial Liabilities |
||||||||||||
| Deposits |
$ | 1,722,128 | $ | 1,687,945 | $ | 1,514,747 | $ | 1,526,719 | ||||
| Retail repurchase agreements |
13,592 | 13,592 | 18,145 | 18,145 | ||||||||
| Federal Home Loan Bank advances |
166,165 | 171,529 | 238,910 | 248,283 | ||||||||
| Federal funds purchased |
10,000 | 10,000 | 37,000 | 37,000 | ||||||||
| Subordinated debt |
15,000 | 15,000 | 15,000 | 14,173 | ||||||||
| Junior subordinated debentures |
56,702 | 43,257 | 56,702 | 35,603 | ||||||||
| Accrued interest payable |
2,581 | 2,581 | 4,078 | 4,078 | ||||||||
The fair value estimates are made at a specific point in time based on relevant market and other information about the financial instruments. Because no market exists for a significant portion of the Company’s financial instruments, fair value estimates are based on current economic conditions, risk characteristics of various financial instruments, and such other factors. These estimates are subjective in nature and involve uncertainties and matters of significant judgment and therefore cannot be determined with precision. Changes in assumptions could significantly affect the estimates. In addition, the tax ramifications related to the realization of the unrealized gains and losses can have a significant effect on fair value estimates and have not been considered in the estimates.
Note 18 – FDIC Insurance Assessment
On November 12, 2009, the FDIC adopted a final rule imposing a 13-quarter prepayment of FDIC premiums to replenish the depleted insurance fund. This regulation required insured depository institutions to prepay their estimated quarterly regular risk-based assessments for the fourth quarter of 2009, through the fourth quarter of 2012 on December 30, 2009, at the same time that institutions pay their regular quarterly deposit insurance assessments for the third quarter of 2009. The estimated prepayment amount will be used to offset future FDIC premiums beginning on March 30, 2010, which represents payment of the regular insurance assessment for the 2009 fourth quarter. As part of the prepayment assessment, approximately $0.7 million was expensed in 2009. The Bank’s remaining prepaid assessment equated to approximately $9.6 million and will be expensed over the remaining three-year period for which premiums were prepaid, resulting in quarterly FDIC insurance expense of approximately $0.8 million.
94
Table of Contents
Note 19 – Subsequent Events
In connection with its asset/liability management objectives, the Bank entered into an interest rate swap agreement during January 2010 to manage interest rate risk. The swap is designated as a fair value hedge of $10.0 million of Federal Home Loan Bank (“FHLB”) advances and converts the fixed rate cash flow exposure on the FHLB advance to a variable rate cash flow. As structured, the pay-variable, receive-fixed swap is evaluated, using the long-haul method, as being a fair value hedge in which the ineffectiveness would be determined by any differences in the change in fair value of the swap relative to the change in fair value of the advance. No ineffectiveness is assumed at the inception of the hedge. The change in fair value of both the swap and the advance will be recorded in earnings.
The following table describes the details and terms of the swap:
(dollars in thousands)
| Notional Amount |
Settlement Date |
Maturity Date |
Fixed Rate |
Floating Rate |
Rate Reset | ||||||
| $ | 10,000 | 01/07/10 | 01/07/13 | 3.9000% | 3 month LIBOR + 2.035% | quarterly | |||||
The company evaluated subsequent events and determined there were no additional subsequent events that required recognition or disclosure in the financial statements.
The Office of the Comptroller of the Currency completed the fieldwork for a regularly scheduled examination of the Bank during the fourth quarter. The reported results of the Company reflect discussions with regulators on the level of nonperforming assets and loan charge-offs, among other matters. The Company has been advised orally that a formal agreement with the OCC will be required because of the impact of the high level of nonperforming assets on the financial performance of the Bank. Though the particular terms of such agreement are not known at this time, the Company expects that it will require corrective action for improvement in Bank earnings, lower nonperforming loan levels, increased minimum capital ratios necessary to be deemed well capitalized and revisions to various policies. The Company has already been taking aggressive steps consistent with meeting these expected requirements. The Company does not expect its trust operations to be subject to enhanced regulatory requirements.
The Bank’s mortgage subsidiary, Dover, plans to discontinue operations in three states beginning in April 2010. Dover originates, underwrites and closes mortgage loans for sale into the secondary market. Dover plans to remain in Maine, New Hampshire, North Carolina, South Carolina and Tennessee with plans to discontinue operations in Georgia, Maryland and Virginia.
Note 20 – Management’s Plans and Intentions
In response to the challenging economic environment and increased regulatory supervision and requirements, the Company plans to take a number of actions aimed at preserving existing capital, reducing its lending exposures and associated capital requirements, and increasing liquidity. The actions include, without limitation, the following: slowing loan originations, growing retail non-maturity deposits, reducing the already low level of brokered deposits, seeking resolution of nonperforming loans through either commercial note sales arrangements with other lenders or private equity sources or completing foreclosure sales, selling investment securities where appropriate, and reducing operating costs. The goal is to achieve profitability by controlling growth, stabilizing losses, managing problem assets and reducing overall expenses. Management is pursuing these four primary objectives as a basis for the long-term success of the Company and, in so doing, is focusing on the following:
Liquidity
The Company has a 45-office system of community offices, commonly referred to as branches, that has provided a significant and stable source of local funding. In addition, the Company has approved a contingency funding plan pursuant to which FNB United and the Bank will review each quarter liquidity needs based on a number of potential stress conditions. These conditions include, but are not limited to, deposit outflow and reductions in wholesale borrowing lines, including brokered deposits. Liquidity sources are stressed to determine if sufficient liquidity is available to meet potential funding needs. In all scenarios determined plausible by management, the Bank is able to meet liquidity needs through remaining borrowing lines, reducing loan originations, sales of assets, and scheduled cash flow that is not redeployed. The Bank is active in maximizing borrowing lines that can be drawn against under all financial conditions, as well as managing asset and liability cash flows to maintain adequate liquidity levels.
95
Table of Contents
Both FNB United and the Bank actively manage liquidity. The Company does not have any debt maturing during 2010 or 2011. FNB United suspended its dividend to shareholders until such time as the Bank returns to profitability and either receives or is not required to receive regulatory approval for the payment of dividends. At December 31, 2009, FNB United had approximately $4.1 million of cash held in deposits with the Bank. Based on current and expected liquidity needs and sources, management expects the Bank to be able to meet its obligations at least through December 31, 2010, and FNB United, with its ability to defer payments on preferred stock and trust preferred securities for extended periods of time, is expected to be able to meet its obligations at least through December 31, 2010. The Company is currently evaluating the possibility of deferring payments on preferred stock and trust preferred securities in order to preserve liquidity.
Cash and cash equivalents at the Bank at December 31, 2009 were approximately $27.7 million. Liquidity at the Bank is dependent upon deposits, which fund 82% of the Company’s assets. Despite reported negative earnings performance during 2009, the Bank’s deposits increased from December 31, 2008 to December 31, 2009 by $209 million. The Company is reducing its assets to improve capital ratios and has also been working to reduce collateralized funding as assets decline. The Bank’s loan portfolio does not have features that could rapidly draw additional funds, which would cause an elevated need for additional liquidity at the Bank.
Other contingency funding sources for the Bank include brokered deposits. The Bank’s internal polices allow for brokered deposits to increase to a maximum of 15% of total deposits. Access to brokered deposits may be eliminated or restricted, however, if the Bank were deemed not well-capitalized. At December 31, 2009, the Bank had sufficient collateral pledged to the Federal Reserve discount window and the Federal Home Loan Bank to allow it to borrow up to $98.5 million and $174.7 million, respectively, on an overnight basis. These amounts are subject to increase with the pledging of additional, available collateral.
As a result of its efforts to control the level of assets, management expects reductions in deposits through the end of 2010 as part of a planned deleveraging of the balance sheet. The reductions in deposits will also be caused in part by anticipated restrictions on interest rates paid on deposits imposed by the expected formal agreement identified above. Stress testing of potential severe deposit outflow demonstrates that the Bank is well positioned to respond to withdrawals without having to utilize significant credit lines available from the Federal Reserve discount window or the Federal Home Loan Bank. Additional sales and maturities of investment securities could provide further liquidity if needed. The Bank is currently considering the reclassification of the entire held-to-maturity investment securities portfolio to available-for-sale investment securities to further enhance the Bank’s liquidity. The reclassification of these securities may be completed in the second or third quarter of 2010.
Capital
The Bank anticipates increased minimum capital requirements from the OCC to be part of the expected formal agreement identified in Note 19. The Company, in anticipation of increased requirements, has begun to take steps to increase capital. The Company plans to control asset growth, which should help reduce its risk profile and improve capital ratios through reductions in the amount of outstanding loans, particularly loans with higher risk weights, and a corresponding reduction of liabilities. Outstanding loans will be reduced by slowing loan originations and through normal principal amortization. The Company may also seek commercial note sales arrangements with other lenders or private equity sources. The Company is reviewing investment securities for potential tax planning strategies that could contribute to improved earnings in 2010. Based on its forecasts and projections, management expects the Bank to remain well capitalized, according to current regulatory guidelines, through December 31, 2010, with both leverage and total risk-based capital ratios improving as a result of improved retained earnings and the deleveraging strategies described above.
The Bank has developed a capital plan that incorporates the measures described above and is aimed at maintaining required levels of regulatory capital. In addition, the Company has worked with various advisors and consultants on planned capital raises, asset sales, and implementing other measures to increase capital. Specific options available to the Company include selling properties obtained through acquisitions that are no longer needed for banking activities, transfer of the warehouse line for subsidiary mortgage operations, potential sales of community offices or groups of offices, as well as public or private equity capital raises. FNB United’s shareholders are being asked to approve an increase in the number of authorized shares of FNB United common stock at the May 2010 annual shareholders’ meeting, and sufficient additional shares are being sought to facilitate when appropriate the redemption of the shares of preferred stock issued under the Capital Purchase Program. The ability to raise additional capital and the success of an offering will depend on conditions in the capital markets at the time of the
96
Table of Contents
proposed offering and on the Company’s financial performance. A capital raise would likely not commence prior to the third or fourth quarter of 2010 due to present conditions in the micro-cap equity markets. Issuance of a large number of additional shares of common stock could significantly dilute the voting power of FNB United’s existing common shareholders.
In anticipation of a formal agreement with the OCC, the Board of Directors of the Bank is forming a compliance committee of some of its members to oversee management’s response to all sections of the expected agreement. The committee will monitor compliance with the anticipated formal agreement, including adherence to deadlines for submission to the OCC of any information required under the agreement.
The Company has engaged legal and regulatory experts to assist it with compliance with the anticipated OCC formal agreement. They will also be advising the Company on additional action plans and strategies to reduce the level of nonperforming assets and improving capital. These experts will work directly with the Board of Directors and Bank management to assure that all opportunities for improvement are considered.
Credit Quality
The Company has taken proactive steps to resolve its nonperforming loans, including negotiating repayment restructuring plans, forbearances, loan modifications and loan extensions with borrowers when appropriate. The Bank also has a separate special assets department to monitor and attempt to reduce exposure to further deterioration in asset quality, to manage OREO properties, and to liquidate property in the most cost-effective manner. The Bank is applying more conservative underwriting practices to new loans, including, among other things, increasing the amount of required collateral or equity requirements, reducing loan-to-value ratios, and increasing interest rates.
To improve its results of operations, the Company’s primary focus is to reduce significantly the amount of its nonperforming assets. Nonperforming assets decrease profitability because they reduce the balance of earning assets, may require additional loan loss provisions or write-downs, and require significant devotion of staff time and financial resources to resolve. The level of nonperforming assets (loans not accruing interest, restructured loans, loans past due 90 days or more and still accruing interest, and other real estate owned) had increased to $209.7 million as of December 31, 2009, as compared to $102.7 million as of December 31, 2008. The Company believes that the increase in the level of nonperforming assets has occurred largely as a result of the severe housing downturn and deterioration in the residential real estate market, as many of the Bank’s commercial loans are for residential real estate projects.
The Company has moved aggressively to address the credit quality issues by increasing its reserves for losses and directing the efforts of a team of experienced workout specialists solely to manage the resolution of nonperforming assets. This group allows the remainder of the Bank’s credit administration and banking personnel to focus on managing the performing loan portfolio, while enhancing objectivity in problem loan resolution by removing from that process the originating or managing lender.
With the assistance of a third-party loan review firm, the Bank conducted a thorough review of the loan portfolio during 2009, including both nonperforming loans and performing loans. The Company believes that the reserves recorded in its allowance for loan losses as of December 31, 2009 are adequate to cover losses inherent in the portfolio as of that date.
It is the Company’s goal to remove the majority of the nonperforming assets from its balance sheet while still obtaining reasonable value for these assets. Given the current conditions in the real estate market, accomplishing this goal is a tremendous undertaking, requiring both time and the considerable effort of staff. The Company is committed to continuing to devote significant resources to these efforts. Sales of real estate in the current market could result in losses.
Continued Expense Control
The Company has made it a priority to identify cost savings opportunities throughout all phases of operations. In 2008, the Bank engaged a third party to review and recommend a cost savings strategy for the Bank. The Bank continues to follow those recommendations and continues to see improvements in expense control. The Company is committed to maintaining these cost control measures and believes that this effort will play a major role in improving its performance. The Company also believes that its technology allows it to be efficient in its back-office operations. In addition, as the level of nonperforming assets is reduced, the operating costs associated with carrying those assets, such as maintenance, insurance and taxes, will decrease.
97
Table of Contents
The Company is focused on expanding its collection of core deposits. Core deposit balances, generated from customers throughout the Bank’s branch network, are generally a stable source of funds similar to long-term funding, but core deposits such as checking and savings accounts are typically much less costly than alternative fixed-rate funding. The Company believes that this cost advantage makes core deposits a superior funding source, in addition to providing cross-selling opportunities and fee income possibilities. The Bank works to increase its level of core deposits by actively cross-selling core deposits to local depositors and borrowers. As the Bank grows its core deposits, the cost of funds should decrease, thereby increasing the Bank’s net interest margin.
Conclusion
Earnings projections for 2010 and 2011 are greatly improved from results posted in preceding years. In the current interest rate environment, earnings will at most be only minimally affected by further declines in interest rates. Any increase in interest rates is expected to have a positive impact on the earnings of the Bank, with the extent of that impact dependent on the amount of increase. Management’s current projections and forecasts for 2010 include an insignificant increases in interest rates, notwithstanding increasing evidence of economic recovery and the heightened possibility of rate increases during the fourth quarter of 2010.
The Company is evaluating various strategic options, including capital raising alternatives and the sale of selective assets. While the Company plans to focus on the above actions and to pursue strategic alternatives, the Company can give no assurance that efforts to raise additional capital in the current economic environment will be successful and result in the Company’s desired capital position. The Bank’s ability to decrease its levels of nonperforming assets is also subject to market conditions as some of its borrowers rely on an active real estate market as a source of repayment, and the sale of loans in this market is difficult. If the real estate market does not improve, the Bank’s level of nonperforming assets may continue to increase.
While the Company believes that it is taking appropriate steps to respond to these economic risks and regulatory actions, continued deterioration in the Bank’s asset quality or anticipated regulatory actions could adversely affect the Company’s operations and the Company’s ability to continue as a going concern.
| Item 9. | CHANGES IN AND DISAGREEMENTS WITH ACCOUNTANTS ON ACCOUNTING AND FINANCIAL DISCLOSURE |
None.
| Item 9A. | CONTROLS AND PROCEDURES |
Evaluation of Disclosure Controls and Procedures
FNB United Corp.’s management, with the participation of its Chief Executive Officer and its Chief Financial Officer, has evaluated the effectiveness of the Company’s disclosure controls and procedures as of December 31, 2009. Based on that evaluation, the Company’s Chief Executive Officer and Chief Financial Officer concluded that the Company’s disclosure controls and procedures were effective as of December 31, 2009.
Management’s Report on Internal Control over Financial Reporting
Management of FNB United Corp. and Subsidiary (the “Corporation”) is responsible for preparing the Corporation’s annual consolidated financial statements and for establishing and maintaining adequate internal control over financial reporting for the Corporation. Management has evaluated the effectiveness of the Corporation’s internal control over financial reporting as of December 31, 2009 based on criteria established in Internal Control - Integrated Framework issued by the Committee of Sponsoring Organizations of the Treadway Commission (“COSO”). Based on this assessment, management believes that the Corporation maintained effective internal control over financial reporting as of December 31, 2009.
The Corporation’s registered public accounting firm that audited the Corporation’s consolidated financial statements included in this annual report has issued an attestation report on the effectiveness of the Corporation’s internal control over financial reporting.
98
Table of Contents
Remediation of Prior Year Material Weaknesses
As disclosed in Item 9A, Controls and Procedures of our Annual Report on Form 10-K for the year ended December 31, 2008, management identified material weaknesses (“material weaknesses”) in our internal control over financial reporting. Throughout 2009, the Company designed and implemented changes to remedy the deficiencies in the control environment. It took the following actions to remediate the material weaknesses:
| • | Adequate Staffing in the Accounting Department – The Company hired a Controller during the second quarter of 2009. The Company is also utilizing the services of third parties when necessary to provide needed expertise. |
| • | Segregation of Duties in the Accounting Department – The increase in staffing has allowed the Company to implement adequate segregation of duties. The Company has reviewed all job descriptions and duties in the Accounting Department and reassigned tasks and duties to address segregation of duty concerns. These changes were implemented during the first, second and third quarters of 2009. |
All of the steps identified above have been implemented as of December 31, 2009, and the Company has remediated the prior year material weaknesses in its internal control over financial reporting (as defined in Rule 13a-15(f) and 15d-15(f) of the Exchange Act).
Changes in Internal Control over Financial Reporting
The Company assesses the adequacy of its internal control over financial reporting quarterly and enhances its control in response to internal control assessments and internal and external audit and regulatory recommendations. No such control enhancements during the quarter ended December 31, 2009 have materially affected, or are reasonably likely to materially affect, the Company’s internal control over financial reporting.
| Item 9B. | OTHER INFORMATION |
None.
99
Table of Contents
PART III
| Item 10. | DIRECTORS, EXECUTIVE OFFICERS, AND CORPORATE GOVERNANCE |
The information set forth in FNB United’s proxy statement for the Annual Meeting of Shareholders to be held on May 25, 2010 (the “Proxy Statement”) under the headings “Election of Directors,” “Executive Officers,” “Report of the Audit Committee,” and “Section 16(a) Beneficial Ownership Reporting Compliance” is incorporated herein by reference.
| Item 11. | EXECUTIVE COMPENSATION |
The information set forth in the Proxy Statement under the headings “Compensation Discussion and Analysis,” “Executive Compensation,” “Compensation Committee Interlocks and Insider Participation,” and “Report of the Compensation Committee on the Compensation Discussion and Analysis” is incorporated herein by reference.
| Item 12. | SECURITY OWNERSHIP OF CERTAIN BENEFICIAL OWNERS AND MANAGEMENT AND RELATED SHAREHOLDER MATTERS |
The information set forth in the Proxy Statement under the headings “Voting Securities Outstanding and Principal Shareholders,” “Security Ownership of Management,” and “Equity Compensation Plan Information” is incorporated herein by reference.
| Item 13. | CERTAIN RELATIONSHIPS AND RELATED TRANSACTIONS AND DIRECTOR INDEPENDENCE |
The information set forth in the Proxy Statement under the headings “Business Relationships and Related Person Transactions” and “Election of Directions” is incorporated herein by reference.
| Item 14. | PRINCIPAL ACCOUNTANT FEES AND SERVICES |
The information set forth in the Proxy Statement under the heading “Independent Registered Public Accounting Firm” is incorporated herein by reference.
PART IV
| Item 15. | EXHIBITS AND FINANCIAL STATEMENT SCHEDULES |
(a)(1) Financial Statements. The following financial statements and supplementary data are included in Item 8 of this report.
| Financial Statements |
Form 10-K Page | |
| Quarterly Financial Information |
48 | |
| Reports of Independent Registered Public Accounting Firm |
49 | |
| Consolidated Balance Sheets as of December 31, 2009 and 2008 |
52 | |
| Consolidated Statements of Income (Loss) for the years ended December 31, 2009, 2008 and 2007 |
53 | |
| Consolidated Statements of Changes in Shareholders’ Equity and Comprehensive Income (Loss) for the years ended December 31, 2009, 2008 and 2007 |
54 | |
| Consolidated Statements of Cash Flows for the years ended December 31, 2009, 2008 and 2007 |
55 | |
| Notes to Consolidated Financial Statements |
56 | |
(a)(2) Financial Statement Schedules. All applicable financial statement schedules required under Regulation S-X have been included in the Notes to the Consolidated Financial Statements.
(a)(3) Exhibits. The exhibits required by Item 601 of Regulation S-K are listed below.
100
Table of Contents
INDEX TO EXHIBITS
| Exhibit No. |
Description of Exhibit | |
| 3.10 |
Articles of Incorporation of the Registrant, incorporated herein by reference to Exhibit 3.1 to the Registrant’s Form S-14 Registration Statement (No. 2-96498) filed March 16, 1985. | |
| 3.11 |
Articles of Amendment to Articles of Incorporation of the Registrant, adopted May 10, 1988, incorporated herein by reference to Exhibit 19.10 to the Registrant’s Form 10-Q Quarterly Report for the quarter ended June 30, 1988. | |
| 3.12 |
Articles of Amendment to Articles of Incorporation of the Registrant, adopted May 12, 1998, incorporated herein by reference to Exhibit 3.12 to the Registrant’s Form 10-Q Quarterly Report for the quarter ended June 30, 1998. | |
| 3.13 |
Articles of Amendment to Articles of Incorporation of the Registrant, adopted May 23, 2003, incorporated herein by reference to Exhibit 3.13 to the Registrant’s Form 10-Q Quarterly Report for the quarter ended June 30, 2003. | |
| 3.14 |
Articles of Amendment to Articles of Incorporation of the Registrant, adopted March 15, 2006, incorporated herein by reference to Exhibit 3.14 to the Registrant’s Form 10-Q Quarterly Report for the quarter ended March 31, 2006. | |
| 3.15 |
Articles of Merger, setting forth amendment to Articles of Incorporation of the Registrant, effective April 28, 2006, incorporated herein by reference to Exhibit 3.15 to the Registrant’s Form 10-Q Quarterly Report for the quarter ended March 31, 2006. | |
| 3.16 |
Articles of Amendment to Articles of Incorporation, adopted January 23, 2009, incorporated herein by reference to Exhibit 3.1 to the Registrant’s Form 8-K Current Report filed January 23, 2009. | |
| 3.17 |
Articles of Amendment to Articles of Incorporation, adopted February 11, 2009, incorporated herein by reference to Exhibit 3.1 to the Registrant’s Form 8-K Current Report filed February 13, 2009. | |
| 3.20 |
Amended and Restated Bylaws of the Registrant, adopted February 11, 2009, incorporated herein by reference to Exhibit 3.2 to the Registrant’s Form 8-K Current Report filed February 13, 2009. | |
| 4.10 |
Specimen of Registrant’s Common Stock Certificate, incorporated herein by reference to Exhibit 4 to Amendment No. 1 to the Registrant’s Form S-14 Registration Statement (No. 2-96498) filed April 19, 1985. | |
| 4.11 |
Specimen of Registrant’s Fixed Rate Cumulative Perpetual Preferred Stock, Series A, Stock Certificate, incorporated herein by reference to Exhibit 4.1 to the Registrant’s Form 8-K Current Report filed February 13, 2009. | |
| 4.20 |
Indenture dated as of November 4, 2005, between FNB Corp. and U.S. Bank, National Association, as trustee, incorporated herein by reference to Exhibit 4.1 to the Registrant’s Form 8-K Current Report filed November 8, 2005. | |
| 4.21 |
Amended and Restated Declaration of Trust of FNB United Statutory Trust I dated as of November 4, 2005, among FNB Corp., as sponsor, U.S. Bank, National Association, as institutional trustee, and Michael C. Miller and Jerry A. Little, as administrators, incorporated herein by reference to Exhibit 4.2 to the Registrant’s Form 8-K Current Report dated November 4, 2005. | |
| 4.30 |
Amended and Restated Declaration of Trust of FNB United Statutory Trust I dated as of November 4, 2005, among FNB Corp., as sponsor, U.S. Bank, National Association, as institutional trustee, and Michael C. Miller and Jerry A. Little, as administrators, incorporated herein by reference to Exhibit 4.2 to the Registrant’s Form 8-K Current Report filed November 8, 2005. | |
101
Table of Contents
| 4.31 |
Amended and Restated Trust Agreement of FNB United Statutory Trust II dated as of April 27, 2006, among FNB Corp., as sponsor, Wilmington Trust Company, as institutional trustee, and Michael C. Miller and Jerry A. Little, as administrators, incorporated herein by reference to Exhibit 4.2 to the Registrant’s Form 8-K Current Report dated April 27, 2006 and filed April 28, 2006. | |
| 4.40 |
Warrant to purchase up to 2,207,143 shares of Common Stock used to the United States Department of the Treasury, incorporated herein by reference to Exhibit 4.2 to the Registrant’s Form 8-K Current Report filed February 13, 2009. | |
| 10.10* |
Form of Split Dollar Insurance Agreement dated as of November 1, 1987 between First National Bank and Trust Company and certain of its key employees and directors, incorporated herein by reference to Exhibit 19.20 to the Registrant’s Form 10-Q Quarterly Report for the quarter ended June 30, 1988. | |
| 10.11* |
Form of Amendment to Split Dollar Insurance Agreement dated as of November 1, 1994 between First National Bank and Trust Company and certain of its key employees and directors, incorporated herein by reference to Exhibit 10.11 to the Registrant’s Form 10-KSB Annual Report for the fiscal year ended December 31, 1994. | |
| 10.20* |
Stock Compensation Plan as amended effective May 12, 1998, incorporated herein by reference to Exhibit 10.30 to the Registrant’s Form 10-Q Quarterly Report for the quarter ended June 30, 1998. | |
| 10.21* |
Form of Incentive Stock Option Agreement between FNB Corp. and certain of its key employees, pursuant to the Registrant’s Stock Compensation Plan, incorporated herein by reference to Exhibit 10.31 to the Registrant’s Form 10-KSB Annual Report for the fiscal year ended December 31, 1994. | |
| 10.22* |
Form of Nonqualified Stock Option Agreement between FNB Corp. and certain of its directors, pursuant to the Registrant’s Stock Compensation Plan, incorporated herein by reference to Exhibit 10.32 to the Registrant’s Form 10-KSB Annual Report for the fiscal year ended December 31, 1994. | |
| 10.23* |
FNB United Corp. 2003 Stock Incentive Plan, as amended and restated as of December 31, 2008, incorporated herein by reference to Exhibit 10.23 to the Registrant’s Form 10-K Annual Report for the fiscal year ended December 31, 2008. | |
| 10.24* |
Form of Incentive Stock Option Agreement between FNB Corp. and certain of its key employees, pursuant to the Registrant’s 2003 Stock Incentive Plan, incorporated herein by reference to Exhibit 10.24 to the Registrant’s Form 10-Q Quarterly Report for the quarter ended September 30, 2003. | |
| 10.25* |
Form of Nonqualified Stock Option Agreement between FNB Corp. and certain of its directors, pursuant to the Registrant’s 2003 Stock Incentive Plan, incorporated herein by reference to Exhibit 10.25 to the Registrant’s Form 10-K Annual Report for the fiscal year ended December 31, 2003. | |
| 10.26* |
Form of Restricted Stock Agreement between FNB United Corp. and certain of its key employees and non-employee directors, pursuant to the Registrant’s 2003 Stock Incentive Plan, incorporated herein by reference to Exhibit 10.26 to the Registrant’s Form 10-Q Quarterly Report for the quarter ended June 30, 2006. | |
| 10.30* |
Amended and Restated Employment Agreement dated as of December 31, 2008 among FNB United Corp., CommunityONE Bank, National Association and Michael C. Miller, incorporated herein by reference to Exhibit 10.30 to the Registrant’s Form 10-K Annual Report for the fiscal year ended December 31, 2008. | |
| 10.31* |
Carolina Fincorp, Inc. Stock Option Plan (assumed by the Registrant on April 10, 2000), incorporated herein by reference to Exhibit 99.1 to the Registrant’s Registration Statement on Form S-8 (File No. 333-54702). | |
| 10.32* |
Amended and Restated Employment Agreement dated as of December 31, 2008 between CommunityONE Bank, National Association and R. Larry Campbell, incorporated herein by reference to Exhibit 10.32 to the Registrant’s Form 10-K Annual Report for the fiscal year ended December 31, 2008. | |
| 10.33* |
Nonqualified Supplemental Retirement Plan with R. Larry Campbell, incorporated herein by reference to Exhibit 10(c) to the Annual Report on Form 10-KSB of Carolina Fincorp, Inc. for the fiscal year ended June 30, 1997. | |
102
Table of Contents
| 10.34* |
Amendment to Executive Income Deferred Compensation Agreement dated as of December 31, 2008 between CommunityONE Bank, National Association and R. Larry Campbell, incorporated herein by reference to Exhibit 10.34 to the Registrant’s Form 10-K Annual Report for the fiscal year ended December 31, 2008. | |
| 10.35* |
Amended and Restated Change of Control Agreement dated as of December 31, 2008 among FNB United Corp., CommunityONE Bank, National Association, and R. Mark Hensley, incorporated herein by reference to Exhibit 10.35 to the Registrant’s Form 10-K Annual Report for the fiscal year ended December 31, 2008. | |
| 10.36* |
Amended and Restated Change of Control Agreement dated as of December 31, 2008 among FNB United Corp., CommunityONE Bank, National Association, and Mark A. Severson, incorporated herein by reference to Exhibit 10.36 to the Registrant’s Form 10-K Annual Report for the fiscal year ended December 31, 2008. | |
| 10.37* |
Form of Change of Control Agreement among FNB United Corp., CommunityONE Bank, National Association and certain key officers and employees, incorporated herein by reference to Exhibit 10.37 to the Registrant’s Form 10-K Annual Report for the fiscal year ended December 31, 2008. | |
| 10.38* |
Form of Letter Agreement between FNB United Corp. and senior executive officers incorporated herein by reference to the Registrant’s Form 8-K Current Report filed February 13, 2009. | |
| 10.40 |
Guarantee Agreement dated as of November 4, 2005, by FNB Corp. for the benefit of the holders of trust preferred securities, incorporated herein by reference to Exhibit 10.1 to the Registrant’s Form 8-K Current Report dated November 4, 2005 and filed November 5, 2005. | |
| 10.41 |
Guarantee Agreement dated as of April 27, 2006 between FNB Corp. and Wilmington Trust Company, as guarantee trustee, for the benefit of the holders of trust preferred securities, incorporated herein by reference to Exhibit 10.1 to the Registrant’s Form 8-K Current Report dated April 27, 2006 and filed April 28, 2006. | |
| 10.43 |
Subordinated Debt Loan Agreement dated as of June 30, 2008, between CommunityONE Bank, National Association and SunTrust Bank, incorporated herein by reference to Exhibit 10.43 to the Registrant’s Form 10-Q Quarterly Report for the quarter ended June 30, 2008. | |
| 10.5 |
Letter Agreement between the Registrant and the United States Department of the Treasury, dated February 13, 2009, incorporated herein by reference to Exhibit 10.1 to the Registrant’s Form 8-K Current Report filed February 13, 2009. | |
| 14 |
Code of Ethics for Senior Financial Officers, incorporated herein by reference to Exhibit 14 to the Registrant’s Form 10-K Annual Report for the fiscal year ended December 31, 2003. | |
| 21 |
Subsidiaries of the Registrant. | |
| 23.10 |
Consent of Independent Registered Public Accounting Firm – Dixon Hughes PLLC | |
| 31.10 |
Certification of Chief Executive Officer Pursuant to Section 302 of the Sarbanes-Oxley Act of 2002. | |
| 31.11 |
Certification of Chief Financial Officer Pursuant to Section 302 of the Sarbanes-Oxley Act of 2002. | |
| 32 |
Certification Pursuant to Section 906 of the Sarbanes-Oxley Act of 2002. | |
| 99.10 |
Certification of Principal Executive Officer Pursuant to Section 111 of the Emergency Economic Stabilization Act of 2008, as amended | |
| 99.11 |
Certification of Principal Financial Officer Pursuant to Section 111 of the Emergency Economic Stabilization Act of 2008, as amended | |
* Management contract, or compensatory plan or arrangement.
103
Table of Contents
Pursuant to the requirements of Section 13 or 15(d) of the Securities Exchange Act of 1934, the Registrant has duly caused this report to be signed on its behalf by the undersigned, thereunto duly authorized, as of April 14, 2010.
| FNB United Corp. |
||||||||
| (Registrant) |
||||||||
| By: |
/s/ MICHAEL C. MILLER |
|||||||
| Michael C. Miller |
||||||||
| President and Chief Executive Officer |
||||||||
Pursuant to the requirements of the Securities Exchange Act of 1934, this report has been signed below by the following persons on behalf of the Registrant and in the capacities indicated, as of April 14, 2010.
| Signature |
Title |
|||||
| /s/ MICHAEL C. MILLER |
President and Chief Executive Officer |
|||||
| Michael C. Miller |
(Principal Executive Officer) |
|||||
| /s/ MARK A. SEVERSON |
Executive Vice President and Treasurer |
|||||
| Mark A. Severson |
(Principal Financial and Accounting Officer) |
|||||
| /s/ JACOB F. ALEXANDER III |
Director |
|||||
| Jacob F. Alexander III |
||||||
| /s/ LARRY E. BROOKS |
Director |
|||||
| Larry E. Brooks |
||||||
| /s/ JAMES M. CAMPBELL, JR. |
Director |
|||||
| James M. Campbell, Jr. |
||||||
| /s/ R. LARRY CAMPBELL |
Director |
|||||
| R. Larry Campbell |
||||||
| /s/ DARRELL L. FRYE |
Director |
|||||
| Darrell L. Frye |
||||||
| /s/ HAL F. HUFFMAN, JR. |
Director |
|||||
| Hal F. Huffman, Jr. |
||||||
| /s/ THOMAS A. JORDAN |
Director |
|||||
| Thomas A. Jordan |
||||||
| /s/ LYNN S. LLOYD |
Director |
|||||
| Lynn S. Lloyd |
||||||
| /s/ RAY H. MCKENNEY, JR. |
Director |
|||||
| Ray H. McKenney, Jr. |
||||||
| /s/ EUGENE B. MCLAURIN, II |
Director |
|||||
| Eugene B. McLaurin, II |
||||||
| /s/ R. REYNOLDS NEELY, JR. |
Director |
|||||
| R. Reynolds Neely, Jr. |
||||||
| /s/ J. M. RAMSAY III |
Director |
|||||
| J. M. Ramsay III |
||||||
| /s/ SUZANNE B. RUDY |
Director |
|||||
| Suzanne B. Rudy |
||||||
| /s/ CARL G. YALE |
Director |
|||||
| Carl G. Yale |
||||||
104