Attached files
| file | filename |
|---|---|
| 8-K - 8-K - UMB FINANCIAL CORP | d615520d8k.htm |
| EX-99.1 - EX-99.1 - UMB FINANCIAL CORP | d615520dex991.htm |
| EX-3.(II).2 - EX-3(II).2 - UMB FINANCIAL CORP | d615520dex3ii2.htm |
| EX-3.(II).1 - EX-3(II).1 - UMB FINANCIAL CORP | d615520dex3ii1.htm |
 Third Quarter 2013
UMB Financial
Exhibit 99.2 |
 Cautionary Notice about Forward-Looking Statements
2
This presentation contains, and our other communications may contain,
forward-looking statements within the meaning of the Private Securities
Litigation Reform Act of 1995. These statements can be identified by the
fact that they do not relate strictly to historical or current facts. All forward-looking
statements
are
subject
to
assumptions,
risks,
and
uncertainties,
which
may
change
over
time
and
many
of
which
are
beyond
our
control.
You
should
not
rely
on
any
forward-looking
statement
as
a
prediction or guarantee about the future. Our actual future objectives, strategies,
plans, prospects, performance, condition, or results may differ materially
from those set forth in any forward-looking statement. Some of the
factors that may cause actual results or other future events, circumstances, or
aspirations to differ from those in forward-looking statements are described in
our Annual Report on Form
10-K
for
the
year
ended
December
31,
2012,
our
subsequent
Quarterly
Reports
on
Form
10-Q
or Current Reports on Form 8-K, or other applicable documents that are filed or
furnished with the Securities and Exchange Commission (SEC). Any
forward-looking statement made by us or on our behalf speaks only as of
the date that it was made. We do not undertake to update any forward-
looking statement to reflect the impact of events, circumstances, or results that
arise after the date that the statement was made. You, however, should
consult further disclosures (including disclosures of a forward-looking
nature) that we may make in any subsequent Quarterly Report on Form 10-Q, Current
Report on Form 8-K, or other applicable document that is filed or furnished
with the SEC. |
 Business Segment Metrics |
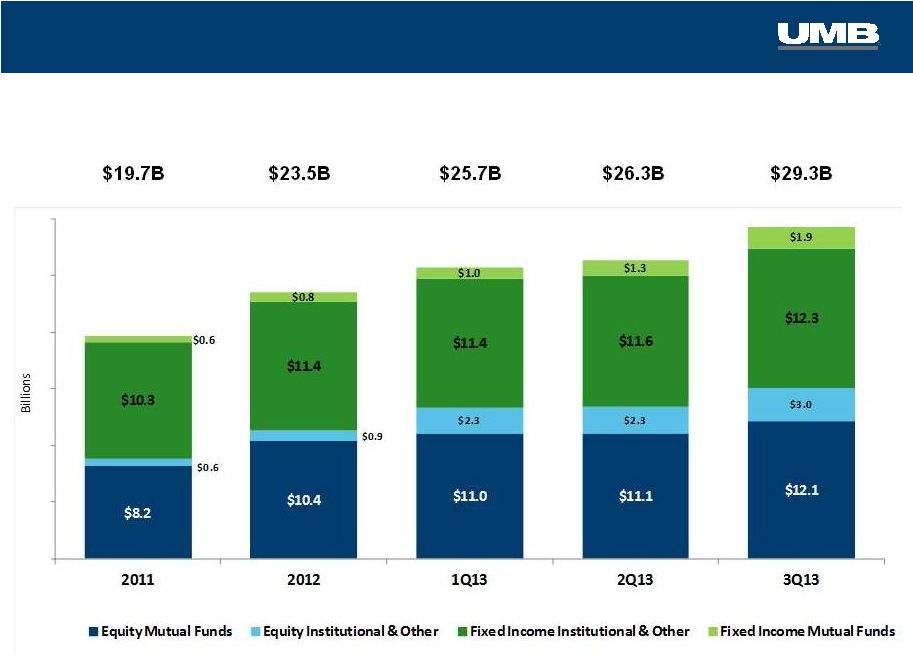
 Institutional Investment Management
* Industry data source: Strategic Insight
A
B
C
E
AUM increased 29.6% year-
over-year to $29.3 billion
Record net inflows of $1.9
billion for Q3’13; year-to-date
flows of $4.4 billion
Q3’13 industry stats: Equity
funds realized $113.2B in net
inflows; Taxable bond funds
realized $14.7B in net outflows
3
Quarter 2013 Highlights
4
$22.6
$23.5
$25.7
$26.3
$29.3
3Q'12
4Q'12
1Q'13
2Q'13
3Q'13
Total Scout Assets Under Management
($ billions)
rd
Institutional Investment Management Operating Results
(unaudited,
$000s)
3 mos Ended
June 30,
Year-Over-Year
Linked-Quarter
2013
2012
2013
Net Interest income
(11)
(1)
(10)
1000.0%
10.0%
Noninterest income
33,836
24,789
29,160
36.5%
16.0%
Noninterest expense
21,097
17,316
18,932
21.8%
11.4%
NI before taxes
12,728
7,472
10,218
70.3%
24.6%
Income tax expense
3,501
2,098
2,691
66.9%
30.1%
Net income
9,227
5,374
7,527
71.7%
22.6%
pre-tax profit margin
37.6%
30.1%
35.1%
September 30,
% Change
3 mos Ended |
 AUM Drivers
$2,204.5
$932.7
$486.2
Total Change
($millions)
$25,746.8
$23,542.3
$22,609.6
Total AUM
($millions)
$567.3
$26,314.1
Institutional Investment Management
5
$2,994.8
$29,308.9 |
 Total
AUM Institutional Investment Management
6 |
 AUM
by Strategy – As of 3Q’13
7 |
 Fixed Income Rotation
8 |
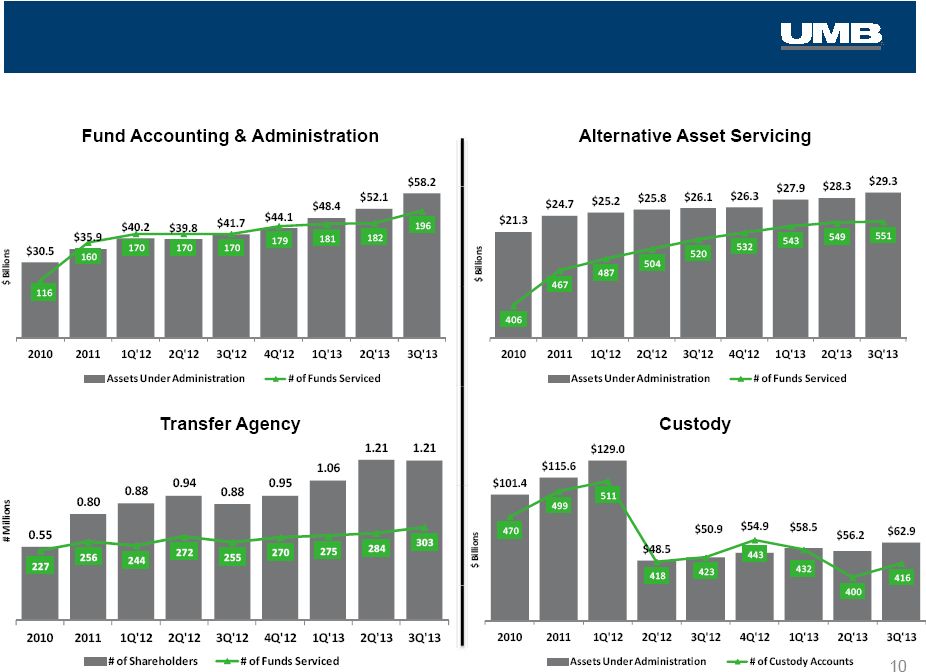
 Asset Servicing
A
B
Total AUA increased by 21% to
$181.7 billion year-over-year
In the past 12 months, fund
accounting and administration
AUA grew by 40%; 26 new funds
added
3
Quarter 2013 Highlights
9
$162.4
$179.3
$206.4
$156.0
$165.4
$168.0
$181.7
2009
2010
2011
2012
1Q13
2Q13
3Q13
Assets Under Administration
($billions)
rd
Asset
Servicing
Operating
Results
(
unaudited,
$000s)
3 mos Ended
June 30,
Year-Over-Year
Linked-Quarter
2013
2012
2013
Net interest income
550
472
587
16.5%
-6.3%
Noninterest income
20,429
18,300
19,275
11.6%
6.0%
Noninterest expense
17,201
17,142
17,054
0.3%
0.9%
NI before taxes
3,778
1,630
2,808
131.8%
34.5%
Income tax expense
1,468
608
967
141.4%
51.8%
Net income
2,310
1,022
1,841
126.0%
25.5%
pre-tax profit margin
18.0%
8.7%
14.1%
% Change
September 30,
3 mos Ended |
 Asset Servicing
Business Metrics |
 $0.85
$0.85
$1.04
$1.10
$1.06
$1.08
$1.31
$1.36
$1.29
$1.26
$1.58
$1.48
$1.37
$1.38
$1.79
$1.72
$1.64
$10.6
$13.8
$15.7
$15.4
$16.4
Purchase Volume ($ billions)
Interchange ($ millions)
Payment Solutions
Total Card Purchase Volume
& Interchange Revenue
Durbin
effective
Purchase
Volume
3Q ‘09–’13
17.9%
Inter-
change
3Q ‘09–’13
11.7%
CAGR
ACommercial credit card
B
purchase volume +9.8% year-
over-year to $321 million;
provided 46% of interchange
Interchange revenue +6.6%
year-over-year to $16.4 million
3
Quarter 2013 Highlights
11
rd
Payment
Solutions
Operating
Results
(
unaudited,
$000s)
3 mos Ended
June 30,
Year-Over-Year
Linked-Quarter
2013
2012
2013
Net interest income
11,587
10,843
11,192
6.9%
3.5%
Provision for loan losses
4,667
1,570
3,318
197.3%
40.7%
Noninterest income
18,409
16,081
18,649
14.5%
-1.3%
Noninterest expense
21,566
17,764
21,986
21.4%
-1.9%
NI before taxes
3,763
7,590
4,537
-50.4%
-17.1%
Income tax expense
1,311
2,024
1,350
-35.2%
-2.9%
Net income
2,452
5,566
3,187
-55.9%
-23.1%
pre-tax profit margin
12.5%
28.2%
15.2%
% Change
September 30,
3 mos Ended |
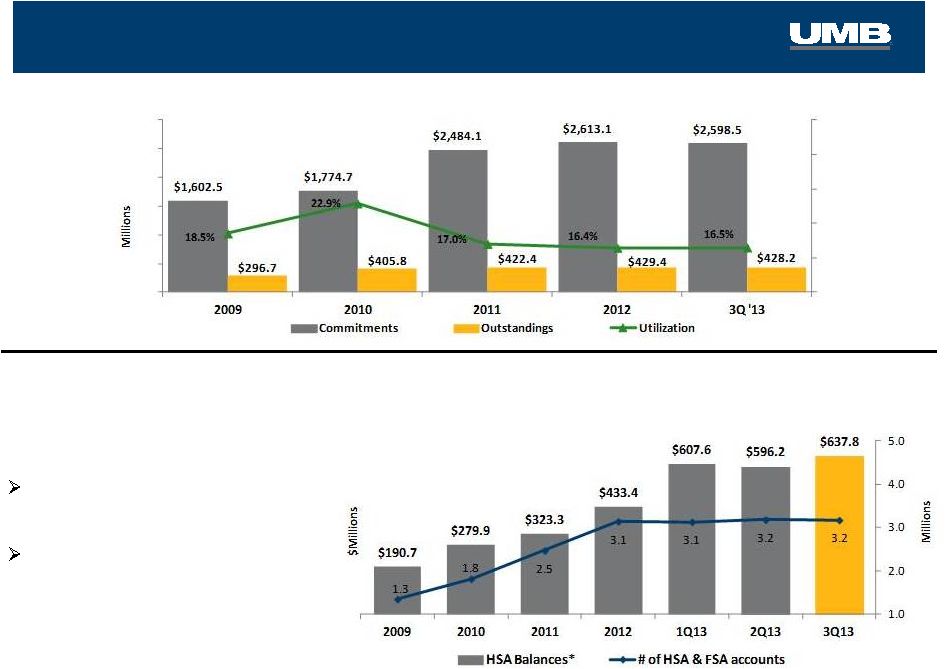 Payment Solutions
Health Savings Accounts & Balances
* Deposits and investment assets
A
B
Healthcare card purchase volume
+52% to $680.2 million vs. 3Q’12
Customer deposits and assets +50%
to $637.8 million vs. 3Q’12
3
Quarter 2013 Highlights
Healthcare Services
Card Utilization
12
rd |
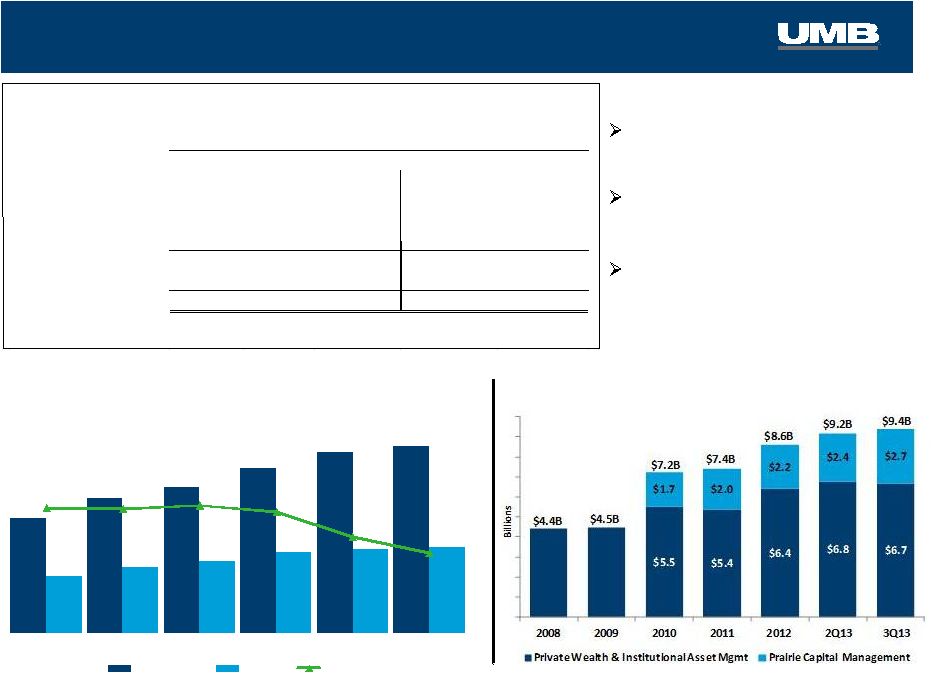 Bank
Assets Under Management
($ billions)
HELOC Lending
(average balances)
A
B
C
Total net loans grew for the 14
consecutive quarter, increasing 20.9%
year-over-year to $6.4 billion
Private Banking exceeded $305million
in average loan balances, an increase
of 38.4% over Q3 2012
Small Business Banking loans
increased 25% year-over-year to
$167.2 million
3
Quarter 2013 Highlights
13
$741
$873
$941
$1,070
$1,163
$1,209
$365
$430
$465
$524
$548
$555
49.3%
49.2%
49.4%
49.0%
47.1%
46.0%
2008
2009
2010
2011
2012
3Q13
Commitments
Balances
Utilization
rd
3 mos Ended
June 30,
Year-Over-Year
Linked-Quarter
2013
2012
2013
Net interest income
73,419
69,051
70,558
6.3%
4.1%
Provision for loan losses
1,833
2,930
1,682
-37.4%
9.0%
Noninterest income
48,951
47,151
46,501
3.8%
5.3%
Noninterest expense
93,199
93,683
92,339
-0.5%
0.9%
NI before taxes
27,338
19,589
23,038
39.6%
18.7%
Income tax expense
6,895
5,426
5,664
27.1%
21.7%
Net income
20,443
14,163
17,374
44.3%
17.7%
pre-tax profit margin
22.3%
16.9%
19.7%
3 mos Ended
% Change
September 30,
*th
Bank
Operating
Results
(
unaudited,
$000s) |
 48.5%
47.9%
47.4%
45.8%
43.9%
42.4%
0%
50%
100%
3Q'08
3Q'09
3Q'10
3Q'11
3Q'12
3Q'13
KC
CO
STL
Greater MO
KS
OK
AZ
NE
TX
Bank
High Growth Regions
3Q’13 vs. 3Q’12
•
Arizona
+65%
•
Nebraska
+32%
Commercial Loans By Region
•
St. Louis
+32%
•
Oklahoma +25%
Commercial Loan Growth
(C&I and CRE Loans)
5 yr
CAGR
3Q ‘08–’13
10.9%
14 |
 Bank
5 yr
CAGR
3Q ‘08–’13
12.6%
Deposits By Region
15
48.1%
53.8%
55.0%
58.3%
60.0%
64.1%
0%
50%
100%
3Q'08
3Q'09
3Q'10
3Q'11
3Q'12
3Q'13
KC
STL
CO
Gtr MO
KS
OK
AZ
NE |
 Deposit Composition
16
Deposit Composition by Line of Business
At September 30, 2013 |
 Appendix |
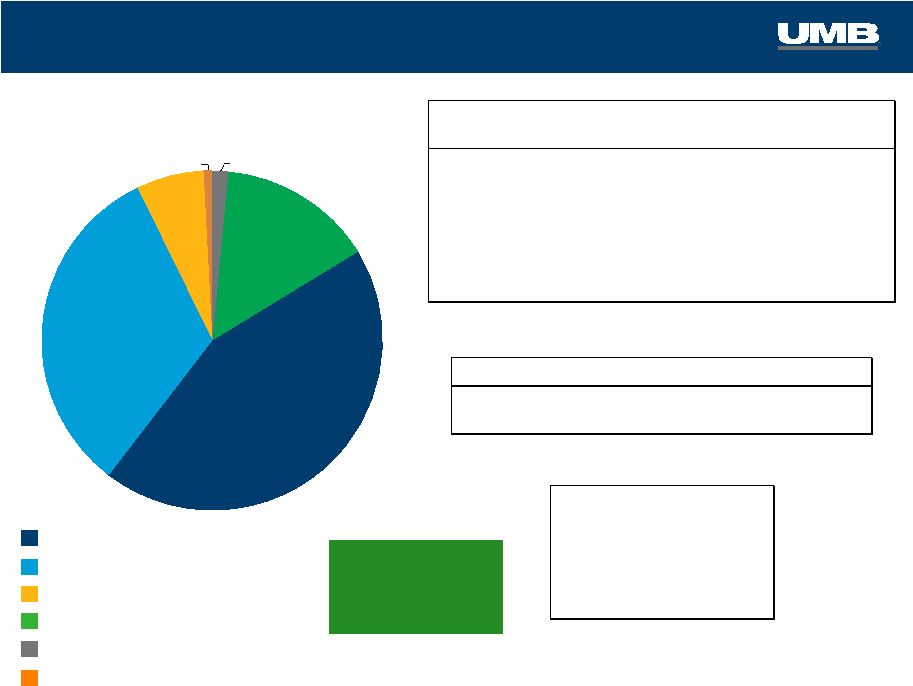    Average Balance:
$7.0 billion
Average Yield:
1.99%
Investment Mix
As of September 30, 2013
Mortgage-Backed Securities
Municipals
CDs & Corporates
Agencies
Treasuries
Trading Securities
Investment Portfolio Statistics
18
1.5%
14.8%
44.2%
32.3%
6.4%
0.8%
Roll off
Purchased
($ millions)
Yield
($ millions)
Yield
1Q13
$413
1.98%
$769
1.31%
2Q13
$340
2.13%
$815
1.41%
3Q13
$265
1.85%
$77
1.02%
Scheduled Cash Flow
4Q13
$305
2.02%
Next 12 months
$1,127
1.88%
Securities Gains
($ millions)
3Q12
259
$
4Q12
210
$
1Q13
5,893
$
2Q13
1,519
$
3Q13
1,140
$
Duration/Life
(in months)
at 09/30/13
at 06/30/13
Avg. Life Total
49.39
48.67
Duration Total
46.31
46.80 |