Attached files
| file | filename |
|---|---|
| EX-99.1 - EXHIBIT 99.1 - US BANCORP \DE\ | d611754dex991.htm |
| 8-K - FORM 8-K - US BANCORP \DE\ | d611754d8k.htm |
 October 16, 2013
Richard K. Davis
Chairman, President and CEO
Andy Cecere
Vice Chairman and CFO
Exhibit 99.2
U.S. Bancorp
3Q13 Earnings
Conference Call |
 2
Forward-looking Statements and Additional Information
The
following
information
appears
in
accordance
with
the
Private
Securities
Litigation
Reform
Act
of
1995:
This presentation contains forward-looking statements about U.S. Bancorp.
Statements that are not historical or current facts, including statements
about beliefs and expectations, are forward-looking statements and are based on
the information available to, and assumptions and estimates made
by,
management
as
of
the
date
made.
These
forward-looking
statements
cover,
among
other
things,
anticipated
future
revenue
and
expenses
and
the
future
plans
and
prospects
of
U.S.
Bancorp.
Forward-looking
statements
involve
inherent
risks
and
uncertainties,
and
important
factors could cause actual results to differ materially from those
anticipated. Global and domestic economies could fail to recover from the recent
economic downturn or could experience another severe contraction, which could
adversely affect U.S. Bancorp’s revenues and the values of its assets
and liabilities. Global financial markets could experience a recurrence of significant turbulence, which could reduce the availability of
funding to certain financial institutions and lead to a tightening of credit, a
reduction of business activity, and increased market volatility. Continued
stress in the commercial real estate markets, as well as a delay
or failure of recovery in the residential real estate markets, could cause
additional credit losses and deterioration in asset values. In
addition, U.S. Bancorp’s business and financial performance is likely to be negatively impacted
by recently enacted and future legislation and regulation. U.S.
Bancorp’s results could also be adversely affected by deterioration in
general business and economic conditions; changes in interest rates;
deterioration in the credit quality of its loan portfolios or in the value of the collateral
securing
those
loans;
deterioration
in
the
value
of
securities
held
in
its
investment
securities
portfolio;
legal
and
regulatory
developments;
increased
competition from both banks and non-banks; changes in customer behavior and
preferences; effects of mergers and acquisitions and related integration;
effects of critical accounting policies and judgments; and management’s ability to effectively manage credit risk, residual value risk,
market risk, operational risk, interest rate risk and liquidity risk.
For discussion of these and other risks that may cause actual results to differ
from expectations, refer to U.S. Bancorp’s Annual Report on
Form 10-K for the year ended December 31, 2012, on file with the Securities and
Exchange Commission, including the sections entitled “Risk
Factors”
and “Corporate Risk Profile”
contained in Exhibit 13, and all subsequent filings with the Securities and
Exchange Commission under Sections 13(a), 13(c), 14 or 15(d) of the
Securities Exchange Act of 1934. Forward-looking statements speak only as of the date they are made,
and U.S. Bancorp undertakes no obligation to update them in light of new
information or future events. This presentation includes non-GAAP
financial measures to describe U.S. Bancorp’s performance. The
reconciliations of those measures to GAAP measures
are
provided
within
or
in
the
appendix
of
the
presentation.
These
disclosures
should
not
be
viewed
as
a
substitute
for
operating
results
determined in accordance with GAAP, nor are they necessarily comparable to
non-GAAP performance measures that may be presented by other
companies. |
 3
3Q13 Earnings
Conference Call
3Q13 Highlights
Net income of $1.5 billion; $0.76 per diluted common share
Average loan growth of 5.7% vs. 3Q12 and average loan growth of 1.9%
vs. 2Q13
Strong average deposit growth of 5.5% vs. 3Q12 and 2.0% vs. 2Q13
Net charge-offs declined 16.3% vs. 2Q13
Nonperforming assets declined 2.8% vs. 2Q13 (2.1% excluding covered assets)
Capital generation continues to reinforce capital position
•
Tier 1 common equity ratio estimated at 8.6% using final rules for Basel III
standardized approach released July 2013
•
Tier 1 common equity ratio of 9.3%; Tier 1 capital ratio of 11.2%
Returned 77% of earnings to shareholders in 3Q13
•
Repurchased 17 million shares of common stock during 3Q13
|
 4
3Q13 Earnings
Conference Call
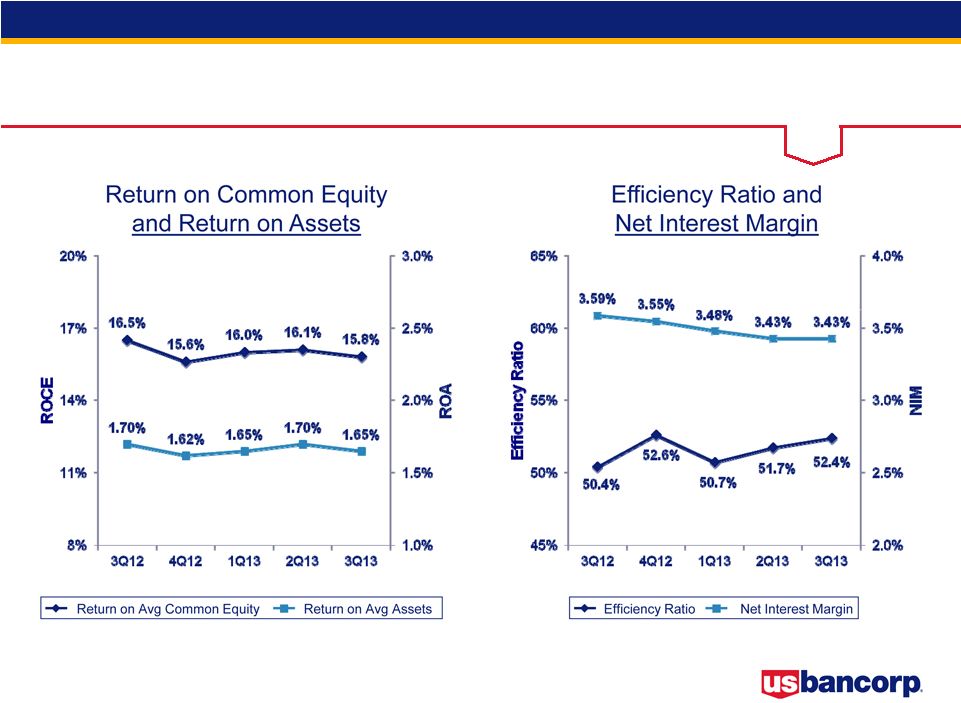
Performance Ratios
Efficiency ratio computed as noninterest expense divided by the sum of net interest
income on a taxable-equivalent basis and noninterest income excluding
securities gains (losses) net |
 5
3Q13 Earnings
Conference Call
Taxable-equivalent basis
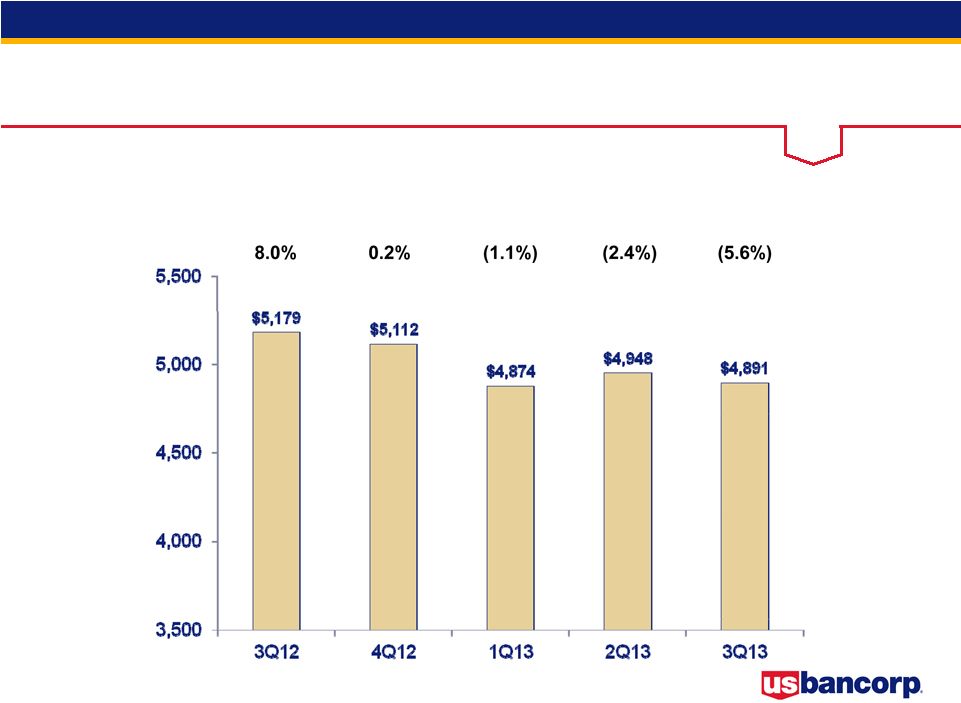
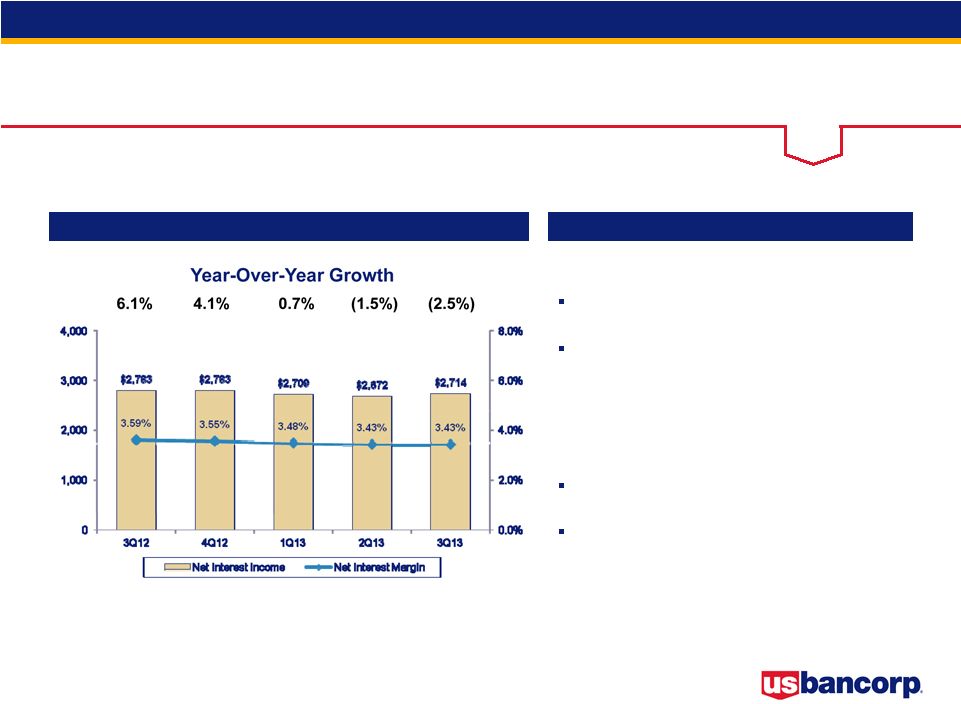
Revenue Growth
Year-Over-Year Growth
$ in millions |
 6
3Q13 Earnings
Conference Call
Loan and Deposit Growth
Average Balances
Year-Over-Year Growth
$ in billions |
 7
3Q13 Earnings
Conference Call
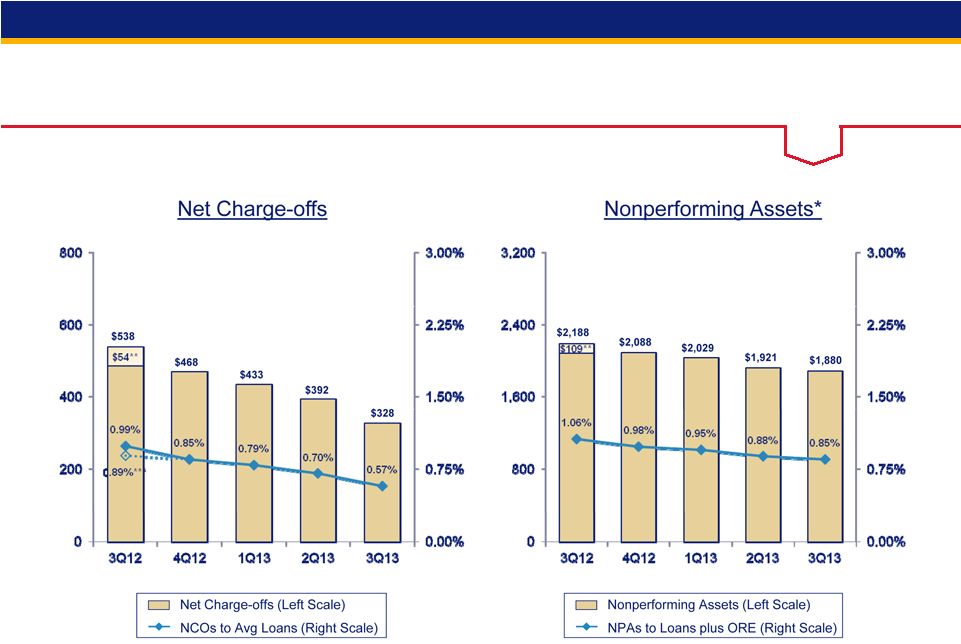
Credit Quality
* Excluding Covered Assets (assets subject to loss sharing agreements with
FDIC) ** Related to a regulatory clarification in the treatment of residential mortgage and other consumer
loans to borrowers who have exited bankruptcy but continue to make payments on
their loans *** Excluding $54 million of incremental charge-offs $
in millions |
 8
3Q13 Earnings
Conference Call
Earnings Summary
$ in millions, except per-share data
Taxable-equivalent basis
YTD
YTD
3Q13
2Q13
3Q12
vs 2Q13
vs 3Q12
2013
2012
% B/(W)
Net Interest Income
2,714
$
2,672
$
2,783
$
1.6
(2.5)
8,095
$
8,186
$
(1.1)
Noninterest Income
2,177
2,276
2,396
(4.3)
(9.1)
6,618
6,990
(5.3)
Total Revenue
4,891
4,948
5,179
(1.2)
(5.6)
14,713
15,176
(3.1)
Noninterest Expense
2,565
2,557
2,609
(0.3)
1.7
7,592
7,770
2.3
Operating Income
2,326
2,391
2,570
(2.7)
(9.5)
7,121
7,406
(3.8)
Net Charge-offs
328
392
538
16.3
39.0
1,153
1,629
29.2
Excess Provision
(30)
(30)
(50)
--
--
(90)
(190)
--
Income before Taxes
2,028
2,029
2,082
(0.0)
(2.6)
6,058
5,967
1.5
Applicable Income Taxes
598
585
650
(2.2)
8.0
1,797
1,852
3.0
Noncontrolling Interests
38
40
42
(5.0)
(9.5)
119
112
6.3
Net Income
1,468
1,484
1,474
(1.1)
(0.4)
4,380
4,227
3.6
Preferred Dividends/Other
68
79
70
13.9
2.9
217
193
(12.4)
NI to Common
1,400
$
1,405
$
1,404
$
(0.4)
(0.3)
4,163
$
4,034
$
3.2
Diluted EPS
0.76
$
0.76
$
0.74
$
-
2.7
2.25
$
2.12
$
6.1
Average Diluted Shares
1,843
1,853
1,897
0.5
2.8
1,854
1,901
2.5
% B/(W) |
 9
3Q13 Earnings
Conference Call
3Q13 Results -
Key Drivers
vs. 3Q12
Net Revenue decline of 5.6%
•
Net interest income decline of 2.5%; net interest margin of 3.43% vs. 3.59% in
3Q12 •
Noninterest income decline of 9.1%
Noninterest expense decline of 1.7%
Provision for credit losses lower by $190 million
•
Net charge-offs lower by $210 million
•
Provision lower than NCOs by $30 million vs. $50 million in 3Q12
vs. 2Q13
Net Revenue decline of 1.2%
•
Net
interest
income
growth
of
1.6%;
net
interest
margin
of
3.43%
vs.
3.43%
in
2Q13
•
Noninterest income decline of 4.3%
Noninterest expense increase of 0.3%
Provision for credit losses lower by $64 million
•
Net charge-offs lower by $64 million
•
Provision lower than NCOs by $30 million vs. $30 million in 2Q13
|
 10
3Q13 Earnings
Conference Call
Capital Position
$ in billions
RWA = risk-weighted assets
3Q13
2Q13
1Q13
4Q12
3Q12
Shareholders' equity
40.1
$
39.7
$
39.5
$
39.0
$
38.7
$
Tier 1 capital
32.7
32.2
31.8
31.2
30.8
Total risk-based capital
38.9
38.4
38.1
37.8
37.6
Tier 1 common equity ratio
9.3%
9.2%
9.1%
9.0%
9.0%
Tier 1 capital ratio
11.2%
11.1%
11.0%
10.8%
10.9%
Total risk-based capital ratio
13.3%
13.3%
13.2%
13.1%
13.3%
Leverage ratio
9.6%
9.5%
9.3%
9.2%
9.2%
Tangible common equity ratio
7.4%
7.5%
7.4%
7.2%
7.2%
Tangible common equity as a % of RWA
8.9%
8.9%
8.8%
8.6%
8.8%
Basel III
Tier 1 common equity ratio estimated
using final rules for the Basel III
standardized approach released July 2013
8.6%
8.6%
-
-
-
Tier 1 common equity ratio approximated
using proposed rules for the Basel III
standardized approach released June 2012
-
8.3%
8.2%
8.1%
8.2% |
 11
3Q13 Earnings
Conference Call
Mortgage Repurchase
Mortgages Repurchased and Make-whole Payments
Mortgage Representation and Warranties Reserve
$ in millions
3Q13
2Q13
1Q13
4Q12
3Q12
Beginning Reserve
$190
$233
$240
$220
$216
Net Realized Losses
(13)
(16)
(23)
(32)
(32)
Change in Reserve
(1)
(27)
16
52
36
Ending Reserve
$176
$190
$233
$240
$220
Mortgages
repurchased
and make-whole
payments
$42
$41
$79
$57
$58
Repurchase activity lower than
peers due to:
•
Conservative credit and
underwriting culture
•
Disciplined origination process -
primarily conforming
loans
(
95%
sold
to
GSEs)
Do not participate in private
placement securitization market
Outstanding repurchase and
make-whole requests balance
= $114 million |
 12
3Q13 Earnings
Conference Call |
 13
3Q13 Earnings
Conference Call
Appendix |
 14
3Q13 Earnings
Conference Call
Average Loans
Average Loans
Key Points
$ in billions
vs. 3Q12
Average total loans grew by $12.4 billion, or 5.7%
Average total loans, excluding covered loans,
were higher by 7.5%
Average total commercial loans increased $5.9
billion, or 9.4%; average residential mortgage
loans increased $8.2 billion, or 19.9%
vs. 2Q13
Average total loans grew by $4.2 billion, or 1.9%
Average total loans, excluding covered loans,
were higher by 2.2%
Average total commercial loans increased $1.3
billion, or 2.0%; average residential mortgage
loans increased $2.3 billion, or 4.8% |
 15
3Q13 Earnings
Conference Call
Average Deposits
Average Deposits
Key Points
$ in billions
vs. 3Q12
Average total deposits increased by $13.1
billion, or 5.5%
Average low cost deposits (NIB, interest
checking, money market and savings)
increased by $16.0 billion, or 8.5%
vs. 2Q13
Average total deposits increased by $5.0
billion, or 2.0%
Average low cost deposits increased by $2.0
billion, or 1.0% |
 16
3Q13 Earnings
Conference Call
Net Interest Income
Net Interest Income
Key Points
$ in millions
Taxable-equivalent basis
vs. 3Q12
Average earning assets grew by $6.1 billion,
or 2.0%
Net interest margin lower by 16 bps (3.43%
vs. 3.59%) driven by:
•
Lower rates on investment securities and loans
•
Partially offset by lower rates on deposits and a
reduction in higher cost long-term debt
vs. 2Q13
Average earning assets grew by $3.1 billion,
or 1.0%
Net interest margin flat (3.43% vs. 3.43%) |
 17
3Q13 Earnings
Conference Call
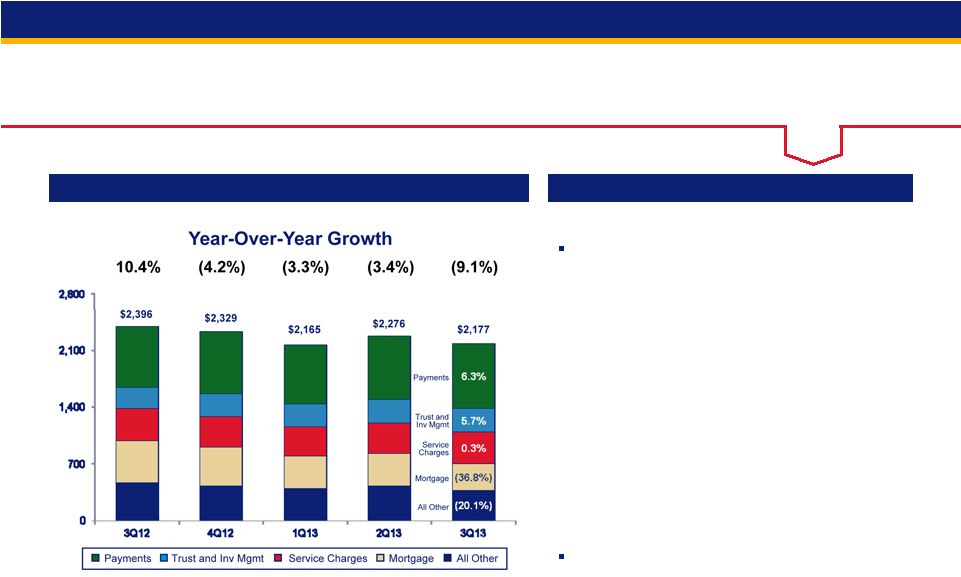
Noninterest Income
Noninterest Income
Key Points
$ in millions
Payments = credit and debit card revenue, corporate payment products revenue and
merchant processing; Service charges = deposit service charges, treasury
management fees and ATM processing services vs. 3Q12
Noninterest income declined by $219 million, or
9.1%, driven by:
•
Mortgage banking revenue decline of $191 million
•
Higher credit and debit card revenue (14.6% increase), due to
higher transaction volumes including the impact of business
expansion, and higher merchant processing (7.5% increase), due
to an increase in product fees and higher volumes
•
Higher trust and investment management fees (5.7% increase),
due to improved market conditions and business expansion, and
higher investment product fees (21.1% increase), due to higher
sales volumes and fees
•
Lower commercial products revenue (8.0% decline), due to lower
standby letters of credit, foreign exchange, bond underwriting and
syndication fees
•
Lower corporate payments revenue (4.5% decline), mainly due to
lower government-related transactions
•
Lower other income, principally the result of a gain on sale of a
credit card portfolio in 3Q12
vs. 2Q13
Noninterest income declined by $99 million, or 4.3%,
driven by:
•
Mortgage banking revenue decline of $68 million
•
Higher deposit service charges (12.5% increase), due to higher
volumes, pricing changes and an increase in account fees
•
Higher corporate payments revenue (9.1% increase), due to
seasonally higher sales volumes
•
Lower other income, mainly due to lower equity investment and
retail lease revenue |
 18
3Q13 Earnings
Conference Call
Noninterest Expense
Noninterest Expense
Key Points
$ in millions
vs. 3Q12
Noninterest expense was lower by $44 million, or
1.7%, driven by:
•
Lower professional services expense (34.7% decline), due to
a reduction in mortgage servicing review-related costs
•
Lower compensation expense (1.9% decline), mainly due to
lower incentive expense
•
Lower marketing and business development expense (11.5%
decline), due to the timing of marketing programs
•
Lower other expense, mainly due to a reduction in litigation-
related expense and lower costs associated with OREO,
partially offset by higher costs related to investments in tax-
advantaged projects
•
Higher employee benefits expense (23.6% increase), mainly
due to higher pension and medical costs
vs. 2Q13
Noninterest expense was higher by $8 million, or
0.3%, driven by:
•
Higher other expense, mainly due to higher costs related to
investments in tax-advantaged projects
•
Lower marketing and business development expense (11.5%
decrease), due to the timing of marketing programs
•
Lower compensation expense (0.9% decline), reflecting a
reduction in commission expense and contract labor costs
3Q12
4Q12
1Q13
2Q13
3Q13
Mortgage servicing matters
-
$
80
$
-
$
-
$
-
$
Total
-
$
80
$
-
$
-
$
-
$
Notable Noninterest Expense Items |
 19
3Q13 Earnings
Conference Call
Credit Quality
-
Commercial Loans
Average Loans and Net Charge-offs Ratios
Key Statistics
Comments
Strong
new
lending
activity
resulted
in
2.2%
linked
quarter
loan
growth
and
10.9%
year-over-year
growth although utilization rates remained at historically low levels
Net charge-offs continued to improve year-over-year and on a linked
quarter basis Nonperforming loans improved year-over-year and were
relatively stable on a linked quarter basis Early stage delinquencies
remained at moderate levels 3Q12
2Q13
3Q13
Average Loans
$56,655
$61,507
$62,856
30-89 Delinquencies
0.29%
0.23%
0.28%
90+ Delinquencies
0.07%
0.10%
0.08%
Nonperforming Loans
0.23%
0.14%
0.16%
$ in millions |
 20
3Q13 Earnings
Conference Call
Credit Quality
-
Commercial Leases
Average Loans and Net Charge-offs Ratios
Key Statistics
Comments
Net charge-offs have shown considerable improvement year-over-year and
on a linked quarter basis, even excluding a large recovery in 3Q13
Nonperforming loans and early stage delinquencies improved year-over-year
and were relatively stable on a linked quarter basis
3Q12
2Q13
3Q13
Average Loans
$5,537
$5,255
$5,208
30-89 Delinquencies
0.93%
0.74%
0.76%
90+ Delinquencies
0.02%
0.00%
0.00%
Nonperforming Loans
0.35%
0.27%
0.23%
$ in millions |
 21
3Q13 Earnings
Conference Call
Credit Quality
-
Commercial Real Estate
Average Loans and Net Charge-offs Ratios
Key Statistics
Comments
Average loans increased 1.6% on a linked quarter basis and 5.1%
year-over-year High levels of commercial real estate recoveries,
reflecting continued improvement in market conditions Nonperforming loans
continued to decline, down from the peak of 5.36% in 1Q10 3Q12
2Q13
3Q13
Average Loans
$36,630
$37,884
$38,501
30-89 Delinquencies
0.18%
0.23%
0.16%
90+ Delinquencies
0.03%
0.03%
0.02%
Nonperforming Loans
1.71%
1.11%
0.92%
Performing TDRs*
$583
$494
$365
$ in millions
* TDR = troubled debt restructuring |
 22
3Q13 Earnings
Conference Call
Credit Quality
-
Residential Mortgage
Average Loans and Net Charge-offs Ratios
Key Statistics
Comments
Strong growth in high quality originations (weighted average FICO 760, weighted
average LTV 68%) as average loans increased 4.8% over 2Q13, driven by demand
for refinancing Over 76% of the balances have been originated since the
beginning of 2009, the origination quality metrics and performance to date
have significantly outperformed prior vintages with similar seasoning Net
charge-offs continue to decline as housing values improve 3Q12
2Q13
3Q13
Average Loans
$40,969
$46,873
$49,139
30-89 Delinquencies
0.93%
0.78%
0.70%
90+ Delinquencies
0.72%
0.53%
0.53%
Nonperforming Loans
1.81%
1.43%
1.46%
$ in millions
**
Excludes
GNMA
loans,
whose
repayments
are
insured
by
the
FHA
or
guaranteed
by
the
Department
of
VA
($1,915
million
3Q13)
*
Excluding
$22
million
related
to
a
regulatory
clarification
in
the
treatment
of
loans
to
borrowers
who
have
exited
bankruptcy
but
continue
to
make
payments
on
their
loans |
 23
3Q13 Earnings
Conference Call
3Q12
2Q13
3Q13
Average Loans
$16,551
$16,416
$16,931
30-89 Delinquencies
1.41%
1.17%
1.25%
90+ Delinquencies
1.18%
1.10%
1.11%
Nonperforming Loans
0.99%
0.65%
0.55%
Credit Quality -
Credit Card
Average Loans and Net Charge-offs Ratios
Key Statistics
Comments
Average loans increased 3.1% on a linked quarter basis
Net charge-offs ratio at lowest level since 4Q07 and delinquencies remain near
historically low levels Nonperforming loans have decreased for several
consecutive quarters $ in millions |
 24
3Q13 Earnings
Conference Call
Credit Quality -
Home Equity
Average Loans and Net Charge-offs Ratios
Key Statistics
Comments
High-quality originations (weighted average FICO on commitments was 765,
weighted average CLTV
69%)
originated
primarily
through
the
retail
branch
network
to
existing
bank
customers
on
their primary residence
Net charge-off ratio declined on a linked quarter basis
3Q12
2Q13
3Q13
Average Loans
$17,329
$15,989
$15,648
30-89 Delinquencies
0.81%
0.74%
0.65%
90+ Delinquencies
0.32%
0.25%
0.25%
Nonperforming Loans
1.05%
1.23%
1.15%
$ in millions
*
Excluding
$26
million
related
to
a
regulatory
clarification
in
the
treatment
of
loans
to
borrowers
who
have
exited
bankruptcy
but
continue
to
make
payments
on
their
loans |
 25
3Q13 Earnings
Conference Call
Credit Quality -
Retail Leasing
Average Loans and Net Charge-offs Ratios
Key Statistics
Comments
Strong year-over-year growth (7.8%) driven by high-quality originations
(weighted average FICO 769) Delinquencies remain relatively stable at very
low levels Strong used auto values continued to contribute to historically
low net charge-offs 3Q12
2Q13
3Q13
Average Loans
$5,256
$5,653
$5,664
30-89 Delinquencies
0.17%
0.14%
0.15%
90+ Delinquencies
0.02%
0.00%
0.02%
Nonperforming Loans
0.02%
0.02%
0.02%
$ in millions
*
Manheim
Used
Vehicle
Value
Index
source:
www.manheimconsulting.com,
January
1995
=
100,
quarter
value
=
average
monthly
ending
value |
 26
3Q13 Earnings
Conference Call
Credit Quality -
Other Retail
Average Loans and Net Charge-offs Ratios
Key Statistics
Comments
Growth in Auto Loans continue to offset declines in Student Lending loan balances
(see slide 27 for auto loan detail)
Delinquencies and nonperforming loans remain relatively stable and at very low
levels 3Q12
2Q13
3Q13
Average Loans
$25,406
$25,224
$25,682
30-89 Delinquencies
0.59%
0.46%
0.48%
90+ Delinquencies
0.16%
0.14%
0.14%
Nonperforming Loans
0.12%
0.11%
0.10%
$ in millions
* Excluding $5 million related to a regulatory clarification in the treatment of
loans to borrowers who have exited bankruptcy but continue to make payments on their loans |
 27
3Q13 Earnings
Conference Call
Credit Quality -
Auto Loans
Average Loans and Net Charge-offs Ratios
Key Statistics
Comments
Continued growth in Auto Loans driven by high-quality originations (Indirect
channel weighted average FICO 756, Direct channel weighted average FICO
747) Low net charge-offs and delinquencies continue as used vehicle
values remain strong 3Q12
2Q13
3Q13
Average Loans
$12,211
$12,575
$12,946
30-89 Delinquencies
0.43%
0.30%
0.30%
90+ Delinquencies
0.06%
0.02%
0.03%
Nonperforming Loans
0.06%
0.02%
0.02%
$ in millions
Auto Loans are included in Other Retail category |
 28
3Q13 Earnings
Conference Call
Non-GAAP Financial Measures
$ in millions
3Q13
2Q13
1Q13
4Q12
3Q12
Total equity
41,552
$
41,050
$
40,847
$
40,267
$
39,825
$
Preferred stock
(4,756)
(4,756)
(4,769)
(4,769)
(4,769)
Noncontrolling interests
(1,420)
(1,367)
(1,316)
(1,269)
(1,164)
Goodwill (net of deferred tax liability)
(8,319)
(8,317)
(8,333)
(8,351)
(8,194)
Intangible assets, other than mortgage servicing rights
(878)
(910)
(963)
(1,006)
(980)
Tangible common equity (a)
26,179
25,700
25,466
24,872
24,718
Tier 1 capital, determined in accordance with prescribed
regulatory requirements using Basel I definition
32,707
32,219
31,774
31,203
30,766
Preferred stock
(4,756)
(4,756)
(4,769)
(4,769)
(4,769)
Noncontrolling interests, less preferred stock not eligible for Tier 1
capital (686)
(685)
(684)
(685)
(685)
Tier 1 common equity using Basel I definition (b)
27,265
26,778
26,321
25,749
25,312
Tangible common equity (as calculated above)
26,179
25,700
Adjustments
1
258
195
Tier 1 common equity estimated using final rules for the
Basel III standardized approach released July 2013 (c)
26,437
25,895
Tangible common equity (as calculated above)
25,700
25,466
24,872
24,718
Adjustments
2
(43)
81
126
157
Tier 1 common equity approximated using proposed rules for the
Basel III standardized approach released June 2012 (d)
25,657
25,547
24,998
24,875
1
Includes net losses on cash flow hedges included in accumulated other comprehensive
income and unrealized losses on securities transferred from available-for-sale
to held-to-maturity included in accumulated other comprehensive
income 2
Includes net losses on cash flow hedges included in accumulated other comprehensive
income, unrealized losses on securities transferred from available-for-sale
to held-to-maturity included in accumulated other comprehensive income and
disallowed mortgage servicing rights |
 29
3Q13 Earnings
Conference Call
Non-GAAP Financial Measures
$ in millions
3Q13
2Q13
1Q13
4Q12
3Q12
Total assets
360,681
$
353,415
$
355,447
$
353,855
$
352,253
$
Goodwill (net of deferred tax liability)
(8,319)
(8,317)
(8,333)
(8,351)
(8,194)
Intangible assets, other than mortgage servicing rights
(878)
(910)
(963)
(1,006)
(980)
Tangible assets (e)
351,484
344,188
346,151
344,498
343,079
Risk-weighted assets, determined in accordance with prescribed
regulatory requirements using Basel I definition (f)
293,155
289,613
Adjustments
3
13,473
12,476
Risk-weighted assets estimated using final rules for the
Basel III standardized approach released July 2013 (g)
306,628
302,089
Risk-weighted assets, determined in accordance with prescribed
regulatory requirements using Basel I definition (f)
289,613
289,672
287,611
282,033
Adjustments
4
20,866
21,021
21,233
22,167
Risk-weighted assets approximated using proposed rules for the
Basel III standardized approach released June 2012 (h)
310,479
310,693
308,844
304,200
Ratios
Tangible common equity to tangible assets (a)/(e)
7.4%
7.5%
7.4%
7.2%
7.2%
Tangible common equity to risk-weighted assets using Basel I definition
(a)/(f) 8.9%
8.9%
8.8%
8.6%
8.8%
Tier 1 common equity to risk-weighted assets using Basel I definition
(b)/(f) 9.3%
9.2%
9.1%
9.0%
9.0%
Tier 1 common equity to risk-weighted assets estimated using final rules
for the Basel III standardized approach released July 2013 (c)/(g)
8.6%
8.6%
-
-
-
Tier 1 common equity to risk-weighted assets approximated using proposed
rules for the Basel III standardized approach released June 2012
(d)/(h)
-
8.3%
8.2%
8.1%
8.2%
3Q13
risk-weighted
assets
are
preliminary
data,
subject
to
change
prior
to
filings
with
applicable
regulatory
agencies
3
Includes higher risk-weighting for unfunded loan commitments, investment
securities and mortgage servicing rights, and other adjustments 4
Includes higher risk-weighting for residential mortgages, unfunded loan
commitments, investment securities and mortgage servicing rights, and other adjustments |
 October 16, 2013
U.S. Bancorp
3Q13 Earnings
Conference Call |