Attached files
| file | filename |
|---|---|
| 8-K - 8-K - OVERSEAS SHIPHOLDING GROUP INC | v355479_8k.htm |

Summary Projections 2013 - 2018

Page 2 DISCLAIMER Statements in this presentation constitute forward looking statements within the meaning of Section 27A of the Securities Act of 1933, as amended, and Section 21E of the Securities Exchange Act of 1934, as amended. All statements other than statements of historical facts sho uld be considered forward looking statements. There are a number of factors, risks and uncertainties, many of which are beyond the control of t he Company, that could cause actual results to differ materially from the expectations expressed or implied in these forward looking statement s, including the Company’s ability to emerge from the cases being jointly administered under the caption In re Overseas Shipholding Group, Inc. et al. , Case No. 12 – 20000 (PJW) in the U.S. Bankruptcy Court for the District of Delaware (the “Chapter 11 Cases”); the Company’s ability to gene r ate cash; the Company’s ability to raise cash through the sale of non - core assets; the success of the Company’s strategic investment decisions ; the success of the Company’s plan to reduce its cost structure; the Company’s ability to attract, retain and motivate key employees; continu ed weakness or worsening of economic conditions; the Company’s ability to streamline its operations and reduce its general and administrativ e e xpenses; the amount of time and attention of the Company’s management spent on the prosecution of the Chapter 11 Cases; potential changes to the Company’s capital structure; the highly cyclical nature of OSG’s industry; fluctuations in the market value of vessels; an in cre ase in the supply of vessels without a commensurate increase in demand; adequacy of OSG’s insurance to cover its losses; constraints on capital av ail ability; acts of piracy on ocean - going vessels; terrorist attacks and international hostilities and instability; changing economic, political and governmental conditions abroad; compliance with environmental laws or regulations, including compliance with regulations concerning discha rge of ballast water and effluents scheduled to become effective in the next few years; seasonal variations in OSG’s revenues; the effect of the C omp any’s indebtedness on its ability to finance operations, pursue, desirable business operations and successfully run its business in th e future; the Company’s ability to generate cash to service its indebtedness; potential costs, penalties and adverse effects associated wit h l itigation and regulatory inquiries, including the ongoing IRS audits, regarding the restatement of the Company’s prior financial statements ; t he Company’s compliance with the Jones Act provisions on coastwise trade and the continuing existence of these provisions and internationa l t rade agreements; the Company’s ability to renew its time charters when they expire or to enter into new time charters for newbuilds ; delays or cost overruns in building new vessels (including delivery of new vessels), the scheduled shipyard maintenance of the Company’s vessels or rebu ild ing or conversion of the Company’s vessels; termination or change in the nature of OSG’s relationship with any of the pools in which it participates; OSG’s ability to compete effectively for charters with companies with greater resources; increased operating costs and capita l e xpenses as the Company’s vessels age; refusal of certain customers to use vessels of a certain age; the failure of contract counterparties t o m eet their obligations; the shipping income of OSG’s foreign subsidiaries becoming subject to current taxation in the United States; the success of t he Company’s programs to remediate the material weakness in internal control over financial reporting; trading risk associated with Forwar d F reight Agreements; unexpected drydock costs; and the arrest of OSG’s vessels by maritime claimants. The Company assumes no obligation to update or revise any forward looking statements. More information about potential factors that could affect our business and financial results is ava ilable in our filings with the SEC such as our Annual Report on Form 10 - K for the year ended December 31, 2012, Quarterly Reports on Form 10 - Q and Cur rent Reports on Form 8 - K, including, where applicable, under the heading “Risk Factors” in such reports.

page 3 US Flag Assumptions Current charter rates are based on existing contracts. Future time charters are based on Wilson Gillette report dated August, 2013 with certain modifications made by the Company. The projections are shown on an unleveraged basis. To the extent the US Flag business incurs debt as part of a reorganization, it would impact the projected cash flows. The projections are pre - tax. Because the US Flag business has a low tax basis, taxes payable on the yearly income may be significant. The option periods on all charters are assumed to be exercised by the chartering party. The ATB fleet currently generates a meaningful portion of the US Flag EBITDA. Due to the age of the ATBs, however, the Company believes that sustaining this fleet at its current size will require significant capital investments over the next 7 years to replace OSG’s 8 ATBs. • The lifespan of the current ATBs could be extended if TCE rates support capital investment into drydocks and ballast water treatment or shortened by competitors building new tankers or ATBs in excess of market demand. The Company’s forecast assumes it will begin a newbuild program to replace its ATBs within the forecast period. To date, the Company has not entered into contracts with any shipyards with respect to a newbuild program nor has the Company determined how it would finance any such construction if it were undertaken. • In the current forecast, the newbuild program is expected to extend beyond the projection period.

page 4 US Flag Assumptions Vessel operating expenses are assumed to escalate at 2.5%/year. Lightering volumes are assumed to be at the contractual minimums throughout the period. The shuttle tankers are assumed to return to the conventional tanker market at the expiry of their current charters, assuming all options are exercised. MSP vessels remain in the program throughout the period. For both vessels, the Company assumes current contracts of affreightment extend throughout the period. Includes additional income from the C ompany’s interest in ATC. Payments for capital expenditures largely relate to Ballast Water Treatment systems. Drydocks follow a regular 5 year cycle with IRPs in mid - cycle. Tankers that are fifteen years of age or older are required to drydock every 2.5 years with no IRPs.

page 5 US Flag Forecast (1) Includes any profit sharing amounts (2) Excludes depreciation, amortization, severance and relocation costs, shipyard contract termination costs, gain/(loss) on disp os al of vessels and vessel impairment charges (in thousands) 2013 2014 2015 2016 2017 2018 TCE revenues 384,575$ 391,194$ 406,490$ 429,553$ 440,211$ 481,695$ Vessel expenses (131,436) (133,830) (138,170) (141,966) (145,335) (147,984) Charter hire expenses (1) (90,766) (90,628) (91,554) (92,372) (94,519) (117,659) Cash flow from vessel operations (2) 161,988$ 166,736$ 176,767$ 195,215$ 200,356$ 216,052$ G&A (24,448) (25,059) (25,686) (26,400) (26,986) (27,661) EBITDA 137,540$ 141,677$ 151,081$ 168,815$ 173,370$ 188,392$ Payments for drydockings (18,284) (42,869) (23,162) (23,594) (23,013) (10,318) Payments for capital expenditure - - (3,152) (12,923) (7,947) (6,110) New construction - (46,983) (52,126) (205,605) (255,479) (171,679) Pre-tax vessel cash flow 119,255$ 51,825$ 72,641$ (73,306)$ (113,069)$ 285$ Average daily TCE rate 45,485$ 46,841$ 48,426$ 50,958$ 52,541$ 56,344$ Average number of owned vessels 14.0 14.0 14.0 14.0 14.0 14.0 Average number of vessels chartered-in under operating leases 10.0 10.0 10.0 10.0 10.0 10.0 Number of revenue days 8,455 8,352 8,394 8,430 8,379 8,549 Number of ship-operating days: Owned vessels 5,110 5,110 5,110 5,124 5,110 5,110 Vessels chartered-in under operating leases 3,650 3,650 3,650 3,660 3,650 3,650
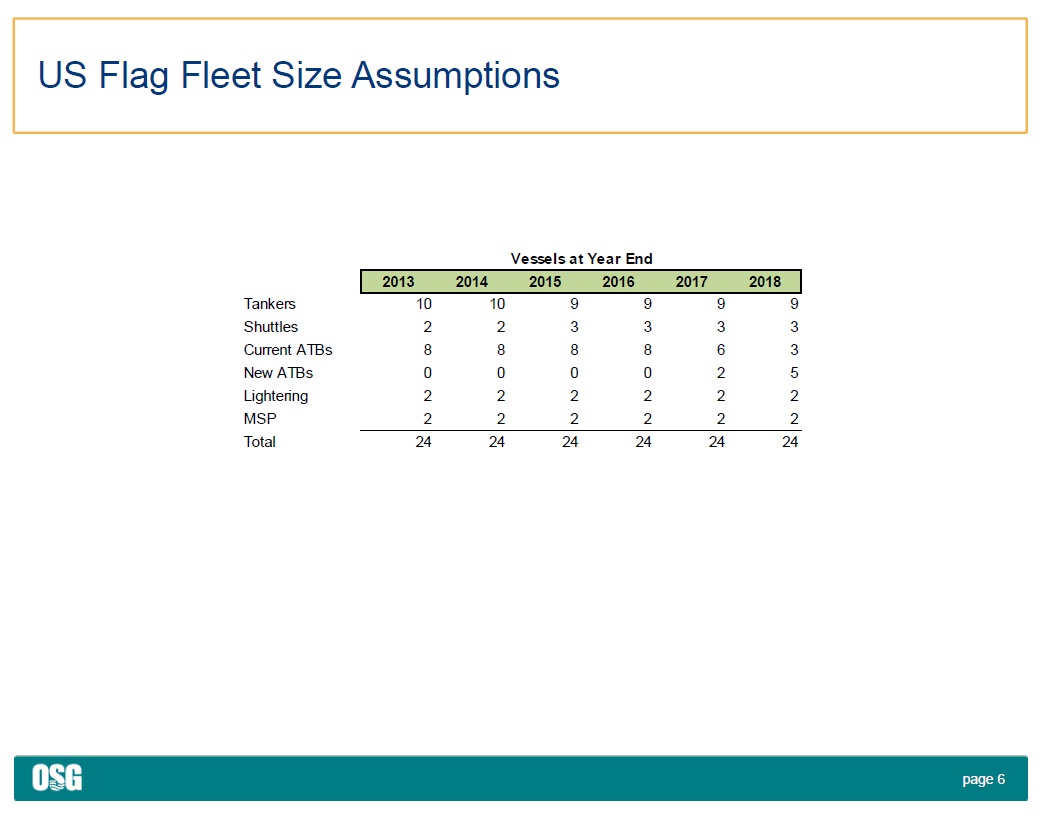
page 6 US Flag Fleet Size Assumptions 2013 2014 2015 2016 2017 2018 Tankers 10 10 9 9 9 9 Shuttles 2 2 3 3 3 3 Current ATBs 8 8 8 8 6 3 New ATBs 0 0 0 0 2 5 Lightering 2 2 2 2 2 2 MSP 2 2 2 2 2 2 Total 24 24 24 24 24 24 Vessels at Year End

page 7 OSG International Assumptions All tankers are assumed to operate in the spot market at rates shown below ($/day). • The rates below are derived from third party analyst forecasts through 2015 and an assumption that by 2018, TCE rates will reach the approximate level required to generate a return on newbuild vessels. OSG International tanker fleet consists of 48 owned vessels. • 11 ULCC/VLCC • 9 Aframax • 9 Panamax • 5 LRs (including one currently under construction) • 14 MRs • Along with 7 long term charter - in vessels and 13 short - term charter - in vessels that expire by 12/31/14 • Of the 48 owned vessels, 15 are currently encumbered by mortgages in the amount of approximately $578 million. The projections assume that the Company will be able to restructure these mortgages and retain ownership of the vessels OSG assumes it will sell 8 of its older vessels opportunistically over the next 18 months but operate nearly all of its remaining owned vessels throughout the forecast period. • The chartered vessels are assumed to be returned at the end of their current charters with the exception of the lightering vessels. 2013 2014 2015 2016 2017 2018 VLCC 13,984$ 19,831$ 25,411$ 31,107$ 36,804$ 42,500$ AFRAMAX 12,675 13,886 16,267 20,011 23,756 27,500 LIGHTERING 13,943 15,274 17,893 22,012 26,131 30,250 PANAMAX 14,520 13,892 14,792 17,361 19,931 22,500 LR1 14,924 15,879 18,105 20,403 22,702 25,000 MR 14,121 15,836 16,759 18,506 20,253 22,000

page 8 OSG International Assumptions The projections are shown on an unleveraged basis. To the extent that the International business incurs debt as part of the reorganization, it would impact the projected cash flows. The projections are on a pre - tax basis and do not include any deductions for tax payments. The projections exclude any results from the LNG and FSO joint ventures Vessel operating expenses escalate at 2.5%/year with a one - time step up of 10% at age 15 years. Capital expenditures largely relate to Ballast Water Treatment systems. The forecast does not include any expenditures to add to or replace the owned tanker fleet. The Company expects, however, that some level of capital expenditures will be required to renew the International fleet. Drydocks follow a regular 5 year cycle with IRPs in mid - cycle up to fifteen years of age, thereafter vessels drydock every 2.5 years with no IRPs.
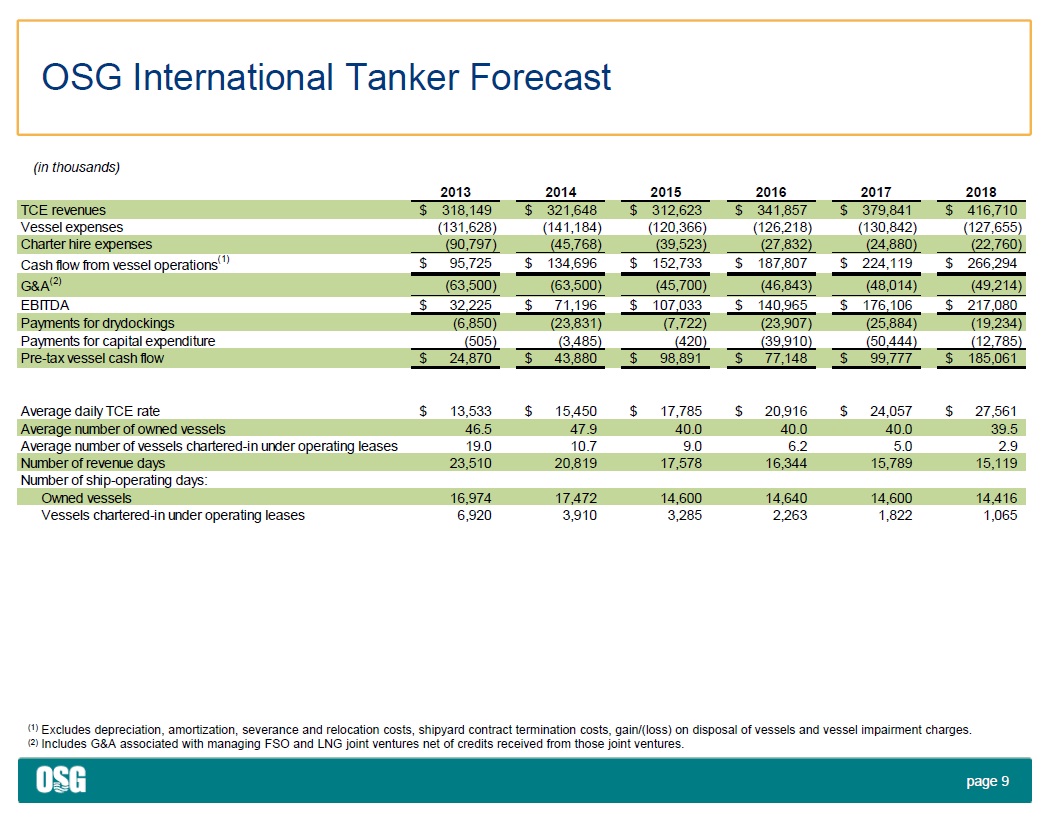
page 9 OSG International Tanker Forecast (1) Excludes depreciation, amortization, severance and relocation costs, shipyard contract termination costs, gain/(loss) on disp os al of vessels and vessel impairment charges. (2) Includes G&A associated with managing FSO and LNG joint ventures net of credits received from those joint ventures. (in thousands) 2013 2014 2015 2016 2017 2018 TCE revenues 318,149$ 321,648$ 312,623$ 341,857$ 379,841$ 416,710$ Vessel expenses (131,628) (141,184) (120,366) (126,218) (130,842) (127,655) Charter hire expenses (90,797) (45,768) (39,523) (27,832) (24,880) (22,760) Cash flow from vessel operations (1) 95,725$ 134,696$ 152,733$ 187,807$ 224,119$ 266,294$ G&A (2) (63,500) (63,500) (45,700) (46,843) (48,014) (49,214) EBITDA 32,225$ 71,196$ 107,033$ 140,965$ 176,106$ 217,080$ Payments for drydockings (6,850) (23,831) (7,722) (23,907) (25,884) (19,234) Payments for capital expenditure (505) (3,485) (420) (39,910) (50,444) (12,785) Pre-tax vessel cash flow 24,870$ 43,880$ 98,891$ 77,148$ 99,777$ 185,061$ Average daily TCE rate 13,533$ 15,450$ 17,785$ 20,916$ 24,057$ 27,561$ Average number of owned vessels 46.5 47.9 40.0 40.0 40.0 39.5 Average number of vessels chartered-in under operating leases 19.0 10.7 9.0 6.2 5.0 2.9 Number of revenue days 23,510 20,819 17,578 16,344 15,789 15,119 Number of ship-operating days: Owned vessels 16,974 17,472 14,600 14,640 14,600 14,416 Vessels chartered-in under operating leases 6,920 3,910 3,285 2,263 1,822 1,065
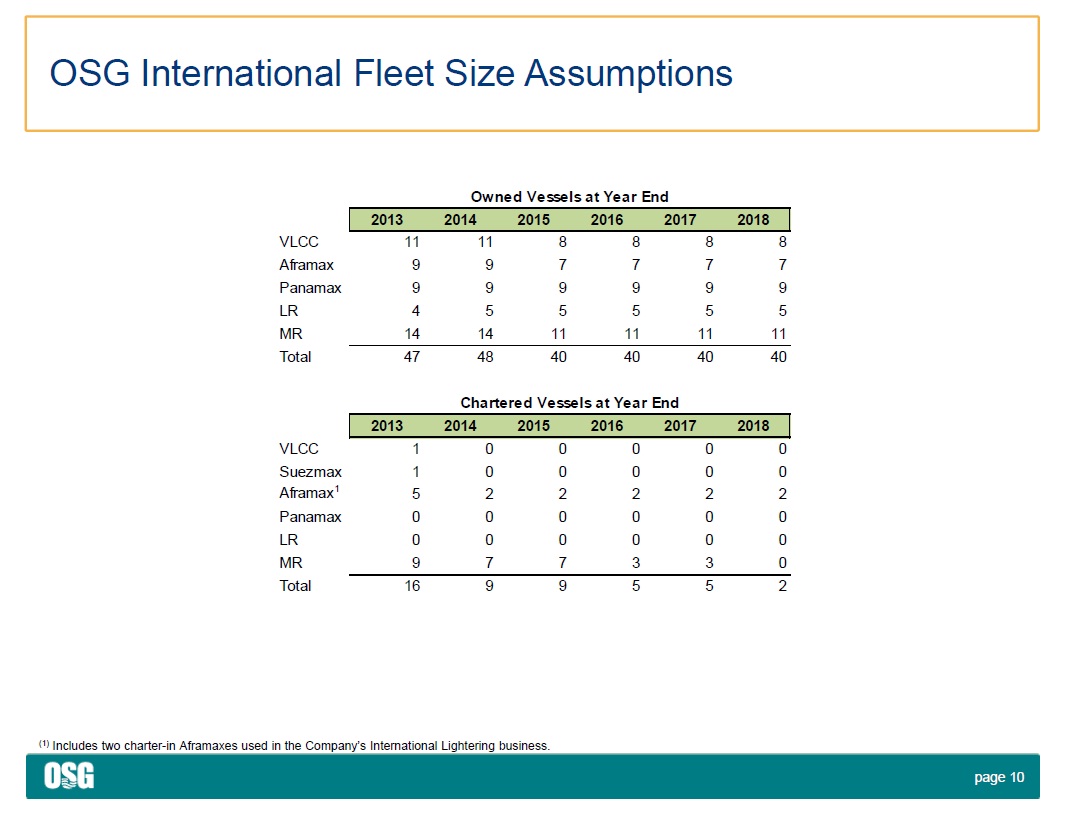
page 10 OSG International Fleet Size Assumptions (1) Includes two charter - in Aframaxes used in the Company’s International Lightering business. 2013 2014 2015 2016 2017 2018 VLCC 11 11 8 8 8 8 Aframax 9 9 7 7 7 7 Panamax 9 9 9 9 9 9 LR 4 5 5 5 5 5 MR 14 14 11 11 11 11 Total 47 48 40 40 40 40 2013 2014 2015 2016 2017 2018 VLCC 1 0 0 0 0 0 Suezmax 1 0 0 0 0 0 Aframax 1 5 2 2 2 2 2 Panamax 0 0 0 0 0 0 LR 0 0 0 0 0 0 MR 9 7 7 3 3 0 Total 16 9 9 5 5 2 Owned Vessels at Year End Chartered Vessels at Year End