Attached files
| file | filename |
|---|---|
| EX-99 - EXHIBIT 99 - Samson Oil & Gas LTD | v355117_ex99.htm |
| EX-32 - EXHIBIT 32 - Samson Oil & Gas LTD | v355117_ex32.htm |
| EX-23.2 - EXHIBIT 23.2 - Samson Oil & Gas LTD | v355117_ex23-2.htm |
| EX-31.1 - EXHIBIT 31.1 - Samson Oil & Gas LTD | v355117_ex31-1.htm |
| EX-23.1 - EXHIBIT 23.1 - Samson Oil & Gas LTD | v355117_ex23-1.htm |
| EX-31.2 - EXHIBIT 31.2 - Samson Oil & Gas LTD | v355117_ex31-2.htm |
UNITED STATES
SECURITIES AND EXCHANGE COMMISSION
Washington, D.C. 20549
FORM 10-K
| x | ANNUAL REPORT PURSUANT TO SECTION 13 OR 15(d) OF THE SECURITIES EXCHANGE ACT OF 1934 |
For the fiscal year ended June 30, 2013
| ¨ | TRANSITION REPORT PURSUANT TO SECTION 13 OR 15(d) OF THE SECURITIES EXCHANGE ACT OF 1934 |
For the transition period from to
Commission file number 001-33578
Samson Oil & Gas Limited
(Exact Name of Registrant as Specified in its Charter)
| Australia | N/A |
| (State or other jurisdiction of incorporation or organization) | (I.R.S. Employer Identification No.) |
| Level 16, AMP Building, | |
| 140 St Georges Terrace | |
| Perth, Western Australia 6000 | |
| (Address of principal executive offices) | (Zip Code) |
+61 8 9220 9830
(Registrant’s telephone number, including area code)
Securities Registered Pursuant to Section 12(b) of the Act:
| American Depositary Shares* | |
| Ordinary Shares** | NYSE MKT |
| Title of Each Class | Name of Exchange on Which Registered |
| * | American Depositary Shares evidenced by American Depository Receipts. Each American Depositary Share represents 20 Ordinary Shares. |
| ** | No par value. Not for trading, but only in connection with the listing of American Depositary Shares. |
Securities Registered Pursuant to Section 12(g) of the Act: None
Indicate by check mark if the registrant is a well-known seasoned issuer, as defined in Rule 405 of the Securities Act. Yes o No x
Indicate by check mark if the registrant is not required to file reports pursuant to Section 13 or Section 15(d) of the Exchange Act. Yes ¨ No x
Indicate by check mark whether the registrant: (1) has filed all reports required to be filed by Section 13 or 15(d) of the Securities Exchange Act of 1934 during the preceding 12 months (or for such shorter period that the registrant was required to file such reports), and (2) has been subject to such filing requirements for the past 90 days. Yes x No ¨
Indicate by check mark whether the registrant has submitted electronically and posted on its corporate Web site, if any, every Interactive Data File required to be submitted and posted pursuant to Rule 405 of Regulation S-T (§ 232.405 of this chapter) during the preceding 12 months (or for such shorter period that the registrant was required to submit and post such files). Yes ¨ No ¨
Indicate by check mark if disclosure of delinquent filers pursuant to Item 405 of Regulation S-K is not contained herein, and will not be contained, to the best of registrant’s knowledge, in definitive proxy or information statements incorporated by reference in Part III of this Form 10-K or any amendment to this Form 10-K. x
Indicate by check mark whether the registrant is a large accelerated filer, an accelerated filer, a non-accelerated filer, or a smaller reporting company. See the definitions of “large accelerated filer,” “accelerated filer” and “smaller reporting company” in Rule 12b-2 of the Exchange Act.
| Large accelerated filer ¨ | Accelerated filer x |
Non-accelerated filer ¨ (Do not check if a smaller reporting company) |
Smaller reporting company ¨ |
Indicate by check mark whether the registrant is a shell company (as defined in Rule 12b-2 of the Exchange Act). Yes ¨ No x
The aggregate market value of the registrant's ordinary shares held by non-affiliates of the registrant on December 31, 2011 was $168.7 million, based on the closing price as reported on the NYSE MKT (treating, for this purpose, all executive officers and directors of the registrant, as affiliates).
There were 2,547,617,329 ordinary shares outstanding as of September 9, 2013.
DOCUMENTS INCORPORATED BY REFERENCE
Part III is incorporated by reference from the registrant’s definitive proxy statement which will be filed no later than 120 days after June 30, 2013.
ANNUAL REPORT ON FORM 10-K
TABLE OF CONTENTS
| i |
Written forward–looking statements may appear in documents filed with the Securities and Exchange Commission (“SEC”), including this annual report, documents incorporated by reference, reports to shareholders and other communications.
The U.S. Private Securities Litigation Reform Act of 1995 provides a “safe harbor” for forward–looking information to encourage companies to provide prospective information about themselves without fear of litigation so long as the information is identified as forward looking and is accompanied by meaningful cautionary statements identifying important factors that could cause actual results to differ materially from those projected in the information. Samson relies on this safe harbor in making forward–looking statements.
Forward–looking statements appear in a number of places in this annual report and include but are not limited to management’s comments regarding business strategy, exploration and development drilling prospects and activities at our North Stockyard, Hawk Springs Roosevelt, State GC Field and Sabretooth properties, oil and gas pipeline availability and capacity, natural gas and oil reserves and production, meeting our capital raising targets, and following any use of proceeds plans, our ability to and methods by which we may raise additional capital, and regarding our production and future operating results.
In this annual report, the use of words such as “anticipate,” “continue,” “estimate,” “estimate,” “expect,” likely,” “may,” “will,” “project,” “should,” “believe” and similar expressions are intended to identify uncertainties. While we believe that the expectations reflected in those forward-looking statements are reasonable, we cannot assure you that these expectations will prove to be correct. Our actual results could differ materially from those anticipated in these forward-looking statements. The differences between actual results and those predicted by the forward-looking statements could be material. Forward-looking statements may relate to, among other things:
| • | our future financial position, including cash flow, debt levels and anticipated liquidity; |
| • | the timing, effects and success of our exploration and development activities; |
| • | uncertainties in the estimation of proved reserves and in the projection of future rates of production; |
| • | timing, amount, and marketability of production; |
| • | third party operational curtailment, processing plant or pipeline capacity constraints beyond our control; |
| • | our ability to acquire and dispose of oil and gas properties at favorable prices; |
| • | our ability to market, develop and produce new properties; |
| • | declines in the values of our properties that may result in write-downs; |
| • | effectiveness of management strategies and decisions; |
| • | oil and natural gas prices and demand; |
| • | unanticipated recovery or production problems, including cratering, explosions, fires; |
| • | the strength and financial resources of our competitors; |
| • | our entrance into transactions in commodity derivative instruments; |
| • | climatic conditions; and |
| • | effectiveness of management strategies and decisions. |
Many of these factors are beyond our ability to control or predict. Neither these factors nor those included in the “Risk Factors” section of this annual report represent a complete list of the factors that may affect us. We do not undertake to update our forward–looking statements.
| 1 |
Bbl. Barrel (of oil or natural gas liquids).
Bbls. Barrels of oil.
BOE. Barrel of oil equivalent.
BOEPD . Barrels of oil equivalent per day.
BOPD. Barrels of oil per day.
Developed acres. The number of acres that are allocated or held by producing wells or wells capable of production.
Development well . A well drilled within the proved area of an oil or gas reservoir to the depth of a stratigraphic horizon known to be productive.
Exploratory well. A well drilled to find and produce oil or gas in an unproved area, to find a new reservoir in a field previously found to be productive of oil or gas in another reservoir, or to extend a known reservoir.
Field. An area consisting of a single reservoir or multiple reservoirs all grouped on or related to the same individual geological structural feature or stratigraphic condition. There may be two or more reservoirs in a field that are separated vertically by intervening impervious, strata, or laterally by local geologic barriers, or by both. Reservoirs that are associated by being in overlapping or adjacent fields may be treated as a single or common operational field. The geological terms structural feature and stratigraphic condition are intended to identify localized geological features as opposed to the broader terms of basins, trends, provinces, plays, areas-of-interest, etc.
Fracture stimulation. The process of initiating and subsequently propagating a fracture in a rock layer, employing the pressure of a fluid as the source of energy in order to increase the extraction rates and ultimate recovery of oil and natural gas.
Gross acres or gross wells. The total acres or wells, as the case may be, in which a working interest is owned.
Mbbls. Thousand barrels of oil.
MMbo. Million barrels of oil.
Mcf. Thousand cubic feet (of natural gas).
Mcfe. Thousand cubic feet equivalent.
MMBtu. One million British Thermal Units, a common energy measurement.
NYMEX. New York Mercantile Exchange.
Productive wells. Producing wells and wells that are capable of production, including injection wells, salt water disposal wells, service wells, and wells that are shut–in.
Proved developed reserves. Those quantities of petroleum, which by analysis of geoscience and engineering data, can be estimated with reasonably certainty to be commercially recoverable, from a given date forward, from known reservoirs and under defined economic conditions, operating methods and government regulations. Samson’s proved developed reserves conform to the definitions approved by the Society of Petroleum Engineers (SPE) and the World Petroleum Congress, except that they are based on price and cost parameters which allow for future changes in current economic conditions.
Proved properties . Properties with proved reserves.
Proved reserves. Estimated quantities of crude oil, natural gas, and natural gas liquids which, upon analysis of geologic and engineering data, can be estimated with reasonable certainty to be recoverable in the future from known oil and gas reservoirs under existing economic and operating conditions. Proved reserves are sub–classified into either proved developed reserves or proved undeveloped reserves.
Proved undeveloped reserves – (PUD). Estimated proved reserves that are expected to be recovered from new wells on undeveloped acreage or from existing wells where a relatively major expenditure is required for recompletion.
| 2 |
Undeveloped acreage. Acreage on which wells have not been drilled or completed to a point that would permit the production of commercial quantities of oil or natural gas, regardless of whether such acreage contains estimated proved reserves.
Working interest. An operating interest that gives the owner the right to drill, produce, and conduct operating activities on the property and a share of production.
| 3 |
| Item 1 and 2. | Business and Properties |
Samson Oil & Gas Limited (“we”, “Samson” or the “Company”) is a company limited by shares, incorporated on April 6, 1979 under the laws of Australia. Our principal business is the exploration and development of oil and natural gas properties in the United States. Currently, we own working interests in several oil and gas properties, three of which are producing and maybe considered material to us (North Stockyard in North Dakota, State GC in New Mexico and Sabretooth in Texas). In each of our three material producing properties, we have entered into operating agreements with third parties under which the oil and gas are produced and sold. We also have working interests in three exploration properties : 60% - 100% working interest in one exploration property (Roosevelt in Montana), 37.5% to 100% in a second property (Hawk Springs in Wyoming) and 25% in South Prairie, in North Dakota. We operate in one reportable segment, the exploration for, and the development and production of, oil and natural gas in the United States.
We engaged Ryder Scott Company L.P. to prepare our proved oil and gas reserve estimates and the future net revenue to be derived from our properties. Ryder Scott is an independent petroleum engineering consulting firm that has provided consulting services throughout the world for over 75 years. Ryder Scott’s estimates were prepared by the use of standard geological and engineering methods generally accepted by the petroleum industry. Reserve volumes and values were determined under the method prescribed by the SEC, which requires the application of the 12-month average price for natural gas and oil calculated as the un-weighted arithmetic average of the first-day-of-the-month price for each month within the 12-month prior period to the end of the reporting period and year-end costs. The proved reserve estimates represent our net revenue interest in our properties. When preparing our reserve estimates, Ryder Scott did not independently verify the accuracy and completeness of information and data furnished by us with respect to property interests, production from such properties, current costs of operation and development, current prices for production agreements relating to current and future operations and sale of production, and various other information and data.
According to a reserve report prepared by Ryder Scott we had proved oil and gas reserves valued at approximately $27,342,631 (before taxes) based on a present value calculation with 10% discounting rate. This present value as of June 30, 2013, utilizes an adjusted realized pricing of $84.54 per Bbl for oil and $5.89 per MCF for natural gas. As of June 30, 2013, 83% of our proved reserves were oil and 33% were proved developed producing.
Our business strategy is to create a competitive and sustainable rate of return to shareholders by exploring for, acquiring and developing oil and natural gas resources in the United States. Our primary financial goal is to profitably develop our oil properties while maintaining a strong balance sheet, and specifically to focus on the exploration, exploitation and development of our two major oil plays – the Permian/Pennsylvanian in our Hawk Springs project in Goshen County, Wyoming and the Bakken in our North Stockyard and Rainbow projects in North Dakota. We are in the process of developing our undeveloped acreage in our North Stockyard project (drilling proved undeveloped locations) and expect to commence drilling in our Rainbow project prior to December 31, 2013. We are currently seeking farm out partners in our Hawk Springs project to explore the Permian/Pennsylvania targets.
We became required to file our periodic reports to the SEC as a U.S. domestic issuer as of July 1, 2011. Since we remain an Australian corporation, however, we are still considered to be a domestic company in Australia as well. As a result, we are required to report our financial results in the U.S. using U.S. Generally Accepted Accounting Principles (“U.S. GAAP”) and in Australia using International Financial Reporting Standards (“IFRS”).
We publish our consolidated financial statements, both U.S. GAAP and IFRS, in U.S. dollars. In this annual report, unless otherwise specified, all dollar amounts are expressed in U.S. dollars, and references to “dollars,” “$” or “US$” are to United States dollars. All references to “A$” are to Australian dollars.
Our registered office is located at Level 16, AMP Building, 140 St Georges Terrace, Perth, Western Australia 6000 and our telephone number at that office is +61 8-9220-9830. Our principal office in the United States is located at 1331 17th Street, Suite 710 Denver, Colorado 80202 and our telephone number at that office is +1 303-295-0344. Our website is www.samsonoilandgas.com.
Preparation of Reserves Estimates
Our fiscal year-end petroleum reserves report was prepared by Ryder Scott based upon its review of the property interests being appraised, production from such properties, current costs of operation and development, current prices for production, agreements relating to current and future operations and sales of production, geoscience and engineering data, and other information we provide to the firm. The information we provided was reviewed by knowledgeable officers, employees and consultants to the Company, including the Chief Executive Officer, in order to ensure accuracy and completeness of the data prior to its submission to Ryder Scott.
Upon analysis and evaluation of data provided, Ryder Scott issues a preliminary appraisal report of our reserves. The preliminary appraisal report and changes in our reserves are reviewed by our consulting reserves engineer and our Chief Executive Officer for completeness of the data presented, reasonableness of the results obtained and compliance with the reserves definitions in Regulation S-X. Once all questions have been addressed, Ryder Scott issues the final appraisal report, reflecting its conclusions.
| 4 |
The practitioner responsible for overseeing the preparation of our reserves report at Ryder Scott has a Bachelor of Mechanical Engineering from Brigham Young University. He is a licensed professional engineer in states of Colorado and Texas. He has over 10 years practical experience in estimation and evaluation of petroleum reserves. Based on his educational background, professional training and more than 30 years’ of practical experience in the estimation and evaluation of petroleum reserves, he has attained the professional qualifications as a Reserves Estimator and Reserves Auditor as set forth in Article III of the “Standards Pertaining to the Estimating and Auditing of Oil and Gas Reserves Information” promulgated by the Society of Petroleum Engineers as of February 19, 2007. He is a member of the Society of Petroleum Engineers and Society of Petroleum Evaluation Engineers.
Internally, the consulting reserves engineer responsible for overseeing the preparation of the Company’s reserves report and working with Ryder Scott on its final report has a Master of Business Administration from the University of Denver, a Bachelor of Mechanical Engineering from the University of Colorado and over 10 years’ experience in reservoir engineering.
The reserve estimates are reported to the Board of Directors, at least annually. Our Board members have experience in reviewing and understanding reserve estimates.
Estimated Proved Reserves
The information set forth below regarding our oil and gas reserves for the fiscal years ended June 30, 2013 and June 30, 2012 was prepared by Ryder Scott Company L.P. A description of our internal controls over reserves estimation is set forth below under “–Preparation of Reserves Estimates.”
Proved oil and gas reserves are the estimated quantities of crude oil, natural gas, and natural gas liquids which geological and engineering data demonstrate with reasonable certainty to be recoverable in future years from known reservoirs under existing economic and operating conditions, i.e., costs as of the date the estimate is made. Prices include consideration of changes in existing prices provided only by contractual arrangements, but not on escalations based upon future conditions. Proved reserves are categorized as either developed or undeveloped.
The following table summarizes certain information concerning our reserves and production in fiscal years ended June 30, 2013 and 2012:
| 2013 | 2012 | |||||||||||||||||||||||
| Oil (MBbls) | Gas (Mcf) | Total (MBOE) | Oil (MBbls) | Gas (Mcf) | Total (MBOE) | |||||||||||||||||||
| Beginning of year | 770 | 1,352 | 996 | 495 | 1,311 | 714 | ||||||||||||||||||
| Revisions of previous quantity estimates | 227 | 27 | 232 | 4 | (168 | ) | (24 | ) | ||||||||||||||||
| Extensions, discoveries and improved recovery | 153 | 198 | 186 | 359 | 423 | 430 | ||||||||||||||||||
| Acquisitions | 364 | 435 | 437 | - | - | - | ||||||||||||||||||
| Production | (62 | ) | (167 | ) | (90 | ) | (88 | ) | (214 | ) | (124 | ) | ||||||||||||
| End of year | 1,452 | 1,845 | 1,760 | 770 | 1,352 | 996 | ||||||||||||||||||
| Proved developed producing reserves | 454 | 784 | 586 | 419 | 927 | 575 | ||||||||||||||||||
| Proved undeveloped reserves | 998 | 1,061 | 1,175 | 351 | 425 | 421 | ||||||||||||||||||
| Total proved reserves | 1,452 | 1,845 | 1,761 | 770 | 1,352 | 996 | ||||||||||||||||||
Proved Developed Producing Reserves
There were no significant changes to our proved developed producing reserves during the year ended June 30, 2012 and June 30, 2013.
Proved Undeveloped Reserves
Proved undeveloped reserves (PUD) are those reserves expected to be recovered from new wells on undeveloped acreage or from existing wells where a relatively major expenditure is required to recomplete an existing well or install production or transportation facilities for primary or improved recovery projects. Estimated future development costs on our PUD locations as of June 30, 2013 are approximately $29.0 million and relate to infill development drilling in our North Stockyard Field and Rainbow Field in North Dakota.
| 5 |
During the year ended June 30, 2013 we acquired additional PUD locations through an acreage swap with our North Stockyard project and our new Rainbow project, also in Williams County, North Dakota. This resulted in an increase of PUD’s of 364 MBbls compared to June 30, 2012.
In June 2013, we commenced drilling one of our PUD locations in our North Stockyard field, Sail and Anchor. This well is currently undergoing fracture stimulation which commenced September 5, 2013.
Subsequent to year end, we commenced drilling the second PUD location in our North Stockyard field, Billabong. Operational difficulties were encountered and this well is currently awaiting a workover operation, which is expected to be conducted following the fracture stimulation of Sail and Anchor.
In August 2013 we divested half our equity position in the undeveloped acreage in the North Stockyard project to Slawson Exploration Company Inc. for $5.562 million in cash. We retained our full interest in in the currently producing wells in the North Stockyard field. As a consequence of the transaction we also terminated our rig contract with Frontier, with no penalty payment. Slawson is now the operator of the project going forward for the development of the undeveloped acreage.
As at June 30, 2013 we have 998,000 barrels of oil recognized as proved undeveloped reserves, and no PUDs that are scheduled for development five years or more beyond the date the reserves were initially recorded.
Production, Prices, Costs and Balance Sheet Information
Production
During the years ended June 30, 2013, 2012 and 2011, we produced 61,640, 87,956 and 64,405 barrels of oil, respectively. During the years ended June 30, 2013, 2012 and 2011, we produced 167,083, 214,463 and 423,077 Mcf of gas, respectively.
For the year ended June 30, 2013 and 2012 we had one Field (as such term is used within the meaning of applicable regulations of the SEC – See Glossary of Technical Terms) that contains more than 15% of our total proved reserves, namely our interests in the North Stockyard Field in North Dakota.
The following table discloses our oil and gas production volume, revenue and expenses from the North Stockyard field for the periods indicated:
| 2013 North Stockyard | ||||
| Oil volume – Bbls | 43,380 | |||
| Revenue – $ | 3,630,221 | |||
| Average Price per barrel – $ | $ | 83.68 | ||
| Gas volume – Mcf | 49,594 | |||
| Revenue – $ | 315,336 | |||
| Average price per Mcf – $ | $ | 6.36 | ||
| Per unit production and lease operation costs per BOE – $* | $ | 28.77 | ||
| 2012 North Stockyard | ||||
| Oil volume – Bbls | 70,350 | |||
| Revenue – $ | 5,688,010 | |||
| Average Price per barrel – $ | 80.85 | |||
| Gas volume – Mcf | 69,710 | |||
| Revenue – $ | 409,150 | |||
| Average price per Mcf – $ | 5.87 | |||
| Per unit production and lease operation costs per BOE – $* | 19.53 | |||
*Excluding depletion, amortization and impairment
| 6 |
| 2011 North Stockyard | ||||
| Oil volume – Bbls | 47,693 | |||
| Revenue – $ | 4,050,067 | |||
| Average Price per barrel – $ | 84.93 | |||
| Gas volume – Mcf | 2,864 | |||
| Revenue – $ | 19,458 | |||
| Average price per Mcf – $ | 6.79 | |||
| Per unit production and lease operation costs per BOE – $* | 15.41 | |||
*Excluding depletion, amortization and impairment
Prices and Costs
The average sale price we achieved for oil during the years ended June 30, 2013, June 30, 2012 and June 30, 2011 was $81.57, $83.59 and $79.28 per barrel, respectively.
The average sale price we achieved for gas during the years ended June 30, 2013, June 30, 2012 and June 30, 2011 was $4.62, $4.76 and $3.59 per Mcf, respectively.
The average production costs (including lease operating expenses, production taxes and handling expenses for oil and gas) per barrel of oil was $38.74 for the year ended June 30, 2013, $22.39 for the year ended June 30, 2012 and $14.15 for the year ended June 30, 2011.
Drilling Activity
| Year Ended June 30 | ||||||||||||
| 2013 | 2012 | 2011 | ||||||||||
| Net productive exploratory wells drilled | Nil | Nil | Nil | |||||||||
| Net dry exploratory wells drilled | 1.0 | 3.0 | Nil | |||||||||
| Net productive development wells drilled | Nil | 0.3 | 1.0 | |||||||||
| Net dry development wells drilled | Nil | Nil | Nil | |||||||||
Our productive development wells are all in our North Stockyard Project and are described below in “Description of Properties – North Stockyard Project”.
Our exploratory wells are all in our Hawk Springs and Roosevelt Projects and are described below in “Description of Properties – Exploration/Undeveloped Properties”
Present Drilling Activity
As of September 1, 2013, we were in the process of drilling 4.0 gross wells (1.0 net wells) (including wells temporarily suspended).
For a discussion of our present development activity, see “Description of Properties—Exploration / Undeveloped Properties” in “Item 1 and 2. Business and Properties” and “Recent Developments”, “2013 Capital Expenditures” and “Estimated 2014 Capital Expenditures” in “Item 7. Management’s Discussion and Analysis of Financial Condition and Results of Operations”.
Oil and Natural Gas Wells and Acreage
As at September 11, 2013:
| Gross productive oil wells | 63 | |||
| Net productive oil wells | 9 | |||
| Gross productive gas wells | 31 | |||
| Net productive gas wells | 7 | |||
| Wells with multiple completions | 0 | |||
| Gross Developed Acres | 13,981 | |||
| Net Developed Acres | 4,664 | |||
| Gross Undeveloped Acres | 136,141 | |||
| Net Undeveloped Acres | 60,603 |
All of our acreage positions are located in the continental United States, with the majority located in Wyoming, North Dakota and Montana. We have extensive leases with a variety of remaining lease terms varying from two to five years. In some cases we have the ability to extend the lease term or drill a well to hold the acreage by production.
| 7 |
Standardized Measure of Discounted Future Net Cash Flows
Future hydrocarbon sales and production and development costs have been estimated using a 12-month average price for the commodity prices for June 30, 2013, June 30, 2012 and June 30, 2011 and costs in effect at the end of the periods indicated. The average 12-month historical average of the first of the month prices used for natural gas for June 30, 2013, June 30, 2012 and June 30, 2011 were $5.89, $5.16 and $4.61 per Mcf, respectively. The 12-month historical average of the first of the month prices used for oil for June 30, 2013, June 30, 2012 and June 30, 2011 were $84.54, $83.93, and $81.04 per barrel of oil, respectively. Future cash flows were reduced by estimated future development, abandonment and production costs based on period–end costs. No deductions were made for general overhead, depletion, depreciation and amortization or any indirect costs. All cash flows are discounted at 10%.
Changes in demand for hydrocarbons, inflation and other factors make such estimates inherently imprecise and subject to substantial revisions. This table should not be construed to be an estimate of current market value of the proved reserves attributable to Samson.
The following table shows the estimated standardized measure of discounted future net cash flows relating to proved reserves (in US$’000’s):
| Fiscal Year Ended June 30 | ||||||||||||
| 2013 | 2012 | 2011 | ||||||||||
| Future cash inflows | $ | 133,589 | $ | 71,655 | $ | 46,250 | ||||||
| Future production costs | (44,672 | ) | (29,321 | ) | (16,046 | ) | ||||||
| Future development costs | (29,012 | ) | (10,198 | ) | (917 | ) | ||||||
| Future income taxes | (12,050 | ) | (5,524 | ) | (4,537 | ) | ||||||
| Future net cashflows | 47,855 | 26,612 | 24,930 | |||||||||
| 10 % discount | (26,012 | ) | (13,274 | ) | (10,207 | ) | ||||||
| Standardized measure of discounted future net cash flows relating to proved reserves | $ | 21,843 | $ | 13,338 | $ | 14,723 | ||||||
During the year ended June 30, 2013 we acquired additional proved undeveloped locations through an acreage swap with our North Stockyard project and our new Rainbow project, also in Williams County, North Dakota. This resulted in an increase of PUD’s of 364 Mbbls.
During the year ended June 30, 2013 we commenced drilling one of the PUD’s in our North Stockyard project, Sail and Anchor and subsequent to year end commenced drilling a second PUD in this project, Billabong.
During the year ended June 30, 2012 we recognized four further proved undeveloped locations which we estimate will require approximately $10.2 million in development costs to convert to proved developed producing wells.
During the year ended June 30, 2011 we drilled and completed three of our North Stockyard wells, which lead to the decrease in future development costs in that year.
The principal sources of changes in the standardized measure of discounted future net cash flows during the periods ended June 30, 2013, June 30, 2012 and June 30, 2011 are as follows (in $’000’s):
| Fiscal Year Ended June 30 | ||||||||||||
| 2013 | 2012 | 2011 | ||||||||||
| Beginning of year | $ | 13,338 | $ | 14,723 | $ | 15,123 | ||||||
| Sales of oil and gas produced during the period, net of production costs | (2,338 | ) | (5,596 | ) | (4,838 | ) | ||||||
| Net changes in prices and production costs | 8,027 | 3,216 | 7,983 | |||||||||
| Previously estimated development costs incurred during the period | - | 917 | 3,713 | |||||||||
| Changes in estimates of future development costs | (18,814 | ) | (10,198 | ) | (5,256 | ) | ||||||
| Extensions, discoveries and improved recovery | 5,892 | 11,354 | - | |||||||||
| Revisions of previous quantity estimates and other | 7,419 | (643 | ) | 5,810 | ||||||||
| Sale of reserves in place | - | - | (6,522 | ) | ||||||||
| Purchase of reserves in place | 11,664 | - | - | |||||||||
| Change in future income taxes | (6,526 | ) | (987 | ) | (2,573 | ) | ||||||
| Accretion of discount | 1,334 | 1,472 | 1,512 | |||||||||
| Other | 1,847 | (920 | ) | (229 | ) | |||||||
| Balance at end of year | $ | 21,843 | $ | 13,338 | $ | 14,723 | ||||||
| 8 |
During the year ended June 30, 2013 we acquired additional proved undeveloped locations through an acreage swap with our North Stockyard project and our new Rainbow project, also in Williams County, North Dakota. This resulted in an increase of PUD’s of 364 Mbbls.
Description of Properties
All well production amounts are total BOPD. Samson’s working interest is included in the total amount.
Developed Properties
North Stockyard Project – Williston Basin, North Dakota
Various working interests
The Bakken Formation gained significant prominence after the United States Geological Survey (USGS) published an estimate in April 2008 stating that the unit could recover between 3.0 and 4.3 billion barrels of oil. The USGS estimated that the Bakken Formation represents a “continuous” oil accumulation and suggested that advances in completion technology have increased the estimated recovery potential by 25 times since an earlier USGS study in 1995.
Together with our fellow working interest owners, we have drilled seven wells in this field, six in the Bakken formation and one in the Mission Canyon formation.
On August 15, 2013, we entered into an agreement to sell half of our equity position in the undeveloped acreage in the North Stockyard project to Slawson Exploration Company, Inc. and another party for $5.562 million in cash and other consideration. While we retained our full interest in the currently producing wells in the North Stockyard field, we agreed to transfer, in addition to the sale of the undeveloped acreage, a 25% interest in the drilled but not yet completed Billabong and Sail and Anchor wells, leaving us with a 25.026% working interest in each of the two wells. The cash portion of the purchase price is subject to the delivery of a useable wellbore in Billabong, valued by the purchase and sale agreement at $0.9 million, and other customary post-closing adjustments. As a result of this transaction, Slawson became the operator of the North Stockyard project going forward.
The Harstad #1-15H (34.5% working interest) well was completed in March 2007 and the well commenced production. The initial production rate of this well was 2,936 BOEPD. During August 2013, this well averaged 40 BOPD. This well is completed in the Mission Canyon Formation which sits stratigraphically above the Bakken Formation.
The Leonard #1-23H (10% working interest, 37.5% after non-consent penalty) is a Mississippian Middle Bakken Formation oil test was drilled with a horizontal lateral in November 2008. The initial production rate on this well was 900 BOEPD. In August 2013, this well averaged a total 36 BOPD.
In February 2010, the Gene #1-22H (30.6% working interest) was successfully drilled to a measured total depth of 17,060 feet, including 5,500 feet of horizontal section drilled within the Middle Bakken Formation. The well underwent fracture stimulation and had an initial production rate of 2,936 BOEPD. In August 2013, this well averaged 63 BOPD. Our drilling costs were $1,830,805.
In May 2010, the Company drilled its third Bakken well in the North Stockyard Field, the Gary #1-24H (37% working interest). This well was successfully fracture stimulated in September 2010 and has commenced production. This well had an initial production rate of 2,780 BOEPD. During August 2013, this well averaged 94 BOPD. Our drilling costs associated with the drilling of this well were $2,297,649.
In July 2010, we successfully drilled our fourth Bakken well in the North Stockyard Field, the Rodney #1-14H (27% working interest). This well underwent fracture stimulation and was put on production in March 2011. This well had an initial production rate of 1,100 BOEPD. In August 2013, this well averaged 70 BOPD. To date the drilling costs incurred are $1,841,823
In September 2010, we successfully drilled our fifth Bakken well in the North Stockyard Field in Williams County, North Dakota, the Earl 1-13H (32% working interest). This well was successfully fracked in April 2011 and commenced production in the same month. This well had an initial production rate of 1,300 BOEPD. In August 2013, the well averaged 17 BOPD. The well was down for 22 days during August 2013 due to a workover and the fracture stimulation of an adjacent well. Our drilling costs were $2,884,409.
In June 2011, we successfully drilled our sixth Mississippian Bakken well in the North Stockyard field in Williams County, North Dakota, the Everett 1-15H (26% working interest). This well underwent fracture stimulation in November 2011. This well had an initial production rate of 1,176 BOEPD. Our drilling costs for this well were $2,411,138. In August 2013, this well averaged 122 BOPD.
| 9 |
Wells in Progress
Billabong 2-13-14HBK (25.026% working interest): The Billabong well was drilled to a total depth of 17,613 feet in August 2013. The lateral remained in the 18 foot target within the middle Bakken zone for its entire length and recorded customary oil and gas shows. However, during the cementing operation, a shut-down of the cement contractor’s pumping equipment resulted in drill pipe being becoming stuck, leaving 1,800 feet of drill pipe cemented in the hole. Fishing operations to retrieve the drill pipe are being planned and expected to occur following the completion of the fracture stimulation and flowback operations at Sail and Anchor.
Sail & Anchor 4-13-14HBK (25.026% working interest): The fracture stimulation of this well commenced September 5, 2013.
At June 30, 2013, the North Stockyard project had net proved reserves of 775,200 Bbls and 918,700 Mcf.
State GC Oil and Gas Field, New Mexico
Average 32.2% Working Interest
The State GC Oil and Gas Field, located in Lea County, New Mexico, was discovered in 1980 and covers approximately 600 acres. The field is operated by Legacy Resources.
The State GC# 1 well was drilled in 1980 and has been productive since that time.
Average daily production during the year ended June 30, 2013 from the State GC Oil and Gas Field was approximately 43 BOPD and 37 Mscf/d.
At June 30, 2013, the State GC Oil and Gas Field had net proved reserves of 62,900 Bbls and 86,200 Mcf.
Davis Bintliff #1 Well (Sabretooth Prospect), Brazoria County, Texas
12.5% Working Interest before payout, 9.375% Working Interest after payout
This well is operated by Davis Holdings. The Davis Bintliff #1 well was completed at the end of October 2008.
During August 2013, this well averaged 38 BOPD and 4.08 MMcf/D.
During the year ended June 30, 2012 we recognized an impairment expense for this well of $347,601.
At June 30, 2013, the Davis Bintliff well had net proved reserves of 400 Bbls and 54,700 Mcf.
Exploration / Undeveloped Properties
Hawk Springs Project, Goshen County, Wyoming
37.5% -100% working interest
Spirit of America US34 #1-29 (Spirit of America I)
100% working interest
During the year ended June 30, 2012 the Spirit of America I well was unsuccessful in reaching the Lower Permian and Pennsylvanian targets due to getting stuck in the Upper Permian Goose Egg Salt section. We expensed $4.9 million in relation to this well as dry hole cost and it was recorded as exploration and evaluation expenditure on the Statement of Operations, which represented 100% of costs incurred to June 30, 2012.
Spirit of America US 34 #2-29 (Spirit of America II)
100% working interest
The Spirit of America I replacement well, Spirit of America II, was drilled to a total depth of 10,634 feet using a conservative drilling approach to penetrate the troublesome salt section along with heavy weight, oil based mud. We planned to fracture stimulate the interpreted net pay intervals in three stages, however, problems with moving the bridge plug during the preparations to pump stage 2 were encountered, with the tubing becoming stuck by frac sand, which required a recovery operation. No further work was completed on this well during the year ended June 30, 2013 and the decision was made to expense the costs associated with this well through the Statement of Operations of $7.3 million. All stages of the well have to be yet completed however it is unlikely that we will recover the costs of drilling through the production of hydrocarbons from the well.
Defender US 33 #2-29H
37.5% working interest
This well commenced production in February 2012. Numerous operational and pumping issues have been associated with this well. This well was cleaned out in July 2012 and resumed pumping. The well is currently pumped on a timer for approximately four hours per day. The well produced a total of 591 barrels of oil during the quarter ended June 30, 2013.
| 10 |
Roosevelt Project, Roosevelt County, Montana
60%-100% Working Interest
Australia II
100% working interest
In December 2011, we drilled Australia II in the Roosevelt Project, our first appraisal (exploratory) well in this project area. This well was drilled to a total measured depth of 14,972 feet with the horizontal lateral remaining within the target zone for the entire lateral length. Oil and gas shows were returned during the drilling of this well and approximately 3,425 barrels of oil were produced. This well is currently shut in, however awaiting mechanical repairs. Although this well may be productive in the future, we do not presently believe that we will be able to recover our costs associated with drilling it. We expensed $13.1 million of previously capitalized exploration expenditure in the Statement of Operations as deferred exploration expenditure written off, which represents 100% of the costs incurred to June 30, 2012.
Gretel II
100% working interest
We drilled our second appraisal (exploratory) well in the Roosevelt Project, Gretel II, in January 2012 and fracture stimulated in March 2012. Based on the results, it appears that this well was drilled on the north side of the Brockton Fault zone, which is believed to be the western edge of the continuous Bakken oil. The Gretel II well is currently shut in, as it was mainly producing water, with just a 5% oil cut. Although this well maybe productive in the future, we do not believe that we will recover our costs associated with drilling it. We expensed $11.6 million of previously capitalized exploration expenditure written to the Statement of Operations as deferred exploration expenditure written off in relation to this well, which represent 100% of the costs incurred to June 30, 2012.
While both wells have delivered a negative result, geological and operational information was gained from these results which we believe has added value to the Roosevelt Project. In total, $24.7 million of previously capitalized exploration expenditure has been expensed to the Statement of Operations as exploration expenditure written off in relation to the drilling costs associated with these two wells. A balance of $7.4 million remains capitalized in relation to the project and relates to the land value of acreage we continue to hold.
In June 2013, we entered into an asset purchase and sale agreement for the sale of the Roosevelt Project for $13.533 million. While we extended the closing date of the agreement to August 31, 2013, the buyer failed to close the transaction. We therefore terminated the agreement and are exploring other alternatives for the property, including development of the conventional portion of the project or the sale of some or all of our interest to another party.
Rainbow Project, Williams County, North Dakota
Mississippian Bakken Formation, Williston Basin
55.6% working interest
During the year ended June 30, 2013, we acquired, in two tranches, a net 1,225 acres in two 1,280 acre drilling units located in the Rainbow Project, Williams County, North Dakota. The Rainbow Project is located in Sections 17, 18, 19 and 20 in T158N R99W.
The acquisition involved an acreage trade by the parties and a future carry of the vendor by us in the initial drilling program on the Rainbow Project. Samson transferred 160 net acres from its 1,200 acre undeveloped acreage holding in North Stockyard and the vendor will fund its share (between 7.5% and 8.5%) of the North Stockyard initial infill program. We have acquired 950 net acres in the Rainbow Project from the vendor for this acreage trade and will provide a $1 million carry (10%) to the vendor, for the first development well to be drilled in the Rainbow Project. We also have the ability, subject to the vendor acquiring additional acres, to acquire a further 274 acres by carrying the vendor for $0.7 million in the second well in the project.
We have assessed the project based on offset well data and understand that the project will support 16 wells, 8 in the middle Bakken and 8 in the first bench of the Three Forks. These wells would be expected to be configured as north-south orientated 10,000 foot horizontals.
In the western drilling unit of the acquired acreage, we hold a 55.6% working interest. In the eastern drilling unit, Samson’s interest will initially be 23% but with the option to increase it to 44% in the second tranche.
Other interest holders owning an interest in the Rainbow Project include Hess, Halcón and Continental.
Subject to financing, we intend to integrate the development of the Rainbow Project with the ongoing infill development of the North Stockyard field, where we have a total 14 infill locations available to be drilled based on the current spacing order.
| 11 |
Other
South Prairie Project, North Dakota
Mississippian Mission Canyon Formation, Williston Basin
25% working interest
We have a 25% working interest in 25,590 net acres, which is located on the eastern flank of the Williston Basin in North Dakota. The target reservoir for the project is the Mississippian Mission Canyon Formation. Seventy-six square miles of 3-D seismic data have been shot and processed. The data has been interpreted and the first prospect was drilled, subsequent to the end of the financial year. The first prospect, named Forfar, commenced drilling operations on July 17, 2013. The Matson #3-1 well was drilled to a depth of 4,825 feet. The joint venture elected to plug and abandon the well based on the logging and show results. The data indicates that oil migrated through the Mission Canyon reservoir, evidenced by black asphaltic dead oil stain, but was not trapped in the targeted 420 acre 4-way structural closure. A possible explanation for this is that the dissolution of the underlying Devonian Prairie Salt, which created the structural closure in the overlying Mission Canyon Formation occurred after oil migrated through the area. Since the structural closure or trap was not in place at the time of oil migration, the oil would have moved updip to the next trap, which is the present day Glenburn Oil Field. The Glenburn Oil Field structural closure is controlled by the Prairie Salt edge whereas the Matson structural closure was created by interior localized salt dissolution pods. Based on the Matson result the forward program will show a preference for structural closures that exist along the salt edge rather than those created by dissolution events further interior to the salt edge. Samson expects that the joint venture will now focus on developing its three structural closure prospects (Pubco, Deering, and one yet to be named) along the Prairie Salt edge in the South Prairie 3-D project.
Risk and Insurance Program
Our operations are subject to all the risks normally incident to the operation and development of oil and natural gas properties and the drilling of oil and natural gas wells, including the risk of well blowouts, oil spills and other adverse events. We could be held responsible for injuries suffered by third parties, contamination, property damage or other losses resulting from these types of events. In addition, we have generally agreed to indemnify our drilling rig contractors against certain of these types of losses. Because of these risks, we maintain insurance against some, but not all, of the potential risks affecting our operations and in coverage amounts and deductible levels that we believe to be economic. Our insurance program is designed to provide us with what we believe to be an economically appropriate level of financial protection from significant unfavorable losses resulting from damages to, or the loss of, physical assets or loss of human life or liability claims of third parties, attributed to certain assets and including such occurrences as well blowouts and resulting oil spills. We regularly review our risks of loss and the cost and availability of insurance and consider the need to revise our insurance program accordingly. Our insurance coverage includes deductibles which must be met prior to recovery. Additionally, our insurance is subject to exclusions and limitations and there is no assurance that such coverage will adequately protect us against liability from all potential consequences and damages.
In general, our current insurance policies covering a blowout or other insurable incident resulting in damage to one of our oil and gas wells provide up to $10 million of well control, pollution cleanup and consequential damages coverage and $11 million of third party liability coverage for additional pollution cleanup and consequential damages, which also covers personal injury and death.
If a well blowout, spill or similar event occurs that is not covered by insurance or not fully protected by insured limits, we would be responsible for the costs, which could have a material adverse impact on our financial condition, results of operations and cash flows.
Marketing, Major Customers and Delivery Commitments
Markets for oil and natural gas are volatile and are subject to wide fluctuations depending on numerous factors beyond our control, including seasonality, economic conditions, foreign imports, political conditions in other energy producing countries, OPEC market actions, and domestic government regulations and policies. Substantially all of our production is sold pursuant to agreements with pricing based on prevailing commodity prices, subject to adjustment for regional differentials and similar factors. We had no material delivery commitments as of September 9, 2013.
Regulatory Environment
Our oil and gas exploration, production, and related operations are subject to numerous and frequently changing federal, state, tribal and local laws and regulations governing the discharge of materials into the environment or otherwise relating to environmental protection. These regulations relate to, among other things, environmental and land-use matters, conservation, safety, pipeline use, drilling and spacing of wells, well stimulation, transportation, and forced pooling and protection of correlative rights among interest owners. Environmental laws and regulations may require the acquisition of certain permits prior to or in connection with our activities and operations. In addition, they may restrict or prohibit the types, quantities, and concentration of substances that can be released into the environment, including releases from drilling and production operations, and restrict or prohibit drilling or other operations that could impact wetlands, endangered or threatened species or other protected areas or natural resources. Following is a summary of some key statutory and regulatory programs that affect our operations.
Regulation of Oil and Gas
Certain regulations may govern the location of wells, the method of drilling and casing wells, the rates of production or “allowables,” the surface use and restoration of properties upon which wells are drilled, and the notification of surface owners and other third parties. Certain laws and regulations may limit the amount of oil and natural gas we can produce from our wells or limit the number of wells or the locations at which we can drill. We also are subject to various laws and regulations pertaining to Native American tribal surface ownership, Native American oil and gas leases and other exploration agreements, fees, taxes, or other burdens, obligations, and issues unique to oil and gas ownership and operations within Native American reservations.
| 12 |
Environmental and Land Use Regulation
A wide variety of environmental and land-use regulations apply to companies engaged in the production and sale of oil and natural gas. These regulations have been changed frequently in the past and, in general, these changes have imposed more stringent requirements that increase operating costs and/or require capital expenditures to remain in compliance. Failure to comply with these requirements can result in civil and/or criminal penalties and liability for non-compliance, clean up costs and other environmental damages. It also is possible that unanticipated developments or changes in the law could require us to make environmental expenditures significantly greater than those we currently expect.
Discharges to Waters. The Federal Water Pollution Control Act of 1972, as amended (the “Clean Water Act”), and comparable state statutes impose restrictions and controls on the discharge of “pollutants,” which include dredge and fill material, produced waters, various oil and natural gas wastes, including drilling fluids, drill cuttings, and other substances. Discharge of such pollutants into wetlands, onshore, coastal and offshore waters without appropriate permits is prohibited. These controls generally have become more stringent over time, and it is possible that additional restrictions will be imposed in the future. Violation of the Clean Water Act and similar state regulatory programs can result in civil, criminal and administrative penalties for the unauthorized discharges of pollutants. They also can impose substantial liability for the costs of removal or remediation associated with discharges of pollutants.
The Clean Water Act also regulates stormwater discharges from industrial properties and construction sites, and requires separate permits and the implementation of a Stormwater Pollution Prevention Plan (“SWPPP”), best management practices, training, and periodic monitoring of covered activities. Certain operations also are required to develop and implement Spill Prevention, Control, and Countermeasure (“SPCC”) plans, and in some circumstances, facility response plans to address potential oil spills. Certain exemptions from some Clean Water Act requirements were created or broadened pursuant to the Energy Policy Act of 2005.
Safe Drinking Water Act – Regulation of Hydraulic Fracturing. The federal Safe Drinking Water Act, or the SDWA, is the main federal law that authorizes the United States Environmental Protection Agency (“EPA”) to set standards for drinking water quality and oversee the states, localities, and water suppliers who implement those standards. The Underground Injection Control (UIC) Program under the SDWA is responsible for regulating the construction, operation, permitting, and closure of injection wells that place fluids underground. The SDWA currently excludes hydraulic fracturing from the definition of “underground injection.” Hydraulic fracturing is a process that creates a fracture extending from a well bore into a low-permeability rock formation to enable oil or natural gas to move more easily to a production well. Hydraulic fractures typically are created through the injection of water, sand and chemicals into the rock formation. The United States Congress has considered, and may in the future consider, legislation such as the proposed Fracturing Responsibility and Awareness of Chemicals Act, or the FRAC Act, to amend the SDWA to repeal this exemption. However, Congress has not taken any significant action on such legislation. If enacted, the FRAC Act would amend the definition of “underground injection” in the SDWA to encompass hydraulic fracturing activities. Such a provision could require hydraulic fracturing operations to meet permitting and financial assurance requirements, adhere to certain construction specifications, fulfill monitoring, reporting, and recordkeeping obligations, including disclosure of chemicals used in the fracturing process, and meet plugging and abandonment requirements. The FRAC Act’s proposal to require the reporting and public disclosure of chemicals used in the fracturing process could make it easier for third parties opposing the hydraulic fracturing process to initiate legal proceedings based on allegations that specific chemicals used in the fracturing process could adversely affect groundwater. It is not possible to predict whether the current or a future session of Congress may act further on hydraulic fracturing legislation. Such legislation, if adopted, could establish additional regulation and permitting requirements at the federal level. In addition, in March 2010, at the request of the U.S. Congress, EPA announced its intention to conduct a comprehensive research study on the potential adverse impacts that hydraulic fracturing may have on drinking water resources. A progress report was released in December 2012. A final draft report is expected to be released for public comment and peer review in 2014.
Hydraulic fracturing currently is regulated primarily at the state level. Wyoming, Montana, North Dakota, Texas, and New Mexico recently enacted rules to regulate hydraulic fracturing. These regulations require companies to disclose the chemicals used in hydraulic fracturing operations, as well as the concentrations of those chemicals, on a well-by-well basis, either prior to or following well completion, depending on which state’s regulations apply.
Air Emissions. Our operations are subject to local, state and federal regulations governing emissions of air pollutants. Major sources of air pollutants are subject to more stringent, federally based permitting requirements. Producing wells, natural gas plants and electric generating facilities all generate volatile organic compounds (“VOCs”) and nitrous oxides. Administrative enforcement actions for failure to comply strictly with air pollution regulations or permits generally are resolved by payment of monetary fines and correction of any identified deficiencies. Alternatively, regulatory agencies could require us to forego construction, modification or operation of certain air-emission sources.
In April 2012, EPA issued regulations specifically applicable to the oil and gas industry that will require operators to capture 95 percent of the VOC emissions from natural gas wells that are hydraulically fractured. The reduction in VOC emissions will be accomplished primarily through the use of “reduced emissions completion” or “green completion” to capture natural gas that would otherwise escape into the air. EPA also issued regulations that set requirements for VOC emissions from several types of equipment, including storage tanks, compressors, dehydrators, and valves and sweetening units at gas processing plants. The adoption of these regulations, or the adoption of any other laws or regulations restricting or reducing these emissions, will increase our operating costs.
| 13 |
Another regulatory development that could impact our operations is the notice of finding and determination by EPA that emissions of carbon dioxide, methane and other greenhouse gases (“GHGs”) present an endangerment to human health and the environment, which allows EPA to begin regulating GHG emissions under existing provisions of the federal Clean Air Act. EPA has begun to implement GHG-related reporting and permitting rules. Similarly, the U.S. Congress has considered, and may in the future consider, “cap and trade” legislation that would establish an economy-wide cap on emissions of GHGs in the United States and require most sources of GHG emissions to obtain GHG emission “allowances” corresponding to their annual GHG emissions. Any laws or regulations that may be adopted to restrict or reduce emissions of GHGs would likely require us to incur increased operating costs and could have an adverse effect on demand for our production.
| 14 |
Waste Disposal. We currently own or lease a number of properties that have been used for production of oil and natural gas for many years. Although we believe the prior owners and/or operators of those properties generally utilized operating and disposal practices that met applicable standards in the industry at the time, hydrocarbons or other wastes may have been disposed of or released on or under the properties we currently own or lease. State and federal laws applicable to oil and natural gas wastes have become more stringent over time. Under new and existing laws, we could be required to remediate property, including groundwater, containing or impacted by previously disposed wastes (including wastes disposed of or released by prior owners or operators) or to perform remedial well-plugging operations to prevent future, or mitigate existing, contamination.
We may generate wastes, including “solid” wastes and “hazardous” wastes that are subject to the federal Resource Conservation and Recovery Act, as amended (“RCRA”), and comparable state statutes, although certain oil and natural gas exploration and production wastes currently are excluded from regulation as hazardous wastes under RCRA. The EPA has limited the disposal options for certain wastes that are designated as hazardous wastes under RCRA. Furthermore, it is possible that certain wastes generated by our oil and natural gas operations that currently are excluded from regulation as hazardous wastes may in the future be designated as hazardous wastes, and may therefore become subject to more rigorous and costly management, disposal and clean up requirements. State and federal oil and natural gas regulations also provide guidelines for the storage and disposal of solid wastes resulting from the production of oil and natural gas, both onshore and offshore.
Superfund. Under the Comprehensive Environmental Response, Compensation, and Liability Act of 1980, as amended, also known as CERCLA or the Superfund law, and similar state laws, responsibility for the entire cost cleaning up a contaminated site, as well as natural resource damages, can be imposed upon current or former site owners or operators and any party who released one or more designated “hazardous substances” at the site, regardless of whether the original activities that led to the contamination were lawful at the time of disposal. CERCLA also authorizes EPA and, in some cases, third parties to take actions in response to releases of hazardous substances into the environment and to seek to recover from the potentially responsible parties the costs of such response actions. Although CERCLA generally excludes petroleum from the definition of hazardous substances, in the course of our operations we may have generated and may generate wastes that fall within CERCLA’s definition of hazardous substances. We also may be an owner or operator of facilities at which hazardous substances have been released by previous owners or operators. We may be subject to joint and several liability as well as strict liability under CERCLA for all or part of the costs of cleaning up facilities at which such substances have been released and for natural resource damages. Strict liability means liability without fault, and in some situations we could be exposed to liability for clean up costs and other damages as a result of conduct that was lawful at the time it occurred or for the conduct of third parties at, or prior operators of, properties we have acquired, including, in some circumstances, operators of properties in which we have an interest and parties that provide transportation services for us. If exposed to joint and several liability, we could be responsible for more than our share of costs for remediating a particular site, and potentially for the entire obligation, even where other parties were involved in the activity giving rise to the liability. We have not, to our knowledge, been identified as a potentially responsible party under CERCLA, nor are we aware of any prior owners or operators of our properties that have been so identified with respect to their ownership or operation of those properties.
Potentially Material Costs Associated with Environmental Regulation of Our Oil and Natural Gas Operations
Significant potential costs relating to environmental and land-use regulations associated with our existing properties and operations include those relating to: (i) plugging and abandonment of facilities; (ii) clean up costs and damages due to spills or other releases; and (iii) penalties imposed for spills, releases or non-compliance with applicable laws and regulations. As is customary in the oil and natural gas industry, we typically have contractually assumed, and may assume in the future, obligations relating to plugging and abandonment, clean up and other environmental costs in connection with our acquisition of operating interests in fields, and these costs can be significant.
Plugging and Abandonment Costs
Our operations are subject to stringent abandonment and closure requirements imposed by the various regulatory bodies including the BLM and state agencies.
As described in Note 6 to our financial statements, we have estimated the present value of our aggregate asset retirement obligations to be $868,589 as of June 30, 2013. This figure reflects the expected future costs associated with site reclamation, facilities dismantlement and plugging and abandonment of wells. The discount rates used to calculate the present value varied depending on the estimated timing of the obligation, but typically ranged between 4% and 9%. Actual costs may differ from our estimates. Our financial statements do not reflect any liabilities relating to other environmental obligations.
| 15 |
Executive Officers
The following table sets forth certain information with respect to our executive officers as of June 30, 2013.
| Name | Age | Position | ||
| Terence Barr | 64 | Chief Executive Officer | ||
| Robyn Lamont | 35 | Chief Financial Officer | ||
| David Ninke | 42 | Vice President – Exploration | ||
| Daniel Gralla | 52 | Vice President – Engineering | ||
| Denis Rakich | 59 | Secretary |
Terence Barr. Mr. Barr was appointed President, Chief Executive Officer, and Managing Director of Samson on January 25, 2005. Mr. Barr is a petroleum geologist with over 30 years of experience, including 11 years with Santos. In recent years, Mr. Barr has specialized in tight gas exploration, drilling and completion. Prior to joining Samson, Mr. Barr was employed as Managing Director by Ausam Resources from 1999 to 2003 and was the owner of Barco Exploration from 2003 to 2005.
Robyn Lamont. Ms. Lamont has served as Samson’s Chief Financial Officer since May 1, 2006, prior to which she served as its Financial Controller since 2002. Ms. Lamont graduated from the University of Western Australia in 1999 with a Bachelor of Commerce, majoring in Accounting and Finance. She worked for Arthur Andersen in Perth, Western Australia, for three years and qualified as a Chartered Accountant through the Institute of Chartered Accountants in Australia in 2001.
David Ninke. Mr. Ninke was appointed Vice President, Exploration of Samson effective April 1, 2008. Mr. Ninke brings 17 years of geological and geophysical exploration experience in the Texas and Louisiana Gulf Coast, the Permian Basin, the Rockies, and the North Slope of Alaska. From May 2002 to April 2008, Mr. Ninke served as a Sr. Geologist/Geophysicist with Aspect Energy, LLC in Denver, Colorado, prior to which he worked with BP in Anchorage, Alaska and Killam Oil Co, Ltd. in San Antonio, Texas. Mr. Ninke holds Bachelor’s and Master’s degrees in Geology from Wittenberg University and Bowling Green State University, respectively.
Daniel Gralla. Mr. Gralla was appointed Vice President of Engineering of Samson effective January 1, 2011. Previously, he served as the Vice President – Technical for ERHC Energy, Inc. and its subsidiaries. Mr. Gralla has also served as an Engineering Consultant, focusing on classical reservoir engineering, field development, acquisitions and reservoir simulation, both domestically and internationally for Kerr-McGee, ARCO, Aspect Energy, Venoco and ConocoPhillips. Mr. Gralla has approximately 27 years of oil and gas experience in the U.S. and internationally, including Europe, South and West Africa and South America. He holds a Bachelor of Science in Petroleum Engineering from the Colorado School of Mines.
Denis Rakich F.C.P.A. Mr. Rakich is an Australian certified public accountant and has been employed as Samson’s Secretary since June 18, 1998. He has served as a corporate secretary for 20 years within the petroleum services, petroleum and mineral production and exploration industries, and currently serves as corporate secretary for Acap Resources, a company listed on the ASX and Fortune Minerals Limited, a public unlisted company. He is a member of the Australian Society of Accountants.
Competition
The oil and natural gas business is highly competitive in the search for and acquisition of additional reserves and in the sale of oil and natural gas. Our competitors principally consist of major and intermediate sized integrated oil and natural gas companies, independent oil and natural gas companies and individual producers and operators. The principal competitive factors in the acquisition of undeveloped oil and gas leases include the availability and quality of staff and data necessary to identify, investigate and purchase such leases, and the financial resources necessary to acquire and develop such leases. Many of our competitors have substantially greater financial resources, and more fully developed staffs and facilities than ours. In addition, the producing, processing and marketing of natural gas and crude oil are affected by a number of factors that are beyond our control, the effect of which cannot be accurately predicted. See “Item 1A. Risk Factors.” Ultimately, our future success will depend on our ability to develop or acquire additional reserves at costs that allow us to remain competitive.
Employees
For the fiscal year ended June 30, 2013, we had 12 employees, including 2 part time employees. The 2 part time employees are located in Perth, Western Australia and are involved in facilitating the administration of the Company. The remaining 10 employees are located in Denver, Colorado.
Available Information
We are subject to the informational requirements of the Securities Exchange Act of 1934 (the “Exchange Act”). We therefore file periodic reports, proxy statements and other information with the Securities and Exchange Commission (the “SEC”). Such reports may be obtained by visiting the Public Reference Room of the SEC at 100 F Street, NE, Washington, D.C. 20549, or by calling the SEC at 800-SEC-0330. In addition, the SEC maintains an internet site (www.sec.gov) that contains reports, proxy and information statements and other information.
| 16 |
Financial and other information can also be accessed on the investor section of our website at www.samsonoilandgas.com. We make available, free of charge, copies of our annual report on Form 10-K, quarterly reports on Form 10-Q, current reports on Form 8-K, and amendments to those reports filed or furnished pursuant to Section 13(a) or 15(d) of the Exchange Act as soon as reasonably practicable after filing such material electronically or otherwise furnishing it to the SEC. Information on our website is not incorporated into this Form 10-K or our other securities filings and is not a part of them.
| Item 1A. | Risk Factors |
Our business, operating or financial condition could be harmed due to any of the following risk factors. Accordingly, investors should carefully consider these risks in making a decision as to whether to purchase, sell or hold our securities. In addition, investors should note that the risks described below are not the only risks facing the Company. Additional risks not presently known to us, or risks that do not seem significant today, may also impair our business operations in the future. When determining whether to invest in our securities, you should also refer to the other information contained in this Annual Report on Form 10-K, including our consolidated financial statements and the related notes, and in our other filings with the SEC. The rights of our shareholders may differ from the rights typically offered to shareholders of a company incorporated in the United States.
Risks Related To Our Business, Operations and Industry
We depend on successful exploration, development and acquisitions to maintain reserves and revenue in the future.
In general, the volume of production from natural gas and oil properties declines as reserves are depleted, with the rate of decline depending on reservoir characteristics. Our future oil and natural gas production is highly dependent upon our level of success in finding or acquiring additional reserves that are economically feasible and in developing existing proved reserves. To the extent that cash flow from operations is reduced and external sources of capital become limited or unavailable, our ability to make the necessary capital investment to maintain or expand our asset base of natural gas and oil reserves would be impaired.
We recorded an impairment on the carrying value of our oil and gas assets during the fiscal year ended June 30, 2013, and may again in the future record additional impairments.
We recognized an impairment expense for the twelve months ended June 30, 2013 of $259,529, primarily in relation to wells at our Roosevelt project –Abercrombie and Riva Ridge and Defender in our Hawk Springs project. Subsequent adverse changes in oil and gas prices or drilling results may result in us being unable to recover the carrying value of our long-lived assets, and make it appropriate to recognize more impairments in future periods. Such impairments could materially and adversely affect our results of operations.
Inadequate liquidity could materially and adversely affect our business operations.
Our exploration efforts could be sufficiently unsuccessful that it may become more difficult for us to adequately access the capital markets or obtain financing. Our efforts to improve our liquidity position would then be challenging. Various factors may require us to have greater liquidity and capital resources than we currently anticipate needing or could prevent us from attaining our targeted levels of liquidity and capital resources.
Emerging plays, such as our Hawk Springs and Roosevelt Projects, are subject to heightened risks.
Part of our strategy through the year ended June 30, 2013 was to pursue acquisition, exploration and development activities in emerging plays such as our Hawk Springs Project and Roosevelt Project. Our drilling results in these areas are more uncertain than drilling results in areas that are developed and producing. Because emerging plays have limited or no production history, we have access to little if any past drilling results in those areas to help predict the results of our own exploratory drilling. In addition, part of our strategy to maximize recoveries from such new projects may involve the drilling of horizontal wells and/or using completion techniques that have proven to be successful in other similar formations. Both of the two Roosevelt project wells drilled in the fiscal year 2012 failed to deliver positive results, and $24.7 million of previously capitalized exploration expenditure was written off as exploration expenditure. In addition, one well in the Hawk Springs project well was drilled unsuccessfully, and $4.9 million in expenditure in relation to this well was written off as dry hole costs. During the year ended June 30, 2013, $7.3 million was expensed following our Spirit of America II well being non-productive.
Reserve estimates are imprecise and subject to revision.
Estimates of oil and natural gas reserves are projections based on available geologic, geophysical, production and engineering data. There are uncertainties inherent in the manner of producing, and the interpretation of, this data as well as in the projection of future rates of production and the timing of development expenditures. Estimates of economically recoverable oil and natural gas reserves and future net cash flows necessarily depend upon a number of factors including:
| 17 |
| · | the quality and quantity of available data; |
| · | the interpretation of that data; |
| · | the ability of Samson to access the capital required to develop proved undeveloped locations; |
| · | the accuracy of various mandated economic assumptions; and |
| · | the judgment of the engineers preparing the estimate. |
Actual future production, natural gas and oil prices, revenues, taxes, development expenditures, operating expenses and quantities of recoverable natural gas and oil reserves will likely vary from our estimates. Any significant variance could materially affect the quantities and value of our reserves. Our reserves may also be susceptible to drainage by operators on adjacent properties. We are required to adjust our estimates of proved reserves to reflect production history, results of exploration and development and prevailing gas and oil prices. These reserve reports are necessarily imprecise and may significantly vary depending on the judgment of the reservoir engineering consulting firm.
Investors should not construe the present value of future net cash flows as the current market value of the estimated oil and natural gas reserves attributable to our properties. The estimated discounted future net cash flows from proved reserves are based on prices and costs as of the date of the estimate, in accordance with applicable regulations, even though actual future prices and costs may be materially higher or lower. Factors that will affect actual future net cash flows include:
| · | the amount and timing of actual production; |
| · | the price for which that oil and gas production can be sold; |
| · | supply and demand for oil and natural gas; |
| · | curtailments or increases in consumption by natural gas and oil purchasers; and |
| · | changes in government regulations or taxation. |
As a result of these and other factors, we will be required to periodically reassess the amount of our reserves, which reassessment may require us to recognize a write–down of our oil and gas properties, as occurred at June 30, 2010 and June 30, 2012.
We operate only a small percentage of our proved properties, and for those properties we do operate, there is no guarantee we will be successful operators.
The business activities at all of our material producing properties are conducted through joint operating agreements under which we own partial non–operating interests in the properties. As a result, we do not have control over normal operating procedures, expenditures, or future development of those properties, including our interests in North Stockyard and State GC properties. Consequently, the operating results with respect to those properties are beyond our control. The failure of an operator of our wells to perform operations adequately, or an operator’s breach of the applicable agreements, could reduce our production and revenues. In addition, the success and timing of our drilling and development activities on properties operated by others depends upon a number of factors outside of our control, including the operator’s timing and amount of capital expenditures, expertise and financial resources, the participation of other owners in drilling wells, and the appropriate use of technology. Since we do not have a majority interest in most of these properties, we may not be in a position to remove the operator in the event of poor performance. Further, significant cost overruns of an operation in any one of these projects may require us to increase our capital expenditure budget and could result in some wells becoming uneconomic.
We are the operators of the Rainbow, Hawk Springs and Roosevelt Projects. Although we are not subject to the risks of depending on third-party operators, there is a risk that we will not be able to operate these properties successfully ourselves.
Unless reserves are replaced as they are produced, our reserves and production will decline, which would adversely affect our future business, financial condition and results of operations.
Producing oil and reservoirs are generally characterized by declining production rates that vary depending upon reservoir characteristics and other factors. The rate of decline will change if production from existing wells declines in a different manner than we estimated. The rate can change due to other circumstances as well. Our future reserves and production and, therefore, our cash flows and income, are highly dependent on our ability to efficiently develop and exploit our current reserves and to economically find or acquire additional recoverable reserves. We may not be able to develop, discover or acquire additional reserves to replace our current and future production at acceptable costs. Our failure to do so would adversely affect our future operations, financial condition and results of operations.
| 18 |
Our development and exploration operations require substantial capital, and we may be unable to obtain needed capital or financing on satisfactory terms, which could lead to a loss of properties and a decline in our production, profitability and reserves.
Our industry is capital intensive. We expect to continue to make substantial capital expenditures in our business and operations for the exploration, development, production and acquisition of crude oil and natural gas reserves. To date, we have financed capital expenditures primarily with cash generated by operations, capital markets transactions and the sale of properties. We intend to finance our future capital expenditures utilizing similar financing sources. Our cash flows from operations and access to capital are subject to a number of variables, including:
| · | our proved reserves; |
| · | the amount of crude oil and natural gas we are able to produce from existing wells; |
| · | our ability to acquire, locate and produce new reserves; |
| · | the prices at which crude oil and natural gas are sold; and |
| · | the costs to produce crude oil and natural gas. |
If our revenues or the borrowing base under our revolving credit facility decreases as a result of lower commodity prices, operating difficulties or for any other reason, our need for capital from other sources would increase. If we raise funds by issuing additional equity securities, this would have a dilutive effect on existing shareholders. If we raise funds through the incurrence of debt, the risks we face with respect to our indebtedness would increase and we would incur additional interest expense. There can be no assurance as to the availability or terms of any additional financing. Our inability to obtain additional financing, or sufficient financing on favorable terms, would adversely affect our financial condition and profitability. We intend to fund a portion of our 2014 capital expenditures with proceeds from our sale of North Stockyard properties to Slawson.
Petroleum exploration, drilling and development involve substantial business risks.
The business of exploring for and developing oil and gas properties involves a high degree of business and financial risk, and thus a substantial risk of investment loss that even a combination of experience, knowledge and careful evaluation may not be able to overcome. In addition, oil and gas drilling and production activities may be shortened, delayed or canceled as a result of a variety of factors, many of which are beyond our control. These factors include:
| · | unexpected drilling conditions; |
| · | Unexpected geological formations including abnormal pressure or irregularities in formations; |
| · | equipment failures or accidents; |
| · | adverse changes in prices; |
| · | weather conditions; |
| · | ability to fund capital necessary to develop exploration properties and producing properties; |
| · | shortages in experienced labor; and |
| · | shortages or delays in the delivery of equipment, including equipment needed for drilling, fracture stimulating and completing wells. |
Acquisition and completion decisions generally are based on subjective judgments and assumptions that are speculative. It is impossible to predict with certainty the production potential of a particular property or well. Furthermore, the successful completion of a well does not ensure a profitable return on the investment. A variety of geological, operational, or market–related factors, including, but not limited to, unusual or unexpected geological formations, pressures, equipment failures or accidents, fires, explosions, blowouts, cratering, pollution and other environmental risks, shortages or delays in the viability of drilling rigs and the delivery of equipment, loss of circulation of drilling fluids or other conditions may substantially delay or prevent completion of any well or otherwise prevent a property or well from being profitable. A productive well may become uneconomic if water or other substances are encountered that impair or prevent the production of oil or natural gas from the well.
| 19 |
Oil and natural gas prices are extremely volatile, and decreases in prices have in the past and could in the future adversely affect our profitability, financial condition, cash flows, access to capital and ability to grow.
Our revenues, profitability and future rate of growth depend principally upon the market prices of oil and natural gas, which fluctuate widely. The markets for these commodities are unpredictable and even relatively modest drops in prices can significantly affect our financial results and impede our growth. Sustained declines in oil and gas prices may adversely affect our financial condition, liquidity and results of operations..
Factors that can cause market prices of oil and natural gas to fluctuate include:
| · | national and international financial market conditions; |
| · | uncertainty in capital and commodities markets; |
| · | the level of consumer product demand; |
| · | weather conditions; |
| · | U.S. and foreign governmental regulations; |
| · | the price and availability of alternative fuels; |
| · | political and economic conditions in oil producing countries, particularly those in the Middle East, including actions by the Organization of Petroleum Exporting Countries; |
| · | the foreign supply of oil and natural gas; |
| · | the price of oil and gas imports, consumer preferences; and |
| · | overall U.S. and foreign economic conditions. |
We cannot predict future oil and gas prices. At various times, excess domestic and imported supplies have depressed oil and gas prices. Additionally, the location of our producing wells may limit our ability to take advantage of spikes in regional demand and resulting increases in price. While increased demand would normally be expected to increase the prices we receive for our oil and natural gas, other factors, such as the recent sharp downturn in worldwide economic activity, may dampen or even reverse any such positive impact on prices.
Lower oil and natural gas prices may not only decrease our revenues, but also may reduce the amount of oil and natural gas that we can produce economically. Such a reduction may result in substantial downward adjustments to our estimated proved reserves and require write–downs of our properties. If this occurs, or if our development costs increase, our production data factors change or our exploration results do not meet expectations, accounting rules may require us to write down the carrying value of our oil and natural gas properties to fair value, as a non–cash charge to earnings.
A significant portion of our producing properties are located in geographic areas that are vulnerable to extreme seasonal weather, environmental regulation and production constraints.
A significant portion of our operating properties are located in the Rocky Mountain region. As a result, the success of our operations and our profitability may be disproportionately exposed to the impact of adverse conditions unique to that region. Such conditions can include extreme seasonal weather, which could limit our ability to access our properties or otherwise delay or curtail our operations. Also, there could be delays or interruptions of production from existing or planned new wells by significant governmental regulation, transportation capacity constraints, curtailment of production, interruption of transportation, or fluctuations in prices of oil and natural gas produced from the wells in the region.
In addition, some of the properties we intend to develop for production are located on federal lands where drilling and other related activities cannot be conducted during certain times of the year due to environmental considerations. This could adversely affect our ability to operate in those areas and may intensify competition during certain times for drilling rigs, oil field equipment, services, supplies and qualified personnel, which may lead to periodic shortages. These constraints and the resulting shortages or high costs could delay our operations and materially increase our operating and capital costs, particularly if our exploration or development activities on federal lands, or our production from federal lands increases.
The marketability of our production depends upon the availability, operation and capacity of gas gathering systems and the availability of interstate pipelines and processing facilities, all of which are owned by third parties.
| 20 |
The unavailability or lack of capacity of these systems and facilities, which result from factors beyond our control, could result in the shut–in of producing wells or the delay or discontinuance of development plans for properties. We currently own an interest in several wells that are capable of producing but may have their production curtailed from time to time at some point in the future pending gas sales contract negotiations, as well as construction of gas gathering systems, pipelines, and processing facilities.
Operations on the Fort Peck Indian Reservation in Montana are subject to various federal and tribal regulations and laws, any of which may increase our costs and delay our operations.
Various federal agencies within the U.S. Department of the Interior, along with the Fort Peck Assiniboine and Sioux Tribes, promulgate and enforce regulations pertaining to operations on the Fort Peck Indian Reservation. In addition, the Fort Peck Assiniboine and Sioux Tribes are a sovereign nation having the right to enforce laws and regulations independent from federal, state and local statutes and regulations. These tribal laws and regulations include various taxes, fees and other conditions that apply to lessees, operators and contractors conducting operations on Native American tribal lands. Lessees and operators conducting operations on tribal lands are generally subject to the Native American tribal court system. One or more of these factors may increase our costs of doing business in connection with our Roosevelt Project and may have an adverse impact on our ability to effectively transport products within the Fort Peck Indian Reservation or to conduct our operations on such lands.
Our business involves significant operating risks that could adversely affect our production and could be expensive to remedy. We do not have insurance to cover all of the risks that we may face.
Our operations are subject to all the risks normally incident to the operation and development of oil and natural gas properties and the drilling of oil and natural gas wells, including:
| · | well blowouts; |
| · | cratering and explosions; |
| · | pipe failures and ruptures; |
| · | pipeline accidents and failures; |
| · | casing collapses; |
| · | fires; |
| · | mechanical and operational problems that affect production; |
| · | formations with abnormal pressures; |
| · | uncontrollable flows of oil, natural gas, brine or well fluids; |
| · | releases of contaminants into the environment; and |
| · | failure of subcontractors to perform or supply goods or services or personnel shortages. |
These industry operating risks can result in injury or loss of life, severe damage to or destruction of property, damage to natural resources and equipment, pollution or other environmental damage, clean up responsibilities, regulatory investigation and penalties, and suspension of operations, any of which could result in substantial losses. In addition, maintenance activities undertaken to reduce operational risks can be costly and can require exploration, exploitation and development operations to be curtailed while those activities are being completed. We may also be subject to damage claims by other oil and gas companies.
We do not maintain insurance in amounts that cover all of the losses to which we may be subject, and some risks, such as pollution and environmental risks, are not generally fully insurable. Our insurance policies and contractual rights to indemnity may not adequately cover our losses, and we do not have access to insurance coverage or rights to indemnity for all risks. If a significant accident or other event occurs and is not fully covered by insurance or contractual indemnity, it could adversely affect our financial position and results of operations.
Competition in the oil and natural gas industry is intense, which may adversely affect our ability to succeed.
The oil and natural gas industry is highly competitive, and we compete with other companies that are significantly larger and have greater resources. Many of these companies not only explore for and produce oil and natural gas, but also carry on refining operations and market petroleum and other products on a regional, national or worldwide basis. These companies may be able to pay higher prices for productive oil and natural gas properties and exploratory prospects or define, evaluate, bid for and purchase a greater number of properties and prospects than our financial or human resources permit. In addition, these competitors may have a greater ability to continue exploration activities during periods of low oil and natural gas market prices. Our larger competitors may also be able to absorb the burden of present and future federal, state, local and other laws and regulations more easily than we can. Our ability to acquire additional properties and to discover reserves in the future will be dependent upon our ability to evaluate and select suitable properties and to consummate transactions in this highly competitive environment.
| 21 |
We are subject to complex environmental federal, state, local and other laws and regulations that could adversely affect the cost, manner or feasibility of doing business.
Our exploration, development, and production operations are regulated extensively at the federal, state and local levels. Environmental and other governmental laws and regulations have increased the costs to plan, design, drill, install, operate and abandon oil and natural gas wells. Under these laws and regulations, we also could be held liable for personal injuries, property damage and other damages. Failure to comply with these laws and regulations may result in the suspension or termination of operations and subject us to administrative, civil and criminal penalties. Moreover, public interest in environmental protection has increased in recent years, and environmental organizations have opposed, with some success, certain drilling projects.
The environmental laws and regulations to which we are subject:
| 1. | require applying for and receiving permits before drilling commences; |
| 2. | restrict the types, quantities and concentration of substances that can be released into the environment in connection with drilling and production activities; |
| 3. | limit or prohibit drilling activities on certain lands lying within wilderness, wetlands, and other protected areas; and |
| 4. | impose substantial liabilities for pollution resulting from our operations. |
If any of our operations require federal permits or otherwise involve a “major federal action” that significantly affects the environment, we may be required to prepare an environmental impact statement (“EIS”) pursuant to the National Environmental Policy Act (“NEPA”) to obtain the permits necessary to proceed with the development of certain oil and gas properties. There can be no assurance that we will obtain all necessary permits and, if obtained, that the costs associated with completing the EIS and obtaining such permits will not exceed those that previously had been estimated. It is possible that the costs and delays associated with compliance with such requirements could cause us to delay or abandon the further development of certain properties.
Changes in environmental laws and regulations occur frequently, and any changes that result in more stringent or costly waste handling, storage, transportation, disposal or cleanup requirements could require us to make significant expenditures to maintain compliance, and may otherwise have a material adverse effect on our earnings, results of operations, competitive position or financial condition. For example, because of its potential effect on drinking water, hydraulic fracturing currently is the subject of regulatory scrutiny, negative press, and legislative changes in some states. Hydraulic fracturing is a process that creates a fracture extending from a well bore into a low-permeability rock formation to enable oil or natural gas to move more easily to a production well. Hydraulic fractures typically are created through the injection of water, sand and chemicals into the rock formation. Legislative and regulatory efforts may render permitting and compliance requirements more stringent for hydraulic fracturing, which may limit or prohibit use of the process. While none of our properties are expected to be subject to any such changes, there is no assurance that this will remain the case.
Over the years, we have owned or leased numerous properties for oil and gas activities upon which petroleum hydrocarbons or other materials may have been released by us or predecessor property owners or lessees who were not under our control. Under applicable environmental laws and regulations, including CERCLA, RCRA and analogous state laws, we could be held strictly liable for the removal or remediation of any such previously released contaminants at such locations, in some cases regardless of whether we were responsible for the release or whether the operations were standard in the industry at the time they were performed.
Our operations also are subject to wildlife-protection laws and regulations. For example, oil companies have been charged with killing migratory birds in North Dakota, where we conduct some of our operations. Reserve pits are used during oil and gas drilling operations. During the clean up phase of a reserve pit, the Migratory Bird Treaty Act requires companies to cover the pit with a net if it is open for more than 90 days. The maximum penalty for each charge under the Migratory Bird Treaty Act is six months in prison and a $15,000 fine.
In April 2012, EPA issued regulations specifically applicable to the oil and gas industry that will require operators to capture 95 percent of the volatile organic compounds (“VOC”) emissions from natural gas wells that are hydraulically fractured. The reduction in VOC emissions will be accomplished primarily through the use of “reduced emissions completion” or “green completion” to capture natural gas that would otherwise escape into the air. EPA also issued regulations that set requirements for VOC emissions from several types of equipment, including storage tanks, compressors, dehydrators, and valves and sweetening units at gas processing plants. The adoption of these regulations, or the adoption of any other laws or regulations restricting or reducing these emissions, will increase our operating costs.
| 22 |
Another regulatory development that may impact our operations is EPA’s notice of finding and determination that emissions of carbon dioxide, methane and other greenhouse gases (“GHGs”) present an endangerment to human health and the environment, which allows EPA to begin regulating emissions of GHGs under existing provisions of the federal Clean Air Act. EPA has begun to implement GHG-related reporting and permitting rules. Similarly, the U.S. Congress has considered, and may in the future consider, “cap and trade” legislation that would establish an economy-wide cap on emissions of GHGs in the United States and would require most sources of GHG emissions to obtain GHG emission “allowances” corresponding to their annual emissions of GHGs. Any laws or regulations that may be adopted to restrict or reduce emissions of GHGs would be likely to increase our operating costs and could even have an adverse effect on demand for our production.
We depend on key members of our management team.
The loss of key members of our management team could reduce our competitiveness and prospects for future success. We do not have any “key man” insurance policies for our Chief Executive Officer; or any other executive. Our exploratory drilling success and the success of other activities integral to our operations will depend, in part, on our ability to attract and retain experienced management professionals. Competition for these professionals is extremely intense.
Shortages of qualified operational personnel or field equipment and services could affect our ability to execute our plans on a timely basis, increase our costs and adversely affect our results of operations.
The demand for qualified and experienced field personnel to drill wells and conduct field operations, geologists, geophysicists, engineers and other professionals in the oil and natural gas industry can fluctuate significantly, often in correlation with oil and natural gas prices, causing periodic shortages. From time to time, there have also been shortages of drilling rigs and other field equipment, as demand for rigs and equipment has increased with the number of wells being drilled. These factors can also result in significant increases in costs for equipment, services and personnel. For example, we have recently experienced an increase in drilling, completion and other costs associated with certain oil wells. Higher oil and natural gas prices generally stimulate increased demand and result in increased prices for drilling rigs, crews and associated supplies, equipment and services. We have sometimes experienced some difficulty in obtaining drilling rigs, experienced crews and related services and may continue to experience these difficulties in the future. In addition, the cost of drilling rigs and related services has increased significantly over the past several years. If shortages persist or prices continue to increase, our profit margin, cash flow and operating results could be adversely affected and our ability to conduct our operations in accordance with current plans and budgets could be restricted.
Risks Related to Our Securities
Currency fluctuations may adversely affect the price of our ADSs relative to the price of our ordinary shares.
The price of our ordinary shares is quoted in Australian dollars and the price of our ADSs is quoted in U.S. dollars. Movements in the Australian dollar/U.S. dollar exchange rate may adversely affect the U.S. dollar price of our ADSs and the U.S. dollar equivalent of the price of our ordinary shares. During the year ended June 30, 2013, the Australian dollar has, as a general trend, depreciated significantly against the U.S. dollar though remains volatile. If the Australian dollar weakens against the U.S. dollar, the U.S. dollar price of the ADSs could decline correspondingly, even if the price of our ordinary shares in Australian dollars increases or remains unchanged. In the unlikely event that dividends are payable, we will likely calculate and pay any cash dividends in Australian dollars and, as a result, exchange rate movements will affect the U.S. dollar amount of any dividends holders of our ADSs will receive from The Bank of New York Mellon, our depositary. While we would ordinarily expect such variances to be adjusted by inter-market arbitrage activity that accounts for the differences in currency values, there can be no assurance that such activity will in fact be an efficient offset to this risk.
The prices of our ordinary shares and ADSs have been and will likely continue to be volatile.
The trading prices of our ordinary shares on the ASX and of our ADSs on the NYSE MKT have been, and likely will continue to be, volatile. Other natural resource companies have experienced similar volatility for their shares, leading us to expect that the results of exploration activities, the price of oil and natural gas, future operating results, market conditions for natural resource shares in general, and other factors beyond our control, could have a significant, adverse or positive impact on the market price of our ordinary shares and ADSs. We also believe that this volatility creates opportunities for arbitrage trading between the ASX and NYSE MKT markets. While we recognize that arbitrage trading is an appropriate market mechanism to eliminate the differences between different trading markets resulting from the combination of volatile stock prices and inter-market inefficiencies, some of our shareholders may not be in a position to take advantage of the potential profits available to arbitrageurs in such cases.
We may issue shares of blank check preferred stock in the future that may adversely impact rights of holders of our ordinary shares and ADSs.
Our corporate constitution authorizes us to issue an unlimited amount of “blank check” preferred stock. Accordingly, our board of directors will have the authority to fix and determine the relative rights and preferences of preferred shares, as well as the authority to issue such shares, without further shareholder approval. As a result, our board of directors could authorize the issuance of a series of preferred stock that would grant to holders preferred rights to our assets upon liquidation, the right to receive dividends before dividends are declared to holders of our common stock, and the right to the redemption of such preferred shares, together with a premium, prior to the redemption of the common stock. To the extent that we do issue such additional shares of preferred stock, the rights of ordinary share and ADS holders could be impaired thereby, including, without limitation, dilution of their ownership interests in us. In addition, shares of preferred stock could be issued with terms calculated to delay or prevent a change in control or make removal of management more difficult, which may not be in the interest of holders of ordinary shares or ADSs.
| 23 |
We report as a U.S. domestic issuer, which means increased compliance costs notwithstanding continued eligibility for certain NYSE MKT rule waivers.
On July 1, 2011, we commenced reporting as a U.S. domestic issuer instead of as a ‘foreign private issuer” as we had in prior years. Accordingly, we are now required to comply with the reporting and other requirements imposed by U.S. securities laws on U.S. domestic issuers, which are more extensive than those applicable to foreign private issuers. We are also required to prepare financial statements in accordance with U.S. GAAP in addition to our financial statements prepared in accordance with IFRS pursuant to ASX requirements. Generating two separate sets of financial statements is a substantial burden that imposes significant administrative and accounting costs on us. As a result of becoming a U.S. domestic issuer, the legal, accounting, regulatory and compliance costs to us under U.S. securities laws are significantly higher than those that were incurred by us as a foreign private issuer.
Even though Samson is now a “domestic issuer” for SEC reporting requirements, we remain a “foreign based entity” for purposes of Section 110 of the NYSE MKT Company Guide. This permits us to apply to the NYSE MKT to have certain of its listing criteria relaxed and receive exemptions from rules applicable to corporations incorporated in the United States. We currently are relying on one Section 110 exemption received in connection with our stock option plan, and is described in more detail in “Item 6—Market for Registrant’s Common Equity, Related Stockholder Matters and Issuer Purchases of Equity Securities—Market Information.” While we have no current plans to seek additional Section 110 relief from NYSE MKT, there can be no assurance that we will not do so in the future.
We do not expect to pay dividends in the foreseeable future. As a result, holders of our ordinary shares and ADSs must rely on appreciation for any return on their investment.
We do not anticipate paying cash dividends on our ordinary shares in the foreseeable future. Accordingly, holders of our ordinary shares and ADSs will have to rely on capital appreciation, if any, to earn a return on their investment in our ordinary shares.
The trading prices of our ADSs may be adversely affected by short selling .
“Short selling” is the sale of a security that the seller does not own, including a sale that is completed by the seller’s delivery of a “borrowed” security (i.e. the short seller’s promise to deliver the security). Short sellers make a short sale because they believe that they will be able to buy the stock at a lower price than their sales price. Significant amounts of short selling, or the perception that a significant amount of short sales could occur, could depress the market price of our ADSs. The price decline could be exacerbated if sufficient “naked short selling” occurs, which is the practice by which short sellers place short sell orders for shares without first borrowing the shares to be sold, or without having first adequately located such shares and arranged for a firm contract to borrow such shares prior to the delivery date set to close the sale. The result is an artificial deluge into the market of shares for sale – shares that the seller does not own and has not even borrowed. Although there are regulations in the United States designed to address abusive short selling, the regulations may not be adequately structured or enforced.
We may be a passive foreign investment company (a “PFIC”) for U.S. federal income tax purposes. If we are or we become a PFIC, it could have adverse tax consequences to holders of our ordinary shares or ADSs.
Potential investors in our ordinary shares or ADSs should consider the risk that we could be now, or could in the future become, a PFIC for U.S. federal income tax purposes. We do not believe that we were a PFIC for the taxable year ended June 30, 2013, and do not expect to be a PFIC in the foreseeable future. However, the tests for determining PFIC status depend upon a number of factors, some of which are beyond our control and subject to legal and possibly factual uncertainties, and accordingly we cannot be certain of our PFIC status for the current, or any other, taxable year. We do not undertake an obligation to determine our PFIC status, or to advise investors in our securities as to our PFIC status, for any taxable year.
If we were to be a PFIC for any year, holders of our ordinary shares or ADSs who are U.S. persons for U.S. federal income tax purposes (“U.S. holders”) whose holding period for such ordinary shares or ADSs includes part of a year in which we are a PFIC generally will be subject to a special, highly adverse, tax regime imposed on “excess distributions” made by us. This regime will continue to apply irrespective of whether we are still a PFIC in the year an “excess distribution” is made or received. “Excess distributions” for this purpose would include certain distributions received on our ordinary shares or ADSs. In addition, gains by a U.S. holder on a sale or other transfer of our ordinary shares or ADSs (including certain transfers that would otherwise be tax-free) would be treated in the same manner as excess distributions. Under the PFIC rules, excess distributions (including gains treated as excess distributions) would be allocated ratably to each day in the U.S. holder’s holding period of the ordinary shares or ADSs with respect to which the excess distribution is made or received. The portion of any excess distributions allocated to the current year or prior years before the first day of the first taxable year beginning after December 31, 1986, in which we became a PFIC would be includible by the U.S. holder as ordinary income in the current year. The portion of any excess distributions allocated to prior taxable years in which we were a PFIC would be taxed to such U.S. holder at the highest marginal rate applicable to ordinary income for each such year (regardless of the U.S. holder’s actual marginal rate for that year and without reduction by any losses or loss carryforwards), and any such tax owing would be subject to interest charges. In addition, dividends received from us will not be “qualified dividend income” if we are a PFIC in the year of payment, or were a PFIC in the year preceding the year of payment, and will be subject to taxation at ordinary income rates.
| 24 |
In certain cases, U.S. holders may make elections to mitigate the adverse tax rules that apply to PFICs (the “mark-to-market” and “qualified electing fund” or “QEF” elections), but these elections may also accelerate the recognition of taxable income and could result in the recognition of ordinary income. We have never received a request from a holder of our ordinary shares or ADSs for the annual information required to make a QEF election and we have not decided whether we would provide such information if such a request were to be received. Additional adverse tax rules would apply to U.S. holders for any year in which we are a PFIC and own or dispose of shares in another corporation that is itself a PFIC. Special adverse rules that impact certain estate planning goals could apply to our ordinary shares or ADSs if we are a PFIC.
The market price of our ordinary shares and ADSs could be adversely affected by sales of substantial amounts of shares in the public markets or the issuance of additional shares in the future, including in connection with acquisitions.
Sales of a substantial number of our ordinary shares in the public market, either directly or indirectly as the sale of ADSs, or the perception that such sales may occur, could cause the market price of our ordinary shares (and ADSs) to decline. In addition, the sale of these shares in the public market, or the possibility of such sales, could impair our ability to raise capital through the sale of additional shares or other securities. As of June 30, 2013, we had granted options to purchase an aggregate of approximately 69,500,000 million shares of our ordinary shares to certain of our directors and employees. These option holders, subject to compliance with applicable securities laws, are permitted to sell shares they own or acquire upon the exercise of options in the public market. In addition, as of June 30, 2013, we had warrants outstanding which may be exercised by warrant holders for 97,307,526 ordinary shares at an exercise price of A$0.038 per share until March, 2017, the exercise of which could have similarly adverse consequences on the trading prices for our shares.
For further details on our outstanding options and warrants, see “Note 10 – Share-Based Payments” in the Notes to our Consolidated Financial Statements.
In addition, in the future, we may issue ordinary shares or ADSs including in connection with acquisitions of assets or businesses. If we use our shares for this purpose, the issuances could have a dilutive effect on the market value of our ordinary shares, depending on market conditions at the time of an acquisition, the price we pay, the value of the business or assets acquired, our success in exploiting the properties or integrating the businesses we acquire and other factors.
Our ADS holders are not shareholders and do not have shareholder rights.
The Bank of New York Mellon, as depositary, executes and delivers our ADSs on our behalf. Each ADS is represented by a certificate evidencing a specific number of ADSs. Our ADS holders are not required to be treated as shareholders and do not have the rights of shareholders. The depositary is the holder of the ordinary shares underlying our ADSs. Holders of our ADSs have ADS holder rights. A deposit agreement among us, the depositary and our ADS holders sets out ADS holder rights as well as the rights and obligations of the depositary. New York law governs the deposit agreement and the ADSs.
Our ADS holders do not have the right to receive notices of general meetings or to attend and vote at our general meetings of shareholders. Our practice is to give ADS holders notices of general meetings and to enable them to vote at our general meetings of shareholders, but we are not obligated to continue to do so. Our ADS holders may instruct the depositary to vote the ordinary shares underlying their ADSs, but only when we ask the depositary to ask for their instructions. Although our practice is to have the depositary ask for the instructions of ADS holders, we are not obligated to do so, and if we do not, our ADS holders would not be able to exercise their right to vote. ADS holders can exercise their right to vote the ordinary shares underlying their ADSs by withdrawing the ordinary shares. However it is possible that our ADS holders would not know about the meeting enough in advance to withdraw the ordinary shares.
When we do ask the depositary to seek our ADS holders’ instructions, the depositary notifies our ADS holders of the upcoming vote and arranges to deliver our voting materials and form of notice to them. The depositary then tries, as far as practicable, subject to Australian law and the provisions of the depositary agreement, to vote the ordinary shares as our ADS holders instruct. The depositary does not vote or attempt to exercise the right to vote other than in accordance with the instructions of the ADS holders. We cannot assure our ADS holders that they will receive the voting materials in time to ensure that they can instruct the depositary to vote their shares. In addition, there may be other circumstances in which our ADS holders may not be able to exercise voting rights.
Similarly, while our ADS holders would generally receive the same dividends or other distributions as holders of our ordinary shares, their rights are not identical. Dividends and other distributions payable with respect to our ordinary shares generally will be paid directly to those holders. By contrast, any dividends or distributions payable with respect to ordinary shares that are held as ADSs will be paid to the depositary, which has agreed to pay to our ADS holders the cash dividends or other distributions it or the custodian receives on shares or other deposited securities, after deducting its fees and expenses. Our ADS holders will receive these distributions in proportion to the number of ordinary shares their ADSs represent. In addition, while it is unlikely there may be circumstances in which the depositary may not pay to our ADS holders the same amounts distributed by us as a dividend or distribution, such as when it is unlawful or impractical to do so. See the next risk factor below.
| 25 |
There are circumstances where it may be unlawful or impractical to make distributions to the holders of our ADSs.
Our depositary, Bank of New York Mellon, has agreed to pay to our ADS holders the cash dividends or other distributions it or the custodian receives on shares or other deposited securities, after deducting its fees and expenses. Our ADS holders will receive these distributions in proportion to the number of ordinary shares their ADSs represent.
In the case of a cash dividend, the depositary will convert any cash dividend or other cash distribution we pay on the ordinary shares into U.S. dollars if it can do so on a reasonable basis and can transfer the U.S. dollars to the United States. In the unlikely event that it is not possible to convert a cash dividend or distribution into U.S. dollars, then the deposit agreement with the depositary allows the depositary to distribute foreign currency only to those ADS holders to whom it is possible to do so. There is also a risk that, if a distribution is payable by us in Australian dollars, the depositary may hold some or all of the foreign currency for a short period of time rather than immediately converting it for the account of the ADS holders. Because the depositary will not invest the foreign currency, will not be liable for any interest on the unpaid distribution or for any fluctuation in the exchange rates during a time when the depositary has not converted the foreign currency, our ADS holders could lose some of the value of the distribution.
The depositary may determine that it is unlawful or impractical to convert foreign currency to U.S. dollars or to make a distribution to ADS holders that is made to the holders of ordinary shares. This means that, under rare circumstances, our ADS holders may not receive the same distributions we make to the holders of our ordinary shares or receive the same value for their ADSs if it is illegal or impractical for us to or the depositary to do so.
There may be difficulty in effecting service of legal process and enforcing judgments against us and our directors and management.
We are a public company limited by shares, registered and operating under the Australian Corporations Act 2001. Two of our four directors and one of our named executive officers reside outside the United States. Substantially all of the assets of those persons are located outside the U.S. As a result, it may not be possible to effect service on such persons in the U.S. or to enforce, in foreign courts, judgments against such persons obtained in U.S. courts and predicated on the civil liability provisions of the federal securities laws of the U.S. There is doubt as to the enforceability in the Commonwealth of Australia, in original actions or in actions for enforcement of judgments of U.S. courts, of civil liabilities predicated solely upon federal or state securities laws of the U.S., especially in the case of enforcement of judgments of U.S. courts where the defendant has not been properly served in Australia.
| Item 1B. | Unresolved Staff Comments |
None.
| Item 3. | Legal Proceedings |
None.
In the ordinary course of our business we are named from time to time as a defendant in various legal proceedings. We maintain liability insurance and believe that our coverage is reasonable in view of the legal risks to which our business ordinarily is subject.
| Item 4. | Mine Safety Disclosures |
Not applicable.
| 26 |
| Item 5. | Market for Registrant’s Common Equity, Related Stockholder Matters and Issuer Purchases of Equity Securities |
A. Market Information
Our American Depositary Shares (“ADS”), each representing 20 ordinary shares, have been listed on the NYSE MKT since January 7, 2008. As of September 10, 2013 86,119,133 ADS were outstanding and we had approximately 16,000 holders of record. The following table sets forth, for the periods indicated, the highest and lowest market quotations for the ADSs reported on NYSE MKT. On September 11, 2013, the closing price of our ADSs on NYSE MKT was $0.53.
| NYSE MKT American Depositary Share (ADS) Price (in USD) | ||||||||||||||||
| Fiscal 2013 | Fiscal 2012 | |||||||||||||||
| High | Low | High | Low | |||||||||||||
| First Quarter (July 1 – September 30) | $ | .49 | $ | .47 | $ | 3.12 | $ | 1.81 | ||||||||
| Second Quarter (October 1 – December 31) | $ | .71 | $ | .65 | $ | 2.57 | $ | 1.46 | ||||||||
| Third Quarter (January 1 – March 31) | $ | .80 | $ | .73 | $ | 3.08 | $ | 2.00 | ||||||||
| Fourth Quarter (April 1 – June 30) | $ | 1.15 | $ | 1.08 | $ | 2.55 | $ | 0.95 | ||||||||
Our ordinary shares were listed on the Australian Securities Exchange Ltd. (the “ASX”) beginning on April 17, 1980. As of September 11, 2013, 2,547,617,329 ordinary shares were outstanding, and we had approximately 4,608 shareholders of record. The following table sets forth, for the periods indicated, the highest and lowest market quotations for the ordinary shares reported on the Daily Official List of the ASX. On September 11, 2013, the closing price of our ordinary shares on the ASX was A$0.025.
| ASX Ordinary Share Price (in AUD) | ||||||||||||||||
| Fiscal 2013 | Fiscal 2012 | |||||||||||||||
| High | Low | High | Low | |||||||||||||
| First Quarter (July 1 – September 30) | $ | .052 | $ | .050 | $ | 0.14 | $ | 0.09 | ||||||||
| Second Quarter (October 1 – December 31) | $ | .037 | $ | .035 | $ | 0.13 | $ | 0.08 | ||||||||
| Third Quarter (January 1 – March 31) | $ | .034 | $ | .033 | $ | 0.15 | $ | 0.09 | ||||||||
| Fourth Quarter (April 1 – June 30) | $ | .026 | $ | .025 | $ | 0.12 | $ | 0.05 | ||||||||
NYSE MKT Corporate Governance Requirements
Our ADSs are listed on the NYSE MKT. Section 110 of the NYSE MKT company guide permits the NYSE MKT to consider the laws, customs and practices of foreign issuers in relaxing certain of its listing criteria, and to grant exemptions from NYSE MKT listing criteria based on these considerations. Any listed company seeking relief under these provisions is required to provide written certification from independent local counsel that the non-complying practice is not prohibited by home country law.
One significant manner in which our governance practices differ from those followed by U.S. domestic companies pursuant to NYSE MKT standards is that in January 2009, with the approval of our Board of Directors, we asked the NYSE MKT for exemptive relief from Section 711 of the NYSE MKT rules, which normally requires shareholder approval of any issuances of equity securities to officers or directors of a listed company, or of a plan like the Samson Oil & Gas Limited Stock Option Plan. Such approval is not required under Australian law or the ASX listing rules, and this difference in law was certified to NYSE MKT by the Company’s Australian legal counsel at that time, Minter & Ellison. Under Australian law, approval of the plan by Samson’s Board of Directors is sufficient to adopt the plan under Australian law. Australian law does require shareholder approval for options grants to directors, regardless of whether a Board-approved plan is in place. Therefore, in the event we issue options to directors, we will be required to obtain shareholder approval of the grants.
The NYSE MKT granted approval for exemption from Section 711 in April 2009. Accordingly, we did not receive shareholder approval in connection with the establishment of the Samson Oil & Gas Limited Stock Option Plan.
| 27 |
B. Holders
As of September 11, 2013, there were approximately 4,608 holders of record of our ordinary shares. Our depositary for the ADSs, The Bank of New York Mellon, constitutes the single record holder of our ADSs.
C. Dividends
We have never paid dividends on our ordinary shares and do not anticipate paying any cash dividends on our ordinary shares in the foreseeable future. Under Australian law, we may not pay a dividend unless our assets exceed our liabilities immediately before the dividend is declared and the excess is sufficient for the payment of the dividend. Moreover, Australian law requires that the dividend is fair and reasonable to the holders of our ordinary shares and the payment of the dividend does not materially prejudice our ability to pay our creditors.
D. Securities Authorized for Issuance Under Equity Compensation Plans
Information regarding equity compensation plans under which our equity securities may be issued is included in Item 12 of Part III of this report through incorporation by reference to our definitive Proxy Statement to be filed in connection with our 2013 Annual Meeting of Shareholders.
E. Performance Graph
The following graph compares the cumulative return provided to stockholders of Samson Oil & Gas Limited’s ADSs relative to the cumulative total returns of the NYSE MKT Composite Index (XAX) and the NYSE MKT Oil Index (XOI). An investment of $100 is assumed to have been made in our ADSs and in each of the indexes on January 7, 2008, the date our ADSs began trading on the NYSE MKT, and its relative performance is tracked through June 30, 2013. The indices are included for comparative purposes only. This graph is not “soliciting material,” is not deemed filed with the SEC and is not to be incorporated by reference in any of our filings under the Securities Act or the Exchange Act, whether made before or after the date hereof and irrespective of any general incorporation language in any such filing.
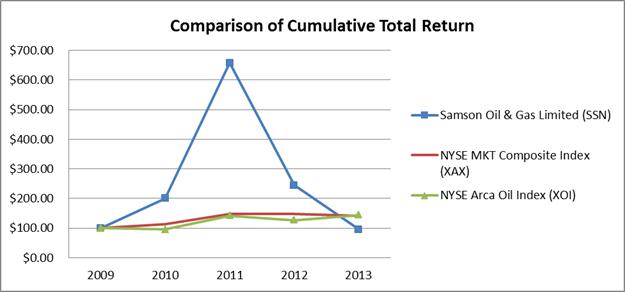
| June 30, | ||||||||||||||||||||
| 2009 | 2010 | 2011 | 2012 | 2013 | ||||||||||||||||
| Samson Oil & Gas Limited (SSN) | $ | 100.00 | $ | 200.00 | $ | 657.78 | $ | 244.44 | $ | 95.56 | ||||||||||
| NYSE MKT Composite Index (XAX) | $ | 100.00 | $ | 113.50 | $ | 148.16 | $ | 147.15 | $ | 141.95 | ||||||||||
| NYSE Arca Oil Index (XOI) | $ | 100.00 | $ | 96.16 | $ | 141.94 | $ | 126.84 | $ | 144.71 | ||||||||||
F. Taxation
The taxation discussion set forth below describes the material Australian income tax and U.S. federal income tax consequences of ownership of our ordinary shares or ADSs by a U.S. Holder (as defined below). This discussion is based on the Australian and U.S. tax laws currently in force at the date of this Annual Report. The comments do not take into account or anticipate any changes in law (by legislation or judicial decision) or any changes in administrative practice or interpretation by the relevant authorities. If there is a change, including a change having a retrospective effect, the comments would have to be considered in light of the changes. This discussion does not address any tax consequences arising under the laws of any state or local jurisdiction, nor of any foreign jurisdictions other than Australia and the United States.
| 28 |
These comments are not exhaustive of all income tax consequences that could apply in all circumstances of any given shareholder or ADS holder. We recommend that prospective purchasers or holders of our ordinary shares or ADSs consult their own tax advisors regarding the Australian and U.S. federal, state and local tax, and other tax consequences of, purchasing, holding, owning, disposing of or otherwise transferring our ordinary shares and ADSs in their particular circumstances. Neither the Company nor any officers accept liability or responsibility with respect of such consequences. Further, special additional rules may apply to particular shareholders, such as insurance companies, superannuation funds and financial institutions.
Australian Taxation
The following discussion of the Australian taxation implications is based on the provisions of the Income Tax Assessment Act 1936, the Income Tax Assessment Act 1997, International Tax Agreements Act 1953 (IntTAA) which includes the United States Convention as amended by the United States Protocol (USDTA), public taxation rulings and available case law current as at the date of this Annual Report on Form 10-K (all of which are collectively referred to in this section as “Australian Taxation Laws”). The Australian Taxation Laws and their interpretation are subject to change at any time.
General Principle of Taxation in Australia
This discussion only deals with two items of income that may arise from an investment in the shares or ADSs in us, namely:
| · | any capital gain made on a sale of the shares or ADSs; and |
| · | any dividends which may be paid by the Company with respect to those shares (or ADSs). Please note that we have not paid any dividends to date and do not expect to pay any in the near to medium term. |
The discussion is relevant only to shareholders or ADS holders that are not residents of Australia for tax purposes, and are residents of the U.S. for the purposes of the USDTA (“U.S. Equity Holders”).
Capital Gains on Sale of Shares or ADSs
Under Australian law, income tax is typically not payable on the gain made on the disposal of ordinary shares or ADSs by U.S. Equity Holders unless the profit is of income in nature and sourced in Australia or the sale is subject to tax on any net capital gains, in each case as broadly summarized below.
When the Profit on Sale is Income in Nature
Where a U.S. Equity Holder:
| · | holds its ordinary shares or ADSs as trading stock or otherwise on revenue account; |
| · | carries on a business in Australia through a permanent establishment or fixed base; and | |
| · | holds the ordinary shares or ADSs as part of that business, |
any profit on the sale of the ordinary shares or ADSs (as the case may be) would be required to be included in the assessable income of the relevant U.S. Equity Holders and taxed accordingly.
When the Sale is Subject to Capital Gains Tax
A U.S. Equity Holder will be required to include in its assessable income in Australia any “net capital gains” that it makes on “indirect Australian real property interests” (“IARPI”). Broadly, IARPI will exist where:
| · | the U.S. Equity Holder and its associates have a 10% or more direct participation interest in us and owned the shareholding at the time of disposal or throughout a 12 month period beginning no earlier than 24 months before the sale of the shareholding, and ending no later than the date of sale of the shareholding; and |
| 29 |
| · | at the time of the sale of the shareholding more than 50% of the market value of our assets are attributable to Australian real property (broadly Australian land and interest in Australian land). |
Therefore, unless a U.S. Equity Holder and its associates holds a direct participation interest of at least 10% (as described above) it should not make a taxable capital gain or capital loss for Australian tax purposes with respect to the sale of shares or ADSs, irrespective of the percentage of our assets that constitute Australian real property. Therefore there should be no tax payable on any gain on the sale of the shares or ADSs.
Where a U.S. Equity Holder, with its associates holds;
| · | a direct participation interest of at least 10% (as described above); and |
| · | at the time of sale less than 50% of the market value of our assets are attributable to Australian real property, |
that U.S. Equity Holder will not be subject to Australian tax on any capital gain or loss with respect to the sale of shares or ADSs.
Where a U.S. Equity Holder, with its associates holds;
| · | a direct participation interest of at least 10% (as described above); and |
| · | at the time of sale more than 50% of the market value of our assets are attributable to Australian real property, |
that U.S. Equity Holder will be required to calculate its net capital gains for the relevant income year taking into account the capital gain or capital loss made on the sale of the shares or ADSs. The net capital gain is then included in the U.S. Holder’s assessable income in Australia and will be taxed accordingly.
A summary of a method for calculating net capital gains is to:
| · | direct participation interest of at least 10% (as described above); and |
| · | at the time of sale more than 50% of the market value of our assets are attributable to Australian real property, |
Dividends
Dividends paid by Samson to U.S. Equity Holders are only subject to the withholding tax provisions of the Australian Taxation Laws.
Australia has an imputation system which allows a company which distributes profits to its members to pass on to its members a credit for the tax already paid by the company to its members. This is known as a franking credit. The amount of the franking credit attached to the dividend is at the discretion of the paying company, but cannot exceed the balance of the company’s franking account (broadly the net of any income tax paid less franking credits attached to previous dividends). To the extent that the dividend is franked, the dividend is not subject to withholding tax when paid to U.S. Equity Holders. This means that a fully franked dividend is not subject to any withholding tax.
Any part of a dividend paid to the U.S. Equity Holder which is not franked is subject to dividend withholding tax in Australia. The withholding tax rates under the USDTA are as follows:
| · | generally 15% of the gross amount of the dividend, however; |
| · | this is reduced to 5% of the gross amount of the dividend if the U.S. Equity Holder who is beneficially entitled to the dividend is a company which holds at least 10% of the voting power in the company, and |
| · | this is reduced to nil if the U.S. Equity Holder who is beneficially entitled to the dividends is a company who has held shares (or ADSs) which hold a voting power of at least 80% for at least a 12 month period (subject to certain other conditions). |
In the case of a U.S. Equity Holder carrying on business in Australia through a permanent establishment or performing independent personal services through a fixed base in Australia with which the holding of shares (or ADSs) is effectively connected, no withholding tax will apply, instead the dividends form part of the normal assessable income subject to tax in Australia under the USDTA.
A dividend which is unfranked is also exempt from withholding tax to the extent that it consists of certain income from foreign sources (for example dividends from foreign companies in which the shareholder owns at least a 10% interest). It may be possible to pay such dividends to U.S. Equity Holders without the imposition of withholding tax under the Australian “Conduit Foreign Income” rules. Essentially conduit foreign income is foreign income received by a non-Australian resident (you) via an Australian corporate tax entity (us).
| 30 |
In the event we paid a dividend we would provide Equity Holders with notices detailing the extent to which a dividend is franked or unfranked, or represents conduit foreign income, and the deduction, if any, of withholding tax. If a dividend paid is subject to withholding tax, or would be so but for being franked, no further Australian tax is payable on the dividend.
There are also additional exemptions depending on the nature of the shareholder which are designed to ensure that an entity that is otherwise exempt from tax is not subject to withholding tax, e.g., charitable institutions.
U.S. Taxation
This section describes the material U.S. federal income tax consequences to a U.S. Holder (as defined below) of owning our ordinary shares or ADSs. This summary addresses only U.S. federal income tax considerations of U.S. Holders (as defined below) that hold our ordinary shares or ADSs as capital assets for U.S. federal income tax purposes.
This summary is based on U.S. tax laws, including the Internal Revenue Code of 1986, as amended (the “Code”), Treasury Regulations promulgated thereunder, rulings, judicial decisions, administrative pronouncements, and the USDTA, all as of the date hereof, and all of which are subject to change or changes in interpretation, possibly with retroactive effect.
For purposes of this section headed “U.S. Taxation,” the term “U.S. Holder” means a beneficial owner of ordinary shares or ADSs who is a U.S. person for U.S. federal income tax purposes, and generally includes:
| · | a U.S. citizen or an individual who is a resident of the United States for U.S. federal income tax purposes; |
| · | a corporation, or an entity treated as a corporation, created or organized in or under the laws of the United States or any state thereof or the District of Columbia; |
| · | a trust that (i) is subject to (a) the primary supervision of a court within the United States and (b) the authority of one or more United States persons to control all substantial decisions or (ii) has a valid election in effect under applicable Treasury Regulations to be treated as a United States person; or, |
| · | an estate that is subject to U.S. federal income tax on its income regardless of its source. |
If a partnership (including for this purpose any entity treated as a partnership for U.S. federal income tax purposes) holds our ordinary shares or ADSs, the U.S. federal income tax treatment of a partner thereof generally will depend on the status of such partner and the activities of the partnership. If you are a partner in a partnership holding our ordinary shares or ADSs, you should consult your tax advisor(s).
Holders of our ordinary shares or ADSs who are not U.S. Holders should consult with their tax advisor(s) in connection with the U.S. federal, state, local and foreign tax consequences of the matters discussed herein.
This discussion does not address all aspects of U.S. federal income taxation that may be relevant to you in light of your particular circumstances or that may be applicable to you if you are subject to special treatment under the U.S. federal income tax laws, including if you are:
| · | a financial institution; |
| · | a tax–exempt organization; |
| · | an S corporation or other pass–through entity; |
| · | an insurance company; |
| · | a mutual fund; |
| · | a dealer in stocks and securities, or foreign currencies; |
| · | a trader in securities who elects the mark–to–market method of accounting for your securities; |
| 31 |
| · | subject to the alternative minimum tax provisions of the Code; |
| · | a U.S. Holder who received our ordinary shares or ADSs through the exercise of employee stock options, otherwise as compensation, or through a tax–qualified retirement plan; |
| · | a U.S. Holder who has a functional currency other than the U.S. dollar, certain expatriates, or not a U.S. Holder; |
| · | a U.S. Holder who holds our ordinary shares or ADSs as part of a hedge, straddle or constructive sale or conversion transaction; or, |
| · | a U.S. Holder who owns, or is treated as owning under certain attribution rules, 5% or more of the aggregate amount of our ordinary shares or ADSs. |
This section is based in part upon the representations of the depositary and the assumption that each obligation in the deposit agreement and any related agreement will be performed in accordance with its terms.
In general, and taking into account the assumptions stated herein, for U.S. federal income tax purposes a holder of ADSs will be treated as the owner of the ordinary shares represented by those ADSs. Exchanges of ordinary shares for ADSs, and of ADSs for ordinary shares, generally will not be subject to U.S. federal income tax. This discussion (except where otherwise expressly noted) applies equally to U.S. Holders of ordinary shares and U.S. Holders of ADSs.
U.S. Holders should consult their own tax advisors regarding the specific U.S. federal, state and local tax consequences of the ownership and disposition of ordinary shares and ADSs in light of their particular circumstances as well as any consequences arising under the laws of any other taxing jurisdiction. In particular, U.S. Holders are urged to consult their own tax advisors regarding whether they are eligible for benefits under the USDTA.
This summary assumes that we are not and will not become a controlled foreign corporation for purposes of the Code and, except as otherwise indicated, that we are not and will not become a passive foreign investment company.
Sale of ordinary shares and ADSs
Subject to the passive foreign investment company rules discussed below, a U.S. Holder that sells or otherwise disposes of our ordinary shares or ADSs will recognize capital gain or loss for U.S. federal income tax purposes equal to the difference between (i) the U.S. dollar value of the amount realized on the sale or disposition and (ii) the tax basis, determined in U.S. dollars, of those ordinary shares or ADSs. Such gain or loss generally will be long-term capital gain or loss if the holding period for the ordinary shares or ADSs sold or disposed of exceeds one year at the time of disposition. The deductibility of capital losses is subject to significant limitations. The gain or loss on the sale or other disposition of our ordinary shares or ADSs by a U.S. Holder will generally be income or loss from sources within the United States for purposes of computing the foreign tax credit limitation. Capital gains may be subject to the surtax on unearned income, as discussed below under “Surtax on Unearned Income.”
Dividends
We do not expect to pay dividends in the foreseeable future. However, subject to the passive foreign investment company rules discussed below, a U.S. Holder must include in gross income as dividend income the gross amount of any distribution (including the amount of any Australian withholding tax thereon) paid by us out of our current or accumulated earnings and profits (as determined for U.S. federal income tax purposes) with respect to ordinary shares or ADSs. Such distributions are taxable to a U.S. Holder when the U.S. Holder (in the case of ordinary shares) or the depositary (in the case of ADSs) actually or constructively receives the distribution.
Except as described below, dividends paid to a non–corporate U.S. Holder of our ordinary shares or ADSs will be “qualified dividend income” and will be taxed to such holder at the rates applicable to long–term capital gains. However, dividend income will not be qualified dividend income (and will be taxed at ordinary income rates) if (i) the holder fails to hold the ordinary shares or ADSs for at least 61 days during the 121-day period beginning 60 days before the ex–dividend date; (ii) the Internal Revenue Service determines that the USDTA is not a comprehensive income tax treaty that entitles our dividends to qualified dividend treatment and our ordinary shares or ADSs are not readily tradable on an established securities market in the United States; or (iii) we are a passive foreign investment company for the taxable year in which the dividend is paid or in the preceding taxable year. Dividends may be subject to the surtax on unearned income, as discussed below under “Surtax on Unearned Income.”
In the case of a corporate U.S. Holder, dividends on ordinary shares and ADSs are taxed as ordinary income and will not generally be eligible for the dividends received deduction generally allowed to U.S. corporations for dividends received from other U.S. corporations.
Distributions in excess of current and accumulated earnings and profits (as determined for U.S. federal income tax purposes) will be treated as a non–taxable return of capital to the extent of the holder’s tax basis in the ordinary shares or ADSs and thereafter as capital gain.
For foreign tax credit limitation purposes, at least a portion of the dividends paid by us generally would be U.S. source income if, and to the extent that, more than a de minimis amount of our earnings and profits out of which the dividends are paid is from sources within the United States. The remaining portion of the dividends paid by us will be income from sources outside the United States. The use of foreign tax credits is subject to complex conditions and limitations. In lieu of a credit, a U.S. Holder who itemizes deductions may elect to deduct all of such holder’s foreign taxes in the taxable year such foreign taxes are paid or deemed paid. A deduction does not reduce U.S. tax on a dollar-for-dollar basis like a tax credit, but the deduction for foreign taxes is not subject to the same limitations applicable to foreign tax credits. U.S. Holders are urged to consult their own tax advisors regarding the availability of foreign tax credits.
| 32 |
The amount of any distribution paid in foreign currency (including the amount of any Australian withholding tax thereon) generally will be includible in the gross income of a U.S. Holder of ordinary shares or ADSs in an amount equal to the U.S. dollar value of the foreign currency, calculated by reference to the spot rate in effect on the date of receipt by the U.S. Holder, or, the case of ADSs, by the depositary, regardless of whether the foreign currency is converted into U.S. dollars on such date. The amount of any distribution paid in a foreign currency generally will be converted into U.S. dollars by the depositary upon its receipt. Accordingly, a U.S. Holder of ADSs generally will not be required to recognize foreign currency gain or loss in respect of the distribution. Special rules govern and specific elections are available to accrual method taxpayers to determine the U.S. dollar amount includible in income in the case of taxes withheld in a foreign currency. Accrual basis taxpayers are therefore urged to consult their own tax advisors regarding the requirements and elections applicable in this regard.
Passive Foreign Investment Company Status
A non-U.S. corporation will be classified as a PFIC in any taxable year in which, after taking into account the income and assets of certain subsidiaries, either (i) at least 75% of its gross income is passive income, or (ii) at least 50% of the average value of its assets is attributable to assets that produce or are held for the production of passive income. Whether or not we will be classified as a PFIC in any taxable year is a factual determination and will depend upon our assets, the market value of our ordinary shares, and our activities in each year and is therefore subject to change.
Although we do not believe that we were a PFIC for the taxable year ended June 30, 2013 and do not expect to be a PFIC in the foreseeable future, the tests for determining PFIC status depend upon a number of factors. Some of these factors are beyond our control and may be subject to uncertainties, and we cannot assure you that we have not been or will not be a PFIC. We have not undertaken a formal study as to our PFIC status, and we do not undertake an obligation to determine our PFIC status, or to advise investors in our securities as to our PFIC status, for any year.
If we are a classified as a PFIC for any taxable year, the so–called “excess distribution” regime of Code Section 1291 will apply to any U.S. Holder of ordinary shares or ADSs that does not make a mark–to–market or qualified electing fund election, as described below. Under the excess distribution regime, (i) any gain the U.S. Holder realizes on the sale or other disposition of the ordinary shares or ADSs (possibly including a gift, exchange in a corporate reorganization, or grant as security for a loan) and any “excess distribution” that we make to such holder (generally, any distributions to such holder in respect of the ordinary shares or ADSs during a single taxable year that are greater than 125% of the average annual distributions received by such holder in the three preceding years or, if shorter, such holder’s holding period for the ordinary shares or ADSs), will be treated as ordinary income that was earned ratably over each day in such holder’s holding period for the ordinary shares or ADSs; (ii) the portion of any excess distributions allocated to the current year or prior years before the first day of the first taxable year beginning after December 31, 1986 in which we became a PFIC would be includible by the U.S. Holder as ordinary income in the current year; (iii) the portion of such gain or distribution that is allocable to prior taxable years during which we were a PFIC will be subject to tax at the highest rate applicable to ordinary income for the relevant taxable years, regardless of the tax rate otherwise applicable to such holder and without reduction for deductions or loss carryforwards; and (iv) the interest charge generally applicable to underpayments of tax will be imposed with respect of the tax attributable to each such year.
Dividends received from us will not be “qualified dividend income” if we are a PFIC in the year of payment, or were a PFIC in the year preceding the year of payment, and will be subject to taxation at ordinary income rates.
If we are classified as a PFIC for any taxable year and our ordinary shares or ADSs are treated as “marketable securities” under applicable Treasury Regulations, a U.S. Holder may avoid the excess distribution regime described above by making a valid “mark–to–market” election with respect to the ordinary shares or ADSs. If a valid mark–to–market election is made, an electing U.S. Holder generally (i) will be required to recognize as ordinary income an amount equal to the excess, if any, of the fair market value of the ordinary shares or ADSs over the holder’s adjusted tax basis in such ordinary shares or ADSs at the close of each taxable year, or (ii) if the U.S. Holder’s adjusted tax basis in the ordinary shares or ADSs exceeds their fair market value at the close of each taxable year, will be allowed to deduct the excess as an ordinary loss to the extent of the net amount of income previously included as a result of the mark–to–market election. A U.S. Holder’s basis in its ordinary shares or ADSs will be adjusted to reflect the amounts included or deducted with respect to the mark–to–market election, and any gain or loss on the disposition of ordinary shares or ADSs will generally be ordinary income, or, to the extent of previously included mark–to–market inclusions, ordinary loss. Each U.S. Holder must make their own mark–to–market election. Once made, the election cannot be revoked without the consent of the Internal Revenue Service unless the ordinary shares or ADSs cease to be marketable securities. Under applicable. Treasury Regulations, marketable securities includes stock of a PFIC that is “regularly traded” on a qualified exchange or other market. Because our ordinary shares are traded on the Australian Stock Exchange and our ADSs are traded on the NYSE MKT, we expect that our ordinary shares and ADSs will be treated as “regularly traded,” and a U.S. Holder should be able to make a mark–to–market election. However, no assurance that our ordinary shares or ADSs are or will be marketable securities can be given.
| 33 |
The excess distribution regime would not apply to any U.S. Holder who is eligible for and timely makes a valid “qualified electing fund” (“QEF”) election, in which case such holder would be required to include in income on a current basis such holder’s pro rata share of our ordinary income and net capital gains. To be timely, a QEF election must be made for the U.S. Holder’s first taxable year that includes any portion of the U.S. Holder’s holding period in our ADS or ordinary shares during which we are a PFIC. For this purpose, a U.S. Holder may elect to restart the U.S. Holder’s holding period in our ADSs or ordinary shares by agreeing to recognize, and pay tax and interest under the excess distribution regime described above, on the amount of any appreciation in the ADSs or ordinary shares held. However, a U.S. Holder’s QEF election will be valid only if we provide certain annual information to our shareholders. We have not decided at this time whether we will provide such annual information and thus it is possible that U.S. Holders will not be able to make a valid QEF election with respect to our ordinary shares and ADSs.
Special rules apply with respect to the calculation of the amount of the foreign tax credit with respect to excess distributions made by a PFIC. In general, these rules allocate creditable foreign taxes over the U.S. Holder’s holding period for ordinary shares or ADSs and otherwise coordinate the foreign tax credit limitation rules with the PFIC rules.
If we are a PFIC in a taxable year and own shares in another PFIC (a “lower–tier PFIC”), a U.S. Holder also will be subject to the excess distribution regime with respect to its indirect ownership of the lower–tier PFIC. The mark–to–market election would not be available for any indirect ownership of a lower–tier PFIC. A QEF election can be made for a lower–tier PFIC, but only if we provide the U.S. Holder with the annual information necessary to make such an election. We have not decided at this time whether we will provide such annual information and thus it is possible that U.S. Holders will not be able to make a valid QEF election with respect to any lower-tier PFIC.
U.S. Holders who own ordinary shares or ADSs during any year in which we are a PFIC must file Internal Revenue Service Form 8621 with their U.S. federal income tax return for each year in which such holder owns ordinary shares or ADSs and either recognizes gain on a disposition of such ordinary shares, receives certain distributions from us, or makes an election with respect to PFIC status. Pursuant to the recently-enacted Code Section 1298(f), all U.S. Holders may be required to provide annual information regarding ownership of an interest in a PFIC. As of the date hereof, the Internal Revenue Service has suspended the reporting requirements imposed under Code Section 1298(f) for PFIC shareholders that are not otherwise required to file Internal Revenue Service Form 8621.
Tax Rates Applicable to Ordinary Income and Capital Gains of Non-Corporate U.S. Holders
Ordinary income and short-term capital gains of non-corporate U.S. Holders are generally subject to U.S. federal income tax at rates of up to 39.6%. Long-term capital gains of non-corporate U.S. Holders are generally subject to U.S. federal income tax at rates of up to 20%.
Surtax on Unearned Income
A surtax of 3.8% (the “unearned income Medicare contribution tax”) is imposed on the “net investment income” of certain U.S. Holders in excess of a threshold amount. Net investment income generally includes interest, dividends, royalties, rents, gross income from a trade or business involving “passive” activities, and net gain from disposition of property (other than property held in a “non-passive” trade or business). Net investment income is reduced by deductions that are properly allocable to such income.
HIRE Act
U.S. Holders should consult their tax advisors regarding the effect, if any, of the Hiring Incentives to Restore Employment Act, signed into law on March 18, 2010, which provides disclosure and withholding rules relating to ownership by U.S. persons of financial accounts with foreign financial institutions.
U.S. Information Reporting and Backup Withholding
Dividend payments with respect to ordinary shares or ADSs and proceeds from the sale, exchange, redemption, or other disposition of ordinary shares or ADSs may be subject to information reporting to the Internal Revenue Service and U.S. backup withholding. Certain exempt recipients, including corporations, are not subject to these information reporting requirements. Backup withholding will not apply to a holder who furnishes a correct taxpayer identification number or certificate of foreign status and who makes any other required certification. U.S. persons who are required to establish their exempt status generally must provide to us or our depositary an Internal Revenue Service Form W–9 (Request for Taxpayer Identification Number and Certification).
Backup withholding is not an additional tax. Amounts withheld as backup withholding may be credited against a U.S. Holder’s U.S. federal income tax liability, and a U.S. Holder may obtain a refund of any excess amounts withheld by filing the a timely claim for refund with the Internal Revenue Service and furnishing any required information.
| 34 |
| Item 6. | Selected Financial Data |
The table below contains selected consolidated financial data. The statement of operations, cash flow, balance sheet and other financial data for each year has been derived from our consolidated financial statements. You should read this information together with “Management’s Discussion and Analysis of Financial Condition and Results of Operation” and our consolidated financial statements and the related notes included elsewhere in this report. No pro forma adjustments have been made for the acquisitions and divestitures of oil and natural gas properties, which will affect the comparability of the data below.
Because we are no longer eligible to file as a foreign private issuer and therefore can no longer present our financial results in accordance with IFRS, we have recast our prior financial statements and selected financial data into U.S. GAAP for all periods presented in this Form 10-K. Financial statements prepared in accordance with IFRS will be filed with the ASX in Australia in order to meet our reporting obligations in Australia.
| Fiscal Year Ended June 30 | ||||||||||||||||||||
| 2013 | 2012 | 2011 | 2010 | 2009 | ||||||||||||||||
| Revenues and Other Income | ||||||||||||||||||||
| Oil sales | $ | 5,028,050 | $ | 7,352,494 | $ | 5,038,446 | $ | 1,956,193 | $ | 1,433,369 | ||||||||||
| Gas sales | 772,073 | 1,020,945 | 930,330 | 915,086 | 634,019 | |||||||||||||||
| Other liquids | 3,985 | 12,360 | - | 20,658 | 17,376 | |||||||||||||||
| Interest income | 253,150 | 355,357 | 368,251 | 24,318 | 10,338 | |||||||||||||||
| Gain on cancellation of portion of embedded derivative(options) | - | - | - | - | 1,248,072 | |||||||||||||||
| Gain on movement in fair value of embedded derivative | - | - | - | - | 1,536,983 | |||||||||||||||
| Gain on sale of exploration acreage | - | - | 73,199,687 | - | - | |||||||||||||||
| Other | 211,736 | 58,598 | 2,245 | 58,929 | 27,886 | |||||||||||||||
| Total Revenues and Other Income | 6,268,994 | 8,799,754 | 79,538,959 | 2,975,184 | 4,908,043 | |||||||||||||||
| Fiscal Year Ended June 30 | ||||||||||||||||||||
| 2013 | 2012 | 2011 | 2010 | 2009 | ||||||||||||||||
| Expenses | ||||||||||||||||||||
| Lease operating expense | $ | (3,466,339 | ) | $ | (2,789,902 | ) | $ | (1,678,510 | ) | $ | (908,283 | ) | $ | (906,631 | ) | |||||
| Depletion, depreciation and amortization | (1,975,932 | ) | (2,776,005 | ) | (1,832,558 | ) | (1,160,385 | ) | (1,023,828 | ) | ||||||||||
| Impairment of oil and natural gas properties | (259,529 | ) | (635,464 | ) | - | (71,151 | ) | (483,167 | ) | |||||||||||
| Exploration and evaluation expenditure (note 1) | (7,929,204 | ) | (30,559,458 | ) | (404,031 | ) | (1,569,455 | ) | (4,861,545 | ) | ||||||||||
| Accretion of asset retirement obligations | (55,326 | ) | (23,603 | ) | (23,909 | ) | (26,196 | ) | (23,022 | ) | ||||||||||
| General and administrative | (6,313,993 | ) | (7,880,966 | ) | (8,561,734 | ) | (3,300,233 | ) | (4,811,922 | ) | ||||||||||
| Interest expense, net of capitalized costs | - | - | (906,838 | ) | (1,423,938 | ) | (5,574,131 | ) | ||||||||||||
| Total Expenses | (20,000,323 | ) | (44,665,398 | ) | (13,407,580 | ) | (8,459,641 | ) | (17,684,246 | ) | ||||||||||
| Income (loss) from continuing operations | (13,731,329 | ) | (35,865,644 | ) | 66,131,379 | (5,484,457 | ) | (12,776,203 | ) | |||||||||||
| Income tax (provision)/ benefit | 2,010,280 | 4,629,193 | (14,695,544 | ) | - | - | ||||||||||||||
| Earnings from continuing operations | (11,721,049 | ) | (31,236,451 | ) | 51,435,835 | (5,484,457 | ) | (12,776,203 | ) | |||||||||||
| Total income (loss) from discontinued operations, net of income taxes | - | - | 2,712,387 | (18,679,899 | ) | 2,598,514 | ||||||||||||||
| Net Income (Loss) | $ | (11,721,049 | ) | $ | (31,236,451 | ) | $ | 54,148,222 | $ | (24,164,356 | ) | $ | (10,177,689 | ) | ||||||
| Basic – cents per share | $ | (0.61 | ) | $ | (1.78 | ) | 3.06 | (0.56 | ) | (5.88 | ) | |||||||||
| Diluted – cents per share | $ | (0.61 | ) | $ | (1.78 | ) | 2.61 | (0.56 | ) | (5.88 | ) | |||||||||
| Net earnings per common share from discontinued operations: | ||||||||||||||||||||
| Basic – cents per share | $ | - | $ | - | 0.16 | (1.91 | ) | 1.20 | ||||||||||||
| Diluted – cents per share | $ | - | $ | - | 0.14 | (1.91 | ) | 1.20 | ||||||||||||
| Weighted average common shares outstanding: | ||||||||||||||||||||
| Basic | 1,935,438,970 | 1,752,408,357 | 1,680,247,878 | 978,983,187 | 217,248,877 | |||||||||||||||
| Diluted | 1,935,438,970 | 1,752,408,357 | 1,968,053,691 | 978,983,187 | 217,248,877 | |||||||||||||||
| 35 |
| Fiscal Year Ended June 30 | ||||||||||||||||||||
| 2013 | 2012 | 2011 | 2010 | 2009 | ||||||||||||||||
| Cash flow data: | ||||||||||||||||||||
| Cash flow provided by/(used in) operations | $ | 2,182,311 | $ | 2,820,481 | $ | (10,509,390 | ) | $ | (1,210,080 | ) | $ | (46,673 | ) | |||||||
| Cash flow provided by /(used in) investing activities | (17,405,124 | ) | (42,732,283 | ) | 69,438,106 | (5,834,554 | ) | (1,082,641 | ) | |||||||||||
| Cash flow provided by/(used in) financing activities | $ | 9,050,000 | $ | 632,101 | $ | (7,661,155 | ) | $ | 11,271,787 | $ | (2,330 | ) | ||||||||
| Other financial data: | ||||||||||||||||||||
| Capital expenditure – oil and gas properties | $ | (8,371,024 | ) | $ | (3,384,858 | ) | $ | (4,793,225 | ) | $ | (3,581,518 | ) | $ | (274,946 | ) | |||||
| Capitalized exploration expenditure and undeveloped acreage | (6,263,316 | ) | (5,172,706 | ) | (3,347,738 | ) | - | - | ||||||||||||
| Balance sheet data: | ||||||||||||||||||||
| Cash and cash equivalents | $ | 13,170,627 | $ | 18,845,894 | $ | 58,448,477 | $ | 5,885,735 | $ | 1,522,632 | ||||||||||
| Property, plant and equipment, net of depletion and impairment | 20,359,675 | 14,338,441 | 14,214,774 | 20,330,897 | 38,991,421 | |||||||||||||||
| Total assets | 52,727,175 | 55,723,239 | 81,597,832 | 32,895,960 | 41,266,248 | |||||||||||||||
| Borrowings | - | (7,322 | ) | (29,769 | ) | (11,283,999 | ) | (16,846,207 | ) | |||||||||||
| Total shareholders’ equity | $ | 44,907,319 | $ | 48,173,079 | $ | 77,926,665 | $ | 18,990,905 | $ | 23,459,943 | ||||||||||
| Item 7. | Management’s Discussion and Analysis of Financial Condition and Results of Operations |
The following discussion and analysis should be read in conjunction with our consolidated financial statements and related notes and the other information appearing in this Annual Report on Form 10-K. As used in this report, unless the context otherwise indicates, references to “we,” “our,” “ours,” and “us” refer to Samson Oil & Gas Limited and its subsidiaries collectively.
Overview
We are an independent energy company primarily engaged in the acquisition, exploration, exploitation and development of oil and natural gas properties. Our strategy is to focus on the exploration, exploitation and development of our two major oil plays – the Niobrara in Goshen County, Wyoming and the Bakken in Williams County, North Dakota. We are in the early stages of our first Niobrara shale project – the Hawk Springs Project – and also of our Montana Bakken shale project – the Roosevelt Project.
| 36 |
In 2010 we decided to move our focus from natural gas to oil. We sold natural gas assets and following the successful drilling and completion of three oil wells in our North Stockyard Field, our oil production and proved reserves increased. We continue to endeavor to increase our oil reserves.
Our net oil production was 61,640 barrels of oil for the year ended June 30, 2013 compared to 87,956 barrels of oil for the year ended June 30, 2012. Our net gas production was 167,083 Mcf for the year ended June 30, 2013 compared to 214,463 Mcf for the year ended June 30, 2012.
Recent Developments
Since the end of fiscal 2012, we have acquired new exploratory and developmental drilling properties, consolidated our ownership position in the North Stockyard project, conducted exploratory and developmental drilling in our these new and existing properties, obtained permits for drilling up to 8 developmental wells in our North Stockyard and Rainbow projects, and raised approximately $13 million in new equity capital to fund our drilling programs. We also continue to explore additional sources of new capital, including a sale or joint development arrangement of our Roosevelt Project as well as conventional bank financing.
Based on the positive developmental drilling results from the North Stockyard field to date, we repositioned our ownership position geographically through an acreage swap, concentrating our ownership in the northern tier of the existing project. We then drilled, as operator, two new developmental wells, the Billabong and the Sale and Anchor wells. Before completing those two wells, however, we entered into a farm out transaction with another company with significant operating experience in the area by which we divested half of our equity position in the northern tier in exchange for $5.562 million in cash and other consideration. Neither the acreage swap nor the farm out reduced our ownership interest in the currently producing wells in the field. We will receive an additional $891,000 upon delivery of a useable wellbore for the Billabong well. With an experienced operator as an equal equity partner in the project going forward, we are now well positioned to fulfill the capital intensive developmental drilling of the remainder of the field.
Also, in April of 2013, we acquired, in two tranches, a net 1,225 acres in two 1,280 acre drilling units in the Rainbow Project in Williams County, North Dakota, near the North Stockyard project. We transferred 160 net acres from our 1,200 acre undeveloped acreage holding in North Stockyard project and will provide a $1.2 million carry to the vendor, for the first (10% carry) and second (2% carry) development wells in exchange for our 950 net acres in the Rainbow Project. We are in the process of applying for 4 drilling permits in our Rainbow Project.
To date, the exploratory drilling results in our Hawk Springs, South Prairie and Roosevelt projects have been below expectations. As a result, during the fiscal year ended June 30, 2013, we wrote off $7.3 million in previously capitalized exploration costs in relation to the Spirit of America II well in Hawk Springs. At South Prairie, the first well drilled was plugged and abandoned based on the logging and show results. At Roosevelt, we have considered alternatives to continuing the expensive exploratory drilling program that property, and we even agreed to sell the entire project, but the purchaser failed to close the transaction.
During this same time, we engaged in various transactions to raise sufficient capital to support our ambitious drilling programs. In March and April 2013, we raised net proceeds of $3.2 million in the U.S. through the sale of American Depositary Shares (ADSs)(represented by ordinary shares) and warrants to purchase ordinary shares via a registered direct offering. We then conducted a rights offering by which we offered to all of our shareholders, including holders of ordinary shares and American Depositary Shares, the right to purchase one ordinary share and 4/10 of a warrant to purchase ordinary share for every three ordinary share, or ADS equivalent, owned, raising $2.5 million in net proceeds. As permitted by Australian law, we then conducted a shortfall placement of the shares not purchased by existing shareholders in the rights offering. The shortfall placement was conducted in the U.S. and Australia in August 2013 on the same terms as the rights offering, raising approximately $7.0 million. We are currently evaluating other capital raising options, including a secured debt facility.
| 37 |
Results of Operations
The following table reflects the components of our oil and natural gas production and sales prices, and our operating revenues, costs and expenses, for the periods indicated, including results from discontinued operations.
| Fiscal Year ended June 30, | ||||||||||||
| 2013 | 2012 | 2011 | ||||||||||
| Production Volume: | ||||||||||||
| Oil (Bbls) | 61,640 | 87,956 | 64,405 | |||||||||
| Natural gas (Mcf) | 167,083 | 214,463 | 423,077 | |||||||||
| BOE | 89,487 | 123,700 | 134,918 | |||||||||
| Oil Price per Bbl Produced (in dollars): | ||||||||||||
| Realized price | $ | 81.57 | $ | 83.59 | $ | 79.28 | ||||||
| Natural Gas Price per Mcf Produced (in dollars): | ||||||||||||
| Realized price | $ | 4.62 | $ | 4.76 | $ | 3.59 | ||||||
| Fiscal Year ended June 30, | ||||||||||||
| 2013 | 2012 | 2011 | ||||||||||
| Expense per BOE: | ||||||||||||
| Lease operating expenses | $ | 31.68 | $ | 14.59 | $ | 8.34 | ||||||
| Production and property taxes | $ | 7.06 | $ | 7.80 | $ | 5.81 | ||||||
| Depletion, depreciation and amortization | $ | 22.08 | $ | 21.71 | $ | 16.02 | ||||||
| General and administrative expense | $ | 70.56 | $ | 63.71 | $ | 55.34 | ||||||
| Interest expense, net of amounts capitalised | $ | - | $ | - | $ | 6.89 | ||||||
| 38 |
Comparison of Year Ended June 30, 2013 to year ended June 30, 2012
| Year ended | Variance | % Change | ||||||||||||||
| Item | June 30, 2013 | June 30, 2012 | ||||||||||||||
| Continuing Operations | ||||||||||||||||
| Oil and gas revenues | $ | 5,804,108 | $ | 8,385,799 | $ | (2,581,691 | ) | -31 | % | |||||||
| Interest income | 253,150 | 355,357 | (102,207 | ) | -29 | % | ||||||||||
| Other income | 211,736 | 58,598 | 153,138 | 261 | % | |||||||||||
| Lease operating expense | (3,466,339 | ) | (2,789,902 | ) | (676,437 | ) | 24 | % | ||||||||
| Depletion, depreciation and amortization | (1,975,932 | ) | (2,776,005 | ) | 800,073 | -29 | % | |||||||||
| Impairment of oil and gas properties | (259,529 | ) | (635,464 | ) | 375,935 | 0 | % | |||||||||
| Exploration and evaluation expenditure | (7,929,204 | ) | (30,559,458 | ) | 22,630,254 | -74 | % | |||||||||
| Accretion of Asset Retirement Obligations | (55,326 | ) | (23,603 | ) | (31,723 | ) | 0 | % | ||||||||
| General and administrative cost | (6,313,993 | ) | (7,880,966 | ) | 1,566,973 | -20 | % | |||||||||
| Income tax (expense)/benefit | 2,010,280 | 4,629,193 | (2,618,913 | ) | -57 | % | ||||||||||
| Net income (loss) | $ | (11,721,049 | ) | $ | (31,236,451 | ) | $ | 19,515,402 | ||||||||
Net income (loss)
The result for the fiscal year ended June 30, 2013 was a net loss attributable to shareholders, after income tax, of $11.7 million, compared to a net loss attributable to shareholders, after income tax, of $31.2 million for the year ended June 30, 2012. The net loss in 2013 was due to significant write offs in relation to previously capitalized exploration expenditure.
We wrote off $7.4 million in exploration expenditure in the Statement of Operations as a result of poor completion results in relation to our Spirit of America II well in our Hawk Springs Project in Goshen County, Wyoming. One zone of the well still requires fracture stimulation and maybe be productive for hydrocarbons, however it is unlikely that we will recover drilling costs associated with this well and therefore the costs associated with drilling the well have been expensed.
Oil and gas revenues
Oil and gas revenues decreased from the year ended June 30, 2012 to the year ended June 30, 2013, from $8.4 million to $5.8 million. The decrease is a result of a combination of a decrease in oil production for the year and a decrease in the average oil price realized. Oil production decreased from 87,956 Bbls for the year ended June 30, 2012 to 61,640 Bbls for the year ended June 30, 2013. The decrease in oil produced is a result of the expected decline in oil production which was in line with the estimated decline curve and a result of down time experienced in the North Stockyard project for workover operations. The average oil sale price received decreased slightly from $83.59 per barrel for the year ended June 30, 2012 to $81.57 per barrel for the year ended June 30, 2013.
The realized gas price decreased from $4.76 per Mcf for the year ended June 30, 2012 to $4.62 per Mcf for the year ended June 30, 2013. Our natural gas production decreased for the year ended June 30, 2013 to 167,083 Mcf from 214,663 Mcf for the year ended June 30, 2012. The decline is a result of the decrease in production associated with the age of our gas reservoirs.
Impairment
Included in the loss for fiscal year ended June 30, 2013 is $259,529 of impairment expense of oil and gas properties compared to $635,464 for fiscal year ended June 30, 2012. The current year impairment is result of the poor production results of our non-operated wells, the Abercrombie and Riva Ridge, in the Roosevelt area.
Exploration expenditures
Exploration expenditures decreased significantly for the year ended June 30, 2013, to $7.9 million from $30.6 million for the year ended June 30, 2012. We wrote off $7.4 million in exploration expenditure in the Statement of Operations as a result of poor drilling results from our Spirit of America II well in our Hawk Springs project in Goshen County, Wyoming. One stage of this well remains to be completed and while it may prove to be productive for hydrocarbons, it is unlikely that we will recover our costs associated with drilling this well. The remaining $0.6 million relates to other general exploration expenditure on our two main exploration projects, including delay rentals – Hawk Springs and Roosevelt, in particular in relation to our exploratory wells Australia II and Gretel II.
| 39 |
Lease operating expenses
Lease operating expenses increased from $2.8 million for fiscal year 2012 to $3.5 million in fiscal year 2013. Lease operating expense per BOE increased significantly from $14.59 for fiscal year 2012 to $31.68 for fiscal year 2013. We incurred significant lease operating costs in our Roosevelt project and Hawk Springs project, attempting to increase our production volumes on our Defender, and Australia II and Gretel II wells, respectively. These attempts were unsuccessful and did not lead to a significant increase in the production from these wells.
The production environment in our North Stockyard field is extremely harsh with high salt levels in the produced water. This has led to high water disposal costs and increased repairs and maintenance cost for the pumping equipment. During the latter part of the fiscal year 2013, the operator of the North Stockyard field drilled a salt water disposal well. Although we have limited production data from this well as it has only been operating for 4 months, our salt water disposal costs for these four months have effectively been reduced to nil.
Our production taxes also decreased slightly from $7.79 per BOE for fiscal year 2012 to $7.06 per BOE for fiscal year 2013.
Depletion, depreciation and amortization
Depletion, depreciation and amortization expense decreased from $2.8 million for fiscal year 2012 to $2.0 million in fiscal year 2013. This was a result of decreased production activity during the current year. Depreciation and depletion per BOE for fiscal year 2013 increased to $22.08 compared to $21.71 for fiscal year 2012.
General and administrative expense
General and administrative expense decreased from the year ended June 30, 2012 to the year ended June 30, 2013 from $7.9 million to $6.3 million. Included within general and administrative expenditure is share-based payments of $1.2 million for fiscal year 2012 compared to $0.2 million for fiscal year 2013. This decrease is associated with the expensing of the fair value of options granted to all staff and executives during 2012. Salary and employee benefits decreased from $3.0 million for the year ended June 30, 2012 to $2.4 million for the year ended June 30, 2013 due, in part, to a decrease in bonus payable during the year ended June 30, 2013. No bonus was accrued during the year ended June 30, 2013.
Other administrative costs increased slightly, including investor relations, travel, legal and audit expenses, from $3.6 million for the year ended June 30, 2012 to $3.7 million for the year ended June 30, 2013.
Income tax expense benefit
We recorded an income tax benefit from continuing operations of $2.0 million in fiscal 2013 compared to $4.6 million benefit in the prior year.
The income tax benefit recognized in the current and prior year is due to the carry back of certain expenditures incurred in the current and prior year to the income tax paid during the year ended June 30, 2011. We have received the total benefit available to us from the carry back provisions and do not expect to recognize income tax benefit in future periods.
| 40 |
Comparison of Year Ended June 30, 2012 to year ended June 30, 2011
| Year ended | Variance | % Change | ||||||||||||||
| Item | June 30, 2012 | June 30, 2011 | ||||||||||||||
| Continuing Operations | ||||||||||||||||
| Oil and gas revenues | $ | 8,385,799 | $ | 5,968,776 | $ | 2,417,023 | 40 | % | ||||||||
| Interest income | 355,357 | 368,251 | (12,894 | ) | -4 | % | ||||||||||
| Gain sale of exploration acreage | - | 73,199,687 | (73,199,687 | ) | -100 | % | ||||||||||
| Other income | 58,598 | 2,245 | 56,353 | 2510 | % | |||||||||||
| Lease operating expense | (2,789,902 | ) | (1,678,510 | ) | (1,111,392 | ) | 66 | % | ||||||||
| Depletion, depreciation and amortization | (2,776,005 | ) | (1,832,558 | ) | (943,447 | ) | 51 | % | ||||||||
| Impairment of oil and gas properties | (635,464 | ) | - | (635,464 | ) | 0 | % | |||||||||
| Exploration and evaluation expenditure | (30,559,458 | ) | (404,031 | ) | (30,155,427 | ) | 7464 | % | ||||||||
| Accretion of Asset Retirement Obligations | (23,603 | ) | (23,909 | ) | 306 | 0 | % | |||||||||
| General and administrative cost | (7,880,966 | ) | (8,537,825 | ) | 656,859 | -8 | % | |||||||||
| Interest expense, net of capitalized costs | - | (930,747 | ) | 930,747 | -100 | % | ||||||||||
| Income tax (expense)/benefit | 4,629,193 | (14,695,544 | ) | 19,324,737 | -132 | % | ||||||||||
| Loss from discontinued operations | - | 2,712,387 | (2,712,387 | ) | -100 | % | ||||||||||
| Net income (loss) | $ | (31,236,451 | ) | $ | 54,148,222 | $ | (85,384,673 | ) | ||||||||
Net income (loss)
The result for the fiscal year ended June 30, 2012 was a net loss attributable to shareholders, after income tax, of $31.2 million, compared to a net profit attributable to shareholders, after income tax, of $54.1 million for the year ended June 30, 2011 due to a large acreage sale. The net loss in 2012 was due to significant write offs in relation to previously capitalized exploration expenditure.
During the fiscal year ended June 30, 2012 we wrote off $24.7 million in exploration expenditure in the Statement of Operations as a result of poor drilling results in relation to our Roosevelt project, Roosevelt County, Montana. We also wrote off $4.9 million in exploration expenditure in the Statement of Operations following the unsuccessful drilling of Spirit of America I in our Hawk Springs project in Goshen County, Wyoming. Numerous operational issues were encountered with drilling this well and it ultimately failed to reach its target.
Oil and gas revenues
Oil and gas revenues increased from the year ended June 30, 2011 to the year ended June 30, 2012, from $6.0 million to $8.4 million. The increase is a result of a combination of an increase in oil production for the year and an increase in the average oil price realized. The average oil sale price received increased from $79.43 per barrel for the year ended June 30, 2011 to $83.59 per barrel for the year ended June 30, 2012. In addition oil production increased from 64,405 Bbls for the year ended June 30, 2011, inclusive of properties included within discontinued operations, to 87,956 Bbls for the year ended June 30, 2012.
The realized gas price increased from $3.86 per Mcf for the year ended June 30, 2011 to $4.76 per Mcf for the year ended June 30, 2012. However, our natural gas production decreased for the year ended June 30, 2012 to 214,463 Mcf from 423,077 Mcf for the year ended June 30, 2011. The decrease in gas production is primarily due to the sale of our interests in the Jonah and Lookout Wash properties effective December 31, 2011.
| 41 |
Gain on sale of exploration acreage
Sale of exploration acreage decreased from $73,199,687 for the year ended June 30, 2011 to $nil for the year ended June 30, 2012. The sale in the prior year was our sale of exploration acreage in Hawk Spring Project area in Goshen County, Wyoming. This was a one-off sale and is not expected to be repeated again in the foreseeable future.
Impairment
Included in the loss for fiscal year ended June 30, 2012 is $635,464 of impairment expense of oil and gas properties compared to $nil for fiscal year ended June 30, 2011. $0.4 million of this impairment relates to the impairment of asset portion of the asset retirement obligation recognized following the drilling of four wells this year – Defender, Australia II, Gretel II and Spirit of America I. The remaining $0.3 million of this impairment expense relates to our Davis Bintliff well in Brazoria County, Texas. This well is a gas well and its value has declined in line with the recent decline witnessed in natural gas prices. The well continues to produce natural gas in line with our expected production decline curve.
Exploration expenditures
Exploration expenditures increased significantly for the year ended June 30, 2012, to $30.6 million from $0.4 million for the year ended June 30, 2011. We wrote off $24.7 million in exploration expenditure in the Statement of Operations as a result of poor drilling results from two wells in the Roosevelt Project. We also wrote off $4.9 million in exploration expenditure in the Statement of Operations as a dry hole cost associated with drilling the Spirit of America well in our Hawk Springs Project. Operational difficulties were encountered while drilling this well, and it failed to meet its target. In addition, $0.3 million was capitalized in relation to preliminary work performed on wells now unlikely to be drilled in the immediate future in our Hawk Springs Project. The remaining $0.6 million relates to other general exploration expenditure on our two main exploration projects – Hawk Springs and Roosevelt.
Lease operating expenses
Lease operating expenses increased from $1.6 million for fiscal year 2011 to $2.8 million in fiscal year 2012. This increase is primarily the result of increased activity. Lease operating expense per BOE increased significantly from $8.34 for fiscal year 2011 to $14.59 for fiscal year 2012. As we are not the operator of our material producing fields, these costs are largely beyond control. The production environment in our North Stockyard field is also extremely harsh with high salt levels in the produced water. This leads to high water disposal costs and increased repairs and maintenance cost for the pumping equipment. The operator of the field has indicated they intend to drill a salt water disposal well during the coming months, which would likely lead to a decrease in the current level of produced water disposal costs. Our production taxes also increased from $5.81 per BOE for fiscal year 2011 to $7.79 per BOE for fiscal year 2012.
Depletion, depreciation and amortization
Depletion, depreciation and amortization expense increased from $1.8 million for fiscal year 2011 to $2.8 million in fiscal year 2012. This was a result of increased activity during the current year. Depreciation and depletion per BOE for fiscal year 2012 increased to $21.71 compared to $16.02 for fiscal year 2011.
General and administrative expense
General and administrative expense decreased from the year ended June 30, 2011 to the year ended June 30, 2012 from $8.6 million to $7.9 million. Included within general and administrative expenditure is share based payments of $1.2 million for fiscal year 2012 compared to $2.2 million for fiscal year 2011. This decrease is associated with the expensing of the fair value of options granted to all staff and executives during 2011. Also in 2011 $0.5 million of cash bonus payments were made spread across all employees for the year ended June 30, 2011 following the successful sale of some of our Hawk Springs acreage. Bonuses of $0.5 million were expensed in the current year following the achievement of certain performance criteria, including $0.1 million relating to the bonus period from January 1, 2012 to June 30, 2012 which has not been paid at year end.
Other administrative costs also increased following increased activity, including investor relations, travel, legal and audit expenses, from $1.8 million for the year ended June 30, 2011 to $2.2 million for the year ended June 30, 2012.
Income tax expense/( benefit)
We recorded an income tax benefit from continuing operations of $4.6 million in fiscal 2012 compared to $14.7 million provision in the prior year. In the prior year income tax expense from continuing operations has been reduced by $7.9 million, as result of the income tax benefit recognized in discontinued operations.
The income tax benefit recognized in the current year is due to the carry back of certain expenditures incurred in the current year to the prior year income tax paid.
| 42 |
Discontinued operations
We recorded a gain from discontinued operations of $2.7 million for the fiscal year ended June 30, 2011 compared to $nil for the fiscal year ended June 30, 2012, net of income tax. The discontinued operations for 2011 consist of our working interests in the Jonah and Lookout Wash fields in Carbon and Sublette Counties, Wyoming. These operations were sold in March 2011. We recognized an income tax benefit of $7.9 million in relation to this sale which will reduce our income tax expense. We also recognized a net loss on the sale of these assets of $5.4 million in the current year, which is included in the total loss from discontinued operations.
Liquidity and Capital Resources
Cash flows
| Year ended June 30 | ||||||||||||
| 2013 | 2012 | 2011 | ||||||||||
| Cash provided by (used in) operating activities | $ | 2,182,311 | $ | 2,820,481 | $ | (10,509,390 | ) | |||||
| Cash provided by (used in) investing activities | (17,405,124 | ) | (42,732,283 | ) | 69,438,106 | |||||||
| Cash provided by (used in) financing activities | 9,050,000 | 632,101 | (7,661,155 | ) | ||||||||
Capital Resources
During the fiscal year ended June 30, 2013 our main source of liquidity was cash on hand and proceeds from equity issues and exercise of options. During the year ended June 30, 2012, our main source of liquidity was cash on hand and cash flow from our producing properties.
During the fiscal year ended June 30, 2013, 214,002,238 1.5 Australian cent warrants were exercised for net proceeds of $3.34 million to us. The warrants were previously issued as part of a public rights offering conducted in October 2009.
In addition, during the fiscal year ended June 30, 2013, we conducted two registered direct equity offering and one rights offering. Subsequent to year end we conducted one registered direct equity offering in the form of a shortfall offering to our previously conducted rights offering. We issued 128,935,387 ordinary shares priced at 2.5 cents (Australian) each to raise US$3.35 million to investors in the United States in the two registered direct offerings. We also issued 114,335,711 ordinary shares at the same price to raise $2.7 million in the rights offering to our existing shareholders.
In August 2013, we issued 318,452,166 ordinary shares to U.S. and Australian investors at 2.5 cents (Australian) each and 127,380,866 new warrants. The placement was a portion of the shortfall in the rights offering completed by us in May 2013. The warrants have an exercise price of 3.8 cents (Australian) and an expiry date of March 31, 2017. The placement raised approximately $6.7 million, after expenses.
Any capital expenditure remains dependent on us having the capital required to meet the expenditure. There is no guarantee that we will be able to fund all of the planned expenditure from our existing working capital or be able to raise the funds through the debt or equity markets.
During the fiscal year ended June 30, 2012, 39,913,038 1.5 Australian cent warrants were exercised for net proceeds of $0.6 million to us. The warrants were previously issued as part of a public rights offering conducted in October 2009.
During the fiscal year ended June 30, 2011, 70,072,446 1.5 Australian cent warrants were exercised for net proceeds of $1.1 million to us. These warrants were also issued in the October 2009 public rights offering.
During the year ended June 30, 2011 we repaid in full our debt facility with Macquarie Bank Limited. This facility has been cancelled and cannot be drawn against.
In addition, during the fiscal year ended June 30, 2011, 500,000 Australian 8 cent options were exercised for net proceeds of $42,216 to us.
During the fiscal year ended June 30, 2011, our main source of liquidity was cash received from the sale of 24,166 acres in Goshen County, Wyoming to Chesapeake Energy Corporation for approximately $73.2 million. We also sold our interests in the Jonah and Lookout Wash fields for $6.3 million.
We are continually monitoring the capital resources available to us to meet our future financial obligations, planned capital expenditure activities and liquidity. Our future success in growing proved reserves and production will be highly dependent on capital resources available to us and our success in finding or acquiring additional productive reserves.
| 43 |
2011, 2012 and 2013 Capital Expenditures
We spent $14.6 million on capital expenditures (including capitalized exploration expenditure and work in progress) in the fiscal year ended June 30, 2013. In our North Stockyard project we spent $1.5 million on drilling and constructing a salt water disposal facility. This facility has significantly reduced our salt water disposal costs in this project. We also spent $6.3 million drilling our infill wells in our North Stockyard project. We spent $0.2 million on new equipment in our currently producing wells in our North Stockyard project. We spent $2.5 million on land and seismic information in our South Prairie project in North Dakota. We spent $0.7 million on the acquisition of additional acreage in our Roosevelt project in Montana. We spent $2.4 million in additional costs of our Spirit of America II well in our Hawk Springs project.
During the fiscal year ended June 30, 2012, we spent $45.4 million on capital expenditures (including capitalized exploration expenditure). In our Roosevelt Project in Montana, $24.7 million was spent on drilling activity and $6.9 million was spent on acreage acquisition. In our Hawk Springs Project in Goshen County, Wyoming, we spent $10.0 million on drilling and $1.0 on acreage acquisition. We spent $2.3 million on our North Stockyard Project in Williams County, North Dakota.
Of this expenditure, we wrote off $24.7 million in exploration expenditure in the Statement of Operations as a result of the drilling results from two wells in the Roosevelt Project. We also wrote off $4.9 million in exploration expenditure in the Statement of Operations as a dry hole cost associated with drilling a well in our Hawk Springs Project.
Approximately $8.0 million remains capitalized on the Roosevelt Project.
We spent $6.0 million on capital expenditures in the fiscal year ended June 30, 2011. Almost the entire amount was spent on drilling activity in the oil and gas properties in which we have an interest and, in particular, in the North Stockyard Field in Williams County, North Dakota.
Estimated 2014 Capital Expenditures
Our capital expenditure budget for the year ending June 30, 2014 is estimated at $20 million. We plan to deploy the entire amount drilling eight infill PUD locations at our North Stockyard property in North Dakota.
Any capital expenditure remains dependent on us having the capital required to meet the expenditure. We will not be able to fund all of the planned expenditure from our existing working capital and there is no guarantee we will be able to raise the funds through the debt or equity markets.
Commitments and Contingencies
As of June 30, 2013 the aggregate amounts of contractually obligated payment commitments for the next five years were as follows:
| Contractual Obligations | Total | 2014 | 2015 | 2016 | 2017 | 2018 | Thereafter | |||||||||||||||||||||
| Asset retirement obligations (1) | $ | 868,589 | $ | - | $ | 427,977 | $ | - | $ | - | $ | - | $ | 440,612 | ||||||||||||||
| Operating leases (2) | 412,483 | 134,361 | 136,669 | 131,159 | 10,294 | - | - | |||||||||||||||||||||
| Drilling carry - Rainbow Project | 1,000,000 | 1,000,000 | ||||||||||||||||||||||||||
| Total | 2,281,072 | 1,134,361 | 564,646 | 131,159 | 10,294 | - | 440,612 | |||||||||||||||||||||
| (1) | Asset retirement obligations represent the estimated fair value at June 30, 2013 of our obligations with respect to the retirement/abandonment of our oil and gas properties. Each reporting period the liability is accreted to its then present value. The ultimate settlement amount and the timing of the settlement of such obligations are unknown because they are subject to, among other things, federal, state, local, and tribal regulation and economic factors. |
| (2) | Operating leases relate primarily to obligations associated with our office facilities in Denver, Colorado and Perth, Western Australia. |
Off-Balance Sheet Arrangements
At June 30, 2013, we had no existing off-balance sheet arrangements, as defined under SEC rules, that have or are reasonably likely to have a material current or future effect on our financial condition, revenues or expenses, results of operations, liquidity, capital expenditures or capital resources.
| 44 |
Acquisitions and Divestitures
Acquisitions
During the year ended June 30, 2013 we acquired a net 1,225 acres in two 1,280 acre drilling units located in the Rainbow Project, Williams County, North Dakota. The acquisition involved an acreage trade by the parties and a future carry of the vendor by us in the initial drilling program on the Rainbow Project. We transferred 160 net acres from its 1,200 acre undeveloped acreage holding in North Stockyard and the vendor will fund its share (between 7.5% and 8.5%) of the North Stockyard initial infill program. We have acquired 950 net acres in the Rainbow Project from the vendor for this acreage trade and will provide a $1 million carry (10%) to the vendor, for the first development well to be drilled in the Rainbow Project. We also have the ability, subject to the vendor acquiring additional acres, to acquire a further 274 acres by carrying the vendor for $0.7 million in the second well in the project. During the year ended June 30, 2012 we acquired 37,208 acres in our Roosevelt Project in Roosevelt County, Montana for approximately $6.8 million. We also acquired 2,377 acres in our Hawk Springs Project in Goshen County, Wyoming for approximately $0.56 million.
Divestitures
In August 2013 we divested half our equity position in the undeveloped acreage in the North Stockyard project to Slawson Exploration Company Inc. for $5.562 million in cash and other consideration. We retained our full interest in in the currently producing wells in the North Stockyard field. As a consequence of the transaction we have terminated our rig contract with Frontier, with no penalty payment. Slawson is now the operator of the project going forward for the development of the undeveloped acreage.
Along with the undeveloped acreage, we have also transferred 25% working interest in the drilled but not yet completed Billabong and Sail and Anchor wells. The cash portion of the purchase price is subject to the delivery of a useable well bore in Billabong, valued in the agreement at $0.9 million and other customary post closing adjustments. The Billabong well bore is currently scheduled to undergo a workover operation during October 2013, following the completion of the frac of Sail and Anchor, current scheduled for mid-September 2013.
Trends Affecting Our Results of Operation
Lease Operating Expenses
Lease operating expenses have shown a general rising trend over the past three years. As we are not operator of our material field, these costs are largely outside of our control.
Critical Accounting Policies and Estimates
Our discussion and analysis of our financial condition and results of operations are based upon financial statements that have been prepared in accordance with U.S. GAAP. The preparation of these financial statements requires us to make estimates and judgments that affect the reported amounts of assets, liabilities, revenues and expenses. We have identified certain accounting policies as being of particular importance to the presentation of our financial position and results of operations and which require the application of significant judgment by our management. We analyze our estimates, including those related to oil and natural gas revenues, oil and natural gas properties, exploration and valuation expenditure, share based payments, income taxes and contingencies, and base our estimates on historical experience and various other assumptions that we believe to be reasonable under the circumstances. Actual results may differ from these estimates under different assumptions or conditions. We believe the following critical accounting policies and estimates affect our more significant judgments and estimates used in the preparation of our financial statements.
Exploration and Evaluation Expense
We use the successful efforts method of accounting for exploration and evaluation expenditure in respect of each area of interest. The application of this policy necessarily requires management to make certain estimates and assumptions as to future events and circumstances, in particular the assessment of whether economic quantities of reserves have been found. Any such estimates and assumptions may change as new information becomes available.
Exploration and evaluation assets are assessed for impairment when facts and circumstances indicate that the carrying amount of an exploration and evaluation asset may exceed its recoverable amount. When assessing for impairment consideration is given to but not limited to the following:
| · | the period for which Samson has the right to explore; | |
| · | planned and budgeted future exploration expenditure; | |
| · | activities incurred during the year; and | |
| · | activities planned for future periods. |
| 45 |
If, after having capitalized expenditure under our policy, we conclude that we are unlikely to recover the expenditure by future exploitation or sale, then the relevant capitalized amount will be written off to the income statement.
During the year ended June 30, 2013 we expensed $7.4 million in exploration expenditure written off in relation to our Spirit of America II well in our Hawk Springs project in Goshen County.
Carrying Value of Proved Undeveloped Reserves
Proved undeveloped reserves are expected to be recovered from new wells on undeveloped acreage, from deepening existing wells to a different reservoir or where a relatively major expenditure is required to recomplete an existing well or install production or transportation facilities for primary or improved recovery projects. Estimated development costs on our proved undeveloped fields are approximately $29 million, though we may we obtain additional financing or make other arrangements to develop these properties. Economic development is also heavily dependent upon future commodity prices and the activities of the operators of our properties. As such, the timing of drilling and development activities depends upon a number of factors that are outside of our control. As at the date of this filing, we continue to expect that these fields will ultimately be developed by their operators and that the costs capitalized will be recoverable from future operations, but the timing of such development remains dependent on prevailing prices, particularly for those properties focused on natural gas. Whenever oil and gas properties are developed, however, there is no assurance that there will not be future impairment of the costs incurred to drill the new wells. The carrying value of proved undeveloped assets recorded in the Balance Sheet as at June 30, 2013 was $nil, however, as we have historically not had proved undeveloped reserves.
Reserves Estimates
Our estimates of proved reserves are based on the quantities of oil and gas that geological and engineering data demonstrate, with reasonable certainty, to be recoverable in future years from known reservoirs under existing economic and operating conditions. The accuracy of any reserve estimate is a function of the quality of available data, engineering and geological interpretation, and judgment. For example, Samson must estimate the amount and timing of future operating costs, production, and property taxes, development costs, and workover costs, all of which may in fact vary considerably from actual results. In addition, as prices and cost levels change from year to year, the estimate of proved reserves also changes. Any significant variance in these assumptions could materially affect the estimated quantity and value of our reserves. Despite the inherent imprecision in these engineering estimates, our reserves are used throughout our financial statements. For example, we use the units–of–production method to amortize our oil and gas properties, which means that the quantity of reserves could significantly impact our depletion, depreciation and amortization expense. The value of our reserves also impacts any impairment expense recognized.
Depreciation, Depletion and Amortization for Oil and Gas Properties
The quantities of estimated proved oil and gas reserves are a significant component of our calculation of depletion expense, so revisions in such estimates may alter the rate of future expense. Holding all other factors constant, if reserves were revised upward or downward, earnings would increase or decrease respectively.
Depreciation, depletion and amortization of the cost of proved oil and gas properties are calculated using the unit–of–production method. The reserve base used to calculate depletion, depreciation or amortization is the sum of proved developed reserves and proved undeveloped reserves for leasehold acquisition costs and the cost to acquire proved properties. With respect to lease and well equipment costs, which include development costs and successful exploration drilling costs, the reserve base includes only proved developed reserves. Estimated future dismantlement, restoration and abandonment costs, net of salvage values, are taken into account. Certain other assets are depreciated on a straight–line basis.
Amortization rates are updated four times a year to reflect: 1) the addition of capital costs, 2) reserve revisions (upwards or downwards) and additions, 3) property acquisitions and/or property dispositions, and 4) impairments.
Impairments
Oil and gas lease acquisition and development costs are capitalized when incurred. When circumstances indicate that a producing asset may be impaired, Samson compares expected discounted future cash flows at a producing field level to the unamortized capitalized cost of the asset. If the future discounted cash flows, based on our estimate of future crude oil and natural gas prices, operating costs, anticipated production from proved reserves and other relevant data, are lower than the unamortized capitalized cost, the capitalized cost is reduced to recoverable amount being the higher of fair value less cost to sell and value in use. Value in use is calculated by discounting the future cash flows at an appropriate risk–adjusted pre–tax discount rate.
| 46 |
Asset Retirement Obligations
The accounting standards set forth by the FASB with respect to accounting for asset retirement obligations provide that, if the fair value for asset retirement obligations can be reasonably estimated, the liability should be recognized in the period when it is incurred. Oil and natural gas producing companies incur this liability upon acquiring or drilling a well. Under this method, the retirement obligation is recorded as a liability at its estimated present value at the asset’s inception, with the offsetting charge to property cost. Periodic accretion of discount of the estimated liability is recorded in the income statement. Our asset retirement obligation primarily represents the estimated present value of the amount we will incur to plug, abandon and remediate our properties at the end of their productive lives, in accordance with applicable laws. We have determined our asset retirement obligation by calculating the present value of estimated cash flows related to each liability. The discount rates used to calculate the present value vary depending on the estimated timing of the relevant obligation, but typically ranged between 5% and 9%. We periodically review the estimate of costs to plug, abandon and remediate our properties at the end of their productive lives. This includes a review of both the estimated costs and the expected timing to incur such costs. We believe most of these costs can be estimated with reasonable certainty based upon existing laws and regulatory requirements and based upon wells and facilities currently in place. Any changes in regulatory requirements, which changes cannot be predicted with reasonable certainty, could result in material changes in such costs. Changes in reserve estimates and the economic life of oil and natural gas properties could affect the timing of such costs and accordingly the present value of such costs.
Share Based Payments
We measure the cost of equity settled transactions by reference to the fair value of the equity instruments at the date they are granted. Where the fair value of the equity instrument cannot be readily determined in reference to the market price of our ordinary shares, the fair value is determined using a binomial option pricing model. The use of the binomial option pricing model requires Samson to make estimates in regard to certain inputs required by the model, in particular in regard to the time to expiry of the option and the volatility of our share price. We review inputs to this model each time a valuation is performed with reference to inputs used in the past and recent developments.
Income Taxes and Uncertain Tax Positions
Income taxes reflect the tax effects of transactions reported in the financial statements and consist of taxes currently payable plus deferred income taxes related to certain income and expenses recognized in different periods for financial and income tax reporting purposes. Deferred income tax assets and liabilities represent the future tax return consequences of those differences, which will either be taxable or deductible when assets are recovered or settled. Deferred income taxes are also recognized for tax credits that are available to offset future income taxes. Deferred income taxes are measured by applying current tax rates to the differences between financial statement and income tax reporting. We have recognized a valuation allowance against our net deferred taxes because we cannot conclude that it is more likely than not that the net deferred tax assets will be realized as a result of estimates of our future operating income based on current oil and natural gas commodity pricing. In assessing the realization of deferred tax assets, we consider whether it is more likely than not that some portion or all of the deferred tax assets will be realized. The ultimate realization of deferred tax assets is dependent upon the generation of future taxable income during the periods in which those temporary differences become deductible. We consider the scheduled reversal of deferred tax liabilities, available taxes in carryback periods, projected future taxable income and tax planning strategies in making this assessment. We will continue to evaluate whether the valuation allowance is needed in future reporting periods. We are subject to taxation in many jurisdictions, and the calculation of our income tax liabilities involves dealing with uncertainties in the application of complex income tax laws and regulations in various taxing jurisdictions. We recognize certain income tax positions that meet a more-likely-than not recognition threshold. If we ultimately determine that the payment of these liabilities will be unnecessary, we will reverse the liability and recognize an income tax benefit during the period in which we determine the liability no longer applies.
Capitalized Interest
The Company capitalizes interest to its assets during a period if interest cost is incurred and activities necessary to bring the properties into a productive state are in progress. Development activities consist primarily of drilling wells and installing the necessary equipment for production to commence. Interest capitalization ceases when the wells have been completed. Interest cost is capitalized as a component of each property and is added to the depreciable base of the assets and expensed on a units-of-production basis over the life of the respective field.
No interest has been capitalized during the year ended June 30, 2012 or 2013 as we did not have any outstanding debt, therefore incurred no interest.
Derivatives
The Company periodically uses derivative financial instruments to achieve a more predictable cash flow from its oil and gas production by reducing exposure to price fluctuations. The accounting treatment for the changes in fair value of a derivative instrument is dependent upon whether or not a derivative instrument is cash flow hedge or fair value hedge, and upon whether or not the derivative is designated as a hedge. The Company accounts for such activities pursuant to ASC 815 “Derivatives and Hedging”. In accordance with ASC 815 the Company assesses, as the inception of the transaction and on an ongoing basis, whether the derivative instrument qualifies, or continues to qualify, for hedge accounting treatment. All derivative instruments are initially measured at fair value and recorded on the balance sheet. If the derivative qualifies for hedge accounting, gain or loss arising from changes in fair value of the derivative is either recognized in income or deferred in other comprehensive income to the extent the hedges are effective for cash flow hedges. Any gain or loss resulting from the ineffective portion of a cash flow is included currently in earnings. If the derivative does not qualify as a hedge or is not designated as a hedge, the gain or loss on the derivative is recognized currently in earnings.
| 47 |
Successful efforts
The Company’s oil and gas exploration and production activities are accounted for using the successful efforts method. Under this method, all property acquisition costs and costs of drilling exploratory wells are capitalized when incurred, pending determination of whether the well has found proved reserves. Costs of drilling development wells are capitalized regardless of the success of the well. Exploratory dry hole costs, lease rentals and geological and geophysical costs are charged to expense as incurred. Upon surrender of undeveloped properties, the original cost of such properties is charged against income.
Recently Adopted Accounting Standards
Presentation of Comprehensive Income . On June 16, 2011, the FASB issued changes related to the presentation of comprehensive income. These changes eliminate the current option to report other comprehensive income and its components in the statement of changes in equity. These changes are intended to enhance comparability between entities that report under U.S. GAAP and those that report under IFRS, and to provide a more consistent method of presenting non-owner transactions that affect an entity's equity. An entity may elect to present items of net income and other comprehensive income in one continuous statement, referred to as the statement of comprehensive income, or in two separate, but consecutive, statements. Each component of net income and each component of other comprehensive income, together with totals for comprehensive income and its two parts, net income and other comprehensive income, would need to be displayed under either alternative. The statement(s) would need to be presented with equal prominence as the other primary financial statements. The new requirement is effective for public entities as of the beginning of a fiscal year that begins after December 15, 2011, and interim and annual periods thereafter. Early adoption is permitted, but full retrospective application is required under both sets of accounting standards. The adoption of this standard did have a material impact on our financial statements.
Fair Value Measurement . On May 12, 2011, the FASB issued changes related to fair value measurement. The changes represent the converged guidance of the FASB and the International Accounting Standards Board (“IASB”) on fair value measurement. Many of the changes eliminate unnecessary wording differences between International Financial Reporting Standards (“IFRS”) and U.S. GAAP. The changes expand existing disclosure requirements for fair value measurements categorized in Level 3 by requiring (1) a quantitative disclosure of the unobservable inputs and assumptions used in the measurement, (2) a description of the valuation processes in place and (3) a narrative description of the sensitivity of the fair value to changes in unobservable inputs and the interrelationships between those inputs. In addition, the changes also require the categorization by level in the fair value hierarchy of items that are not measured at fair value in the statement of financial position whose fair value must be disclosed. These changes are to be applied prospectively and are effective for public entities during interim and annual periods beginning after December 15, 2011. With the exception of the disclosure requirements, the adoption of these changes did not have a significant impact on our financial statements.
Recently Issued Accounting Pronouncements
ASU 2013-04, Liabilities (Topic 405): Obligations Resulting from Joint and Several Liability Arrangements for which the Total Amount of the Obligation is Fixed at the Reporting Date. The objective of the amendments in this Update is to provide consistency in the recognition, measurement, and disclosure of obligations resulting from joint and several liability arrangements for which the total amount of the obligation within the scope of this guidance is fixed at the reporting date. This Update requires an entity to measure obligations resulting from joint and several liability arrangements for which the total amount of the obligation within the scope of this guidance is fixed at the reporting date, as the sum of the following: (a) the amount the reporting entity agreed to pay on the basis of its agreement among its co-obligors; and (b) any additional amount the reporting entity expects to pay on behalf of its co-obligors. The guidance in the Update also requires disclosures about the nature as well as other information about the obligations. For public entities, the amendments in this Update are effective for fiscal years, and interim periods within those years, beginning after December 15, 2013. Retrospective application is required. Early adoption is permitted. We have not yet begun the process of assessing the impact of this standard on our financial statements and do not except to adopt the standard earlier than its effective date.
| Item 7A. | Quantitative and Qualitative Disclosures About Market Risk |
Market risk represents the risk of loss that may impact our financial position, results of operations, or cash flows due to adverse changes in financial market prices, including interest rate risk, foreign currency exchange rate risk, commodity price risk, and other relevant market or price risks.
Commodities Price Risk. Our financial condition, results of operations and capital resources are dependent upon the prevailing market prices of oil and natural gas. These commodity prices are subject to wide fluctuations and market uncertainties due to a variety of factors that are beyond our control. Factors influencing oil and natural gas prices include the level of global demand for crude oil, the foreign supply of oil and natural gas, the establishment of and compliance with production quotas by oil exporting countries, weather conditions which determine the demand for natural gas, the price and availability of alternative fuels and overall economic conditions. It is impossible to predict future oil and natural gas prices with any degree of certainty. Sustained weakness in oil and natural gas prices may adversely affect our financial condition and results of operations, and may also reduce the amount of oil and natural gas reserves that we can produce economically. Any reduction in our oil and natural gas reserves, including reductions due to price fluctuations, can have an adverse effect on our ability to obtain capital for our development activities.
| 48 |
Impact of a change in oil and gas prices for the year ended June 30, 2013
| $ value of impact on net loss | % value of impact on net loss | |||||||||||
| Increase of 10% in oil and gas prices | Decrease by | $ | 580,012 | Decrease by | 4.95 | % | ||||||
| Decrease of 10% in oil and gas prices | Increase by | $ | 580,012 | Increase by | 4.95 | % | ||||||
Impact of a change in oil and gas prices for the year ended June 30, 2012
| $ value of impact on net loss | % value of impact on net loss | |||||||||||
| Increase of 10% in oil and gas prices | Decrease by | $ | 837,344 | Decrease by | 2.68 | % | ||||||
| Decrease of 10% in oil and gas prices | Increase by | $ | 837,344 | Increase by | 2.68 | % | ||||||
Impact of a change in oil and gas prices for the year ended June 30, 2011
| $ value of impact on net profit | % value of impact on net profit | |||||||||||
| Increase of 10% in oil and gas prices | Increase by | $ | 672,034 | Decrease by | 1.24 | % | ||||||
| Decrease of 10% in oil and gas prices | Decrease by | $ | 672,034 | Increase by | 1.24 | % | ||||||
Interest Rate Risk. We have minimal interest rate risk as we have no debt and do not rely on cash from interest revenue as a source of capital.
Foreign Currency Risk. As our assets, liabilities and financial transactions are primarily denominated in U.S. dollar, we changed our presentation currency during the prior year to U.S. dollar. This has reduced the impact of fluctuations in the exchange rate on our financial statements and the foreign currency risk associated with our financial statements. We currently hold approximately US$7.3 million equivalent to A$7.9 million, in Australian dollars with the National Australia Bank in Australia. These funds are in part used to pay Australian dollar expenses incurred by our office in Perth, Western Australia, though a portion maybe repatriated to the United States in the foreseeable future. As a result, we may experience foreign currency gains or losses, which may positively or negatively affect our results of operations attributed to these balances.
| Item 8. | Financial Statements and Supplementary Data |
See “Index to Consolidated Financial Statements” on page 66 of this report.
| Item 9. | Changes in and Disagreements with Accountants on Accounting and Financial Disclosure |
None.
| Item 9A. | Controls and Procedures |
Evaluation of Disclosure Controls and Procedures. We conducted an evaluation of the effectiveness of the design and operation of our disclosure controls and procedures (as defined in Rule 13a-15(e) under the Securities Exchange Act of 1934 (the “Exchange Act ” )) as of June 30, 2013. This evaluation was conducted under the supervision and with the participation of management, including our Chief Executive Officer and Chief Financial Officer. Based on this evaluation, our Chief Executive Officer and Chief Financial Officer have concluded that, as of June 30, 2013, our disclosure controls and procedures were effective to ensure that information required to be disclosed by us in reports filed or submitted under the Exchange Act is recorded, processed, summarized and reported within the time periods specified by the rules and forms of the SEC, and that information required to be disclosed by us in such reports is accumulated and communicated to our management, including our Chief Executive Officer and Chief Financial Officer, as appropriate to allow timely decisions regarding required disclosure.
Management’s Annual Report on Internal Control over Financial Reporting. Our management is responsible for establishing and maintaining adequate internal control over financial reporting (as defined in Rules 13a-15(f) and 15d-15(f) under the Exchange Act) to provide reasonable assurance regarding the reliability of our financial reporting and the preparation of financial statements for external reporting purposes in accordance with U.S. generally accepted accounting principles. Internal control over financial reporting includes those policies and procedures that (i) pertain to the maintenance of records that in reasonable detail accurately and fairly reflect the transactions and dispositions of assets of the company, (ii) provide reasonable assurance that transactions are recorded as necessary to permit preparation of financial statements in accordance with generally accepted accounting principles, and that receipts and expenditures of the company are being made only in accordance with authorizations of management and directors of the company and (iii) provide reasonable assurance regarding prevention or timely detection of unauthorized acquisition, use or disposition of the company’s assets that could have a material effect on the financial statements.
| 49 |
Under the supervision and with the participation of our management, including our CEO and CFO, we assessed the effectiveness of our internal control over financial reporting as of June 30, 2013, the end of our fiscal year. This assessment was based on criteria established in Internal Control—Integrated Framework issued by the Committee of Sponsoring Organizations of the Treadway Commission. Based on our assessment, management has concluded that our internal control over financial reporting was effective as of June 30, 2013.
The effectiveness of our internal control over financial reporting as of June 30, 2013 has been audited by our independent registered public accounting firm, as stated in their report which is included herein.
Changes in Internal Control over Financial Reporting. There have been no changes in our internal control over financial reporting during the quarter ended June 30, 2013 that have materially affected, or are reasonably likely to materially affect, our internal control over financial reporting.
| Item 9B. | Other Information |
None.
| 50 |
| Item 10. | Directors, Executive Officers and Corporate Governance |
Information relating to this item will be included in an amendment to this report or in the proxy statement for our 2012 annual shareholders’ meeting and is incorporated by reference in this report. Certain information concerning our executive officers is set forth in “Item 1 and 2—Business and Properties—Executive Officers.”
| Item 11. | Executive Compensation |
Information relating to this item will be included in an amendment to this report or in the proxy statement for our 2013 annual shareholders meeting and is incorporated by reference in this report.
| Item 12. | Security Ownership of Certain Beneficial Owners and Management and Related Stockholder Matters |
Information relating to this item will be included in an amendment to this report or in the proxy statement for our 2013 annual shareholders’ meeting and is incorporated by reference in this report.
| Item 13. | Certain Relationships and Related Transactions, and Director Independence |
Information relating to this item will be included in an amendment to this report or in the proxy statement for our 2013 annual shareholders’ meeting and is incorporated by reference in this report.
| Item 14. | Principal Accounting Fees and Services |
Information relating to this item will be included in an amendment to this report or in the proxy statement for our 2013 annual shareholders’ meeting and is incorporated by reference in this report.
| Item 15. | Exhibits and Financial Statement Schedules |
Financial Statements and Financial Statement Schedules
See “Index to Consolidated Financial Statements” on page 66.
Exhibits – to be updated
| Number | Description |
| 3 | Constitution of Samson Oil & Gas Limited (incorporated by reference to Exhibit 1 to the Registration Statement on Form 20-F filed on July 6, 2007, as amended by Form 20-F/A). |
| 4 | Form of Deposit Agreement between Samson Oil & Gas Limited and The Bank of New York (incorporated by reference to Exhibit 1 to the Registration Statement on Form F-6EF filed on April 29, 2010). |
| 10.4 | Employment Agreement between Samson Oil and Gas USA, Inc. and Terence Barr, dated as of January 1, 2011 (incorporated by reference to Exhibit 10.4 to the Annual Report on Form 10-K filed on September 13, 2012). |
| 10.5 | Amendment to Employment Agreement between Samson Oil and Gas USA, Inc. and Terence Barr, dated as of December 20, 2011 (incorporated by reference to Exhibit 10.1 to the Current Report on Form 8-K filed on December 27, 2011). |
| 51 |
| 10.6 | Employment Agreement between Samson Oil and Gas USA, Inc. and Robyn Lamont, dated as of January 1, 2011 (incorporated by reference to Exhibit 10.5 to the Annual Report on Form 10-K filed on September 13, 2012). |
| 10.7 | Employment Agreement between Samson Oil and Gas USA, Inc. and David Ninke, dated as of January 1, 2011 (incorporated by reference to Exhibit 10.6 to the Annual Report on Form 10-K filed on September 13, 2012). |
| 10.8 | Employment Agreement between Samson Oil and Gas USA, Inc. and Daniel Gralla, dated as of January 1, 2011 (incorporated by reference to Exhibit 10.7 to the Annual Report on Form 10-K filed on September 13, 2012). |
| 10.9 | Samson Oil & Gas Limited Stock Option Plan (incorporated by reference to Exhibit 4.1 to the Registration Statement on Form S-8 of Samson Oil & Gas Limited filed on April 21, 2011) (incorporated by reference to Exhibit 10.7 to the Annual Report on Form 10-K filed on September 13, 2012). |
| 10.10 | 2013 Bonus Plan (incorporated by reference to the Current Report on Form 8-K filed on August 16, 2013). |
| 10.11 | Purchase and Sale Agreement with Slawson Exploration Company, Inc. dated August 15, 2013 (incorporated by reference to Exhibit 10.1 to the Current Report on Form 8-K filed on March 20, 2013). |
| 10.12 | Form of Subscription Agreement dated March 20, 2013 (incorporated by reference to Exhibit 10.1 to the Current Report on Form 8-K filed on March 22, 2013). |
| 10.13 | Form of Subscription Agreement dated August 19, 2013 (incorporated by reference to Exhibit 10.1 to the Current Report on Form 8-K filed on August 22, 2013). |
| 21 | List of Subsidiaries (incorporated by reference to Exhibit 21 to the Annual Report on Form 10-K filed on September 13, 2012). |
| 23.1 | Consent of PricewaterhouseCoopers LLP. |
| 23.2 | Consent of Ryder Scott Company, L.P. |
| 31.1 | Certification of the Principal Executive Officer pursuant to Rule 13a–14(a) and Rule 15d–14(a) of the Securities Exchange Act of 1934, as amended. |
| 31.2 | Certification of the Principal Financial Officer pursuant to Rule 13a–14(a) and Rule 15d–14(a) of the Securities Exchange Act of 1934, as amended. |
| 32 | Certifications of the Principal Executive Officer and Principal Financial Officer pursuant to 18 USC 1350, as adopted, pursuant to Section 906 of the Sarbanes–Oxley Act of 2002. |
| 99 | Report of Ryder Scott Company, L.P. Regarding the Registrant’s Reserves as of June 30, 2013. |
| 52 |
Pursuant to the requirements of Section 13 or 15(d) of the Securities Exchange Act of 1934, the registrant has duly caused this report to be signed on its behalf by the undersigned, thereunto duly authorized.
| Samson Oil and Gas Limited | ||
| By: | /s/Terence Barr | |
| Name: | Terence Barr | |
| Title: | Managing Director, President and Chief Executive Officer | |
| Date: | September 16, 2013 | |
Pursuant to the requirements of the Securities Exchange Act of 1934, this report has been signed below by the following persons on behalf of the registrant and in the capacities and on the dates indicated.
| Signature | Title | Date |
| /s/Terence Barr | Managing Director, President and Chief Executive Officer (Principal Executive Officer) |
September 16, 2013 |
| Terence Barr | ||
| /s/Robyn Lamont | Chief Financial Officer (Principal Financial Officer) | September 16, 2013 |
| Robyn Lamont | ||
| /s/Victor Rudenno | Director | September 16, 2013 |
| Victor Rudenno | ||
| /s/Keith Skipper | Director | September 16, 2013 |
| Keith Skipper | ||
| /s/DeAnn Craig | Director | September 16, 2013 |
| DeAnn Craig |
| 53 |
INDEX TO CONSOLIDATED FINANCIAL STATEMENTS
| 54 |
REPORT OF INDEPENDENT REGISTERED PUBLIC ACCOUNTING FIRM
To the Board of Directors and Shareholders of Samson Oil & Gas Limited
In our opinion, the accompanying consolidated balance sheets and the related consolidated statements of operations and comprehensive income, of stockholders' equity, and cash flows present fairly, in all material respects, the financial position of Samson Oil & Gas Limited and its subsidiaries at June 30, 2013 and June 30, 2012, and the results of their operations and their cash flows for each of the three years in the period ended June 30, 2013 in conformity with accounting principles generally accepted in the United States of America. Also in our opinion, the Company maintained, in all material respects, effective internal control over financial reporting as of June 30, 2013, based on criteria established in Internal Control - Integrated Framework issued by the Committee of Sponsoring Organizations of the Treadway Commission (COSO). The Company's management is responsible for these financial statements, for maintaining effective internal control over financial reporting and for its assessment of the effectiveness of internal control over financial reporting, included in Management's Report on Internal Control over Financial Reporting appearing under Item 9A. Our responsibility is to express opinions on these financial statements and on the Company's internal control over financial reporting based on our integrated audits. We conducted our audits in accordance with the standards of the Public Company Accounting Oversight Board (United States). Those standards require that we plan and perform the audits to obtain reasonable assurance about whether the financial statements are free of material misstatement and whether effective internal control over financial reporting was maintained in all material respects. Our audits of the financial statements included examining, on a test basis, evidence supporting the amounts and disclosures in the financial statements, assessing the accounting principles used and significant estimates made by management, and evaluating the overall financial statement presentation. Our audit of internal control over financial reporting included obtaining an understanding of internal control over financial reporting, assessing the risk that a material weakness exists, and testing and evaluating the design and operating effectiveness of internal control based on the assessed risk. Our audits also included performing such other procedures as we considered necessary in the circumstances. We believe that our audits provide a reasonable basis for our opinions.
A company’s internal control over financial reporting is a process designed to provide reasonable assurance regarding the reliability of financial reporting and the preparation of financial statements for external purposes in accordance with generally accepted accounting principles. A company’s internal control over financial reporting includes those policies and procedures that (i) pertain to the maintenance of records that, in reasonable detail, accurately and fairly reflect the transactions and dispositions of the assets of the company; (ii) provide reasonable assurance that transactions are recorded as necessary to permit preparation of financial statements in accordance with generally accepted accounting principles, and that receipts and expenditures of the company are being made only in accordance with authorizations of management and directors of the company; and (iii) provide reasonable assurance regarding prevention or timely detection of unauthorized acquisition, use, or disposition of the company’s assets that could have a material effect on the financial statements.
Because of its inherent limitations, internal control over financial reporting may not prevent or detect misstatements. Also, projections of any evaluation of effectiveness to future periods are subject to the risk that controls may become inadequate because of changes in conditions, or that the degree of compliance with the policies or procedures may deteriorate.
/s/PricewaterhouseCoopers LLP
Denver, Colorado
September 16, 2013
| 55 |
SAMSON OIL & GAS LIMITED AND SUBSIDIARIES
CONSOLIDATED BALANCE SHEETS
| June 30 | ||||||||
| 2013 | 2012 | |||||||
| ASSETS | ||||||||
| CURRENT ASSETS | ||||||||
| Cash and cash equivalents | $ | 13,170,627 | $ | 18,845,894 | ||||
| Accounts receivable, net of allowance for doubtful accounts of $nil and $nil respectively | 3,090,666 | 1,288,159 | ||||||
| Prepayments | 411,113 | 344,108 | ||||||
| Pipe inventory – held by third party | 78,944 | 78,944 | ||||||
| Income tax receivable | 777,804 | 4,347,456 | ||||||
| Total current assets | 17,529,154 | 24,904,561 | ||||||
| PROPERTY, PLANT AND EQUIPMENT, AT COST | ||||||||
| Oil and gas properties, successful efforts method of accounting, less accumulated depreciation, depletion and impairment | 19,992,018 | 13,890,380 | ||||||
| Other property and equipment, net of accumulated depreciation and amortization of $351,037 and $252,254 at June 30, 2013 and June 2012, respectively | 367,657 | 448,061 | ||||||
| Net property, plant and equipment | 20,359,675 | 14,338,441 | ||||||
| OTHER ASSETS | ||||||||
| Undeveloped capitalized acreage | 12,369,412 | 10,017,287 | ||||||
| Capitalized exploration expense | 2,468,934 | 6,362,989 | ||||||
| Other | 79,490 | 99,961 | ||||||
| TOTAL ASSETS | $ | 52,806,665 | $ | 55,723,239 | ||||
| LIABILITIES AND STOCKHOLDERS’ EQUITY | ||||||||
| CURRENT LIABILITIES | ||||||||
| Accounts payable | $ | 1,381,407 | $ | 5,269,748 | ||||
| Accrued liabilities | 5,406,982 | 1,229,982 | ||||||
| Provision for annual leave | 242,368 | 234,536 | ||||||
| Total current liabilities | 7,030,757 | 6,734,266 | ||||||
| Capitalized lease | - | 7,322 | ||||||
| Asset retirement obligations | 868,589 | 808,572 | ||||||
| Total liabilities | 7,899,346 | 7,550,160 | ||||||
| STOCKHOLDERS’ EQUITY – nil par value | ||||||||
| Common stock, 2,229,165,163 (equivalent to 111,458,258 ADRs) and 1,771,891,827 (equivalent to 88,594,591 ADRs) shares issued and outstanding at June 30, 2013 and 2012, respectively) | 92,717,784 | 83,467,987 | ||||||
| Other comprehensive income | 1,978,250 | 2,772,758 | ||||||
| Retained earnings (accumulated deficit) | (49,788,715 | ) | (38,067,666 | ) | ||||
| Total stockholders’ equity | 44,907,319 | 48,173,079 | ||||||
| TOTAL LIABILITIES AND STOCKHOLDERS’ EQUITY | $ | 52,806,665 | $ | 55,723,239 | ||||
See accompanying Notes to Consolidated Financial Statements.
| 56 |
SAMSON OIL & GAS LIMITED AND SUBSIDIARIES
CONSOLIDATED STATEMENTS OF OPERATIONS AND COMPREHENSIVE INCOME
| June 30 | ||||||||||||
| 2013 | 2012 | 2011 | ||||||||||
| REVENUES AND OTHER INCOME: | ||||||||||||
| Oil sales | $ | 5,028,050 | $ | 7,352,494 | $ | 5,038,446 | ||||||
| Gas sales | 772,073 | 1,020,945 | 930,330 | |||||||||
| Other liquids | 3,985 | 12,360 | - | |||||||||
| Interest income | 253,150 | 355,357 | 368,251 | |||||||||
| Gain on sale of exploration acreage | - | 0 | 73,199,687 | |||||||||
| Other | 211,736 | 58,598 | 2,245 | |||||||||
| TOTAL REVENUE AND OTHER INCOME | 6,268,994 | 8,799,754 | 79,538,959 | |||||||||
| EXPENSES: | ||||||||||||
| Lease operating expense | (3,466,339 | ) | (2,789,902 | ) | (1,678,510 | ) | ||||||
| Depletion, depreciation and amortization | (1,975,932 | ) | (2,776,005 | ) | (1,832,558 | ) | ||||||
| Impairment of oil and natural gas properties | (259,529 | ) | (635,464 | ) | - | |||||||
| Exploration and evaluation expenditure | (7,929,204 | ) | (30,559,458 | ) | (404,031 | ) | ||||||
| Accretion of asset retirement obligations | (55,326 | ) | (23,603 | ) | (23,909 | ) | ||||||
| General and administrative | (6,313,993 | ) | (7,880,966 | ) | (8,561,734 | ) | ||||||
| Interest expense, net of capitalized costs | - | 0 | (906,838 | ) | ||||||||
| TOTAL EXPENSES | (20,000,323 | ) | (44,665,398 | ) | (13,407,580 | ) | ||||||
| Income (loss) from continuing operations | (13,731,329 | ) | (35,865,644 | ) | 66,131,379 | |||||||
| Income tax (provision)/ benefit | 2,010,280 | 4,629,193 | (14,695,544 | ) | ||||||||
| Earnings from continuing operations | (11,721,049 | ) | (31,236,451 | ) | 51,435,835 | |||||||
| Total income (loss) from discontinued operations, net of income taxes | - | 0 | 2,712,387 | |||||||||
| Net income (loss) | $ | (11,721,049 | ) | $ | (31,236,451 | ) | $ | 54,148,222 | ||||
| OTHER COMPREHENSIVE GAIN (LOSS) | ||||||||||||
| Foreign Currency Translation gain (loss) | (794,508 | ) | (317,037 | ) | 1,253,147 | |||||||
| Total comprehensive (loss)/gain for the period | $ | (12,515,557 | ) | $ | (31,553,488 | ) | $ | 55,401,369 | ||||
| Net earnings per common share from continuing operations: | ||||||||||||
| Basic – cents per share | (0.61 | ) | (1.78 | ) | 3.06 | |||||||
| Diluted – cents per share | (0.61 | ) | (1.78 | ) | 2.61 | |||||||
| Net earnings per common share from discontinued operations: | ||||||||||||
| Basic – cents per share | - | - | 0.16 | |||||||||
| Diluted – cents per share | - | - | 0.14 | |||||||||
| Weighted average common shares outstanding: | ||||||||||||
| Basic | 1,935,438,970 | 1,752,408,357 | 1,680,247,878 | |||||||||
| Diluted | 1,935,438,970 | 1,752,408,357 | 1,968,053,691 | |||||||||
See accompanying Notes to Consolidated Financial Statements.
| 57 |
SAMSON OIL & GAS LIMITED AND SUBSIDIARIES
CONSOLIDATED STATEMENTS OF CHANGES IN STOCKHOLDERS’ EQUITY
| Retained | Other | |||||||||||||||
| Issued | Earnings/(Accumulated | Comprehensive | ||||||||||||||
| Capital | Deficit) | Income (Loss) | Total Equity | |||||||||||||
| Balance at July 1, 2010 | $ | 78,133,694 | $ | (60,979,437 | ) | $ | 1,836,648 | $ | 18,990,905 | |||||||
| Net Income | - | 54,148,222 | - | 54,148,222 | ||||||||||||
| Foreign currency translation | - | - | 1,253,147 | 1,253,147 | ||||||||||||
| Total comprehensive income for the period | - | 54,148,222 | 1,253,147 | 55,401,369 | ||||||||||||
| Share based payment | 150,617 | - | - | 150,617 | ||||||||||||
| Stock based compensation | 2,322,860 | - | - | 2,322,860 | ||||||||||||
| Issue of share capital | 1,098,028 | - | - | 1,098,028 | ||||||||||||
| Share issue costs | (37,114 | ) | - | - | (37,114 | ) | ||||||||||
| Balance at June 30, 2011 | $ | 81,668,085 | $ | (6,831,215 | ) | $ | 3,089,795 | $ | 77,926,665 | |||||||
| Net loss | - | (31,236,451 | ) | - | (31,236,451 | ) | ||||||||||
| Foreign currency translation | - | - | (317,037 | ) | (317,037 | ) | ||||||||||
| Total comprehensive loss for the period | - | (31,236,451 | ) | (317,037 | ) | (31,553,488 | ) | |||||||||
| Stock based compensation | 1,167,801 | - | - | 1,167,801 | ||||||||||||
| Issue of share capital | 632,101 | - | - | 632,101 | ||||||||||||
| Balance at June 30, 2012 | $ | 83,467,987 | $ | (38,067,666 | ) | $ | 2,772,758 | $ | 48,173,079 | |||||||
| Net loss | - | (11,721,049 | ) | - | (11,721,049 | ) | ||||||||||
| Foreign currency translation | - | - | (794,508 | ) | (794,508 | ) | ||||||||||
| Total comprehensive loss for the period | - | (11,721,049 | ) | (794,508 | ) | (12,515,557 | ) | |||||||||
| Stock based compensation | 199,437 | - | - | 199,437 | ||||||||||||
| Issue of share capital | 9,409,451 | 9,409,451 | ||||||||||||||
| Share issue costs | (359,091 | ) | - | - | (359,091 | ) | ||||||||||
| Balance at June 30, 2013 | $ | 92,717,784 | $ | (49,788,715 | ) | $ | 1,978,250 | $ | 44,907,319 | |||||||
See accompanying Notes to Consolidated Financial Statements.
| 58 |
SAMSON OIL & GAS LIMITED AND SUBSIDIARIES
CONSOLIDATED STATEMENTS OF CASH FLOWS
| June 30 | ||||||||||||
| 2013 | 2012 | 2011 | ||||||||||
| Cash flows from operating activities | ||||||||||||
| Receipts from customers | $ | 6,301,239 | $ | 8,778,983 | $ | 6,281,825 | ||||||
| Cash received from commodity derivative financial instruments | - | 38,508 | 152,171 | |||||||||
| Payments to suppliers & employees | (9,952,928 | ) | (9,296,930 | ) | (7,073,109 | ) | ||||||
| Interest received | 253,000 | 355,945 | 368,251 | |||||||||
| Interest paid | - | - | (878,528 | ) | ||||||||
| Income taxes paid | 5,581,000 | 2,943,975 | (9,360,000 | ) | ||||||||
| Net cash flows provided by/ (used in) operating activities | 2,182,311 | 2,820,481 | (10,509,390 | ) | ||||||||
| Cash flows from investing activities | ||||||||||||
| Proceeds from sale of listed shares | - | - | 49,040 | |||||||||
| Proceeds from sale of exploration acreage | - | - | 73,199,687 | |||||||||
| Proceeds from sale of oil and gas properties | - | - | 6,262,374 | |||||||||
| Payments for plant & equipment | (24,000 | ) | (189,599 | ) | (280,663 | ) | ||||||
| Payments for exploration and evaluation | (11,253,246 | ) | (39,987,483 | ) | (3,751,769 | ) | ||||||
| Payments for oil and gas properties | (6,127,878 | ) | (2,555,201 | ) | (6,040,563 | ) | ||||||
| Net cash flows (used in)/ provided by investing activities | (17,405,124 | ) | (42,732,283 | ) | 69,438,106 | |||||||
| Cash flows from financing activities | ||||||||||||
| Proceeds from issue of share capital | 9,409,000 | 632,101 | 3,969,374 | |||||||||
| Repayment of borrowings | - | - | (11,386,247 | ) | ||||||||
| Payments for costs associated with capital raising | (359,000 | ) | - | (244,282 | ) | |||||||
| Net cash flows (used in)/ provided by financing activities | 9,050,000 | 632,101 | (7,661,155 | ) | ||||||||
| Net (decrease)/ increase in cash and cash equivalents | (6,172,813 | ) | (39,279,701 | ) | 51,267,561 | |||||||
| Cash and cash equivalents at the beginning of the year | 18,845,894 | 58,448,477 | 5,885,735 | |||||||||
| Effects of exchange rate changes on cash and cash equivalents | 497,546 | (322,882 | ) | 1,295,181 | ||||||||
| Cash and cash equivalents at end of year | $ | 13,170,627 | $ | 18,845,894 | $ | 58,448,477 | ||||||
See accompanying Notes to Consolidated Financial Statements.
| 59 |
SAMSON OIL & GAS LIMITED AND SUBSIDIARIES
NOTES TO CONSOLIDATED FINANCIAL STATEMENTS
| 1. | SUMMARY OF SIGNIFICANT ACCOUNTING POLICIES |
Description of Operations. Samson Oil & Gas Limited and its consolidated subsidiaries (“Samson” or the “Company”), is engaged in the acquisition, exploration, exploitation and development of oil and natural gas properties with a focus on properties in North Dakota, Montana and Wyoming.
Principles of Consolidation. The consolidated financial statements include the accounts of the Company and its subsidiaries, all of which are wholly owned. All intercompany balances and transactions have been eliminated in consolidation.
Use of Estimates. The preparation of financial statements in conformity with accounting principles generally accepted in the United States of America (GAAP) requires management to make estimates and assumptions that affect the reported amounts of assets and liabilities and disclosure of contingent assets and liabilities at the date of the financial statements and the reported amounts of revenues and expenses during the reporting period. Items subject to such estimates and assumptions include (1) oil and gas reserves; (2) cash flow estimates used in impairment tests of long–lived assets; (3) depreciation, depletion and amortization; (4) asset retirement obligations; (5) assigning fair value and allocating purchase price in connection with business combinations; (6) accrued revenue and related receivables; (7) valuation of commodity and interest derivative instruments; (8) accrued liabilities; (9) valuation of share-based payments and (10) income taxes. Although management believes these estimates are reasonable, actual results could differ from these estimates. The Company has evaluated subsequent events and transactions for matters that may require recognition or disclosure in these financial statements.
Business Segment Information. The Company has evaluated how it is organized and managed and has identified only one operating segment, which is the exploration and production of crude oil, natural gas and natural gas liquids. All of the Company's operations and assets are located in the United States, and all of its revenues are attributable to United States customers.
Revenue Recognition and Gas Imbalances. Revenues from the sale of natural gas and crude oil are recognized when the product is delivered at a fixed or determinable price, title has transferred and collectability is reasonably assured and evidenced by a contract. This generally occurs when a barge completes delivery, oil or natural gas has been delivered to a refinery or a pipeline, or has otherwise been transferred to a customer's facilities or possession. Oil revenues are generally recognized based on actual volumes of completed deliveries where title has transferred. Title to oil sold is typically transferred at the wellhead.
The Company uses the entitlement method of accounting for natural gas revenues. Under this method, revenues are recognized based on actual production of natural gas. The Company incurs production gas volume imbalances in the ordinary course of business. Net deliveries in excess of entitled amounts are recorded as liabilities, while net under–deliveries are reflected as assets. Imbalances are reduced either by subsequent recoupment of over– and under– deliveries or by cash settlement, as required by applicable contracts. The Company's production imbalances were not material at June 30, 2013 or 2012.
Other income in the prior year primarily includes amounts from derivative contracts and interest from cash held. Other income in the current year, also includes a non-refundable deposit received by us in relation to the sale of our acreage position in our Roosevelt project in Roosevelt County, Montana. This sale did not close and the purchase and sale agreement associated it was terminated.
Cash and Cash Equivalents. The Company considers all highly liquid investments purchased with an original maturity of three months or less to be cash equivalents. The Company’s cash management process provides for the daily funding of checks as they are presented to the bank. Bank overdrafts are included within borrowings in current liabilities on the balance sheet.
Accounts Receivable. The components of accounts receivable include the following:
| June 30 | ||||||||
| 2013 | 2012 | |||||||
| Oil and natural gas sales related | $ | 818,820 | $ | 860,749 | ||||
| Cost recovery from JV partners | 2,214,940 | 379,130 | ||||||
| Other | 56,906 | 48,280 | ||||||
| Total accounts receivable, net of nil allowance for doubtful accounts for June 30, 2013 and 2012 | $ | 3,090,666 | $ | 1,288,159 | ||||
The Company's accounts receivable result from (i) oil and natural gas sales to oil and intrastate gas pipeline companies and (ii) billings to joint working interest partners in properties operated by the Company. The Company's trade and accrued production receivables are dispersed among various customers and purchasers and most of the Company's significant purchasers are large companies with solid credit ratings.
| 60 |
The cost recovery from JV partners relates to JV partners share of drilling costs associated with the current drilling program in our North Stockyard infill project.
Inventories. Inventories are comprised of tubular goods and well equipment held by a third party. All inventory balances are carried at lower of average cost or market.
Accruals. The components of accrued liabilities for the years ended June 30, 2013 and 2012 are as follows:
| 2013 | 2012 | |||||||
| Bonus Accrual | - | 133,168 | ||||||
| Other accruals | 5,406,982 | 1,096,814 | ||||||
| $ | 5,406,982 | $ | 1,229,982 | |||||
The bonus accrual for June 30, 2012 was $133,168 and has been determined from meeting a number of targets as set forth by the Board of Directors and Compensation Committee. The bonus was paid in September 2012.
A bonus plan is in place for the calendar year ended December 31, 2013, which is at the discretion of the Compensation Committee and is capped at 20% of each employees total bonus pool. No bonus payment has been accrued for year ended June 30, 2013.
The majority of other accruals in the current year relate to expenses incurred in relation to our infill drilling program in our North Stockyard field in North Dakota.
Oil and Natural Gas Properties.
Oil and gas properties and equipment consist of the following at June 30:
| 2013 | 2012 | |||||||
| Proved properties | $ | 26,657,972 | $ | 25,785,108 | ||||
| Lease and well equipment | 5,371,923 | 4,217,803 | ||||||
| Work in progress | 6,344,040 | - | ||||||
| Less accumulated depreciation, depletion and impairment | (18,381,917 | ) | (16,112,531 | ) | ||||
| $ | 19,992,018 | $ | 13,890,380 | |||||
| Undeveloped acreage | $ | 12,369,412 | $ | 10,017,287 | ||||
The Company accounts for its oil and gas exploration and development costs using the successful efforts method. Geological and geophysical costs are expensed as incurred. Exploratory well costs are capitalized pending further evaluation of whether economically recoverable reserves have been found. If economically recoverable reserves are not found, exploratory well costs are expensed as dry holes. All exploratory wells are evaluated for economic viability within one year of well completion, and the related capitalized costs are reviewed quarterly.
Exploratory wells that discover potentially economic reserves in areas where a major capital expenditure would be required before production could begin and where the economic viability of that major capital expenditure depends upon the successful completion of further exploratory work in the area remain capitalized if the well finds a sufficient quantity of reserves to justify its completion as a producing well and the Company is making sufficient progress assessing the reserves and the economic and operating viability of the project.
The costs of development wells are capitalized whether productive or nonproductive. The provision for depletion of oil and gas properties is calculated on a field–by–field basis using the unit–of–production method. If the estimates of total proved or proved developed reserves decline, the rate at which the Company records depreciation, depletion and amortization (DD&A) expense increases, which in turn reduces net earnings. Such a decline in reserves may result from lower commodity prices, which may make it uneconomic to drill for and produce higher cost fields. The Company is unable to predict changes in reserve quantity estimates as such quantities are dependent on the success of its development program, as well as future economic conditions. Changes in reserves are applied on a prospective basis.
Acquisition costs of proved undeveloped and unproved properties qualify for interest capitalization during a period if interest cost is incurred and activities necessary to bring the properties into a productive state are in progress. As wells are drilled in a field with proved undeveloped reserves or unproved reserves, a portion of the acquisition costs are either re–designated as proved developed or expensed, as appropriate. In fields with multiple potential drilling sites, the Company determines the amount of the acquisition cost to re–designate or expense through a systematic and rational basis that considers the total expected wells to be drilled in that field.
| 61 |
The Company reviews its proved oil and natural gas properties for impairment whenever events and circumstances indicate that a decline in the recoverability of their carrying value may have occurred. The Company estimates the expected future cash flows of its oil and natural gas properties and compares these undiscounted future cash flows to the carrying amount of the oil and natural gas properties to determine if the carrying amount is recoverable. If the carrying amount exceeds the estimated undiscounted future cash flows, the Company will adjust the carrying amount of the oil and natural gas properties to fair value. The factors used to determine fair value include, but are not limited to, recent sales prices of comparable properties, the present value of future cash flows, net of estimated operating and development costs using estimates of reserves, future commodity pricing, future production estimates, anticipated capital expenditures and various discount rates commensurate with the risk associated with realizing the projected cash flows. Unproved oil and natural gas properties are assessed periodically for impairment on a property–by–property basis based on remaining lease terms, drilling results, reservoir performance, commodity price outlooks or future plans to develop acreage and allocate capital. When the Company has allocated fair values to significant unproved property (probable reserves) as the result of a business combination or other purchase of proved and unproved properties, it uses a future cash flow analysis to assess the property for impairment. Probable reserves are defined as those additional reserves that are less certain to be recovered than proved reserves but which, together with proved reserves, are as likely as not to be recovered.
Gains on sales of proved and unproved properties are only recognized when there is no uncertainty about the recovery of costs applicable to any interest retained or where there is no substantial obligation for future performance by the Company. Impairment on properties sold is recognized when incurred or when the properties are held for sale and the fair value of the properties is less than the carrying value.
We have capitalized leasehold acreage in relation to our Hawk Springs project in Goshen County, Wyoming and Roosevelt Project in Roosevelt County, Montana. We will continue to carry the cost of this acreage in our Balance Sheet until such time as we do not believe it is recoverable through sale or development.
Refer to Item 1 & 2 Business Properties for further details in regards to our oil and gas properties and exploration projects.
Work in progress
Work in progress relates to costs associated with the drilling of wells in Samson’s in fill development project in its North Stockyard field. These wells were not completed as at 30 June 2013 and work is continuing on them.
In August 2013 the Company divested half its equity position in the undeveloped acreage in the North Stockyard project to Slawson Exploration Company Inc. for $5.562 million in cash and other consideration. The Company retained our full interest in in the currently producing wells in the North Stockyard field. As a consequence of the transaction the rig contract with Frontier was also terminated, with no penalty payment. Slawson are now the operator of the project going forward for the development of the undeveloped acreage.
Along with the undeveloped acreage, we have also transferred 25% working interest in the drilled but not yet completed Billabong and Sail and Anchor wells. The cash portion of the purchase price is subject to the delivery of a useable well bore in Billabong, valued in the agreement at $0.9 million and other customary post closing adjustments.
Capitalized interest
Interest capitalization begins at the acquisition date and continues as long as development activities to prepare the asset for intended use are ongoing. No interest has been capitalized during the year ended June 30, 2013 and June 31, 2012 as we did not have any outstanding debt, therefore incurred no interest.
During fiscal year 2011 the Company capitalized interest on two wells being drilled in its North Stockyard field as significant delays were incurred in commencing production from these wells following delays in sourcing fracture stimulation crews and equipment by the operator of the field. Interest capitalization on acquisition costs will depend on whether or not development activities are continuing and whether or not the Company incurs external debt expense. Interest was capitalized from July 2010 through March 2011, when the related wells commenced production. The Company repaid its loan balance in full in May 2011 (See Note 3). Interest capitalization ceases when the well commences production. Capitalized interest is added to the depreciable base of the assets and is expensed on a units-of-production basis over the life of the respective project.
In the financial year ended June 30, 2011, interest costs of $74,466 were capitalized to two wells drilled in the North Stockyard field.
Exploration written off, including dry hole expenses
During the fiscal year ended June 30, 2013 we continued work on our Spirit of America 2 well in our Hawk Springs project in Goshen County, Wyoming. Three of the four potential completion zones were water saturated and therefore non-productive for hydro carbons. A workover is needed prior to being able to complete the remaining fourth zone. This work is planned to be completed during the coming year, however it is unlikely that the costs of the well will be recovered and $7.4 million in previously capitalized exploration costs in relation to this well were written off during quarter ended March 31, 2013.
| 62 |
During the fiscal year ended June 30, 2012 we drilled Spirit of America 1 in our Hawk Springs project in Goshen County, Wyoming. Numerous operational difficulties were encountered when drilling this well and it ultimately failed to reach its target. The Company wrote off $4.9 million in relation to this well and recorded it as exploration and evaluation expenditure on the Statement of Operations.
No dry hole costs were incurred during the year ended June 30, 2011.
During the fiscal year ended June 30, 2012 we also wrote off $24.7 million in exploration expense as a result of poor drilling results in relation to our the two exploratory wells – Australia II and Gretel II drilled in our Roosevelt Project in Roosevelt County, Montana. Although these wells maybe productive in the future, we do not believe we will recover the costs incurred to drill them and have therefore written them off.
Impairment
We recorded impairment charges of $0.3 million, $0.6 and $nil million for the years ended June 30, 2013, 2012 and 2011 respectively. The charges in the current year relate to the continued poor performance of our Roosevelt Project wells – Riva Ridge, Abercrombie, Australia II and Gretel II.
The charges in the prior year were related in part to a decrease in value of our Davis Bintliff well in Brazoria County, Texas. This well is a gas well and has declined value in line with the decline in the natural gas price. It continues to perform in line with our forecast decline curve. Other prior year impairment was recorded in relation to the asset value of our asset retirement obligation in relation to exploratory wells drilled during June 30, 2012 – Defender, Spirit of America I, Australia II and Gretel II.
The charges in 2010 were primarily as a result of decreases in commodity prices, in particular natural gas seen in recent years.
Other Property and Equipment.
Other property and equipment, which includes leasehold improvements, office and other equipment, are stated at cost. Depreciation and amortization are calculated using the straight–line method over the estimated useful lives of the related assets, ranging from 3 to 25 years. Depreciation and amortization expense for the years ended June 30, 2013, 2012 and 2011 was $101,484, $90,015 and $50,532, respectively.
Other property and equipment consists of the following at June 30:
| 2013 | 2012 | |||||||
| Furniture, fittings and equipment | $ | 718,694 | $ | 700,315 | ||||
| Less accumulated depreciation | (351,037 | ) | (252,254 | ) | ||||
| $ | 367,657 | $ | 448,061 | |||||
Derivative Financial Instruments. The Company enters into derivative contracts, primarily collars, swaps and option contracts, to hedge future crude oil and natural gas production in order to mitigate the risk of market price fluctuations. All derivative instruments are recorded on the balance sheet at fair value. All of the Company's derivative counterparties are commercial banks that were previously parties to its revolving credit facility. The Company has elected not to apply hedge accounting to any of its derivative transactions and consequently, the Company recognizes mark-to-market gains and losses in earnings currently, rather than deferring such amounts in other comprehensive income for those commodity derivatives that qualify as cash flow hedges. The Company had no oil and gas hedges in place as at June 30, 2013.
Asset Retirement Obligations. The Company recognizes estimated liabilities for future costs associated with the abandonment of its oil and natural gas properties. A liability for the fair value of an asset retirement obligation and corresponding increase to the carrying value of the related long–lived asset are recorded at the time the well is spud or acquired.
Environmental. The Company is subject to extensive federal, state and local environmental laws and regulations. These laws and regulations, which regularly change, regulate the discharge of materials into the environment and may require the Company to remove or mitigate the environmental effects of the disposal or release of petroleum or chemical substances at various sites. Environmental expenditures are expensed or capitalized depending on their future economic benefit. Expenditures that relate to an existing condition caused by past operations and that have no future economic benefits are expensed. Liabilities for expenditures of a non–capital nature are recorded when environmental assessment and/or remediation is probable and the costs can be reasonably estimated. Such liabilities are generally recorded at their undiscounted amounts unless the amount and timing of payments is fixed or reliably determinable. The Company believes that it is in material compliance with existing laws and regulations.
Income Taxes. Deferred income tax assets and liabilities are recognized for the future income tax consequences attributable to differences between the financial statement carrying amounts of existing assets and liabilities and their respective income tax bases. Deferred income tax assets and liabilities are measured using enacted tax rates expected to apply to taxable income in the years in which those temporary differences are expected to be recovered or settled. The effect on deferred income tax assets and liabilities of a change in income tax rates is recognized in income in the period that includes the enactment date. The measurement of deferred income tax assets is reduced, if necessary, by a valuation allowance if management believes that it is more likely than not that some portion or all of the net deferred tax assets will not be fully realized on future income tax returns. The ultimate realization of deferred tax assets is dependent upon the generation of future taxable income during the periods in which those temporary differences become deductible. Management considers the scheduled reversal of deferred tax liabilities, available taxes in carryback periods, projected future taxable income and tax planning strategies in making this assessment.
| 63 |
The Company recognizes the tax benefit from an uncertain tax position only if it is more likely than not that the tax position will be sustained on examination by the taxing authorities based on the technical merits of the position. The tax benefits recognized in the financial statements from such a position are measured based on the largest benefit that has a greater than 50% likelihood of being realized upon ultimate settlement.
Earnings Per Share. Basic earnings (loss) per share is calculated by dividing net earnings (loss) attributable to common stock by the weighted average number of shares outstanding for the period. Under the treasury stock method, diluted earnings per share is calculated by dividing net earnings (loss) by the weighted average number of shares outstanding including all potentially dilutive common shares (unexercised stock options). In the event of a net loss, no potential common shares are included in the calculation of shares outstanding since the impact would be anti-dilutive . The Company's unexercised stock options do not contain rights to dividends. When the Company records a net loss, none of the loss is allocated to the unexercised stock options since the securities are not obligated to share in Company losses. Consequently, in periods of net loss, outstanding options will have no dilutive impact to the Company’s basic earnings per share.
The following table details the weighted average dilutive and anti-dilutive securities, which consist of options and warrants, for the periods presented:
| Year ended June 30, | ||||||||||||
| 2013 | 2012 | 2011 | ||||||||||
| Dilutive | - | - | 325,033,863 | |||||||||
| Anti–dilutive | 142,694,297 | 289,942,436 | 8,379,077 | |||||||||
The following tables set forth the calculation of basic and diluted earnings per share for continuing and discounted operations:
| Continuing operations | Year ended June 30, | |||||||||||
| 2013 | 2012 | 2011 | ||||||||||
| Net income (loss) from continuing operations | $ | (11,721,049 | ) | $ | (31,236,451 | ) | $ | 51,435,835 | ||||
| Basic weighted average common shares outstanding | 1,935,438,970 | 1,752,408,357 | 1,680,247,878 | |||||||||
| Add: dilutive effect of stock options | - | - | 261,317,567 | |||||||||
| Add: bonus element for rights issue | - | - | 26,488,246 | |||||||||
| Diluted weighted average common shares outstanding | 1,935,438,970 | 1,752,408,357 | 1,968,053,691 | |||||||||
| Basic earnings per common share – cents per share | (0.61 | ) | (1.78 | ) | 3.06 | |||||||
| Diluted earnings per common share – cents per share | (0.61 | ) | (1.78 | ) | 2.61 | |||||||
| Discontinued operations | Year ended June 30, | |||||||||||
| 2013 | 2012 | 2011 | ||||||||||
| Net income (loss) from discontinued operations | $ | - | $ | - | $ | 2,712,387 | ||||||
| Basic weighted average common shares outstanding | - | - | 1,680,247,878 | |||||||||
| Add: dilutive effect of stock options | - | - | 261,317,567 | |||||||||
| Add: bonus element for rights issue | - | - | 26,488,246 | |||||||||
| Diluted weighted average common shares outstanding | - | - | 1,968,053,691 | |||||||||
| Basic earnings per common share – cents per share | - | - | 0.16 | |||||||||
| Diluted earnings per common share – cents per share | - | - | 0.14 | |||||||||
Stock-Based Compensation. Stock-based compensation is measured at the estimated grant date fair value of the awards and is recognized on a straight-line basis over the requisite service period (usually the vesting period). The Company recognizes stock-based compensation net of an estimated forfeiture rate, and recognizes compensation expense only for shares that are expected to vest. Compensation expense is then adjusted based on the actual number of awards for which the requisite service period is rendered.
| 64 |
Foreign Currency Translation. The functional currency of Samson Oil & Gas Limited (Parent Entity) is Australian dollars, the reason for this being the majority of cash flows of the Parent Entity are denominated in Australia dollars. The functional and presentation currency of Samson Oil & Gas USA, Inc (subsidiary) is U.S dollars. The presentation currency of the Company is U.S. dollars. Each entity within the Company determines its own functional currency and items included in the financial statements of each entity are measured using that functional currency.
Transactions in foreign currencies are initially recorded in the functional currency by applying the exchange rates ruling at the date of the transaction. Foreign exchange gains and losses resulting from the settlement of such transactions and from the translation at year ended exchange rates of monetary assets and liabilities denominated in foreign currencies are recognized in profit and loss, except when they are deferred in equity as qualifying cash flow hedges and qualifying net investment hedges or are attributable to part of the net investment in a foreign operation.
Translation differences on assets and liabilities carried at fair value are reported as part of the fair value gain or loss. Translation differences on non-monetary assets and liabilities are recognized in other comprehensive income .
Impact of Recently Adopted Accounting Standards.
Presentation of Comprehensive Income . On June 16, 2011, the FASB issued changes related to the presentation of comprehensive income. These changes eliminate the current option to report other comprehensive income and its components in the statement of changes in equity. These changes are intended to enhance comparability between entities that report under U.S. GAAP and those that report under IFRS, and to provide a more consistent method of presenting non-owner transactions that affect an entity's equity. An entity may elect to present items of net income and other comprehensive income in one continuous statement, referred to as the statement of comprehensive income, or in two separate, but consecutive, statements. Each component of net income and each component of other comprehensive income, together with totals for comprehensive income and its two parts, net income and other comprehensive income, would need to be displayed under either alternative. The statement(s) would need to be presented with equal prominence as the other primary financial statements. The new requirement is effective for public entities as of the beginning of a fiscal year that begins after December 15, 2011, and interim and annual periods thereafter. Early adoption is permitted, but full retrospective application is required under both sets of accounting standards. The adoption of this standard did have a material impact on our financial statements.
Fair Value Measurement . On May 12, 2011, the FASB issued changes related to fair value measurement. The changes represent the converged guidance of the FASB and the International Accounting Standards Board (“IASB”) on fair value measurement. Many of the changes eliminate unnecessary wording differences between International Financial Reporting Standards (“IFRS”) and U.S. GAAP. The changes expand existing disclosure requirements for fair value measurements categorized in Level 3 by requiring (1) a quantitative disclosure of the unobservable inputs and assumptions used in the measurement, (2) a description of the valuation processes in place and (3) a narrative description of the sensitivity of the fair value to changes in unobservable inputs and the interrelationships between those inputs. In addition, the changes also require the categorization by level in the fair value hierarchy of items that are not measured at fair value in the statement of financial position whose fair value must be disclosed. These changes are to be applied prospectively and are effective for public entities during interim and annual periods beginning after December 15, 2011. With the exception of the disclosure requirements, the adoption of these changes did not have a significant impact on our financial statements.
Recently Issued Accounting Pronouncements
ASU 2013-04, Liabilities (Topic 405): Obligations Resulting from Joint and Several Liability Arrangements for which the Total Amount of the Obligation is Fixed at the Reporting Date. The objective of the amendments in this Update is to provide consistency in the recognition, measurement, and disclosure of obligations resulting from joint and several liability arrangements for which the total amount of the obligation within the scope of this guidance is fixed at the reporting date. This Update requires an entity to measure obligations resulting from joint and several liability arrangements for which the total amount of the obligation within the scope of this guidance is fixed at the reporting date, as the sum of the following: (a) the amount the reporting entity agreed to pay on the basis of its agreement among its co-obligors; and (b) any additional amount the reporting entity expects to pay on behalf of its co-obligors. The guidance in the Update also requires disclosures about the nature as well as other information about the obligations. For public entities, the amendments in this Update are effective for fiscal years, and interim periods within those years, beginning after December 15, 2013. Retrospective application is required. Early adoption is permitted. We have not yet begun the process of assessing the impact of this standard on our financial statements and do not except to adopt the standard earlier than its effective date.
| 2. | SALES OF PROPERTIES |
Sale of undeveloped acreage in Goshen County, Wyoming. In November 2010, we closed the sale of 24,166 acres of undeveloped oil and gas leases in Goshen County, Wyoming to Chesapeake Energy Corporation for $3,275 per acre. We recorded total net profit of $73,199,687. Under the Company’s successful efforts method of accounting, the acreage was previously written off, and as a result had no value on the Balance Sheet when it was sold.
Sale of interest in gas assets in Jonah and Lookout Wash fields, Wyoming. In March 2011, the Company entered into an agreement to sell its assets in the Jonah and Lookout Wash fields in Wyoming. The transaction closed in March 2011. The Company recorded a pre–tax loss of $5,411,466 related to the sale, which is aggregated within the $2,883,802 earnings from discontinued operations, net of income tax benefit, shown on the Consolidated Statement of Operations for the year ended June 30, 2011.
As the Company sold 100% of its interest in these fields and the fields were considered to be a cash generating unit, the fields have been treated as discontinued operations. Continuing cash flows are expected to be generated by the ongoing entity. With the sale of the producing properties, we exited all gas producing activities in the surrounding geological formation. As we are the non-operator of our producing gas properties we do not have delivery commitments to customers or the ability to direct gas sales from our properties to certain sales contracts.
| 65 |
Earnings from discontinued operations, net of income tax, on the accompanying Consolidated Statement of Operations is comprised of the following:
| For the year ended June 30, | ||||||||||||
| 2013 | 2012 | 2011 | ||||||||||
| Sales of oil and gas | $ | - | $ | - | $ | 751,566 | ||||||
| Lease operating expense | - | - | (336,965 | ) | ||||||||
| Depletion, amortization and impairment | - | - | (329,573 | ) | ||||||||
| Realized derivative commodity gains | - | - | 152,171 | |||||||||
| Unrealized commodity derivative (losses)/ gains for changes in fair value | - | - | (24,557 | ) | ||||||||
| (Loss) on sale of asset | - | - | (5,411,466 | ) | ||||||||
| (Loss)/Earnings from discontinued operations, before income taxes | - | - | (5,198,824 | ) | ||||||||
| Provision for income tax benefit | - | - | 7,911,211 | |||||||||
| Earnings from discontinued operations, net of income taxes | - | - | 2,712,387 | |||||||||
| 3. | HEDGING AND DERIVATIVE FINANCIAL INSTRUMENTS |
Commodity Derivative Agreements. The Company utilizes swap and collar option contracts to hedge the effect of price changes on a portion of its future oil and natural gas production. The objective of the Company’s hedging activities and the use of derivative financial instruments is to achieve more predictable cash flows. While the use of these derivative instruments limits the downside risk of adverse price movements, they also may limit future revenues from favorable price movements. The Company may, from time to time, opportunistically restructure existing derivative contracts or enter into new transactions to effectively modify the terms of current contracts in order to improve the pricing parameters in existing contracts or realize the current value of the Company’s existing positions. The Company may use the proceeds from such transactions to secure additional contracts for periods in which the Company believes it has additional unmitigated commodity price risk.
The use of derivatives involves the risk that the counterparties to such instruments will be unable to meet the financial terms of such contracts. The Company’s derivative contracts are with a single multinational bank with no history of default with the Company. The derivative contracts may be terminated by a non-defaulting party in the event of default by one of the parties to the agreement. Previously, collateral under the revolving credit facility supported the Company’s collateral obligations under the Company’s derivative contracts. Therefore, the Company is not required to post additional collateral when the Company is in a derivative liability position.
The Company has elected not to apply hedge accounting to any of its derivative transactions and, consequently, the Company recognizes mark-to-market gains and losses in earnings currently, rather than deferring such amounts in accumulated other comprehensive income for those commodity derivatives that would qualify as cash flow hedges.
During the year ended June 30, 2011 commodity derivative losses were allocated to discontinued operations in the Statement of Operations in the amount of $24,557. During the year ended June 30, 2012 commodity derivative losses were allocated to other revenue in the amount of $22,268. As of June 30, 2013 and 2012 we had no derivative instruments.
Price risk
Price risk arises from the Company’s exposure to oil and gas prices. These commodity prices are subject to wide fluctuations and market uncertainties due to a variety of factors that are beyond the control of the Company. Sustained weakness in oil and natural gas prices may adversely affect the Company’s financial condition.
The Company manages this risk by continually monitoring the oil and gas price and the external factors that may affect it. The Board reviews the risk profile associated with commodity price risk periodically to ensure that it is appropriately managing this risk. Derivatives are used to manage this risk where appropriate. The Board must approve any derivative contracts that are entered into by the Company.
| 66 |
At 30 June 2013 if the price of natural gas and oil, as determined by the price at Colorado Interstate Gas price point and at Nymex, had moved, as illustrated in the table below (estimated from historical movements), with all other variables held constant, the impact would be:
| $ value of impact on result | ||||||||
| Higher/(lower) | ||||||||
| 2013 | 2012 | |||||||
| Consolidated | ||||||||
| Gas price + 10% | $ | 77,207 | $ | 102,095 | ||||
| Gas price – 20% | $ | (154,415 | ) | $ | (204,189 | ) | ||
| $ value of impact on result | ||||||||
| Higher/(lower) | ||||||||
| 2013 | 2012 | |||||||
| Consolidated | ||||||||
| Oil price + 10% | $ | 502,805 | $ | 735,249 | ||||
| Oil price – 20% | $ | (1,005,610 | ) | $ | (1,470,499 | ) | ||
| 4. | FAIR VALUE MEASUREMENTS |
Fair value is defined as the price that would be received in the sale of an asset or paid to transfer a liability in an orderly transaction between market participants at the measurement date (exit price). The Company utilizes market data or assumptions that market participants would use in pricing the asset or liability, including assumptions about risk and the risks inherent in the inputs to the valuation technique. These inputs can be readily observable, market corroborated, or generally unobservable. The Company classifies fair value balances based on the observability of those inputs. The FASB has established a fair value hierarchy that prioritizes the inputs used to measure fair value. The hierarchy gives the highest priority to unadjusted quoted prices in active markets for identical assets or liabilities (level 1 measurement) and the lowest priority to unobservable inputs (level 3 measurement).
The three levels of the fair value hierarchy are as follows:
| · | Level 1—Quoted prices are available in active markets for identical assets or liabilities as of the reporting date. Active markets are those in which transactions for the asset or liability occur in sufficient frequency and volume to provide pricing information on an ongoing basis. |
| · | Level 2—Pricing inputs are other than quoted prices in active markets included in level 1, but are either directly or indirectly observable as of the reported date and for substantially the full term of the instrument. Inputs may include quoted prices for similar assets and liabilities. Level 2 includes those financial instruments that are valued using models or other valuation methodologies. |
| · | Level 3—Pricing inputs include significant inputs that are generally less observable from objective sources. These inputs may be used with internally developed methodologies that result in management’s best estimate of fair value. |
Financial assets and liabilities are classified in their entirety based on the lowest level of input that is significant to the fair value measurement. The Company’s assessment of the significance of a particular input to the fair value measurement requires judgment, and may affect the valuation of fair value assets and liabilities and their placement within the fair value hierarchy levels. The following table sets forth by level within the fair value hierarchy the Company’s financial assets and liabilities that were accounted for at fair value as of June 30, 2013 and 2012.
| Fair Value at June 30, 2013 | ||||||||||||||||
| Level 1 | Level 2 | Level 3 | Total | |||||||||||||
| Assets (Liabilities): | ||||||||||||||||
| Cash and cash equivalents | $ | 13,170,627 | $ | - | $ | - | $ | 13,170,627 | ||||||||
| Fair Value at June 30, 2012 | ||||||||||||||||
| Level 1 | Level 2 | Level 3 | Total | |||||||||||||
| Assets (Liabilities): | ||||||||||||||||
| Cash and cash equivalents | $ | 18,845,894 | $ | - | $ | - | $ | 18,845,894 | ||||||||
| 67 |
The following methods and assumptions were used to estimate the fair value of the assets and liabilities in the table above:
Cash and Cash Equivalents. The Company considers all highly liquid investments purchased with an original maturity of three months or less to be cash equivalents. The Company’s cash management process provides for the daily funding of checks as they are presented to the bank. Due to the short term nature of cash and cash equivalents, the carrying value of all balances represents fair value.
Commodity Derivative Contracts. In the prior year, the Company’s commodity derivative instruments consisted of collar contracts for oil and natural gas. The Company values the derivative contracts using industry standard models, based on an income approach, which considers various assumptions including quoted forward prices and contractual prices for the underlying commodities, time value and volatility factors, as well as other relevant economic measures. Substantially all of the assumptions can be observed throughout the full term of the contracts, can be derived from observable data or are supportable by observable levels at which transactions are executed in the marketplace and are therefore designated as level 2 within the fair value hierarchy. The discount rates used in the assumptions include a component of non-performance risk.
Fair Value of Financial Instruments. The Company’s financial instruments consist primarily of cash and cash equivalents, accounts receivable and payable, investments and derivatives (discussed above). The carrying values of cash equivalents and accounts receivable and payable are representative of their fair values due to their short–term maturities.
Assets and Liabilities Measured at Fair Value on a Nonrecurring Basis. The Company also applies fair value accounting guidance to measure non–financial assets and liabilities such as business acquisitions, proved oil and gas properties, and asset retirement obligations. These assets and liabilities are subject to fair value adjustments only in certain circumstances and are not subject to recurring revaluations. These items are primarily valued using the present value of estimated future cash inflows and/or outflows. Given the unobservable nature of these inputs, they are deemed to be Level 3. During the year ended June 30, 2013 we have recognized impairment expense of approximately $0.3 million (2012 $0.7 million) in relation to oil and gas properties.
Fair value may be estimated using comparable market data, a discounted cash flow method, or a combination of the two. The Company utilizes the discounted cash flow method, estimated future cash flows are based on management’s expectations for the future and include estimates of future oil and gas production, commodity prices based on published forward commodity price curves as of the date of the estimate, operational costs, and a risk–adjusted discount rate. The fair value measurement was based on Level 3 inputs.
| 5. | ASSET RETIREMENT OBLIGATIONS |
The Company’s asset retirement obligations primarily represent the estimated present value of the amounts expected to be incurred to plug, abandon and remediate producing and shut–in properties at the end of their productive lives in accordance with applicable state and federal laws. The Company determines the estimated fair value of its asset retirement obligations by calculating the present value of estimated cash flows related to plugging and abandonment liabilities. The significant inputs used to calculate such liabilities include estimates of costs to be incurred, the Company’s credit adjusted discount rates, inflation rates and estimated dates of abandonment. The asset retirement liability is accreted to its present value each period and the capitalized asset retirement cost is depleted using the units–of–production method.
The following table summarizes the activities for the Company’s asset retirement obligations for the years ended June 30, 2013 and 2012:
| 2013 | 2012 | |||||||
| Asset retirement obligations at beginning of period | $808,572 | $236,024 | ||||||
| Liabilities incurred or acquired | 4,691 | 548,945 | ||||||
| Disposition of properties | - | - | ||||||
| Accretion expense | 55,326 | 23,603 | ||||||
| Asset retirement obligations at end of period | 868,589 | 808,572 | ||||||
| Less: current asset retirement obligations (classified with accounts payable and accrued liabilities) | - | - | ||||||
| Long-term asset retirement obligations | $ | 868,589 | $ | 808,572 | ||||
Discount rates used to calculate the present value vary depending on the estimated timing of the obligation, but typically range between 4% and 9%.
The increase in liabilities incurred during the prior period is a result of drilling Spirit of America I, Spirit of America II, Defender, Gretel II and Australia II.
| 68 |
The increase in liabilities incurred during the current period is a result of drilling Abercrombie and Riva Ridge in our Montana acreage. We have very minor working interests in these projects, thus our share of the retirement obligations are minor.
| 6. | INCOME TAXES |
The Company accounts for income taxes under the asset and liability approach prescribed by GAAP, which requires the recognition of deferred tax assets and liabilities for the expected future tax consequences of events that have been recognized in the Company’s consolidated financial statements or tax returns.
The Company’s income tax provision (benefit) is composed of the following:
| June 30 | ||||||||||||
| 2013 | 2012 | 2011 | ||||||||||
| Current: | ||||||||||||
| Federal | $ | (2,035,992 | ) | $ | (4,712,856 | ) | $ | 6,742,308 | ||||
| State | 25,712 | 83,663 | 42,025 | |||||||||
| (2,010,280 | ) | (4,629,193 | ) | 6,784,333 | ||||||||
| Deferred: | ||||||||||||
| Federal | - | - | - | |||||||||
| State | - | - | - | |||||||||
| Less income tax benefit allocated to discontinued operations | - | - | (7,911,211 | ) | ||||||||
| Total income tax provision (benefit) | $ | (2,010,280 | ) | $ | (4,629,193 | ) | $ | 14,695,544 | ||||
A reconciliation of the income tax provision (benefit) computed by applying the federal statutory rate of 30% to the Company’s income tax provision (benefit) is as follows (in thousands):
| June 30 | ||||||||||||
| 2013 | 2012 | 2011 | ||||||||||
| Income tax expense (benefit) at federal statutory rate | $ | (4,114,908 | ) | $ | (10,759,693 | ) | $ | 18,281,307 | ||||
| State income taxes | (170,787 | ) | (460,051 | ) | 462,204 | |||||||
| Other | (1,224,069 | ) | (1,436,377 | ) | 3,480,237 | |||||||
| Valuation allowance | 3,499,484 | 8,026,928 | (15,439,415 | ) | ||||||||
| $ | (2,010,280 | ) | $ | (4,629,193 | ) | $ | 6,784,333 | |||||
| 69 |
The components of deferred tax assets and (liabilities) are as follows (in thousands):
| June 30 | ||||||||
| 2013 | 2012 | |||||||
| Deferred income tax assets: | ||||||||
| Net operating losses | $ | 13,576,942 | $ | 4,940,710 | ||||
| Note payable | 2,023,467 | 2,023,467 | ||||||
| Asset retirement obligation | 315,794 | 293,974 | ||||||
| Annual leave | 51,593 | 60,460 | ||||||
| Abandonment limitation | 2,953,235 | 5,559,475 | ||||||
| Accrued bonus | - | - | ||||||
| Charitable contributions | - | - | ||||||
| Share based compensation | 500,844 | 500,844 | ||||||
| Valuation allowance | (16,572,701 | ) | (13,073,217 | ) | ||||
| Deferred income tax liabilities: | ||||||||
| Commodity liability | - | - | ||||||
| Amortization - loan costs | - | - | ||||||
| Oil and gas property | (2,849,174 | ) | (305,713 | ) | ||||
| Net deferred income tax assets (liabilities) | - | - | ||||||
| Net current deferred tax asset | - | - | ||||||
| Noncurrent deferred tax asset | $ | - | $ | - | ||||
The Company has tax losses carried forward arising in Australia of $10,298,250 (2012: $9,553,496). The benefit of these losses of $3,089,475 (2012: $2,866,049) will only be obtained in future years if:
| (i) | the Parent Entity derive future assessable income of a nature and an amount sufficient to enable the benefit from the deduction for the losses to be realized; and | |
| (ii) | the Parent Entity have complied and continue to comply with the conditions for deductibility imposed by law; and | |
| (iii) | no changes in tax legislation adversely affect the Parent Entity in realizing the benefit from deduction for the losses. |
The Company has federal net operating tax losses in the United States of approximately $28,164,751 (2012: $17,674,196). The current year utilization carried back to prior years, is approximately $nil (2012: $18,246,031) and future years are limited to an estimated $403,194 per year as a result of a change in ownership of the one of the subsidiaries which occurred in January 2005. If not utilized, the tax net operating losses will expire during the period from 2012 to 2033.
The Company has recognized tax benefit of $2,010,280 for the year ended June 30, 2013 compared to a benefit of $4,629,193 in the prior year, before discontinued operations.
In addition to the above mentioned Federal carried forward losses in the United States, the Company also has approximately $1,154,648 (2012: $11,257,204) of State carried forward tax losses, with expiry dates between June 2013 and June 2033. A deferred income tax asset in relation to these losses has not been recognized as realization of the benefit is not regarded as probable.
In assessing the realizeability of deferred tax assets, management considers whether it is more likely than not that some portion or all of the deferred tax assets will not be realized. The ultimate realization of deferred tax assets is dependent upon the generation of future taxable income during the periods in which the use of such net operating losses are allowed. Among other items, Management considers the scheduled reversal of deferred tax liabilities, tax planning strategies and projected future taxable income. As of the current year end, the company does not believe the realizeablity of the deferred tax assets to be more likely than not. As such, the company has a full valuation allowance offsetting the deferred tax asset.
The Company adopted the uncertainty provision of FASB ASC Topic 740, "Income Taxes" and has analyzed filing positions in all federal and state jurisdictions where it is required to file income tax returns, as well as all open tax years in this jurisdictions. Most uncertain tax positions relate primarily to timing differences and management does not believe any such uncertain tax positions will materially impact the Company's effective tax rate in future periods. The state of North Dakota has opened an audit of the tax return for the year ending June 30, 2011. We have recorded a liability to reflect the potential exposure based on the issues being raised with regard to the sale of Wyoming proven and unproven properties. The Company anticipates that no additional uncertain tax positions will be recognized within the next twelve months. Our policy is to recognize any interest and penalties related to the unrecognized tax benefits in income tax expense. In our major tax jurisdictions, the earliest years remaining open to examination are as follows US - 6/30/1996 due to the usage of net operating losses from that period. If recognized, these uncertain tax positions would impact the Company's effective income tax rate. A reconciliation of the beginning and ending amount of gross uncertain tax positions is as follows:
| 70 |
| 2013 | 2012 | |||||||
| Total gross uncertain tax positions at beginning of year | $ | 80,000 | $ | - | ||||
| Additions / Reductions for tax positions of prior years | - | - | ||||||
| Additions / Reductions for tax positions of current year | 25,000 | 80,000 | ||||||
| Reductions due to settlements with taxing authorities | - | - | ||||||
| Reductions due to lapse of statute of limitations | - | - | ||||||
| Total amount of gross uncertain tax positions at end of year | $ | 105,000 | $ | 80,000 | ||||
This amount has been recorded as an accrual in the Balance Sheet.
| 7. | CAPITAL STOCK CONTRIBUTED EQUITY |
| Consolidated Entity | ||||||||
| 2013 | 2012 | |||||||
| 2,229,165,163 ordinary fully paid shares including shares to be issued | $ | 92,717,784 | $ | 83,467,987 | ||||
| (2012 – 1,772,456,827 ordinary fully paid shares including shares to be issued) | ||||||||
| Movements in contributed equity for the year | 2013 | 2012 | ||||||||||||||
| No. of shares | $ | No. of shares | $ | |||||||||||||
| Opening balance | 1,771,891,827 | 83,467,987 | 1,731,978,789 | 81,668,085 | ||||||||||||
| Capital raising (i) | 243,271,098 | 6,066,792 | - | - | ||||||||||||
| Shares issued upon exercise of options (ii) | 214,002,238 | 3,342,660 | 39,913,038 | 632,101 | ||||||||||||
| Stock based compensation (options issued) | - | 199,437 | - | 1,167,801 | ||||||||||||
| Transaction costs incurred | - | (359,092 | ) | - | - | |||||||||||
| Shares on issue at balance date | 2,229,165,163 | 92,717,784 | 1,771,891,827 | 83,467,987 | ||||||||||||
| (i) | In March 2013, we issued 109,752,575 ordinary shares at 0.0259 cents to raise $2,850,000 in a private placement to certain institutional investors. |
In April 2013, we issued 19,182,812 ordinary shares at 0.026 cents to raise $500,000 in a private placement to certain institutional investors.
In June 2013, we completed a rights offering and issued 114,335,711 ordinary shares to raise $2,716,701.
| (ii) | During the course of the year the Company issued 214,002,238 (2012: 39,913,038) ordinary shares upon the exercise of 214,002,238 (2012: 39,913,038) options. |
The exercise price of 214,002,238 (2012: 39,913,038) of the options exercised was A$0.015 cents per share/US$0.015 cents per shares (average price based on the exchange rate on the date of exercise) (2012:A$0.015/US$0.015 cents per share) to raise US$3,342,660 (2012:US$632,101).
| 71 |
| 8. | CASH FLOW STATEMENT |
| Year ended June 30 | ||||||||||||
| 2013 | 2012 | 2011 | ||||||||||
| Reconciliation of the net profit/(loss) after tax to the net cash flows from operations | ||||||||||||
| Net profit/(loss) after tax | $ | (11,721,049 | ) | $ | (31,236,451 | ) | $ | 54,148,222 | ||||
| Net gain recognized on re-measurement to fair-value of investments held for trading | - | - | (5,494 | ) | ||||||||
| Depreciation of non-current assets | 1,975,932 | 2,776,005 | 2,212,661 | |||||||||
| Accretion of asset retirment obligation | 55,326 | 23,603 | 23,909 | |||||||||
| Share based payments | 199,437 | 1,167,801 | 2,473,477 | |||||||||
| Interest expense | - | - | - | |||||||||
| Exploration expenditure | 7,929,204 | 30,559,458 | 404,031 | |||||||||
| Net (gain)/loss on fair value movement of fixed forward swaps | - | - | 24,557 | |||||||||
| Impairment losses of oil and gas properties | 259,529 | 635,464 | - | |||||||||
| Net gain on sale of assets | - | - | (67,788,222 | ) | ||||||||
| Changes in assets and liabilities: | ||||||||||||
| (Increase)/decrease in receivables | 3,601,100 | (1,360,049 | ) | (3,101,846 | ) | |||||||
| Increase in employee benefits | 7,832 | 72,645 | 53,386 | |||||||||
| (Decrease)/Increase in payables | (125,000 | ) | 182,005 | 1,045,929 | ||||||||
| NET CASH FLOWS USED IN OPERATING ACTIVITIES | $ | 2,182,311 | $ | 2,820,481 | $ | (10,509,390 | ) | |||||
| 9. | SHARE-BASED PAYMENTS (all figures are in Australian dollars in this note) |
To convert June 30, 2013 balances denominated in Australian dollars to U.S. dollars, we used the June 30, 2013, 2012 and 2011 Federal Reserve Bank of Australia (www.rba.gov.au) closing exchange rates of 0.925, 1.0191 and 1.0739 U.S. dollars per Australian dollar, respectively. All dollars in this footnote are Australian dollars, except where stated otherwise.
During the year ended June 30, 2011, the Company registered a Form S-8 with the Securities Exchange Commission. The Form S-8 is a registration statement used by U.S. public companies to register securities to be offered pursuant to employee benefit plans; in this case the ordinary shares issuable and reserved for issuance underlying the options which may be issued pursuant to the Samson Oil & Gas Limited Stock Option Plan were registered.
All incentive options issued by the Company are valued using a black-scholes pricing model which requires inputs for the share price at grant date, exercise price, time to expiry, risk free interest rate, share price volatility and dividend yield. The risk free interest rate is based on the interest rate applicable to Australian Government Bonds with a similar remaining life to the options on the day of grant. The dividend yield is the expected annual dividend yield over the expected life of the option. The volatility factors are based on historic volatility of the Company’s stock. Estimates of fair value are not intended to predict actual future events or the value ultimately realized by certain employees who receive stock options, and subsequent events are indicative of the reasonableness of the original fair value estimates.
No options were issued during the year ended June 30, 2013 as share based payments.
Options issued during the year ended June 30, 2012
In July 2011, 4,000,000 stock options were granted under the Samson Oil & Gas Limited Stock Option Plan to an employee of the Company. These options have an exercise price of 16.4 cents (Australian) and an expiry date of December 31, 2014. One third of these stock options vested on July 31, 2011. Another third vested on July 31, 2012, the remaining third vested on July 31, 2013, as the employee was still employed by the Company on those dates.
| 72 |
The fair value of each option granted was estimated using the Black-Scholes option pricing model. The following assumptions were used to compute the weighted average fair market value of options granted:
| Share price at grant date (Australian cents) | 14.0 | |||
| Exercise price (Australian cents) | 16.40 | |||
| Time to expiry (years) | 3.5 | |||
| Risk free rate (%) | 5.25 | |||
| Share price volatility (%) | 129.33 | |||
| Dividend yield | Nil |
In November 2011, 4,000,000 options were granted under the Samson Oil and Gas Limited Stock Option to a non-executive Director of the Company. These options have an exercise price of 15.5 cents (Australian) and expiry date of October 31, 2015. These options vested immediately. The fair value of each option granted was estimated using the Black-Scholes option pricing model. The following assumptions were used to compute the weighted average fair market value of options granted:
| Share price at grant date (Australian cents) | 10.0 | |||
| Exercise price (Australian cents) | 15.5 | |||
| Time to expiry (years) | 4 | |||
| Risk free rate (%) | 6.00 | |||
| Share price volatility (%) | 124.61 | |||
| Dividend yield | Nil |
Options issued during the year ended June 30, 2011
On November 18, 2010, 29,000,000 options were issued to four directors. These options have an expiry date of October 31, 2014 and an exercise price of 8 cents per share. These options have been valued at 5.01 cents per option, using a black-scholes pricing model, which takes into account the following variables:
| Share price at grant date (cents) | 6.40 | |||
| Exercise price (cents) | 8.00 | |||
| Time to expiry (years) | 4 | |||
| Risk free rate (%) | 5.24 | |||
| Share price volatility (%) | 131 | |||
| Dividend yield | Nil |
The value of these options has been expensed in the current period as these options vested immediately.
On December 17, 2010, 32,000,000 options were granted to employees of the Company. These options have an expiry date of December 31, 2014. These options have been valued at 4.7 cents per option, using a black-scholes pricing model which takes into account the following variables:
| Share price at grant date (cents) | 5.90 | |||
| Exercise price (cents) | 8.00 | |||
| Time to expiry (years) | 4 | |||
| Risk free rate (%) | 5.31 | |||
| Share price volatility (%) | 131 |
One third of these options vested on January 31, 2011, another third vested on January 31, 2012 and the remaining third vested on January 31, 2013. The expense associated with these options will be recognized in line with the vesting schedule.
In January 2010, 12,500,007 options were issued in conjunction with the rights offering completed by Samson in Oct 2009. These options have an exercise price of 1.5 cents and expire on December 31, 2012.
In October and November 2009, 344,431,141 options were issued in conjunction with a rights offering completed by the Company at the same time. The remaining options with an exercise price of 1.5 cents expired on December 31, 2012.
22,324,842 of these 1.5c options were exercised up to June 30, 2010. 70,072,446 have been exercised during the year ended June 30, 2011. 39,913,038 were exercised during the year ended June 30, 2012. 214,002,238 were exercised during the year ended June 30, 2013. The remaining options expired unexercised on December 31, 2012.
On November 18, 2009, 1,000,000 options were granted to two non-executive directors. These options have an exercise price of 20 cents and expiry date of November 30, 2013. These options vested immediately.
| 73 |
On May 12, 2008, 2,000,000 options were granted to key management personnel. These options have an exercise price of 25 cents per share and an expiry date of May 11, 2013. 600,000 options vested immediately, 600,000 vest following twelve months of service by the employee, with the remaining 800,000 vested on April 1, 2010, following twenty four months of service.
On October 11, 2007, 4,000,000 options were issued to key management personnel. These options have an exercise price of 30 cents per share and an expiry date of October 10, 2012. These options vested immediately. These options expired unexercised during the year ended June 30, 2013.
On October 10, 2007, 3,379,077 options were granted to participants of a capital raising, completed at the same time. These options have an exercise price of 30 cents per share, an expiry date of October 10, 2012 and vested immediately. These options expired unexercised during the year ended June 30, 2013.
On June 14, 2006, 8,500,000 options were issued to employees, directors and other parties not related to the Company. These options vested immediately, had an exercise price of 45 cents and expired on May 31, 2011. During the year June 30, 2009, 2,000,000 of these options expired following the resignation of the employee to which they were granted. The remaining options expired unexercised on May 31, 2011.
At the end of the year there were 166,807,526 (2012: 301,499,902) unissued ordinary shares in respect of which options were outstanding. Option holders do not have any right by virtue of the option to participate in any share issue of the Company.
The Company recognized total share–based compensation which was recognized within general and administrative expense as follows:
| Year ended June 30 | ||||||||||||
| U.S. Dollar | ||||||||||||
| 2013 | 2012 | 2011 | ||||||||||
| Share–based compensation expensed | $ | 199,436 | $ | 1,167,801 | $ | 2,473,477 | ||||||
As of June 30, 2013, there was US$5,629 of total unrecognized compensation cost related to stock options which is expected to be amortized over a weighted–average period of one year.
See Note 1 for information on the Company’s bonus plan.
The following summarizes the Company’s stock option activity for the years ended June 30, 2013, 2012 and 2011 (all values in AUD unless otherwise noted):
| 2013 | 2012 | 2011 | ||||||||||||||||||||||||||
| Aggregate | ||||||||||||||||||||||||||||
| Intrinsic | ||||||||||||||||||||||||||||
| Weighted | Value of | Weighted | Weighted | |||||||||||||||||||||||||
| Average | Options | Average | Average | |||||||||||||||||||||||||
| Exercise | cents | Exercise | Exercise | |||||||||||||||||||||||||
| Price – cents | (AUD) | Price – cents | Price – cents | |||||||||||||||||||||||||
| Number | (AUD) | (1) | Number | (AUD) | Number | (AUD) | ||||||||||||||||||||||
| Outstanding, start of period | 301,499,902 | 0.04 | 333,412,940 | 0.033 | 349,485,386 | 0.03 | ||||||||||||||||||||||
| Granted | 97,307,526 | 0.038 | 8,000,000 | 0.16 | 61,000,000 | 0.08 | ||||||||||||||||||||||
| Exercised | (214,002,238 | ) | 0.015 | (39,913,038 | ) | 0.015 | (70,572,446 | ) | 0.015 | |||||||||||||||||||
| Cancelled/expired | (17,997,664 | ) | 0.13 | 0 | - | (6,500,000 | ) | 0.45 | ||||||||||||||||||||
| Outstanding, end of period | 166,807,526 | 0.06 | (0.04 | ) | 301,499,902 | 0.04 | 333,412,940 | 0.033 | ||||||||||||||||||||
| Exercisable, end of period | 165,474,192 | 0.06 | 288,166,570 | 0.05 | 312,079,606 | 0.03 | ||||||||||||||||||||||
| (1) | The intrinsic value of a stock option is the amount by which the market value is (less than)/exceeds the exercise price at the Balance Date. |
| 74 |
The aggregate intrinsic value of options exercised in 2013, 2012 and 2011 was AUD4,739,926, AUD3,608,250 and AUD5,458,053, respectively.
Additional information related to options outstanding at June 30, 2013 is as follows (outstanding):
| Options Outstanding | Options Exercisable | |||||||||||||||||||||||
| Weighted | Weighted | |||||||||||||||||||||||
| Average | Weighted | Average | Weighted | |||||||||||||||||||||
| Range of | Remaining | Average | Remaining | Average | ||||||||||||||||||||
| Exercise | Number | Contractual | Exercise | Number | Contractual | Exercise | ||||||||||||||||||
| Prices | Outstanding | Life - years | Prices | Exercisable | Life | Prices | ||||||||||||||||||
| 3.8 cents | 97,307,526 | 3.00 | 0.038 | 97,307,526 | 3.00 | 0.038 | ||||||||||||||||||
| 8 cents | 60,500,000 | 1.50 | 0.08 | 60,500,000 | 1.50 | 0.08 | ||||||||||||||||||
| 15.5 cents | 4,000,000 | 2.30 | 0.155 | 4,000,000 | 2.30 | 0.155 | ||||||||||||||||||
| 16.4 cents | 4,000,000 | 1.50 | 0.164 | 2,666,666 | 1.50 | 0.164 | ||||||||||||||||||
| 20 cents | 1,000,000 | 0.42 | 0.2 | 1,000,000 | 0.42 | 0.2 | ||||||||||||||||||
| 166,807,526 | 165,474,192 | |||||||||||||||||||||||
The following summarizes the Company’s unvested stock option award activity for the year ended June 30, 2013.
| Non-vested stock options | Shares | Weighted– Average Grant–Date Fair Value | ||||||
| Non-vested at June 30, 2012 | 13,333,332 | |||||||
| Granted | - | - | ||||||
| Vested | 12,000,000 | 0.06 | ||||||
| Forfeited | – | |||||||
| Non-vested at June 30, 2013 | 1,333,332 | 0.11 | ||||||
| 10. | RELATED PARTY TRANSACTIONS |
During the year ended June 30, 2011 the Company paid $18,853 in legal fees to Minter Ellison, the employer of Neil Fearis (an alternative director to the Chairman). The fees were charged on normal commercial terms. Neil Fearis ceased being an alternative director on July 1, 2011.
| 11. | COMMITMENTS |
Leases –The Company has entered into lease agreements for office space in Denver, Colorado and Perth, Western Australia. As of June 30, 2012, future minimum lease payments under operating leases that have initial or remaining non–cancelable terms in excess of one year are $134,361 in 2013, $136,670 in 2014, $131,159 in 2015, $10,294 in 2016 and $nil thereafter. Net rent expense incurred for office space was $132,425, $212,715 and $285,427 in 2011, 2012 and 2013, respectively.
| 12. | CONTINGENCIES |
There are no unrecorded contingent assets or liabilities in place for the Company at balance date (2012: Nil).
Samson may be subject to various other lawsuits and disputes incidental to its business operations, including commercial disputes, personal injury claims, and claims for underpayment of royalties, property damage claims and contract actions.
The Company records an associated liability when a loss is probable and the amount is reasonably estimable. Although the outcome of litigation cannot be predicted with certainty, management is of the opinion that no pending or threatened lawsuit or dispute incidental to its business operations is likely to have a material adverse effect on the company’s consolidated financial position, results of operations or cash flows. The final resolution of such matters could exceed amounts accrued, however, and actual results could differ materially from management’s estimates.
| 75 |
| 13. | SUBSEQUENT EVENTS |
Capital Raising
In August 2013, we issued 318,452,166 ordinary shares to US and Australian institutional investors at 2.5 cents (Australian) each and 127,380,866 new warrants. The placement was a portion of the shortfall in the Rights Offering completed by Samson Oil and Gas Limited in May 2013. The warrants have an exercise price of 3.8 cents (Australian) and an expiry date of March 31, 2017. The placement raised approximately $6.7 million in cash, after expenses.
Divestment
In August 2013, as part of our broader financing plan, to ensure our participation in the full development of the North Stockyard project, we divested half our equity position in the undeveloped acreage in the North Stockyard project to Slawson Exploration Company Inc. for upto $5.562 million in cash and other consideration. We retained our full interest in the currently producing wells in the North Stockyard field. As a consequence of the transaction we have also terminated our rig contract with Frontier, with no penalty payment. Slawson are now the operator of the project going forward for the development of the undeveloped acreage.
Along with the undeveloped acreage, we have also transferred 25% working interest in the drilled but not yet completed Billabong and Sail and Anchor wells. The cash portion of the purchase price is subject to the delivery of a useable well bore in Billabong, valued in the agreement at $0.9 million and other customary post closing adjustments. The Billabong well bore is currently scheduled to undergo a workover operation during October 2013, following the completion of the frac of Sail and Anchor, current scheduled for September 2013.
| 14. | QUARTERLY FINANCIAL DATA (UNAUDITED) |
The following is a summary of the unaudited financial data for each quarter for the years ended June 30, 2013 and 2012 (except per share data):
| Three Months Ended | ||||||||||||||||
| June 30, 2013 | March 31, 2013 | Dec 31, 2012 | Sep 30, 2012 | |||||||||||||
| Year ended June 30, 2013: | ||||||||||||||||
| Revenues | $ | 1,579,853 | $ | 1,178,000 | $ | 1,842,731 | $ | 1,668,410 | ||||||||
| Loss from operations | (1,886,339 | ) | (8,921,000 | ) | (1,331,454 | ) | (1,592,536 | ) | ||||||||
| Tax (expense)/benefit | (25,656 | ) | - | 1,366,938 | 668,998 | |||||||||||
| Net income (loss) | (1,911,995 | ) | (8,921,000 | ) | 35,484 | (923,538 | ) | |||||||||
| Basic earnings per common share – cents per share | (0.11 | ) | (0.45 | ) | 0.00 | (0.05 | ) | |||||||||
| Diluted earnings per common share – cents per share | (0.11 | ) | (0.45 | ) | 0.00 | (0.05 | ) | |||||||||
| Three Months Ended | ||||||||||||||||
| June 30, 2012 | March 31, 2012 | Dec 31, 2011 | Sep 30, 2011 | |||||||||||||
| Year ended June 30, 2012: | ||||||||||||||||
| Revenues | $ | 1,768,020 | $ | 2,387,735 | $ | 2,018,758 | $ | 2,625,241 | ||||||||
| Loss from operations | (27,965,316 | ) | (1,394,909 | ) | (5,757,583 | ) | (747,836 | ) | ||||||||
| Tax (expense)/benefit | 2,915,259 | 832,371 | 693,385 | 188,178 | ||||||||||||
| Net income (loss) | (25,050,057 | ) | (562,538 | ) | (5,064,198 | ) | (559,658 | ) | ||||||||
| Basic loss per common share – cents per share | (1.43 | ) | (0.03 | ) | (0.29 | ) | (0.03 | ) | ||||||||
| Diluted earnings per common share – cents per share | (1.43 | ) | (0.03 | ) | (0.29 | ) | (0.03 | ) | ||||||||
| 76 |
| 15. | SUPPLEMENTAL INFORMATION ON OIL AND NATURAL GAS EXPLORATION, DEVELOPMENT AND PRODUCTION ACTIVITIES, INCLUSIVE OF DISCONTINUED OPERATIONS (UNAUDITED) |
The Company adopted the requirements of ASC 932 for the year ended June 30, 2010. The impact of the adoption of this standard was not practical to estimate.
Oil and Gas Reserves
The information set forth below regarding the Company’s oil and gas reserves, for the year ended June 30, 2012, 2011 and 2010 was prepared by Ryder Scott Company L.P., an independent reserve engineering firm. The CEO reviews all reserve reports. All reserves are located within the continental United States.
Estimated Proved Reserves
Proved reserves are those quantities of hydrocarbons which, by analysis of geological and engineering data, can be estimated with reasonable certainty to be commercially recoverable, from a given date forward, from known reservoirs and under current economic conditions, operating methods and government regulations. As commodity prices decline, the commercially viability of wells change and reserve quantities may decrease. Proved reserves can be categorized as developed or undeveloped.
Capitalized Costs of Oil and Natural Gas Properties
| As of June 30, | ||||||||||||
| 2013 | 2012 | 2011 | ||||||||||
| Oil and gas properties – subject to amortization | $ | 26,657,972 | $ | 25,785,108 | $ | 22,872,355 | ||||||
| Work in progress | 6,344,040 | - | - | |||||||||
| Lease and well equipment | 5,371,923 | 4,217,803 | 3,745,698 | |||||||||
| Total capitalized costs | 38,373,935 | 30,002,911 | 26,618,053 | |||||||||
| Accumulated depreciation, depletion and amortization | (12,362,977 | ) | (10,488,529 | ) | (7,767,005 | ) | ||||||
| Impairment | (6,018,940 | ) | (5,624,002 | ) | (4,988,538 | ) | ||||||
| Net capitalized costs | $ | 19,992,018 | $ | 13,890,380 | $ | 13,862,510 | ||||||
Capitalized Costs Incurred
Costs incurred for oil and natural gas exploration, development and acquisition are summarized below.
| Year ended June 30, | ||||||||||||
| 2013 | 2012 | 2011 | ||||||||||
| Property acquisition | ||||||||||||
| Proved properties | $ | 872,864 | $ | 2,912,753 | $ | 6,309,640 | ||||||
| Unproved properties | - | - | - | |||||||||
| Work in progress | 6,344,040 | - | - | |||||||||
| Lease and well equipment | 1,154,120 | 472,105 | 1,247,939 | |||||||||
| Exploration costs | 3,911,191 | 5,172,707 | 1,190,283 | |||||||||
| Undeveloped capitalized acreage | 2,352,125 | 7,859,832 | 2,157,455 | |||||||||
| Total costs incurred | $ | 14,634,340 | $ | 16,417,397 | $ | 10,905,317 | ||||||
Estimated Proved Reserves
Proved reserves are those quantities of hydrocarbons which, by analysis of geological and engineering data, can be estimated with reasonable certainty to be commercially recoverable, from a given date forward, from known reservoirs and under current economic conditions, operating methods and government regulations. As commodity prices decline, the commercially viability of wells change and reserve quantities may decrease. Proved reserves can be categorized as developed or undeveloped.
| Year ended June 30, 2013 | Year ended June 30, 2012 | Year ended June 30, 2011 | ||||||||||||||||||||||||||||||||||
| Oil | Gas | Total | Oil | Gas | Total | Oil | Gas | Total | ||||||||||||||||||||||||||||
| Mbbls | MMcf | MBOE | Mbbls | MMcf | MBOE | Mbbls | MMcf | MBOE | ||||||||||||||||||||||||||||
| Beginning of year | 770 | 1,352 | 996 | 495 | 1,311 | 714 | 451 | 10,119 | 2,138 | |||||||||||||||||||||||||||
| Revisions of previous quantity estimates | 227 | 27 | 232 | 4 | (168 | ) | (24 | ) | 156 | 431 | 228 | |||||||||||||||||||||||||
| Extensions, discoveries and improved recovery | 153 | 198 | 186 | 359 | 423 | 430 | - | - | - | |||||||||||||||||||||||||||
| Sale of reserves in place | - | - | - | - | - | - | (48 | ) | (8,816 | ) | (1,517 | ) | ||||||||||||||||||||||||
| Acquisitions | 364 | 435 | 437 | - | - | - | - | - | - | |||||||||||||||||||||||||||
| Production | (62 | ) | (167 | ) | (90 | ) | (88 | ) | (214 | ) | (124 | ) | (64 | ) | (423 | ) | (135 | ) | ||||||||||||||||||
| End of year | 1,452 | 1,845 | 1,761 | 770 | 1,352 | 996 | 495 | 1,311 | 714 | |||||||||||||||||||||||||||
| Proved developed producing reserves | 454 | 784 | 586 | 419 | 927 | 575 | 455 | 1,274 | 667 | |||||||||||||||||||||||||||
| Proved undeveloped reserves | 998 | 1,061 | 1,175 | 351 | 425 | 422 | 40 | 37 | 47 | |||||||||||||||||||||||||||
| Total proved reserves | 1,452 | 1,845 | 1,761 | 770 | 1,352 | 996 | 495 | 1,311 | 714 | |||||||||||||||||||||||||||
| 77 |
Developed Reserves
Developed reserves are those reserves expected to be recovered from existing wells, with existing equipment and operating methods. Additional oil and gas expected to be obtained through the application of fluid injection or other improved recovery techniques for supplementing the natural forces and mechanisms of primary recovery should be included as proved developed reserves only after testing by a pilot project or after the operation of an installed program has confirmed through production response that increased recovery will be achieved.
Undeveloped Reserves
Undeveloped reserves are those reserves expected to be recovered from new wells on undeveloped acreage or from existing wells where a relatively large expenditure is required to recomplete an existing well or install production or transportation facilities for primary or improved recovery projects. Estimated development costs on our undeveloped fields are approximately $29 million as of June 30, 2013. The feasibility of development is also heavily dependent upon future commodity prices. As such the timing of drilling and development activities depends upon a number of factors that are outside of our control. While as of June 30, 2013, we continued to expect that these fields will be developed within a reasonable period of time and that the capitalized costs will be recoverable from future operations, there is no assurance that there will not be future impairment of these costs.
Standardized Measure of Discounted Future Net Cash Flows
Future hydrocarbon sales and production and development costs have been estimated using a 12 month average price for the commodity prices for June 30, 2013, 2012, 2011, and 2010 and year end prices for June 30, 2009 and costs in effect at the end of the periods indicated. The change in the pricing used in the determination of reserve values has been changed following the implementation of the revised SEC rule in relation to oil and gas reporting. The average 12 month historical average of the first of the month prices used for natural gas for June 30, 2013, 2012, 2011 and 2010, and the year end prices for June 30, 2009 were $5.89, $5.16, $4.61, $3.75 and $2.975 per Mcf, respectively. The 12 month historical average of the first of the month prices used for oil for June 30, 2013, 2012, 2011, 2010 and the year end prices used for oil for June 30, 2009 were $84.54, $83.93, $81.04, $66.53 and $57.06 per barrel of oil, respectively. Future cash flows were reduced by estimated future development, abandonment and production costs based on period–end costs. No deductions were made for general overhead, depletion, depreciation and amortization or any indirect costs. All cash flows are discounted at 10%.
Changes in demand for hydrocarbons, inflation and other factors make such estimates inherently imprecise and subject to substantial revisions. This table should not be construed to be an estimate of current market value of the proved reserves attributable to Samson.
During the year ended June 30, 2013 we recognised four additional proved undeveloped drilling locations with respect to our Rainbow Project, the estimated cost to developed these locations is $16.4 million.
In previous reports, Samson did not include the effect of future income taxes in its calculation of the Standardized Measure of Discounted Future Net Cash Flows from its oil and gas properties (“SMOG”) because Samson’s substantial tax loss carryforwards, or net operating losses (“NOLs”) attributable to its proved reserves made it unlikely that Samson would pay any significant income taxes on income derived from those reserves. The table below reflects the effect of future income taxes on the SMOG, however, because Samson’s recent sale of a portion of its unproved reserves in Goshen County, Wyoming, for $73.3 million, Samson is expected to utilize substantially all of it’s existing NOLs. Samson also believes that reflecting the impact of future income taxes in its SMOG calculation is appropriate under the circumstances because many other public companies disclose the impact of future impact taxes, making Samson’s SMOG more readily comparable with that disclosed by those other companies.
| 78 |
The following table shows the estimated standardized measure of discounted future net cash flows relating to proved reserves (in US$’000’s):
| Fiscal Year Ended June 30 | ||||||||||||||||||||
| 2013 | 2012 | 2011 | 2010 | 2009 | ||||||||||||||||
| Future cash inflows | $ | 133,589 | $ | 71,655 | $ | 46,250 | $ | 67,996 | $ | 67,630 | ||||||||||
| Future production costs | (44,672 | ) | (29,321 | ) | (16,046 | ) | (23,288 | ) | (20,290 | ) | ||||||||||
| Future development costs | (29,012 | ) | (10,198 | ) | (917 | ) | (11,910 | ) | (5,416 | ) | ||||||||||
| Future income taxes | (12,050 | ) | (5,524 | ) | (4,357 | ) | – | (143 | ) | |||||||||||
| Future net cashflows | 47,855 | 26,612 | 24,930 | 32,798 | 41,781 | |||||||||||||||
| 10 % discount | (26,012 | ) | (13,274 | ) | (10,207 | ) | (17,675 | ) | (24,054 | ) | ||||||||||
| Standardized measure of discounted future net cash flows relating to proved reserves | $ | 21,843 | $ | 13,338 | $ | 14,723 | $ | 15,123 | $ | 17,727 | ||||||||||
The principal sources of changes in the standardized measure of discounted future net cash flows during the periods ended June 30, 2013, June 30, 2012 and June 30, 2011 are as follows (in US$’000’s):
| Fiscal Year Ended June 30 | ||||||||||||
| 2013 | 2012 | 2011 | ||||||||||
| Beginning of year | $ | 13,338 | $ | 14,723 | $ | 15,123 | ||||||
| Sales of oil and gas produced during the period, net of production costs | (2,338 | ) | (5,596 | ) | (4,838 | ) | ||||||
| Net changes in prices and production costs | 8,027 | 3,216 | 7,983 | |||||||||
| Previously estimated development costs incurred during the period | - | 917 | 3,713 | |||||||||
| Changes in estimates of future development costs | (18,814 | ) | (10,198 | ) | (5,256 | ) | ||||||
| Extensions, discoveries and improved recovery | 5,892 | 11,354 | - | |||||||||
| Revisions of previous quantity estimates and other | 7,419 | (643 | ) | 5,810 | ||||||||
| Sale of reserves in place | - | - | (6,522 | ) | ||||||||
| Purchase of reserves in place | 11,664 | - | - | |||||||||
| Change in future income taxes | (6,526 | ) | (987 | ) | (2,573 | ) | ||||||
| Accretion of discount | 1,334 | 1,472 | 1,512 | |||||||||
| Other | 1,847 | (920 | ) | (229 | ) | |||||||
| Balance at end of year | $ | 21,843 | $ | 13,338 | $ | 14,723 | ||||||
The increase in extensions, discoveries and improved recovery during year ended June 30, 2013 mainly relates to our recognition of four new proved undeveloped locations in our Rainbow project in North Dakota and decreased salt water disposal costs North Stockyard field in North Dakota, following the drilling of a salt water disposal well and water gathering system in the field.
| 79 |