Attached files
| file | filename |
|---|---|
| 8-K - FORM 8-K - Mondelez International, Inc. | d592185d8k.htm |
| EX-99.1 - MONDELEZ INTERNATIONAL, INC. PRESS RELEASE, DATED SEPTEMBER 3, 2013. - Mondelez International, Inc. | d592185dex991.htm |
 0
Mondel z International
Barclays Capital
Back to School Conference
September 3, 2013
Exhibit 99.2 |
 Irene
Rosenfeld Chairman and CEO
1 |
| Forward-looking statements
2
This
slide
presentation
contains
a
number
of
forward-looking
statements.
The
words
“will,”
“expect,”
“intend,”
“plan,”
“drive,”
“commit,”
“accelerate,”
“improve,”
“increase,”
“deliver,”
“opportunity,”
“growth,”
“outlook,”
“guidance”
and
similar
expressions
are
intended
to
identify
our
forward-looking
statements.
Examples
of
forward-looking
statements
include,
but
are
not
limited
to,
statements
we
make
about
our
future
performance,
including
future
revenue
growth,
earnings
per
share
and
margins;
the
drivers
of
our
future
performance,
including
production,
and
productivity
and
cash
management
improvements;
our
investments
in
emerging
markets;
and
confidence
in
our
future.
These
forward-looking
statements
involve
risks
and
uncertainties,
many
of
which
are
beyond
our
control,
and
important
factors
that
could
cause
actual
results
to
differ
materially
from
those
in
our
forward-looking
statements
include,
but
are
not
limited
to,
continued
global
economic
weakness,
increased
competition,
continued
volatility
of
commodity
and
other
input
costs,
business
disruptions,
pricing
actions,
and
risks
from
operating
globally
and
tax
law
changes.
For
additional
information
on
these
and
other
factors
that
could
affect
our
forward-looking
statements,
see
our
risk
factors,
as
they
may
be
amended
from
time
to
time,
set
forth
in
our
filings
with
the
SEC,
including
our
most
recently
filed
Annual
Report
on
Form
10-K.
We
disclaim
and
do
not
undertake
any
obligation
to
update
or
revise
any
forward-looking
statement
in
this
slide
presentation,
except
as
required
by
applicable
law
or
regulation. |
 Mondel
z International is well-positioned
for success
3
Advantaged
Geographic
Footprint
Fast-
Growing
Categories
Favorite
Snacks
Brands
Strong
Routes-to-
Market
Proven
Innovation
Platforms
World-Class
Talent &
Capabilities |
 Virtuous cycle driving long-term targets
4
Adjusted
EPS Growth
5%-7%
Double-Digit
(cst. FX)
Organic Net
Revenue Growth
Long-Term Targets
Expand
Gross
Margin
Reinvest
in
Growth
Leverage
Overheads
Focus on
Power Brands &
Priority Markets
Operating
Income Growth
High Single-
Digit (cst. FX) |
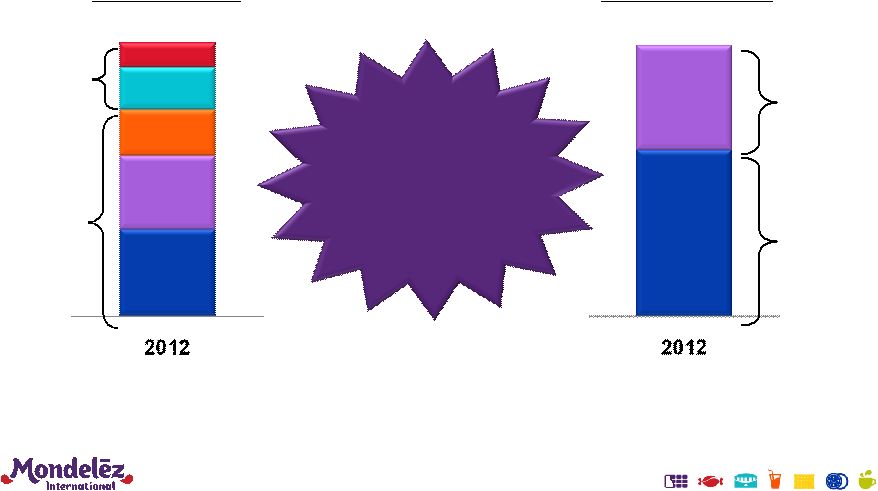 Top-tier, long-term revenue growth target
supported by advantaged portfolio
5
Double digit
growth
Low-to-mid
single digit
growth
Developed
Markets
Emerging
Markets
By Geography
Low-to-mid
single digit
growth
Mid-to-high
single digit
growth
Chocolate
Biscuits
Gum &
Candy
Beverages
Cheese/Grocery
By Category
5% -
7%
Organic Growth |
 Significant operating income growth driven by
margin expansion
6
Strong track record of margin gains
250 bps of opportunity from gross margin expansion
(1) Please see the GAAP to non-GAAP reconciliations provided at the end of
this presentation. Adjusted Operating Income Margin
(1)
9.2%
9.6%
11.0%
11.5%
12.2%
14% -
16%
2008
2009
2010
2011
2012
LT Target |
 Opportunity is largely in North America and Europe
Adjusted Operating Income Margin
North America
Europe
LA, AP, EEMEA
Combined
7
(1) Please see the GAAP to non-GAAP reconciliations provided at the end
of this presentation. |
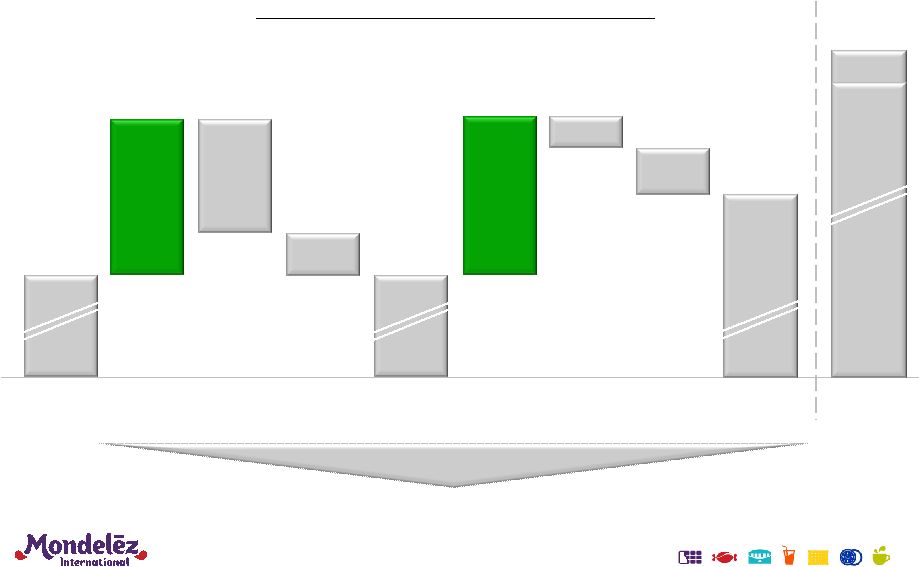
 Delivering base margin expansion critical to
delivering growth
8
Double Digit EPS Growth*
2012
Base
Margin
Expansion
Emerging
Markets
Investments
Ongoing
Restructuring
+60 to
+90 bps
(10) to
(20) bps
2013
12.2%
(1)
Base
Margin
Expansion
+60 to
+90 bps
High
12s
2014
~12%
Emerging
Markets
Investments
~(10) bps
Ongoing
Restructuring
(50) to
(70) bps
(10) to
(20) bps
Adjusted Operating Income Margin
Target
Ex.
Restructuring
14%-16%
14.5%-16.5%
* On a constant currency basis
(1)
Reported operating income margin was 10.4% for FY 2012. See GAAP to
Non-GAAP reconciliation at the end
of this presentation. |
 Productivity is primary driver of base margin
expansion
9
Double Digit EPS Growth*
* On a constant currency basis
(1)
Reported operating income margin was 10.4% for FY 2012. See GAAP to
Non-GAAP reconciliation at the end
of this presentation.
2012
Base
Margin
Expansion
Emerging
Markets
Investments
Ongoing
Restructuring
2013
12.2%
(1)
Base
Margin
Expansion
High
12s
2014
~12%
Emerging
Markets
Investments
Ongoing
Restructuring
+60 to
+90 bps
+60 to
+90 bps
Adjusted Operating Income Margin
Target
Ex.
Restructuring
14%-16%
14.5%-16.5% |
 Daniel Myers
EVP Integrated Supply Chain |
 Focused plan to deliver world-class supply chain
Priorities
3 Year Financial Goals
$3B Gross Productivity
Cost Savings
(~$1B/per year; ~4.5% of COGS)
$1.5B Net Productivity
Cost Savings
(~$0.5B/per year; ~2.3% of COGS)
$1B Cash Flow
Step change leadership talent
& capabilities
Transform global
manufacturing platforms
Redesign the supply chain
network
Drive productivity programs to
fuel growth
Improve cash management
1
2
3
4
5
11 |
 Acquisitions drove supply chain complexity
•
Significant number of SKUs, formats and formulas
•
Fragmented supplier base
•
Sub-scale plants with low efficiency assets
1990
2000
2010
12 |
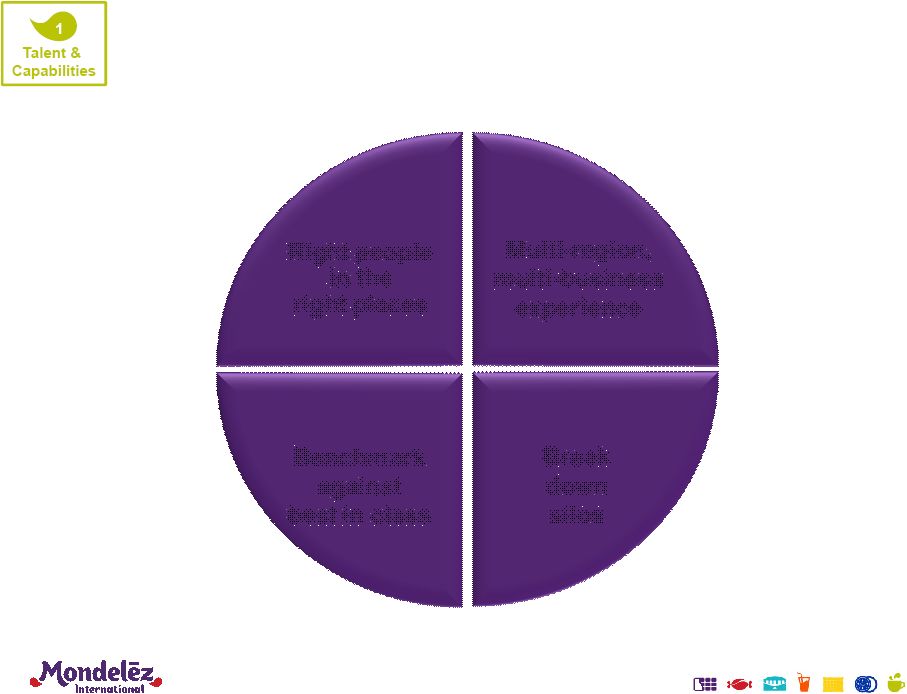 Success begins with a step change in
leadership talent and capabilities
Benchmark
against
best in class
Right people
in the
right places
Break
down
silos
Multi-region,
multi-business
experience
13 |
 2
Transform
Platforms
Global platform transformation process
14 |
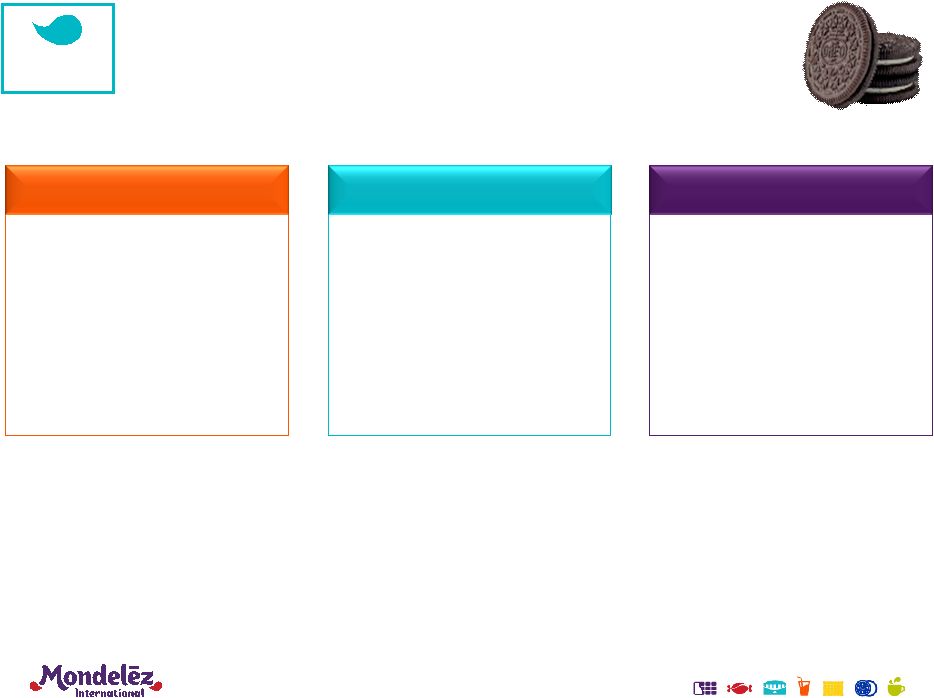 Oreo: “Imagine if…”
became reality
•
30% reduction in
capital cost
•
$10MM in operating
cost savings per line
•
+500 bps gross
margin improvement
•
New capacity in 1/3
the time
•
Modular design for 7
days start-up
•
Global expansion in
less than 6 months
•
Standard building
block one-time design
•
Standard equipment
& operations
•
Supplier-enabled
scale and speed
Scale
Speed
Agility
2
Transform
Platforms
15 |
 Making
Packing
Past
Now
Oreo: Double the capacity, with half
the footprint and fewer people
2
Transform
Platforms
Making
Packing
16 |
 Growing on advantaged assets at
advantaged costs
3
Redesign
Network
Simplify, Standardize, Create Scale
Grow Capacity
•
Growth platforms on
advantaged assets in
strategic locations
Collaborate with
Suppliers
•
Increased supplier
collaboration &
co-location
Optimize Logistics
•
Minimize touches to
improve service delivery
and inventory levels
17 |
 Capacity
Increase
+24%
+28%
New Greenfield
Sites
+8
+5
Power Brands
on Advantaged
Assets
~15%
~50%
by ’16
~80%
by ’20
Net Revenue
per Plant
~$210MM
~$300MM
by ‘16
~$500MM
by ‘20
2012
2013 -
2016
2017 -
2020
Redesigning supply chain to deliver
world-class efficiency
3
Redesign
Network
18 |
 Our
new facility in Mexico will use an integrated supply chain approach
3
Redesign
Network
19 |
 Stepping up productivity delivery
Integrated
Lean Six Sigma
Procurement
Transformation
Simplicity
20 |
 Integrated Lean Six Sigma delivers best in
class reliability and efficiency
•
450 plant leaders trained
•
300 black belts certified &
2,000 green belts trained
•
14 plants commissioned as
lead sites; 103 sites by 2015
4
Productivity
21 |
 Procurement Transformation continues to
drive productivity
2009 –
2012 leveraged
global scale
Shifting resources from
local to enterprise-wide
“spend towers”
Streamlining specifications
Strengthening relationships
with fewer, more strategic
suppliers
4
Productivity
22 |
 Simplicity: Streamlining SKUs, packaging
and recipes
Today
2016
4,000
2,500
# SKUs
55
40
Food formats
39
26
Technologies
89
72
Production lines
Pan-EU brands as % Biscuits
45%
60%
Targeting a 60% reduction in complexity to deliver ~$100MM
European Biscuit Category
4
Productivity
23 |
 Focus on cash management to fund
future investments in capital and growth
5
Cash
Management
DSO
•
Terms compliance
•
Sales phasing
•
Term negotiations
DIOH
•
Raw and pack
•
Finished goods
•
Infrastructure
•
Processes &
technology
DPO
•
Payment terms
rationalization
•
Frequency extension
•
Supply chain
financing
$1 billion in incremental cash over next three years
24 |
 Focused plan to deliver world-class supply chain
Priorities
Step change leadership talent
& capabilities
Transform global platforms
Redesign the supply chain
network
Drive productivity programs to
fuel growth
Improve cash management
1
2
3
4
5
25
3 Year Financial Goals
$3B Gross Productivity
Cost Savings
(~$1B/per year; ~4.5% of COGS)
$1.5B Net Productivity
Cost Savings
(~$0.5B/per year; ~2.3% of COGS)
$1B Cash Flow |
 Dave
Brearton EVP & CFO |
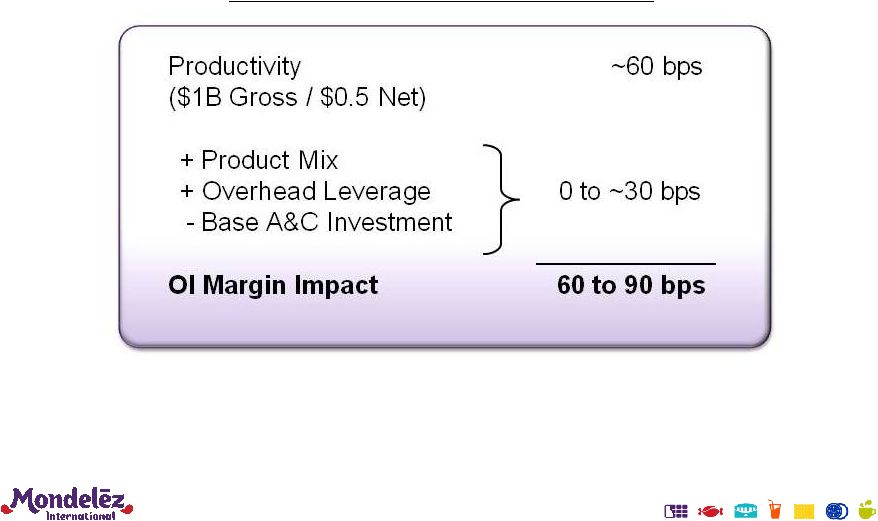 Productivity is primary driver of margin expansion
27
Base Margin Expansion Components |
 Committed to delivering top-tier performance
Well-positioned for success
Virtuous growth cycle provides framework to deliver
top-tier performance
Integrated supply chain will drive base margin expansion
and generate strong cash flow
2013 outlook:
-
Organic revenue growth at low-end of 5%-7% range
-
Adjusted
EPS
of
$1.55-$1.60
(1)
28
(1)
Adjusted EPS Guidance includes an estimated ($0.04) impact from the Venezuelan
bolivar devaluation. It excludes the impact of all other currency translation. |
 29
*
*
*
*
*
*
* |
 GAAP
to Non-GAAP Reconciliation 30
As Revised
(GAAP)
Integration
Program Costs
and other
acquisition
integration
costs
(1)
Spin-Off Costs
and Related
Adjustments
(2)
Restructuring
Program
Costs
(3)
Acquisition-
Related
Costs
(4)
Impact of
Divestitures
(5)
(Gain)/Loss on
divestitures,
net
As Adjusted
(Non-GAAP)
For the Year Ended December 31, 2008
Net Revenues
22,872
$
-
$
-
$
-
$
-
$
(666)
$
-
$
22,206
$
Operating Income
1,148
81
91
708
-
(84)
91
2,035
Operating Income Margin
5.0%
9.2%
For the Year Ended December 31, 2009
Net Revenues
21,559
$
-
$
-
$
-
$
-
$
(377)
$
-
$
21,182
$
Operating Income
2,016
27
91
(76)
40
(73)
6
2,031
Operating Income Margin
9.4%
9.6%
For the Year Ended December 31, 2010
Net Revenues
31,489
$
1
$
-
$
-
$
-
$
(500)
$
-
$
30,990
$
Operating Income
2,496
646
91
(29)
273
(67)
-
3,410
Operating Income Margin
7.9%
11.0%
For the Year Ended December 31, 2011
Net Revenues
35,810
$
1
$
-
$
-
$
-
$
(429)
$
-
$
35,382
$
Operating Income
3,498
521
137
(5)
-
(67)
-
4,084
Operating Income Margin
9.8%
11.5%
For the Year Ended December 31, 2012
Net Revenues
35,015
$
-
$
-
$
-
$
-
$
(340)
$
-
$
34,675
$
Operating Income
3,637
140
512
110
1
(58)
(107)
4,235
Operating Income Margin
10.4%
12.2%
(1)
(2)
(3)
(4)
Acquisition-related costs for 2009 and 2010 relate to the acquisition of Cadbury
and include transaction advisory fees, U.K. stamp taxes and the impact of the
Cadbury inventory revaluation. (5)
Includes all divestitures that have occurred through 2013.
Restructuring Program costs represent non-recurring restructuring and related
implementation costs reflecting primarily severance, asset disposals and other manufacturing
related non-recurring costs. For the
years 2008 to 2011, refers to the 2004-2008 Restructuring Program. For the year
2012, refers to 2012-2014 Restructuring Program. Mondelez
International Reported to Adjusted Operating Income Margin
($ in millions, except percentages) (Unaudited)
Integration
Program
costs
are
defined
as
the
costs
associated
with
combining
the
Mondelez
International
and
Cadbury
businesses,
and
are
separate
from
those
costs
associated
with
the
acquisition.
Other
acquisition integration costs are defined as the costs associated with combining the
Mondelez International and LU businesses, and are separate from those costs associated with the acquisition.
Spin-Off Costs represent transaction and transition costs associated with
preparing the businesses for independent operations consisting primarily of financial advisory fees, legal fees, accounting
fees, tax
services and information systems infrastructure duplication, and
financing and related costs to redistribute debt and secure investment grade
ratings for both the Kraft Foods Group business and the Mondelez
International business. Spin-Off related adjustments refers to the pension
adjustment defined as the estimated benefit plan expense associated with
certain benefit plan obligations transferred to Kraft Foods Group in the
Spin-Off. |
 GAAP
to Non-GAAP Reconciliation 31
As Revised
(GAAP)
Integration
Program
Costs
(1)
Spin-Off Costs
and Related
Adjustments
(2)
2012-2014
Restructuring
Program
Costs
(3)
Impact of
Divestitures
(4)
As Adjusted
(Non-GAAP)
Latin America
Net Revenues
5,396
$
-
$
-
$
-
$
-
$
5,396
$
Segment Operating Income
769
$
30
$
8
$
7
$
-
$
814
$
Segment Operating Income Margin
14.3%
15.1%
Asia Pacific
Net Revenues
5,164
$
-
$
-
$
-
$
-
$
5,164
$
Segment Operating Income
657
$
40
$
19
$
-
$
-
$
716
$
Segment Operating Income Margin
12.7%
13.9%
Eastern Europe, Middle East & Africa
Net Revenues
3,735
$
-
$
-
$
-
$
(96)
$
3,639
$
Segment Operating Income
506
$
13
$
-
$
-
$
(1)
$
518
$
Segment Operating Income Margin
13.5%
14.2%
LA, AP and EEMEA Combined
Net Revenues
14,295
$
-
$
-
$
-
$
(96)
$
14,199
$
Segment Operating Income
1,932
$
83
$
27
$
7
$
(1)
$
2,048
$
Segment Operating Income Margin
13.5%
14.4%
Europe
Net Revenues
13,817
$
-
$
-
$
-
$
(197)
$
13,620
$
Segment Operating Income
1,762
$
47
$
1
$
6
$
(51)
$
1,765
$
Segment Operating Income Margin
12.8%
13.0%
North America
Net Revenues
6,903
$
-
$
-
$
-
$
(47)
$
6,856
$
Segment Operating Income
781
$
6
$
77
$
98
$
(7)
$
955
$
Segment Operating Income Margin
11.3%
13.9%
(1)
(2)
(3)
(4)
Mondelez International
Segment Operating Income To Adjusted Segment Operating Income
For the Twelve Months Ended December 31, 2012
($ in millions, except percentages) (Unaudited)
Integration Program costs are defined as the costs associated with combining the
Mondelez International and Cadbury businesses, and are separate from those costs associated with
the acquisition.
Spin-Off Costs represent transaction and transition costs associated with
preparing the businesses for independent operations consisting primarily of financial advisory fees, legal fees,
accounting fees, tax services and information systems infrastructure duplication,
and financing and related costs to redistribute debt and secure investment grade ratings for both the
Kraft Foods Group business and the Mondelez International business.
Spin-Off related adjustments include the pension adjustment defined as the estimated benefit plan expense
associated with certain benefit plan obligations transferred to Kraft Foods Group
in the Spin-Off. Restructuring Program costs represent restructuring and
related implementation costs reflecting primarily severance, asset disposals and other manufacturing-related costs.
Includes all divestitures that have occurred through 2013.
|