Attached files
| file | filename |
|---|---|
| 8-K - CURRENT REPORT OF MATERIAL EVENTS OR CORPORATE CHANGES - Monogram Residential Trust, Inc. | a13-19314_18k.htm |
Exhibit 99.1
|
|
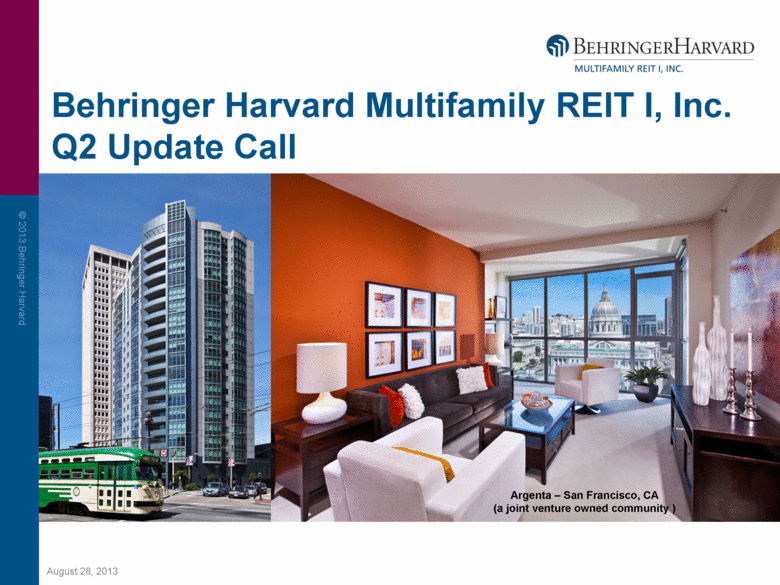
Behringer Harvard Multifamily REIT I, Inc. Q2 Update Call Argenta – San Francisco, CA (a joint venture owned community ) |
|
|
Forward-Looking Statements This presentation contains forward-looking statements, including discussion and analysis of the financial condition of Behringer Harvard Multifamily REIT I, Inc. (the “REIT”) and its subsidiaries and relating to the occurrence and timing of the REIT’s self-management transaction and other matters. These forward-looking statements are not historical facts but are the intent, belief or current expectations of the REIT’s management based on their knowledge and understanding of the REIT’s business and industry. Words such as “may,” “anticipates,” “expects,” “intends,” “plans,” “believes,” “seeks,” “estimates,” “would,” “could,” “should” and variations of these words and similar expressions are intended to identify forward-looking statements. We intend that such forward-looking statements be subject to the safe harbor provisions created by Section 27A of the Securities Act of 1933, as amended (the “Securities Act”), and Section 21E of the Securities Exchange Act of 1934, as amended (the “Exchange Act”). These statements are not guarantees of future performance and are subject to risks, uncertainties and other factors, some of which are beyond our control, are difficult to predict and could cause actual results to differ materially from those expressed or forecasted in the forward-looking statements. Forward-looking statements that were true at the time made may ultimately prove to be incorrect or false. We caution you not to place undue reliance on forward-looking statements, which reflect the REIT’s management's view only as of the date of this presentation. We undertake no obligation to update or revise forward-looking statements to reflect changed assumptions the occurrence of unanticipated events or changes to future operating results. |
|
|
Forward-Looking Statements Factors that could cause actual results to vary materially from any forward-looking statements made in this presentation include, but are not limited to: absence of a public market for the REIT’s securities; limited operating history; limited transferability and lack of liquidity; risks associated with lending activities; no assurance that distributions will continue to be made or that any particular rate of distribution will be maintained; until the proceeds from an offering are invested and generating cash flow from operating activities, some or all of the distributions will be paid from other sources, which may be deemed a return of capital, such as from the proceeds of an offering, cash advances by the advisor, cash resulting from a waiver of asset management fees, proceeds from the sales of assets, and borrowings in anticipation of future cash flow from operating activities, which could result in less proceeds to make investments in real estate; reliance on the program’s advisor; payment of significant fees to the advisor and their affiliates; potential conflicts of interest; lack of diversification in property holdings; market and economic challenges experienced by the U.S. economy or real estate industry as a whole and the local economic conditions in the markets in which our properties are located; the REIT’s ability to make accretive investments in a diversified portfolio of assets; availability of cash flow from operating activities for distribution; the REIT’s level of debt and the terms and limitations imposed on the REIT by its debt agreements; the availability of credit generally, and any failure to obtain debt financing at favorable terms or a failure to satisfy the conditions and requirements of that debt; the ability to secure resident leases at favorable rental rates; the ability to raise future capital through equity and debt security offerings and through joint venture arrangements; the ability to retain our executive officers and other key personnel of our advisor, our property manager and their affiliates; conflicts of interest arising out of our relationships with our advisor and its affiliates; the ability to successfully transition to a self-managed company; unfavorable changes in laws or regulations impacting our business, our assets or our key relationships; factors that could affect our ability to qualify as a real estate investment trust; potential development risks and construction delays; the potential inability to retain current tenants and attract new tenants due to a competitive real estate market; risk that a program’s operating results will be affected by economic and regulatory changes that have an adverse impact on a program’s investments; risks related to investments in distressed properties or debt include possible default under the original loan; unforeseen increases in operating and capital expenses; declines in real estate values; and, lack of availability of due diligence information. These risks may impact the REIT’s financial condition, operating results, returns to its shareholders, and ability to make distributions as stated in the REIT’s offering. Investment in securities of Behringer Harvard real estate programs is subject to substantial risks and may result in the loss of principal invested. Real Estate programs are not suitable for all investors. The forward looking statements should be read in light of these and other risk factors identified in the “Risk Factors” section of the REIT’s our Annual Report on Form 10-K for the year ended December 31, 2012 and in subsequent Quarterly Reports on Form 10-Q, as filed with the Securities and Exchange Commission. |

|
|
Questions? Live question and answer session after prepared remarks During the call, please e-mail questions to: bhreit@behringerharvard.com |

|
|
Today’s Presenters Robert S. Aisner Chief Executive Officer Mark T. Alfieri President and Chief Operating Officer Howard S. Garfield Chief Financial Officer |

|
|
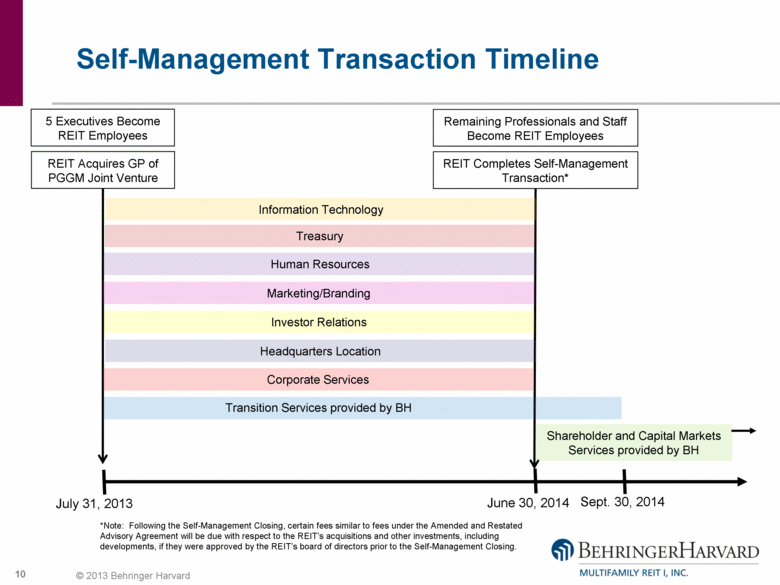
Self-Management Transaction Process Disclosed on August 6th on Form 8-K and in recent Form 10-Q filing Process started with the hiring of five executives by the REIT: Mark Alfieri, President and Chief Operating Officer Howard Garfield, Chief Financial Officer and Chief Accounting Officer Ross Odland, Senior Vice President – Portfolio Management Daniel Rosenberg, General Counsel – Securities and Risk Management and Secretary Peggy Daly, Senior Vice President – Property Management Bob Aisner remains CEO until transaction closing on June 30, 2014, at which time Mark Alfieri will become CEO Remaining professionals and staff providing advisory and property management services will become employees at close of transaction |

|
|
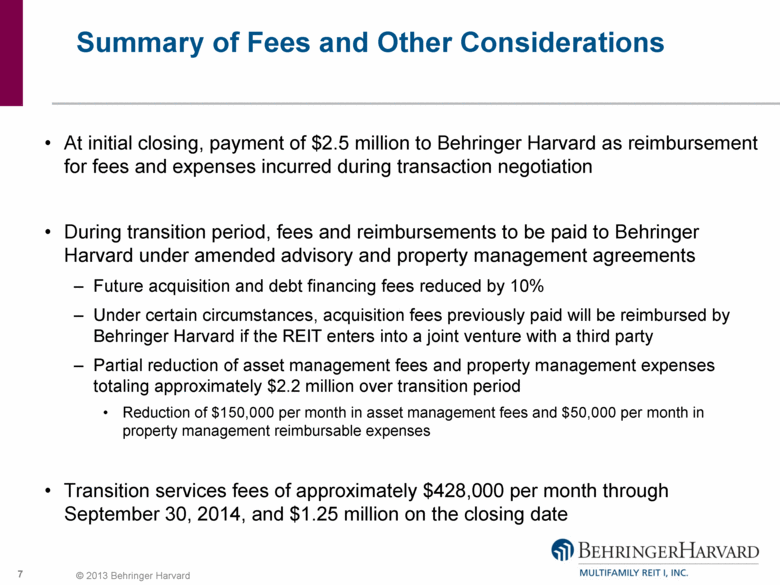
Summary of Fees and Other Considerations At initial closing, payment of $2.5 million to Behringer Harvard as reimbursement for fees and expenses incurred during transaction negotiation During transition period, fees and reimbursements to be paid to Behringer Harvard under amended advisory and property management agreements Future acquisition and debt financing fees reduced by 10% Under certain circumstances, acquisition fees previously paid will be reimbursed by Behringer Harvard if the REIT enters into a joint venture with a third party Partial reduction of asset management fees and property management expenses totaling approximately $2.2 million over transition period Reduction of $150,000 per month in asset management fees and $50,000 per month in property management reimbursable expenses Transition services fees of approximately $428,000 per month through September 30, 2014, and $1.25 million on the closing date |
|
|
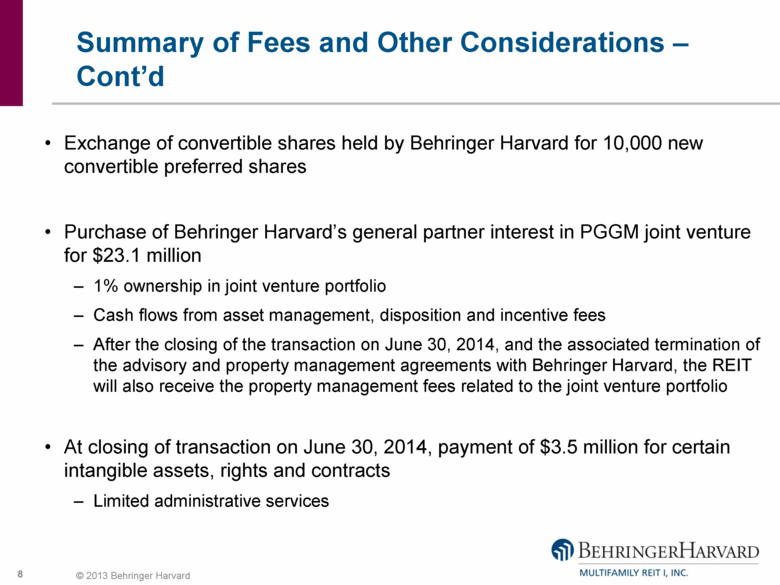
Summary of Fees and Other Considerations – Cont’d Exchange of convertible shares held by Behringer Harvard for 10,000 new convertible preferred shares Purchase of Behringer Harvard’s general partner interest in PGGM joint venture for $23.1 million 1% ownership in joint venture portfolio Cash flows from asset management, disposition and incentive fees After the closing of the transaction on June 30, 2014, and the associated termination of the advisory and property management agreements with Behringer Harvard, the REIT will also receive the property management fees related to the joint venture portfolio At closing of transaction on June 30, 2014, payment of $3.5 million for certain intangible assets, rights and contracts Limited administrative services |
|
|
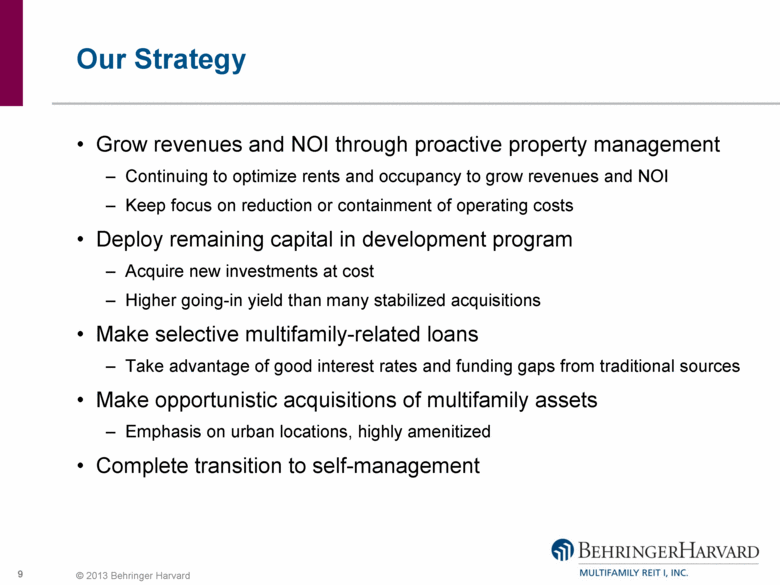
Our Strategy Grow revenues and NOI through proactive property management Continuing to optimize rents and occupancy to grow revenues and NOI Keep focus on reduction or containment of operating costs Deploy remaining capital in development program Acquire new investments at cost Higher going-in yield than many stabilized acquisitions Make selective multifamily-related loans Take advantage of good interest rates and funding gaps from traditional sources Make opportunistic acquisitions of multifamily assets Emphasis on urban locations, highly amenitized Complete transition to self-management |
|
|
Self-Management Transaction Timeline July 31, 2013 June 30, 2014 Sept. 30, 2014 5 Executives Become REIT Employees Remaining Professionals and Staff Become REIT Employees Treasury Information Technology Shareholder and Capital Markets Services provided by BH REIT Acquires GP of PGGM Joint Venture REIT Completes Self-Management Transaction* Human Resources Marketing/Branding Investor Relations Headquarters Location *Note: Following the Self-Management Closing, certain fees similar to fees under the Amended and Restated Advisory Agreement will be due with respect to the REIT’s acquisitions and other investments, including developments, if they were approved by the REIT’s board of directors prior to the Self-Management Closing. Corporate Services Transition Services provided by BH |
|
|
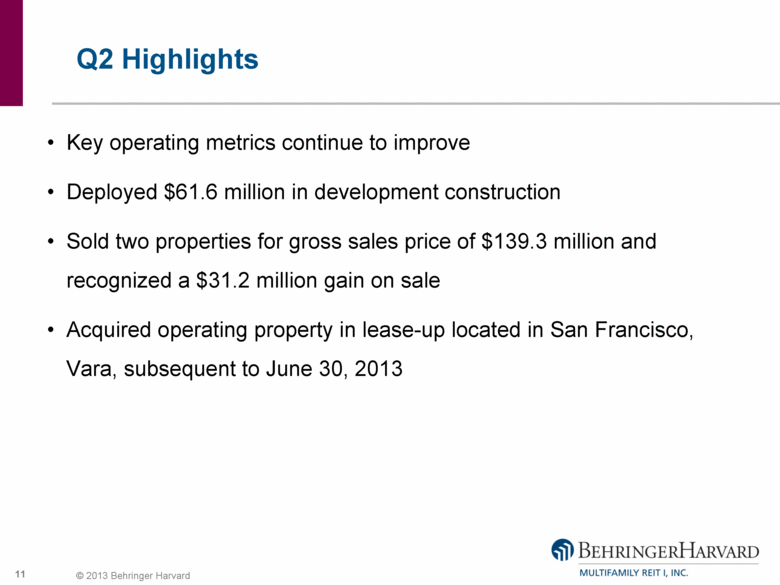
Q2 Highlights Key operating metrics continue to improve Deployed $61.6 million in development construction Sold two properties for gross sales price of $139.3 million and recognized a $31.2 million gain on sale Acquired operating property in lease-up located in San Francisco, Vara, subsequent to June 30, 2013 |
|
|
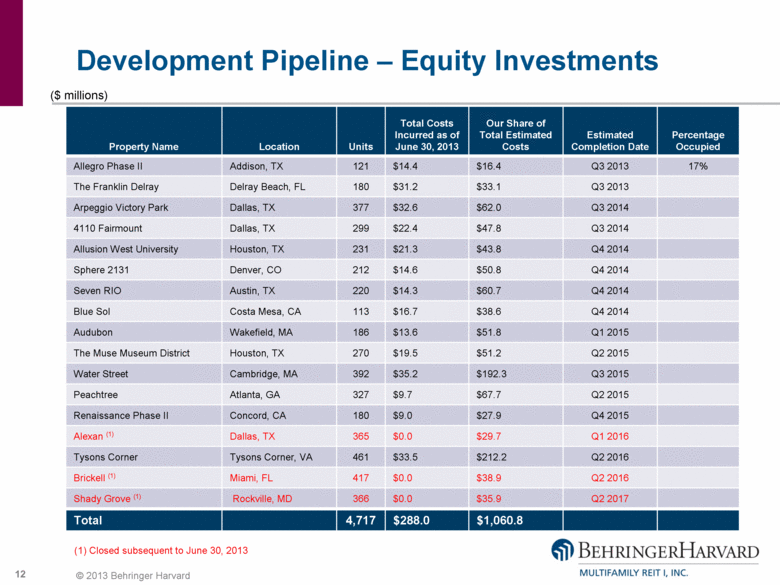
Development Pipeline – Equity Investments Property Name Location Units Total Costs Incurred as of June 30, 2013 Our Share of Total Estimated Costs Estimated Completion Date Percentage Occupied Allegro Phase II Addison, TX 121 $14.4 $16.4 Q3 2013 17% The Franklin Delray Delray Beach, FL 180 $31.2 $33.1 Q3 2013 Arpeggio Victory Park Dallas, TX 377 $32.6 $62.0 Q3 2014 4110 Fairmount Dallas, TX 299 $22.4 $47.8 Q3 2014 Allusion West University Houston, TX 231 $21.3 $43.8 Q4 2014 Sphere 2131 Denver, CO 212 $14.6 $50.8 Q4 2014 Seven RIO Austin, TX 220 $14.3 $60.7 Q4 2014 Blue Sol Costa Mesa, CA 113 $16.7 $38.6 Q4 2014 Audubon Wakefield, MA 186 $13.6 $51.8 Q1 2015 The Muse Museum District Houston, TX 270 $19.5 $51.2 Q2 2015 Water Street Cambridge, MA 392 $35.2 $192.3 Q3 2015 Peachtree Atlanta, GA 327 $9.7 $67.7 Q2 2015 Renaissance Phase II Concord, CA 180 $9.0 $27.9 Q4 2015 Alexan (1) Dallas, TX 365 $0.0 $29.7 Q1 2016 Tysons Corner Tysons Corner, VA 461 $33.5 $212.2 Q2 2016 Brickell (1) Miami, FL 417 $0.0 $38.9 Q2 2016 Shady Grove (1) Rockville, MD 366 $0.0 $35.9 Q2 2017 Total 4,717 $288.0 $1,060.8 ($ millions) (1) Closed subsequent to June 30, 2013 |
|
|
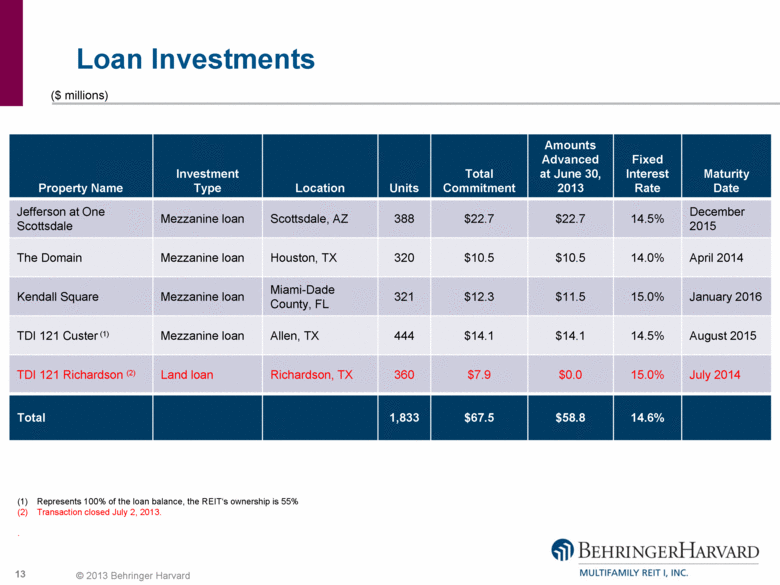
Loan Investments Property Name Investment Type Location Units Total Commitment Amounts Advanced at June 30, 2013 Fixed Interest Rate Maturity Date Jefferson at One Scottsdale Mezzanine loan Scottsdale, AZ 388 $22.7 $22.7 14.5% December 2015 The Domain Mezzanine loan Houston, TX 320 $10.5 $10.5 14.0% April 2014 Kendall Square Mezzanine loan Miami-Dade County, FL 321 $12.3 $11.5 15.0% January 2016 TDI 121 Custer (1) Mezzanine loan Allen, TX 444 $14.1 $14.1 14.5% August 2015 TDI 121 Richardson (2) Land loan Richardson, TX 360 $7.9 $0.0 15.0% July 2014 Total 1,833 $67.5 $58.8 14.6% ($ millions) Represents 100% of the loan balance, the REIT‘s ownership is 55% Transaction closed July 2, 2013. . |
|
|
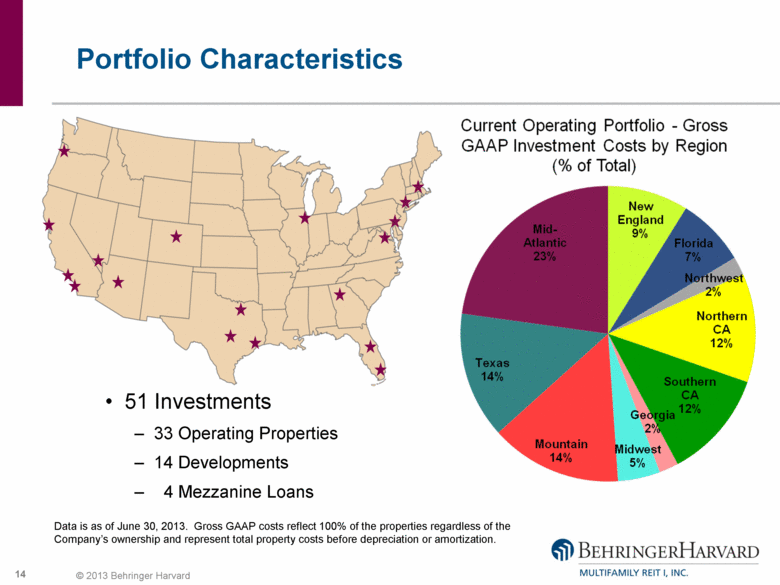
Portfolio Characteristics 51 Investments 33 Operating Properties 14 Developments 4 Mezzanine Loans Data is as of June 30, 2013. Gross GAAP costs reflect 100% of the properties regardless of the Company’s ownership and represent total property costs before depreciation or amortization. Current Operating Portfolio - Gross GAAP Investment Costs by Region (% of Total) Mid-Atlantic 23% New England 9% Florida 7% Northwest 2% Northern CA 12% Southern CA 12% Georgia 2% Midwest 5% Mountain 14% Texas 14% |
|
|
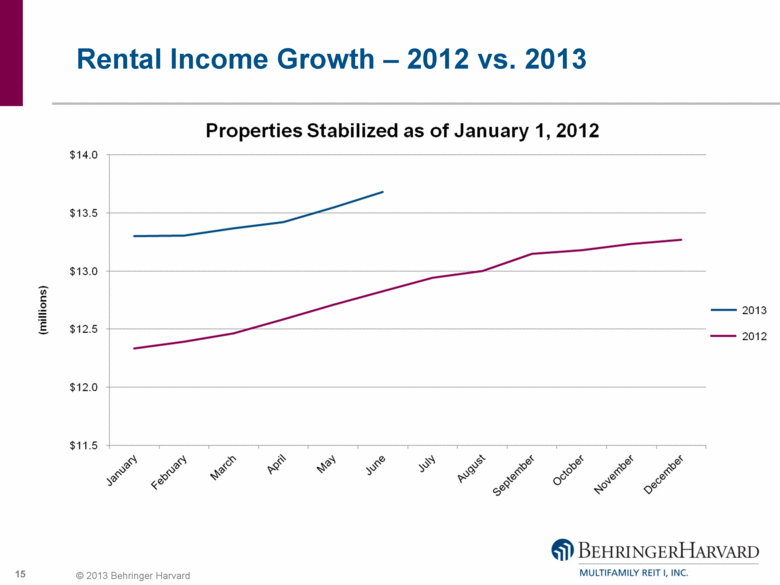
Rental Income Growth – 2012 vs. 2013 Properties Stabilized as of January 1, 2012 $14.0 $13.5 $13.0 $12.5 $12.0 $11.5 January February March April may June July August September October November December 2013 2012 |
|
|
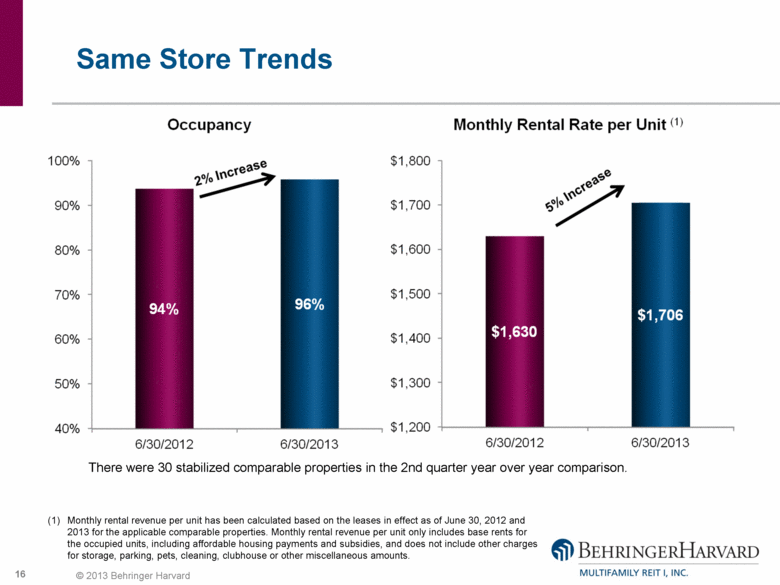
Same Store Trends There were 30 stabilized comparable properties in the 2nd quarter year over year comparison. Monthly rental revenue per unit has been calculated based on the leases in effect as of June 30, 2012 and 2013 for the applicable comparable properties. Monthly rental revenue per unit only includes base rents for the occupied units, including affordable housing payments and subsidies, and does not include other charges for storage, parking, pets, cleaning, clubhouse or other miscellaneous amounts. Occupancy 100% 90% 80% 70% 60% 50% 40% 94% 96% 2% Increase Monthly Rental Rate per Unit (1) $1,800 $1,700 $1,600 $1,500 $1,400 $1,300 $1,200 $1,630 $1,706 5% Increase 6/30/2012 6/30/2013 |
|
|
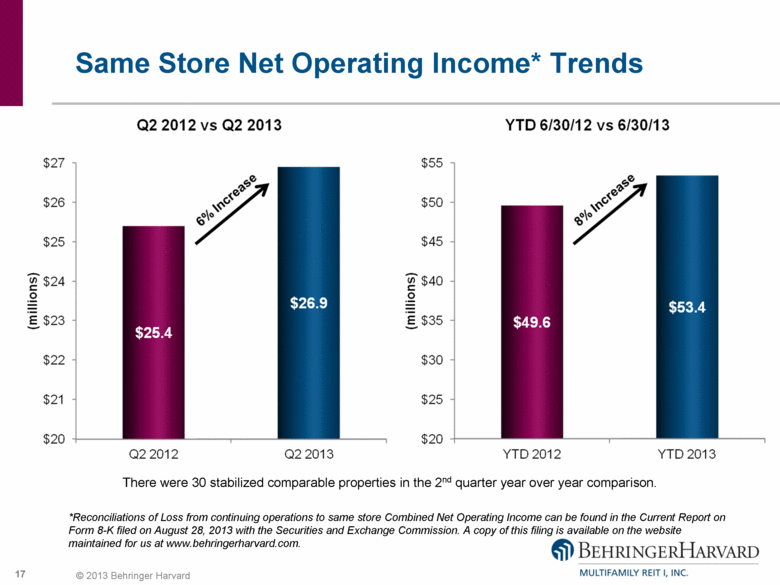
*Reconciliations of Loss from continuing operations to same store Combined Net Operating Income can be found in the Current Report on Form 8-K filed on August 28, 2013 with the Securities and Exchange Commission. A copy of this filing is available on the website maintained for us at www.behringerharvard.com. Same Store Net Operating Income* Trends There were 30 stabilized comparable properties in the 2nd quarter year over year comparison. $27 $26 $25 $24 $23 $22 $21 $20 Q2 2012 Q2 2013 Q2 2012 vs Q2 2013 6% Increase $25.4 $26.9 (millions) (millions) $55 $50 $45 $40 $35 $30 $25 $20 YTD 2012 YTD 2013 8% Increase YTD 6/30/12 vs YTD 6/30/13 |
|
|
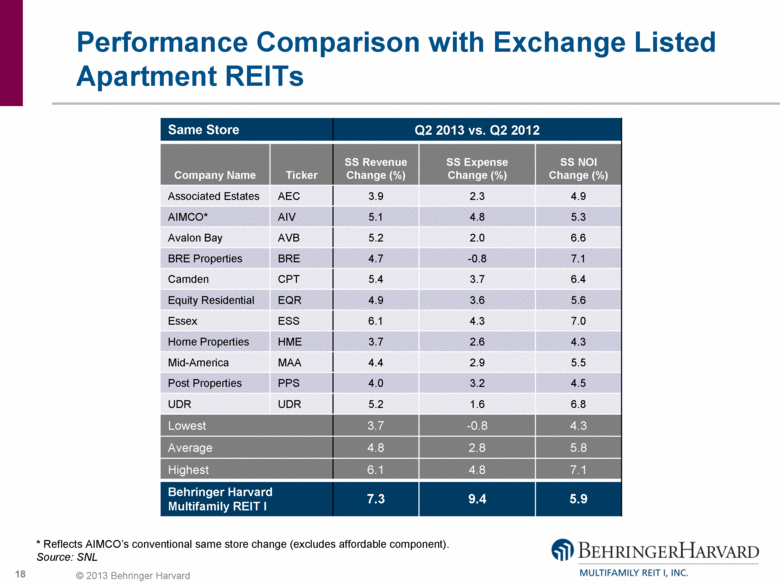
Performance Comparison with Exchange Listed Apartment REITs Same Store Q2 2013 vs. Q2 2012 Company Name Ticker SS Revenue Change (%) SS Expense Change (%) SS NOI Change (%) Associated Estates AEC 3.9 2.3 4.9 AIMCO* AIV 5.1 4.8 5.3 Avalon Bay AVB 5.2 2.0 6.6 BRE Properties BRE 4.7 -0.8 7.1 Camden CPT 5.4 3.7 6.4 Equity Residential EQR 4.9 3.6 5.6 Essex ESS 6.1 4.3 7.0 Home Properties HME 3.7 2.6 4.3 Mid-America MAA 4.4 2.9 5.5 Post Properties PPS 4.0 3.2 4.5 UDR UDR 5.2 1.6 6.8 Lowest 3.7 -0.8 4.3 Average 4.8 2.8 5.8 Highest 6.1 4.8 7.1 Behringer Harvard Multifamily REIT I 7.3 9.4 5.9 * Reflects AIMCO’s conventional same store change (excludes affordable component). Source: SNL |
|
|
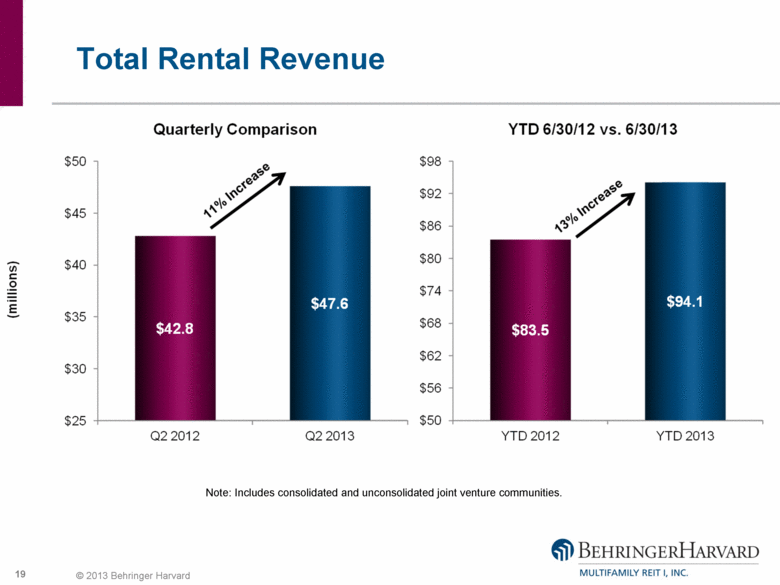
Total Rental Revenue Note: Includes consolidated and unconsolidated joint venture communities. $50 $45 $40 $35 $30 $25 (millions) Quarterly Comparison Q2 2012 Q2 2013 11% Increase $42.8 $47.6 YTD 6/30/12 vs. 6/30/13 13% Increase $83.5 $94.1 YTD 2012 YTD 2013 $98 $92 $86 $80 $74 $68 $62 $56 $50 |
|
|
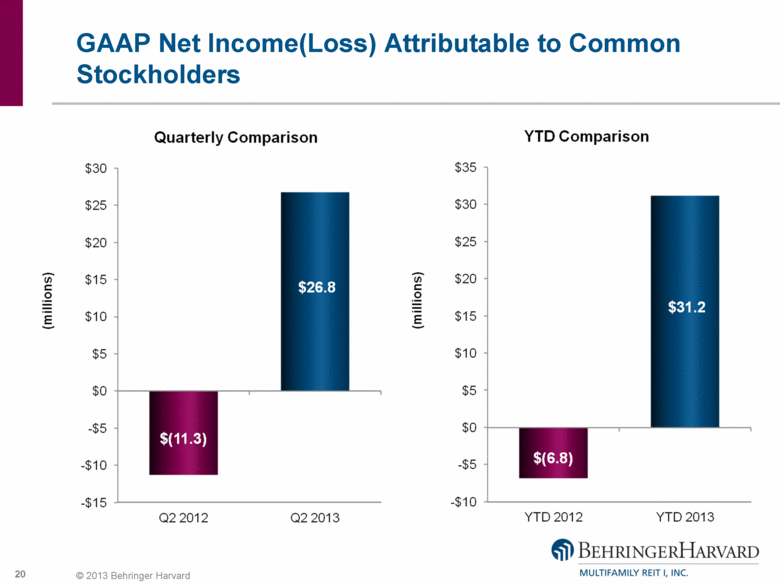
GAAP Net Income(Loss) Attributable to Common Stockholders Quarterly Comparison YTD Comparison (millions) $30 $25 $20 $15 $10 $5 $0 -$5 -$10 -$15$(11.3) $26.8 (millions) $35 $30 $25 $20 $15 $10 $5 $0 -$5 -$10 $(6.8) $31.2 Q2 2012 Q2 2013 YTD 2012 YTD 2013 |
|
|
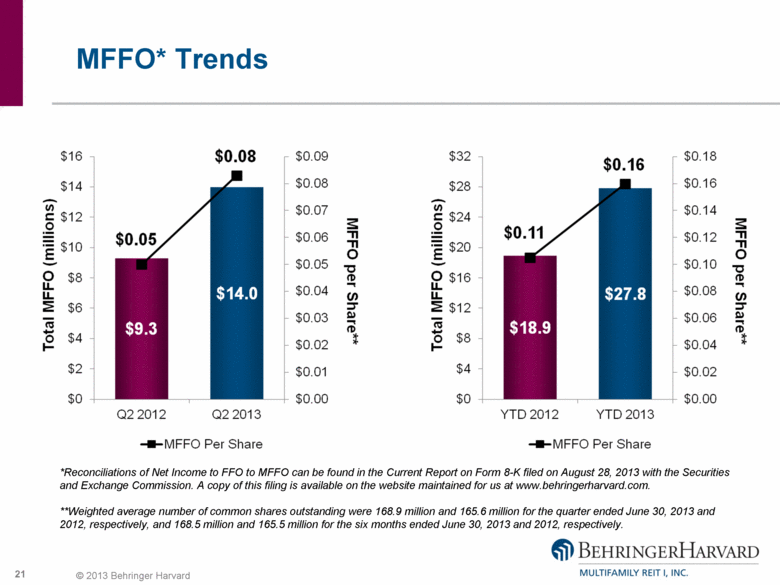
MFFO* Trends *Reconciliations of Net Income to FFO to MFFO can be found in the Current Report on Form 8-K filed on August 28, 2013 with the Securities and Exchange Commission. A copy of this filing is available on the website maintained for us at www.behringerharvard.com. **Weighted average number of common shares outstanding were 168.9 million and 165.6 million for the quarter ended June 30, 2013 and 2012, respectively, and 168.5 million and 165.5 million for the six months ended June 30, 2013 and 2012, respectively. Total MFFO (millions) $16 $14 $12 $10 $8 $6 $4 $2 $0 $0.05 $0.08 $9.3 $14.0 $0.09 $0.08 $0.07 $0.06 $0.05 $0.04 $0.03 $0.02 $0.01 $0.00 MFFO per Share Total MFFO (millions) $32 $28 $24 $20 $16 $8 $4 $2 $0 $0.11 $0.16 $18.9 $27.8 $0.18 $0.16 $0.14 $0.12 $0.10 $0.08 $0.06 $0.04 $0.02 $0.00 Q2 2012 Q2 2013 YTD 2012 YTD 2013 MFFO per Share MFFO per Share |
|
|
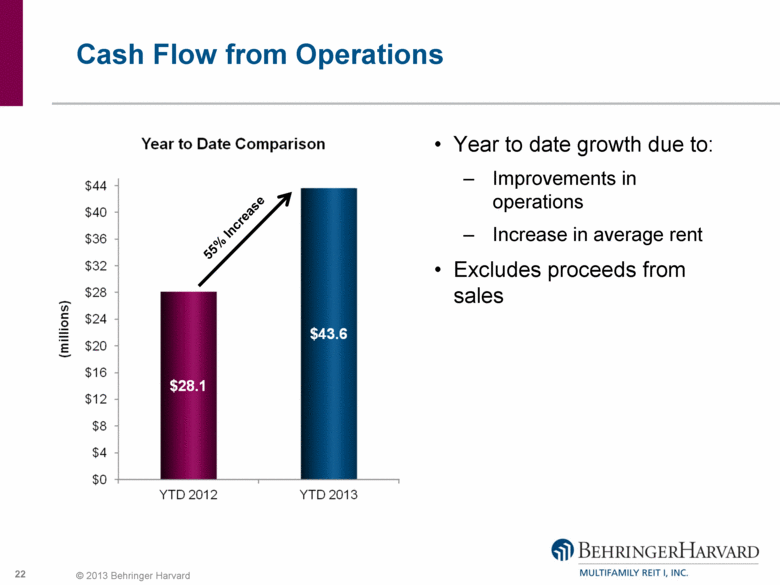
Cash Flow from Operations Year to date growth due to: Improvements in operations Increase in average rent Excludes proceeds from sales 55% Increase Year to Date Comparison (millions) $44 $40 $36 $32 $28 $24 $20 $16 $12 $8 $4 $0 YTD 2012 YTD 2013 55% Increase $28.1 $43.6 |
|
|
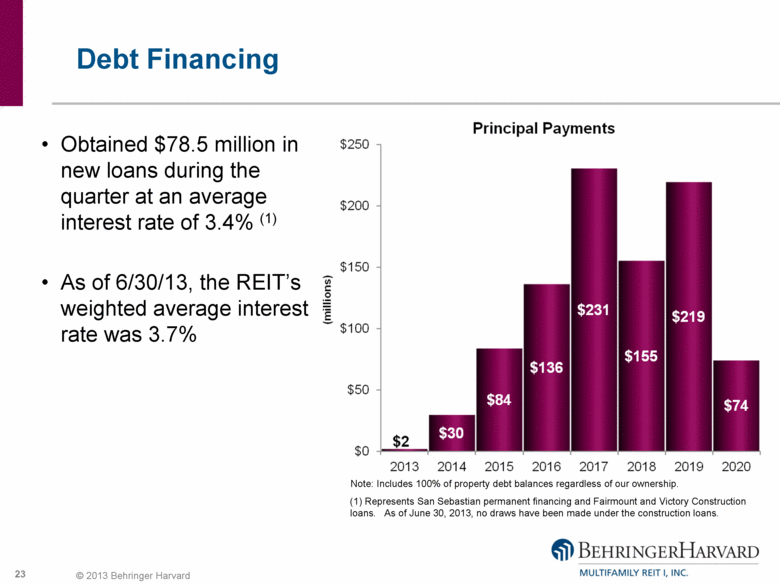
Debt Financing Obtained $78.5 million in new loans during the quarter at an average interest rate of 3.4% (1) As of 6/30/13, the REIT’s weighted average interest rate was 3.7% Note: Includes 100% of property debt balances regardless of our ownership. (1) Represents San Sebastian permanent financing and Fairmount and Victory Construction loans. As of June 30, 2013, no draws have been made under the construction loans. Principal Payments $250 $200 $150 $100 $50 $0 2013 2014 2015 2016 2017 2018 2019 2020 $2 $30 $84 $136 $231 $155 $219 $74 |
|
|
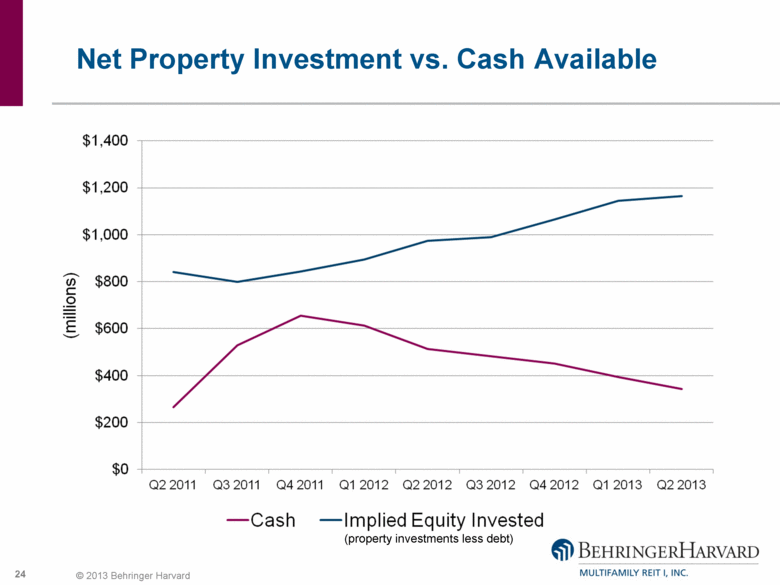
Net Property Investment vs. Cash Available (property investments less debt) $1,400 $1,200 $1,00 $800 $600 $400 $200 $0 Q2 2011 Q3 2011 Q4 2011 Q1 2012 Q2 2012 Q3 2012 Q4 2012 Q1 2013 Q2 2013 (millions) |
|
|
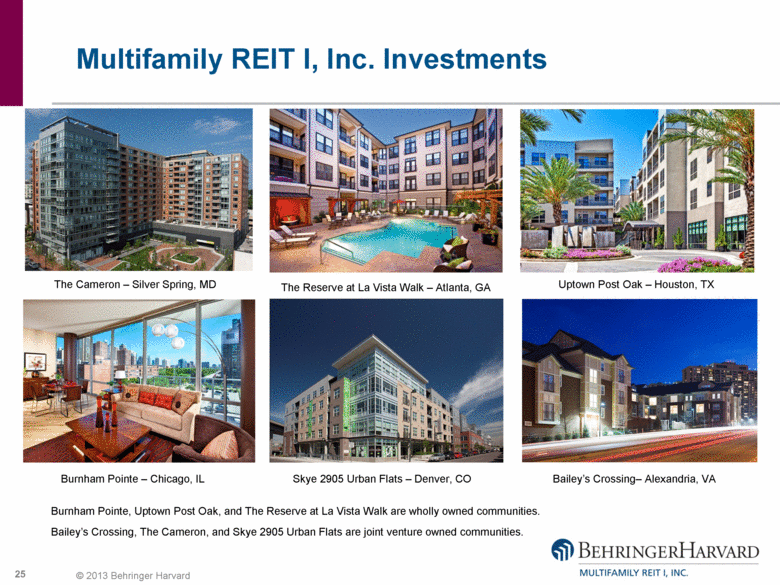
Multifamily REIT I, Inc. Investments Burnham Pointe – Chicago, IL The Cameron – Silver Spring, MD Uptown Post Oak – Houston, TX Bailey’s Crossing– Alexandria, VA Burnham Pointe, Uptown Post Oak, and The Reserve at La Vista Walk are wholly owned communities. Bailey’s Crossing, The Cameron, and Skye 2905 Urban Flats are joint venture owned communities. The Reserve at La Vista Walk – Atlanta, GA Skye 2905 Urban Flats – Denver, CO |
|
|
Questions? Press *1 to enter the queue Please ask one question and a follow-up question Re-enter the queue to ask further questions You may also e-mail questions to: bhreit@behringerharvard.com |
|
|
Playback Information Investors may dial toll free (855) 859-2056 and use conference ID 83524771 to access a playback of today’s call Representatives may log on to the password protected portion of the Behringer Harvard website (www.behringerharvard.com) for a playback of today’s call Replays will be available through Friday, October 4, 2013 |