Attached files
| file | filename |
|---|---|
| 8-K - CURRENT REPORT - ASPIRITY HOLDINGS LLC | twincities_8k-081413.htm |
Exhibit 99.1
 |
16233 Kenyon Ave, Suite 210 Lakeville MN 55044 952-241-3103 main · 952-898-3571 fax |
| August 14, 2013 | PRESS RELEASE |
TCPH Reports Financial Results for 2013’s Second Quarter and First Half
LAKEVILLE, MN – Twin Cities Power Holdings, LLC (“TCPH” or the “Company”) today announced its financial results for the second quarter and first half ended June 30, 2013:
| · | Total revenues for Q2 2013 were $9,390,000 compared to $3,612,000 for the same period in 2012, an increase of 160%. |
| o | For the first half, revenues were $17,624,000, up 137% from $7,425,000 for the same period in 2012. |
| · | Operating income for Q2 2013 totaled $1,479,000, up 296% from a $500,000 loss in Q2 2012. |
| o | For the first half of 2013, operating income was $2,646,000, up 6200% from $42,000 for the same period in 2012. |
| · | Net income for 2013’s second quarter totaled $1,117,000, up 122% from a loss of $913,000 in the comparable period of 2012. |
| o | For the first half, net income was $1,944,000, up 252% from a loss of $772,000 for the same period in 2012. |
| · | The ratio of earnings to fixed charges1 for the trailing 12 months ended June 30, 2013 was 4.40 times. |
| · | With respect to our balance sheet: |
| o | At June 30, 2013, our liquidity ratio (cash, trading accounts and deposits, and trade receivables divided by total assets) declined very slightly to 90.1% compared to 92.2% at December 31, 2012; |
| o | Our debt-to-total capital ratio (total debt divided by total debt plus equity) increased slightly to 56.7% at June 30, 2013 from 49.5% at December 31, 2012; and |
| o | Our debt-to-equity ratio (total debt divided by total equity) increased to 1.31 times at June 30, 2013 compared to 0.98 times at December 31, 2012. |
| · | Based on management’s assessment of wholesale and retail electricity market conditions, we are confirming our guidance that revenues for 2013 should be in a range of $30 to $35 million, with operating income of $4.5 to $5.5 million2. |
With respect to electricity markets during the Q2 2013, the benchmark PJM West Hub peak price, to which much of our wholesale trading activity is related, averaged $44.04/MWh with a standard deviation of $7.40 and a trading range of $33.22 to $76.88. For comparison’s sake, the average price during the second quarter of 2012 was $38.86 with a high of $127.26, a low of $29.16, and a standard deviation of $16.70. For the second quarter of 2013, the benchmark Henry Hub natural gas spot price averaged $4.02/MMBtu, up 76% from $2.29 during the same period in 2012. Furthermore, during Q2 2013, weekly natural gas storage levels averaged 2,084 BCF or about 25% below last year’s level of 2,764 BCF and 3% below the 5-year average of 2,137 BCF.
| 1 | "Earnings" are equal to income before taxes, interest expense, and one-third of operating lease rental expense to approximate the interest component attributable to such rent expense, with the remaining two-thirds considered to be depreciation. "Fixed charges" include interest expense plus one-third of operating lease rental expense. |
| 2 | Previously we gave guidance on net income, but believe that operating income is the more relevant measure for our note holders. |
| Page 1 of 6 |
|
16233 Kenyon Ave, Suite 210 Lakeville MN 55044 952-241-3103 main · 952-898-3571 fax |
“The second quarter showed the continuation of a recovery in our wholesale trading business from the unusually depressed market conditions that characterized 2012. Although volatility in the PJM West Hub peak price as shown by the standard deviation decreased by more than 50%, the weather was closer to normal and the increase in gas prices drove prices up from the very low levels we saw last year. The most recent NOAA three month forecast for August, September, and October calls for some above normal heat in the West, but little chance for above normal temperatures for much of the country east of the Mississippi, meaning that while we may see some heat-driven trading opportunities this fall, chances for such are not great. Conditions in the natural gas market are much more likely to drive electricity prices in the coming months”, said Tim Krieger, TCPH’s Chief Executive Officer.
"The end of the second quarter marked the first anniversary of our entry into the retail energy services business with Town Square Energy. We generated revenues of $1,598,000 and $3,035,000 for Q2 2013 and the first half, respectively, and have added an average of 218 customers per week since the start of the year. While profitability is not yet what we would like it to be; we are very pleased with our account growth in Connecticut and believe there is more to come. We have also learned a great deal about the market and look forward to rolling out our services in Massachusetts, New Hampshire, and Rhode Island in the fall”, concluded Mr. Krieger.
About Twin Cities Power Holdings, LLC
Twin Cities Power Holdings, LLC is a Minnesota limited liability company that serves as a holding company for three active wholly-owned subsidiaries - Twin Cities Power, LLC; Cygnus Partners, LLC; and Town Square Energy, LLC. TCPH is headquartered at 16233 Kenyon Ave, Suite 210, Lakeville, MN 55044, telephone 952-241-3103. More information about the Company is available at www.twincitiespower.com.
The Company trades electricity for its own account in wholesale markets regulated by the Federal Energy Regulatory Commission as well as other energy-related derivative contracts on exchanges regulated by the Commodity Futures Trading Commission. TSE holds retail electricity supplier licenses from the states of Connecticut, Massachusetts, and Rhode Island and has an application pending in New Hampshire. See www.townsquareenergy.com.
While the equity of TCPH is privately held, our Renewable Unsecured Subordinated Notes are registered with the SEC and may be purchased by residents of California, Colorado, Connecticut, Delaware, Florida, Georgia, Illinois, Indiana, Kansas, Michigan, Minnesota, Mississippi, Missouri, New Jersey, New Mexico, New York, South Dakota, Texas, Utah, Vermont, and Wisconsin. To obtain an investment kit, visit www.tcpnotes.com. To check our most recent interest rate offerings, visit www.sec.gov, select “Filings”, “Company Filings Search”, enter “Twin Cities Power” in the company name box, and click the Search button. Our interest rate offerings are found in our Rule 424B2 prospectus supplement filings.
| Page 2 of 6 |
|
16233 Kenyon Ave, Suite 210 Lakeville MN 55044 952-241-3103 main · 952-898-3571 fax |
Forward Looking Statements
This press release contains forward-looking statements. Forward-looking statements can be identified by words such as: "may", "will", "expect", "anticipate", "believe", "estimate" "continue", "predict", or other similar words making reference to future periods, including expectations of 2013 revenues and operating income. Forward-looking statements appear in a number of places in this press release and include statements regarding our intent, belief, or current expectation about trends affecting the markets in which we participate, our businesses, financial condition, and growth strategies, among other things. Forward-looking statements are not guarantees of future performance and involve risks and uncertainties. Actual results may differ materially from those predicted in forward-looking statements as a result of various factors, including, but not limited to, those set forth in the "Risk Factors" sections of our filings with the Securities and Exchange Commission.
If any of the events described in these "Risk Factors" occur, they could have a material adverse effect on our business, financial condition, and results of operations. When considering forward-looking statements, you should keep these risk factors, as well as the other cautionary statements in our SEC filings in mind. You should not place undue reliance on any forward-looking statement. We undertake no obligation to update or revise publicly any forward-looking statements, whether as a result of new information, future events, or otherwise after the date of this press release.
Non-GAAP Financial Measures
TCPH’s press releases and other communications may include certain “non-GAAP financial measures”, defined as a numerical measure of a company's financial performance, financial position, or cash flows that excludes, or includes, amounts that are included in, or excluded from, the most directly comparable measure calculated and presented in accordance with GAAP in the company's financial statements.
Non-GAAP financial measures utilized by the Company include presentations of liquidity measures and debt-to-equity ratios. The Company’s management believes that these non-GAAP financial measures provide useful information and enables investors and analysts to more accurately compare the Company's ongoing financial performance over the periods presented.
Investor Relations Contact
Wiley H. Sharp III
VP - Finance & CFO, 952-241-3105
| Page 3 of 6 |
|
16233 Kenyon Ave, Suite 210 Lakeville MN 55044 952-241-3103 main · 952-898-3571 fax |
Twin Cities Power Holdings, LLC & Subsidiaries
| U.S. dollars in thousands | For
3 months ended Jun 30, | For
6 months ended Jun 30, | For
year ended Dec 31, | |||||||||||||||||
| 2013 | 2012 | 2013 | 2012 | 2012 | ||||||||||||||||
| Statement of Operations Data | unaudited | unaudited | unaudited | unaudited | audited | |||||||||||||||
| Wholesale trading revenue, net | $ | 7,792 | $ | 3,612 | $ | 14,589 | $ | 7,425 | $ | 18,256 | ||||||||||
| Retail electricity revenue | 1,598 | – | 3,035 | – | 818 | |||||||||||||||
| Net revenue | 9,390 | 3,612 | 17,624 | 7,425 | 19,074 | |||||||||||||||
| Total operating costs & expenses | 7,911 | 4,112 | 14,978 | 7,384 | 16,036 | |||||||||||||||
| Operating income | 1,479 | (500 | ) | 2,646 | 42 | 3,038 | ||||||||||||||
| Interest (expense) | (360 | ) | (363 | ) | (709 | ) | (728 | ) | (1,065 | ) | ||||||||||
| Interest income | 8 | 9 | 16 | 19 | 60 | |||||||||||||||
| Other income (expense), net | (1 | ) | (8 | ) | (0 | ) | (17 | ) | (17 | ) | ||||||||||
| Income before taxes | 1,127 | (862 | ) | 1,953 | (685 | ) | 2,016 | |||||||||||||
| Tax provision (benefit) | 9 | 51 | 9 | 88 | 56 | |||||||||||||||
| Net income | 1,118 | (912 | ) | 1,944 | (773 | ) | 1,960 | |||||||||||||
| Preferred distributions | (137 | ) | (137 | ) | (275 | ) | (229 | ) | (503 | ) | ||||||||||
| Net income attributable to common | 980 | (1,050 | ) | 1,669 | (1,001 | ) | 1,457 | |||||||||||||
| Foreign currency translation adjustment | (124 | ) | (58 | ) | (161 | ) | (39 | ) | (84 | ) | ||||||||||
| Change in fair value of cash flow hedges | (205 | ) | – | (74 | ) | – | (82 | ) | ||||||||||||
| Comprehensive income (loss) | $ | 651 | $ | (1,108 | ) | $ | 1,434 | $ | (1,041 | ) | $ | 1,290 | ||||||||
| Ratio of earnings to fixed charges (1) | 3.86 | x | -1.13 | x | 3.51 | x | 0.16 | x | 2.64 | x | ||||||||||
| Ratio of earnings to fixed charges, TTM | 4.40 | x | – | 2.64 | x | |||||||||||||||
| At Jun 30, | At Dec 31, | |||||||||||
| 2013 | 2012 | 2012 | ||||||||||
| Balance Sheet Data | unaudited | unaudited | audited | |||||||||
| Cash | $ | 4,652 | $ | 884 | $ | 772 | ||||||
| Trading accounts & deposits | 10,435 | 13,255 | 12,025 | |||||||||
| Trade receivables | 1,328 | 1,137 | 2,191 | |||||||||
| Prepaid expenses & other current assets | 436 | 712 | 190 | |||||||||
| Total current assets | 16,851 | 15,989 | 15,177 | |||||||||
| Equipment & furnishings, net | 529 | 678 | 571 | |||||||||
| Intangible assets, net | 466 | 160 | 125 | |||||||||
| Deferred financing costs, net | 374 | 394 | 389 | |||||||||
| Total assets | $ | 18,220 | $ | 17,221 | $ | 16,263 | ||||||
| Trade payables | $ | 1,047 | $ | 2,381 | $ | 1,469 | ||||||
| Accrued expenses & other current liabilities | 2,347 | 3,527 | 2,115 | |||||||||
| Notes payable, demand & current | 5,262 | 3,928 | 5,006 | |||||||||
| Total current liabilities | 8,655 | 9,836 | 8,590 | |||||||||
| Long term debt | 3,079 | 3,172 | 1,274 | |||||||||
| Other liabilities | 125 | – | – | |||||||||
| Total liabilities | 11,859 | 13,007 | 9,864 | |||||||||
| Redeemable preferred equity | – | 2,745 | 2,745 | |||||||||
| Series A preferred equity | 2,745 | – | – | |||||||||
| Common equity | 3,394 | 884 | 3,197 | |||||||||
| Accumulated comprehensive income | 222 | 584 | 457 | |||||||||
| Total equity | 6,361 | 4,213 | 6,399 | |||||||||
| Total liabilities & equity | $ | 18,220 | $ | 17,221 | $ | 16,263 | ||||||
| Liquidity, percent of total assets | 90.1 | % | 88.7 | % | 92.2 | % | ||||||
| Debt to total capital ratio | 56.7 | % | 62.8 | % | 49.5 | % | ||||||
| Debt to equity ratio | 1.31 | x | 1.68 | x | 0.98 | x | ||||||
| Page 4 of 6 |
|
16233 Kenyon Ave, Suite 210 Lakeville MN 55044 952-241-3103 main · 952-898-3571 fax |
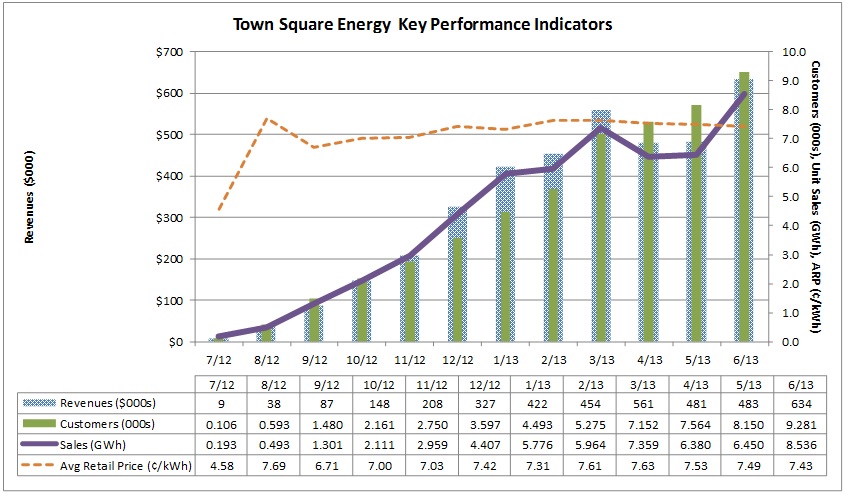
This chart shows the growth of the Company’s retail business - Town Square Energy – since the date of acquisition on June 30, 2012. Revenue (the dotted blue bars, left scale) has grown from less than $15,000/month to over $500,000/month and customer counts (the green bars, right scale) have increased from less than 150 to over 9,000. Our unit sales are now over 7,000 MWh/month (purple line, right scale). Our primary marketing strategy has been to price our contracts such that our offers provide savings compared to the standard rates offered by the incumbent utilities (Connecticut Light & Power and United Illuminating). Consequently, our offers typically appear in the first two or three listings below theirs on ctenergyinfo.com, a comparison shopping engine sponsored by the Connecticut Department of Energy & Environmental Protection (formerly the Department of Public Utility Control). For example, on August 13, 2013, CLP’s standard offer to residential consumers was 7.573 ¢/kWh fixed through December 31, 2013, UI’s was 7.697 ¢/kWh fixed through December 31, 2013, and we were offering a fixed price guarantee of 6.850 ¢/kWh through October 31, 2013 with no cancellation fee.
| Page 5 of 6 |
|
16233 Kenyon Ave, Suite 210 Lakeville MN 55044 952-241-3103 main · 952-898-3571 fax |
This chart shows the level and volatility of PJM West Hub day-ahead power prices for all of 2012 and for 2013 on a year to date basis. Our trading revenues generally correspond to weather- and gas driven volatility or lack thereof. The lack of normal volatility in the much of 2012 reduced our revenues and profits, but other factors come into play as well, which might cause revenues to correlate less directly to volatility. Among others, these factors include the size and nature of the trades we may or may not have in place when and if the market moves, as well as the duration of profitable trading opportunities. As you can see, price levels have increased in 2013 compared to 2012 and volatility is less.
