Attached files
| file | filename |
|---|---|
| 8-K - 8-K - FEDERAL SIGNAL CORP /DE/ | d584619d8k.htm |
 Disciplined
Growth Investor Presentation
August 14, 2013
Exhibit 99.1 |
 Advancing
security and well-being. This
presentation
contains
forward
looking
statements
made
by
management
and
may
contain
words
such
as
“may,”
“will,”
“believe,”
“expect,”
“anticipate,”
“intend,”
“plan,”
“project,”
“estimate”
and
“objective”
or
the
negative
thereof
or
similar terminology concerning the Company’s future financial
performance, business strategy, plans, goals and objectives. These expressions are intended to
identify forward-looking statements within the meaning of the Private Securities
Litigation Reform Act of 1995. Forward-looking statements include information concerning the Company’s possible or assumed future
performance or results of operations and are not guarantees. While these statements are based
on assumptions and judgments that management has made in light of industry experience
as well as perceptions of historical trends, current conditions, expected future developments and other factors believed to be
appropriate under the circumstances, they are subject to risks, uncertainties and other
factors that may cause the Company’s actual results, performance or achievements
to be materially different. These risks and uncertainties, some of which are beyond the
Company’s control, include the cyclical nature of the Company’s industrial, municipal,
governmental and commercial markets; domestic and foreign governmental policy changes;
restrictive debt covenants; availability of credit and third-party financing for
customers; our ability to anticipate and meet customer demands for new products and product enhancements and the resulting new and
enhanced products generating sufficient revenues to justify research and development expenses;
our incurrence of restructuring and impairment charges as we continue to evaluate
opportunities to restructure our business; highly competitive markets; increased product liability, warranty, recall claims, client
service interruptions and other lawsuits and claims; technological advances by competitors;
disruptions in the supply of parts and components from suppliers and subcontractors;
attraction and retention of key employees; disruptions within our dealer network; work stoppages and other labor relations matters;
increased pension funding requirements and expenses beyond our control; costs of compliance
with environmental and safety regulations; our ability to use net operating loss and
tax credit carryovers to reduce future tax payments; charges related to goodwill and other long-lived intangible assets; our ability to
expand our business through successful future acquisitions; and unknown or unexpected
contingencies in our existing business or in businesses acquired by us. These risks and
uncertainties include, but are not limited to, the risk factors described under Item 1A, Risk Factors, in the Company’s Annual Report on
Form 10-K and in other filings with the SEC. These factors may not constitute all factors
that could cause actual results to differ materially from those discussed in any
forward-looking statement. The Company operates in a continually changing business environment and new factors emerge from time to
time.
The
Company
cannot
predict
such
factors,
nor
can
it
assess
the
impact,
if
any,
of
such
factors
on
its
financial
position
or
results
of
operations.
Accordingly, forward-looking statements should not be relied upon as a predictor of actual
results. This presentation also contains certain non-GAAP financial measures.
Such measures should not be viewed as a substitute for GAAP financial measures, and a
reconciliation of these items to the most comparable GAAP measures is provided in our filings with the SEC.
2
Safe Harbor Statement |
 Advancing
security and well-being. 3
Agenda
•
Management
•
Company overview
•
Investment case
•
Recent progress
•
Growth strategy
•
Business groups and products
•
Financial results and outlook |
 Experienced
Management Team Dennis Martin, President and Chief Executive Officer
4
Brian Cooper, SVP and Chief Financial Officer
Jennifer Sherman, SVP, Chief Administrative Officer,
General Counsel and Secretary
President and Chief Executive Officer since October 2010
Previously served as Chairman, President and CEO of General Binding Corporation
35+ years operational and leadership experience, primarily at Illinois Tool Works
and Ingersoll-Rand
Chief Administrative Officer since November 2010, Secretary and General Counsel since
March 2004
Operating executive for Safety and Security Systems Group
Joined Federal Signal in 1994 as Corporate Counsel
Appointed Chief Financial Officer May 28, 2013
Chief Financial Officer of Westell Technologies, Inc. from 2009-2013
Previously with Fellowes, Inc. (CFO), United Stationers, Borg-Warner Security and
Amoco Strong treasury, financial, M&A and strategic background
Advancing security and well-being. |
 Advancing
security and well-being. 5
Federal Signal Overview
Founded in 1901, joined NYSE in 1969 (“FSS”)
Safety, security and environmental products and
services that protect people and the planet
Environmental Solutions Group (ESG)
Safety & Security Systems Group (SSG)
Fire Rescue Group (Bronto)
Recently restructured for growth and profitability
$825 million revenue, $56 million operating income
(TTM as of 6/30/13)
$657 million market capitalization (8/12/13)
Increasing global presence and customer base
Leading brands serving municipal, governmental,
industrial and commercial markets
Diversified manufacturing, 11 facilities in 6 countries
Over 3,000 customers in more than 100 countries
Employees: 2,600 worldwide
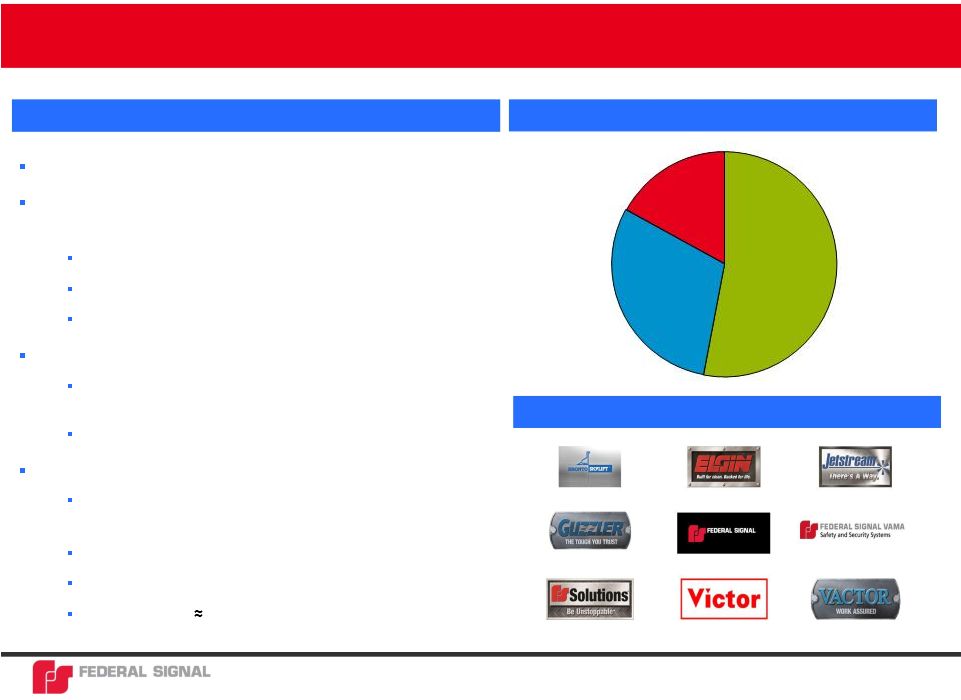
Company Overview
Sales by Segment, June 2013 TTM, $ Millions
Fire Rescue Group
17%
Environmental
Solutions Group
54%
Safety & Security
Systems Group
29%
Valuable Brands
$448
$137
$240 |
 •
•
•
–
Funding internal growth and potential renewal of dividends
•
•
–
Aging public infrastructure
–
Improving municipal markets
–
Industrial markets opportunities
–
Growing investments in energy sector
–
Security requirements for man-made and natural disasters
•
–
Management depth in sales, marketing, engineering and operations
–
Successful focus on “80/20”
continuous improvement
6
Investment Case
Advancing security and well-being.
Dominant market position in critical infrastructure markets
Unparalleled brand equity and distribution franchise in core markets
Strengthened balance sheet and improving profitability and free cash flow
Flexible manufacturing capacity ready to deliver higher revenues
and profits
Favorable long-term market dynamics
Management execution |
 Advancing
security and well-being. Recent Progress and Accomplishments
•
Major repositioning with sale of FSTech
•
Debt refinancing to improve balance sheet and interest costs
•
80/20 focus and continuous improvement
–
Lean manufacturing changes
–
Customer prioritization and pricing
–
Working capital efficiency targets
•
Investments to promote growth and innovation
–
Additional engineering resources at Jetstream
–
Jetstream plant capacity expansions
–
Flexible manufacturing model at Vactor
–
Extensive lean process improvements at Bronto
–
Innovation initiative
•
Significant turnaround in financial performance
7 |
 8
Growth Strategy
Geographic Expansion
•
•
•
New Markets for Existing
Products
New Product
Development and
Acquisitions
Advancing security and well-being.
Jetstream and Industrial
Systems in the Asia Pacific
and Middle East
Export markets from U.S.
Bronto in North America
Waterblasting
Hydro-excavation
Security systems
Innovation program
Effective use of
established platforms
•
•
•
•
• |
 Growth Markets
and Opportunities 9
* (as of 6/30/13 TTM)
Developing growth product areas
Other markets
Advancing security and well-being.
•
–
Vactor (hydro-excavation and sewer cleaning)
–
Jetstream (waterblasting)
–
Industrial Systems (integrated communication safety systems)
These areas aggregate to
50% of total revenue *
•
–
Industrial uses for high-reach lifts (Bronto)
–
Recovering U.S. municipal spending (Elgin, among others)
–
Recovering government spending in Europe (Bronto, Vama)
–
Expanding industrial energy and utility use (Jetstream, Vactor)
–
International waterblasting market share (Jetstream)
–
Price-competitive product introductions in ambulance and other
safety markets (Safety and Security Systems Group) |
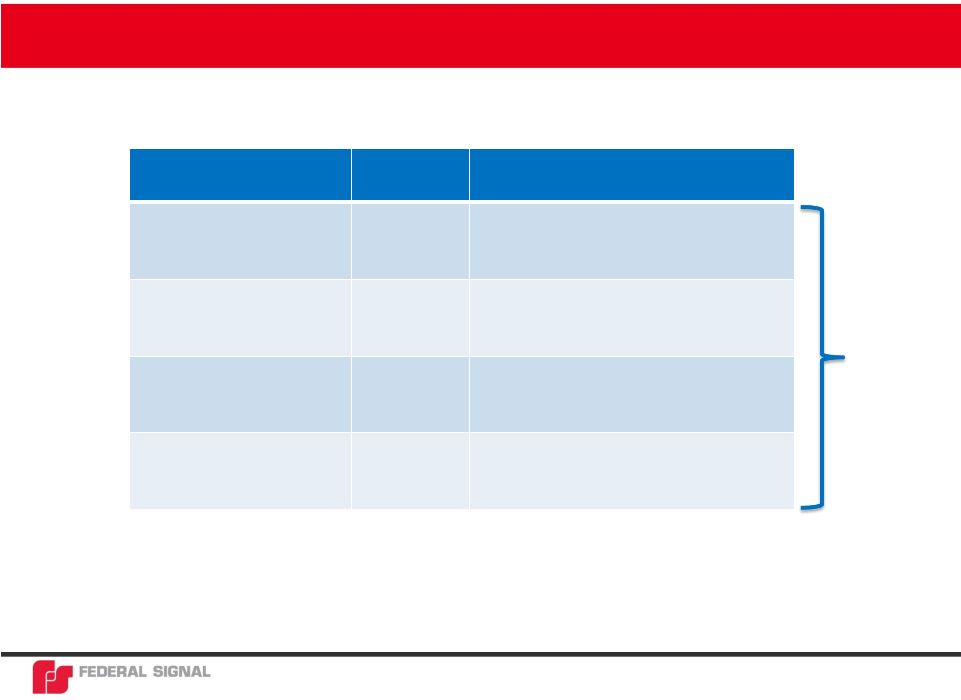 Business
Unit Industrial
Order Mix*
Success Factors in Increasing Industrial
Mix
U.S. Industrial Systems
63%
•
Extending Leadership in Public Warning
Systems in Commercial Markets
•
Building Global Distribution Capabilities
Global Jetstream
100%
•
Global Channel Development
•
New Product-Application Development
Bronto
23%
•
North American Distribution
•
Further Exploit Utility Markets
U.S. Vactor
50%
•
Continued Investment in Efficient Capacity
•
Leverage New Application Successes (e.g. ,
Hydro-excavation)
10
Industrial Business Growth Opportunities
* Industrial order mix includes fiscal years 2010 through 2012.
Success Factors
Complemented
by Targeted
Product Line
Acquisitions
Advancing security and well-being. |
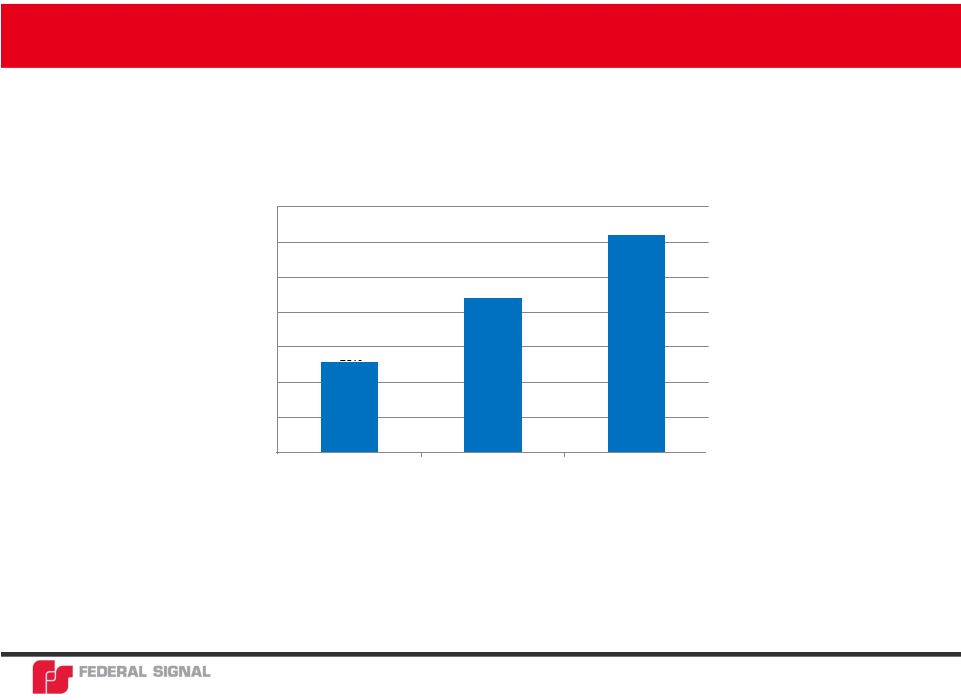 Advancing
security and well-being. Percentage of Orders from Industrial Customers*
*Lifts only, excluding service revenue. Data reflect revenue mix in Euros.
11
Execution on Building Industrial Customer Mix at Bronto
2010
2011
2012
13%
22%
31%
35
30
25
20
15
10
5
0 |
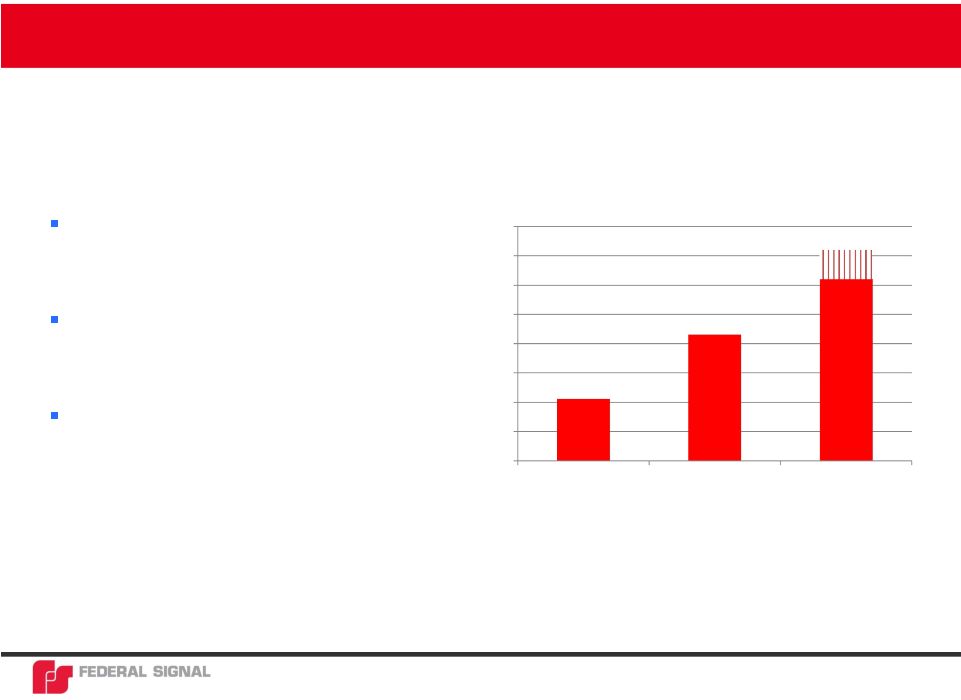
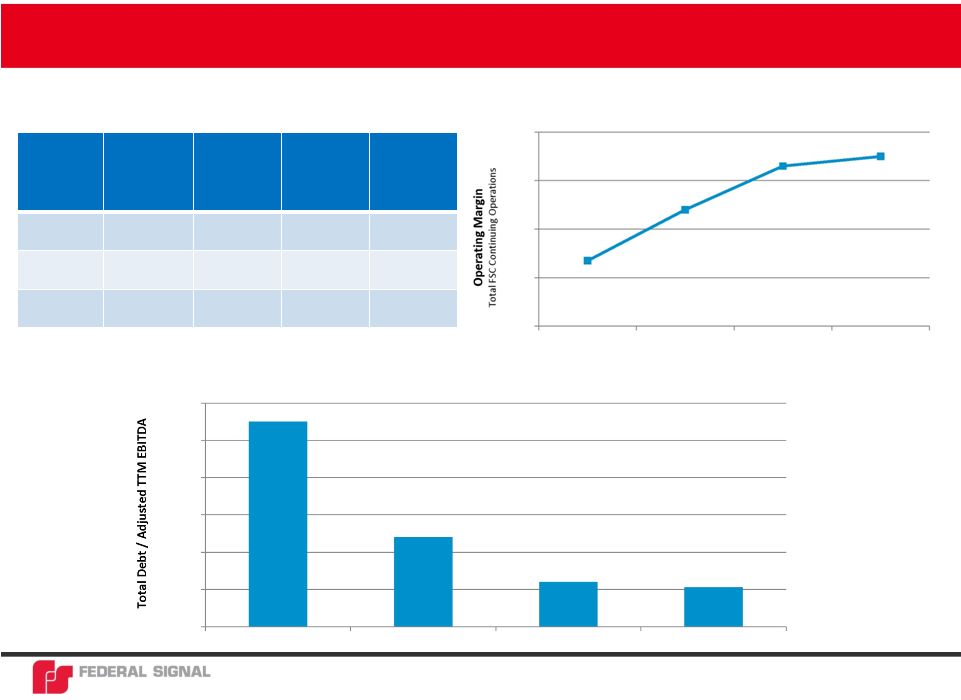 Advancing
security and well-being. Margin Expansion and Debt Reduction
12
Continued Progress on Operating Margin Targets *
Complemented by Declining Leverage
Business
Segment
FY 2011
Operating
Margin
FY 2012
Operating
Margin
1 Half
2013
Operating
Margin
Margin
Targets
ESG
6.8%
9.8%
11.9%
10% -
12%
SSG
9.7%
12.0%
7.9%
14% -
16%
Bronto
6.0%
6.6%
6.1%
10% -
12%
* Operating margin excludes the impact of restructuring charges in all periods.
st
8.0%
6.0%
4.0%
2.0%
0.0%
2010
2011
2012
1st Half 2013
2.7%
4.8%
6.6%
7.0%
2010
2011
2012
6/30/2013
12.0
10.0
8.0
6.0
4.0
2.0
0.0
11.0
4.8
2.4
2.1 |
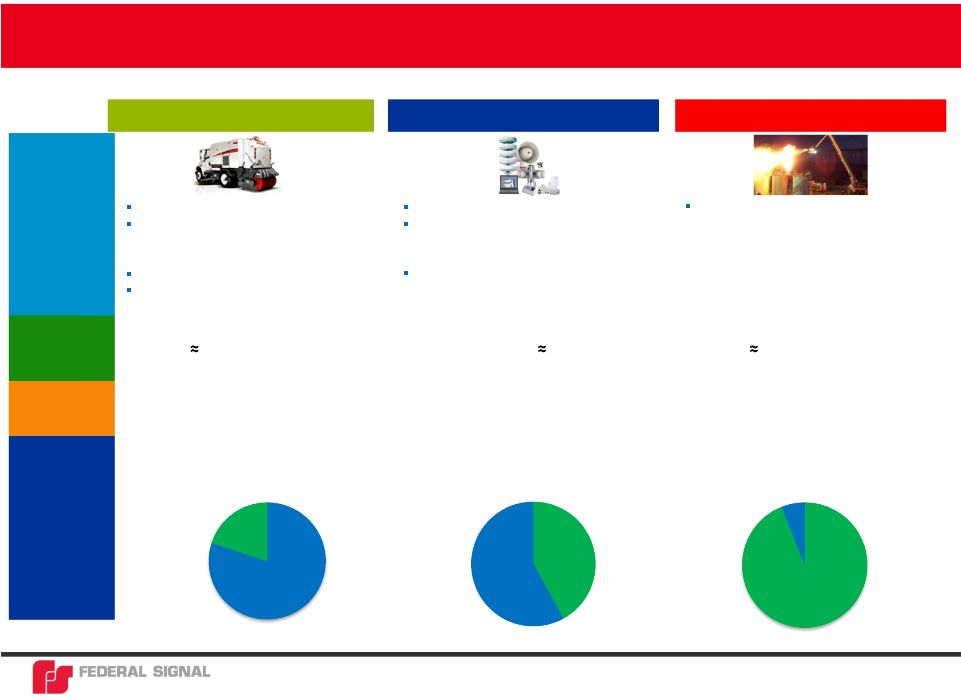 Advancing
security and well-being. 13
Federal Signal Segments
Environmental Systems (ESG)
Elgin street sweepers
Vactor truck-mounted sewer cleaners,
hydro-excavators, and industrial vacuum
trucks
Jetstream waterblasters
FS Depot and FS Solutions –
parts and
service deliveries and rental centers
$448MM (54% of sales)
$240MM (29% of sales)
$137MM (17% of sales)
Fire Rescue (Bronto)
Aerial lift access platforms for fire rescue
and wind turbine maintenance, utilities
and other industrial applications
Safety and Security (SSG)
Vehicle lights and sirens (U.S. and Vama)
Indoor and outdoor mass warning and
notification systems (Industrial Systems
and Alerting & Notification Systems)
Victor mining and electrical safety
equipment
U.S.
6%
Non-U.S.
94%
Non-U.S.
20%
U.S.
80%
30-50% U.S.
Range, avg. 30% U.S.
50% Globally
Non-U.S.
42%
U.S.
58%
Products
Representative
Market Share
June 2013,
TTM
Revenue
Geographic
Mix |
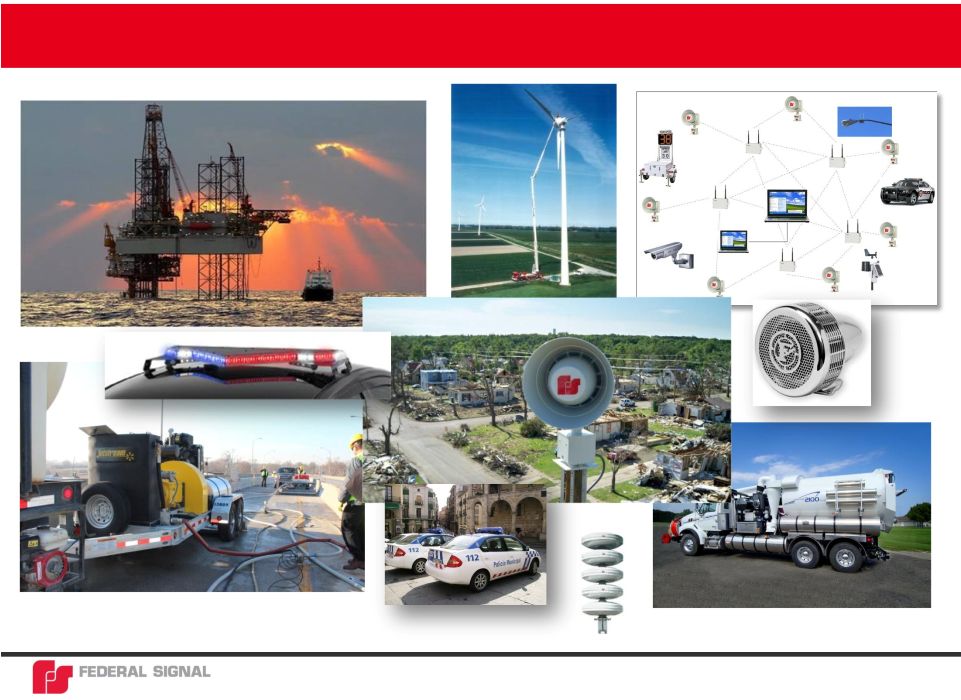 14
Diversified Product Mix
Advancing security and well-being. |
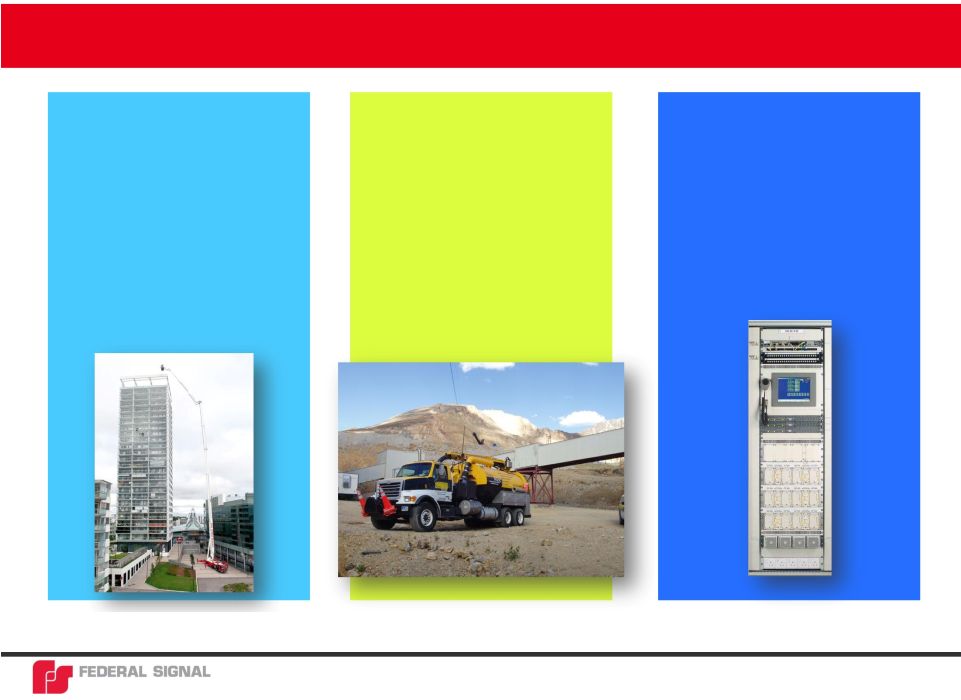
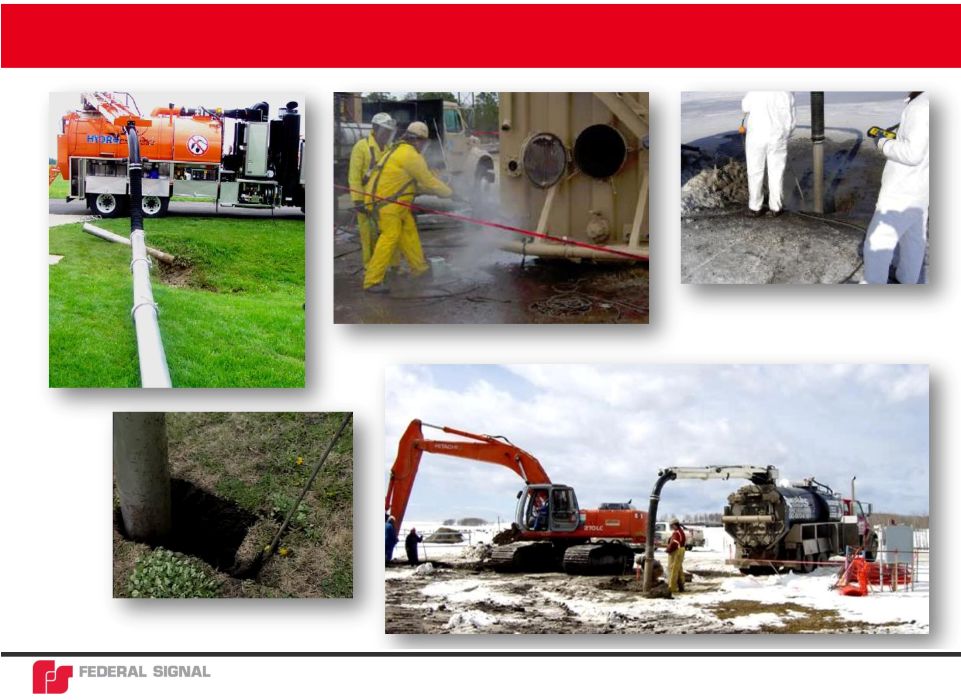 Advancing
security and well-being. Hydro-Excavation
Hydro-excavating through ice
with hot water
15 |
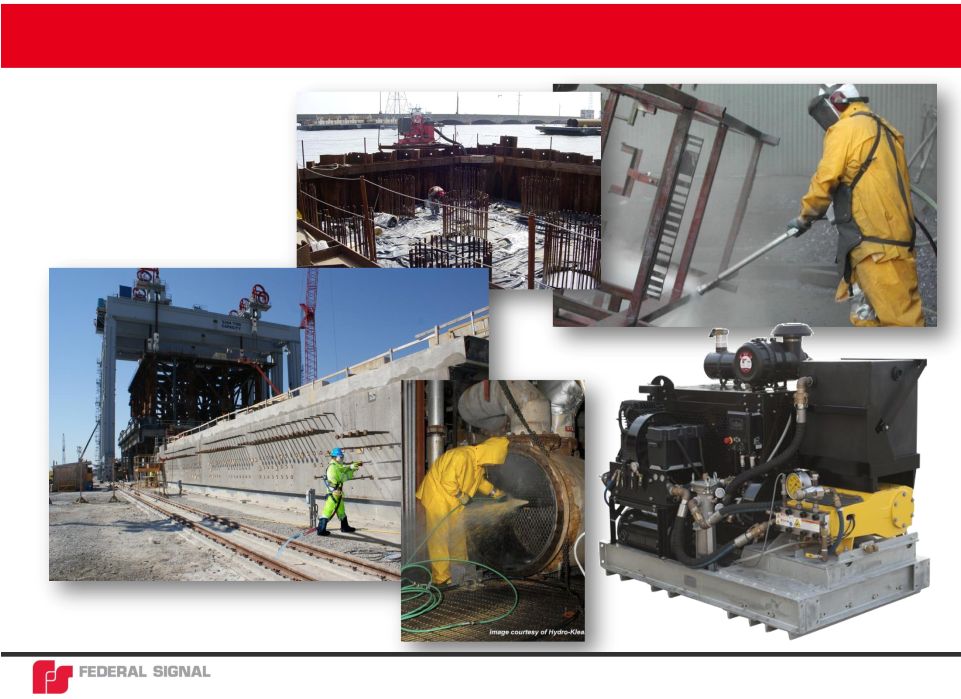 Waterblasting
Hydro-demolition,
hydro-cleaning and
high pressure cleaning
16
Advancing security and well-being. |
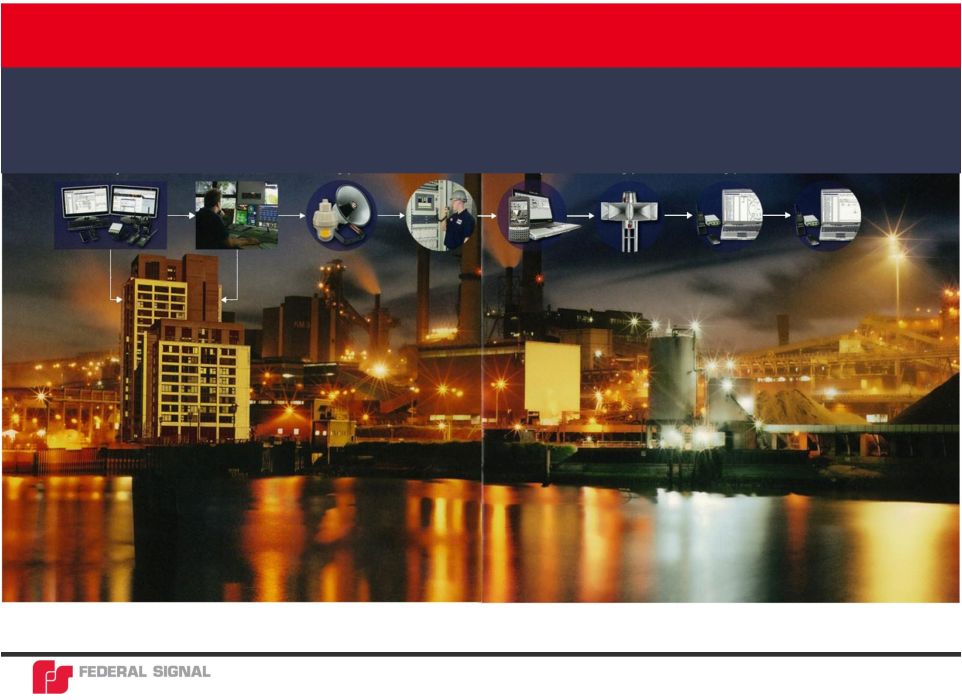 Advancing
security and well-being. Industrial Systems
Integrated Communications
17
SmartMsg
Enabled Systems
ICS Integrated
Command
Solutions
Indoor Warning
Systems
Public
Address/General
Alarm
Public Safety
Software Systems
Outdoor
Warning Systems
Interoperable
Communications
Citizen Alerting
Systems |
  Advancing
security and well-being. Consolidated Historical Financial Performance*
18
* Consolidated financial results reflect only continuing operations of the Company.
($ in millions)
2010
2011
2012
June 2013
TTM
Revenue
$ 633.1
$ 688.7
$ 803.2
$ 825.1
% Growth
—
8.8%
16.6%
2.7%
COGS
482.2
533.3
613.4
631.2
Gross Profit
$ 150.9
$ 155.4
$ 189.8
$ 193.9
% Margin
23.8%
22.6%
23.6%
23.5%
Operating Expenses
138.5
122.2
138.3
138.2
Operating Income
$ 12.4
$ 33.2
$ 51.5
$ 55.7
% Margin
2.0%
4.8%
6.4%
6.8%
Interest Expense
10.2
16.4
21.4
17.1
Other Expense
1.2
0.2
4.2
10.9
Pretax Income
$ 1.0
$ 16.6
$ 25.9
$ 27.7 |
 Advancing
security and well-being. 2013 and Beyond Overview
19
Areas of Focus
Progress toward margin targets
at Bronto and SSG
Accelerate growth in industrial
markets
Deliver increased value to
shareholders
Adjusted EPS* and Outlook
* Adjusted EPS excludes the effects of debt settlement charges,
restructuring charges, and the Q2 2013 tax valuation allowance release
($102 million); and reflects only the continuing operations of the Company.
$ per share
0.80
0.70
0.60
0.50
0.40
0.30
0.20
0.10
0.00
YR 2011
YR 2012
YR 2013 Outlook
0.21
0.43
0.62 –
0.72 |
 Building Equity
in Our Brands 20
Advancing security and well-being. |