Attached files
| file | filename |
|---|---|
| 8-K - FORM 8-K - KEYCORP /NEW/ | d569320d8k.htm |
| EX-99.3 - EX-99.3 - KEYCORP /NEW/ | d569320dex993.htm |
| EX-99.1 - EX-99.1 - KEYCORP /NEW/ | d569320dex991.htm |
| KeyCorp
Second Quarter 2013 Earnings Review
July 18, 2013
Beth E. Mooney
Chairman and
Chief Executive Officer
Don Kimble
Chief Financial Officer
Exhibit 99.2 |
| 2
FORWARD-LOOKING STATEMENTS AND ADDITIONAL
INFORMATION DISCLOSURE
This presentation contains and we may, from time to time, make forward-looking
statements within the meaning of the Private Securities Litigation Reform Act of
1995, including statements about Key’s financial condition, results of
operations, asset quality trends, capital levels and profitability. Forward-looking statements are
not historical facts but instead only represent management’s current
expectations and forecasts regarding future events, many of which, by their nature, are
inherently
uncertain
and
outside
of
Key’s
control.
Forward-looking
statements
usually
can
be
identified
by
the
use
of
words
such
as
“goal,”
“objective,”
“plan,”
“expect,”
“anticipate,”
“intend,”
“project,”
“believe,”
“estimate”
or other words of similar meaning.
Our forward-looking statements are subject to the following principal risks and
uncertainties: continued strain on the global financial markets as a result of economic
slowdowns and concerns; the slow progress of the U.S. economic recovery; changes in
trade, monetary and fiscal policies of various governmental bodies and
central banks in the economies in which we operate; our ability to anticipate
interest rate changes correctly and manage interest rate risk presented through
unanticipated
changes
in
our
interest
rate
risk
position
and/or
short-
and
long-term
interest
rates;
changes
in
local,
regional
and
international
business,
economic
or
political conditions in the regions where we operate or have significant assets;
current regulatory initiatives in the U.S., including the Dodd-Frank Wall Street Reform
and Consumer Protection Act of 2010, as amended, subjecting us to a variety of new
and more stringent legal and regulatory requirements and increased scrutiny
from our regulators; the deterioration of unemployment or real estate asset values
or their failure to recover for an extended period of time; adverse changes in credit
quality trends; our ability to determine accurate values of certain assets and
liabilities; adverse behaviors in securities, public debt, and capital markets, including
changes in market liquidity and volatility; unanticipated changes in our liquidity
position, including but not limited to our ability to enter the financial markets to manage
and respond to any changes to our liquidity position; the soundness of other
financial institutions; our ability to satisfy new capital and liquidity standards such as
those imposed by the Dodd-Frank Act and those adopted by the Basel Committee;
our ability to receive dividends from our subsidiary, KeyBank; reductions of
the
credit ratings assigned to KeyCorp and KeyBank; unexpected or prolonged changes in
the level or cost of liquidity; our ability to secure alternative funding sources
under stressed liquidity conditions; our ability to timely and effectively
implement our strategic initiatives; operational or risk management failures; breaches of
security or failures of our technology systems due to technological, cybersecurity
threats or other factors; the occurrence of natural or man-made disasters or
conflicts or terrorist attacks disrupting the economy or our ability to operate;
the adequacy of our risk management programs; adverse judicial proceedings; increased
competitive pressure due to consolidation; our ability to attract and/or retain
talented executives and employees; our ability to effectively sell additional products or
services
to
new
or
existing
customers;
our
ability
to
manage
our
reputational
risks;
unanticipated
adverse
effects
of
acquisitions
and
dispositions
of
assets,
business
units or affiliates.
We provide greater detail regarding some of these factors in our
2012 Form 10-K, including in Item 1. Business under the heading
“Supervision and Regulation”, in Item 1A. Risk Factors and in Item
7. Management’s Discussion and Analysis of Financial Condition and Results of Operation under the heading “Risk Management,”
as well as in our subsequent SEC filings, all of which are accessible on our
website at www.key.com/ir and on the SEC’s website at www.sec.gov.
Key does not undertake any obligation to update the forward-looking statements
to reflect the impact of circumstances or events that may arise after the date of the
forward-looking statements. Actual results or future events could differ,
possibly materially, from those anticipated in forward-looking statements, as well as from
historical performance.
This
presentation
also
includes
certain
Non-GAAP
financial
measures
related
to
“tangible
common
equity,”
“Tier
1
common
equity,”
“pre-provision
net
revenue,”
“cash efficiency ratio,”
and “adjusted cash efficiency ratio.”
Management believes these ratios may assist investors, analysts and regulators in
analyzing Key’s financials.
Although
Key
has
procedures
in
place
to
ensure
that
these
measures
are
calculated
using
the
appropriate
GAAP
or
regulatory
components,
they
have
limitations as analytical tools and should not be considered in isolation, or as a
substitute for analysis of results under GAAP. For more information on these
calculations and to view the reconciliations to the most comparable GAAP measures,
please refer to the Appendix to this presentation or our most recent earnings
press release, which is accessible at www.key.com/ir.
Web addresses referenced in this slide are inactive textual references only.
Information on these websites is not part of this document. |
 3
Net interest income up 8% compared to the prior year
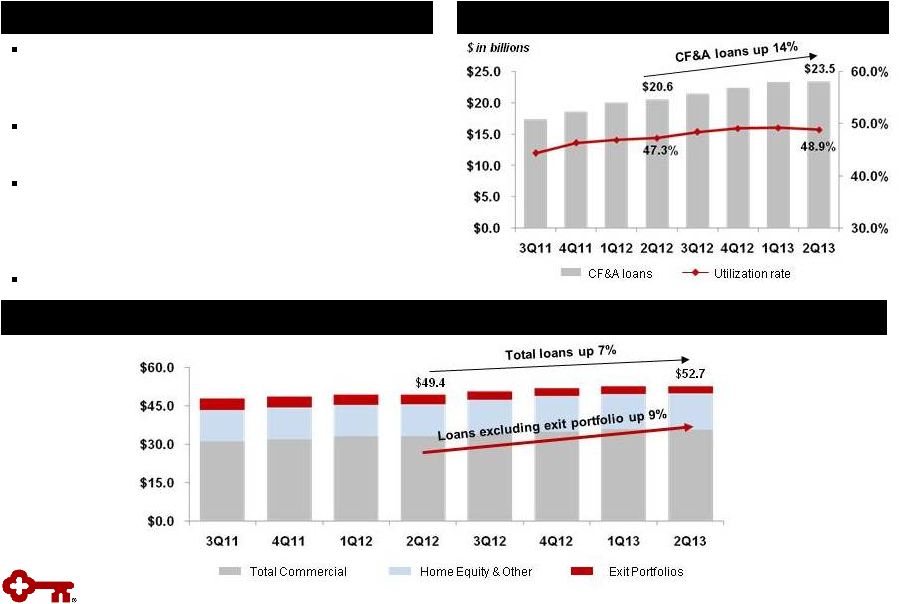
Grew average CF&A loans by 14% from the prior year
Acquisition of commercial mortgage servicing business
Expanded mobile capabilities for commercial and consumer clients
Achieved approximately $171 million in annualized expense savings through
2Q13; remainder of the $200 million target to be achieved by Dec. ‘13
Charges of $37 million during 2Q13 related to efficiency initiative
Realigned Community Bank structure and organization; closed 33 branches
Improve
Efficiency
Increased common share dividend by 10%
Repurchased $112 million in common shares during 2Q13
Well-positioned for transition to Basel III
Optimize and
Grow
Revenue
Investor Highlights –
2Q13
Execution of strategy and differentiated business model driving results
Effectively
Manage
Capital |
| 4
Financial Review
*
*
*
*
*
*
*
*
**
*
*
*
*
*
*
*
*
* |
 5
Financial Highlights
TE = Taxable equivalent, EOP = End of Period
(a)
From continuing operations
(b)
Year-over-year average balance growth
(c)
From consolidated operations
(d)
6-30-13 ratios are estimated
(e)
Non-GAAP measure: see Appendix for reconciliation
Metrics
2Q13
1Q13
4Q12
3Q12
2Q12
EPS –
assuming dilution
$ .21
$ .21
$ .20
$ .22
$ .23
Cash efficiency ratio
(e)
69
%
66
%
69
%
64
%
69
%
Adj. cash efficiency ratio (ex. initiative charges)
(e)
65
65
67
62
69
Net interest margin (TE)
3.13
3.24
3.37
3.23
3.06
Return on average total assets
.95
.99
.96
1.06
1.10
Total loans and leases
7
%
6
%
7
%
6
%
2
%
CF&A loans
14
16
21
24
22
Deposits (excl. foreign deposits)
8
7
7
7
5
Tier 1 common equity
(d), (e)
11.3
%
11.4
%
11.4
%
11.3
%
11.6
%
Tier 1 risk-based capital
(d)
12.0
12.2
12.2
12.1
12.5
Tangible common equity to tangible assets
(e)
10.0
10.2
10.2
10.4
10.4
NCOs to average loans
.34
%
.38
%
.44
%
.86
%
.63
%
NPLs to EOP portfolio loans
1.23
1.24
1.28
1.27
1.32
Allowance for loan losses to EOP loans
1.65
1.70
1.68
1.73
1.79
Financial
Performance
(a)
Balance
Sheet
Growth
(a),
(b)
Capital
(c)
Asset
Quality
(a) |
 6
Average loan growth from prior year driven by
CF&A, while the exit portfolio continues to
run-off
Excluding the exit portfolio, average loans up 9%
from prior year
Average loans stable linked quarter, reflecting
cautious client behavior, a competitive
environment and attractive capital markets
alternatives
High quality new loan originations
Loan Growth
Highlights
Average Commercial, Financial & Agricultural Loans
Average Loans
$ in billions |
 7
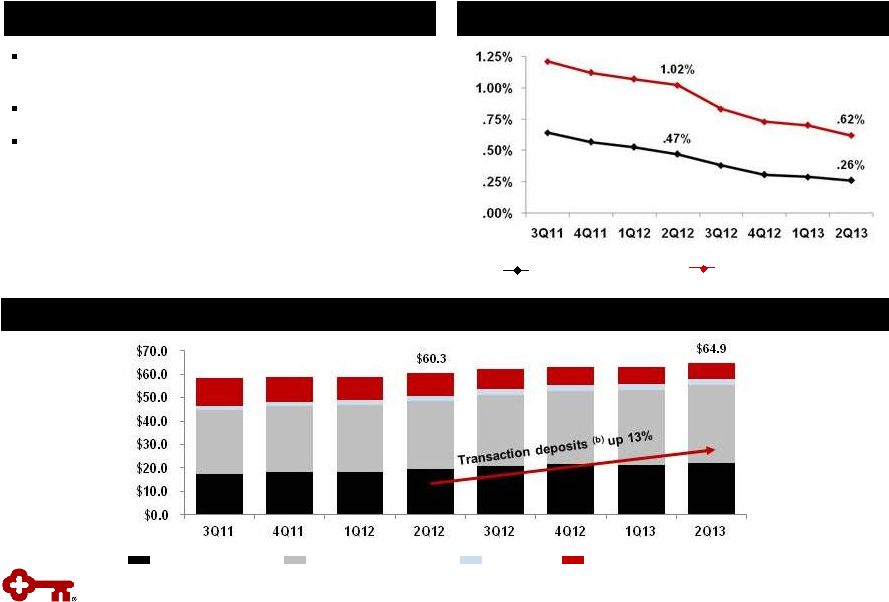
Improving Deposit Mix
Highlights
Funding Cost
Overall funding cost continues to improve, with
total deposit cost declining to 26 bps
Transaction deposit balances up 13% from 2Q12
Total CD maturities and average cost
–
2013 Q3: $2.0 billion at .94%
–
2013 Q4: $1.0 billion at 1.11%
–
2014: $2.8 billion at 1.62%
–
2015 & beyond: $1.3 billion at 2.27%
Average
Deposits
(a)
$ in billions
(a)
Excludes deposits in foreign office
(b)
Transaction deposits include noninterest-bearing, NOW, and MMDA
Cost of total deposits
(a)
Interest-bearing liability cost
CDs and other time deposits
Savings
Noninterest-bearing
NOW and MMDA |
 8
Net Interest Income and Margin
TE = Taxable equivalent
Continuing Operations
Highlights
Net Interest Income & Net Interest Margin (TE) Trend
Net interest income increased 8% from prior year
Net interest margin compared to prior quarter
impacted by lower asset yields, earning asset mix,
higher liquidity, and roll-off of swaps
Moderate asset sensitive position migrating higher
due to natural business flows
Use of swaps provides flexibility to quickly adjust
interest rate risk position
NIM Change (bps):
vs. 1Q13
Loan yield, mix and fees
(.06)
Higher liquidity / securities
(.05)
Interest rate risk management / swaps
(.02)
Funding cost / other
.02
Total Change
(.11)
Net interest income (TE)
NIM
Asset Sensitivity
Simulated change in net interest income to
a 200
bps rise in interest rates over a one-year period (a)
2Q13 change in interest income is estimated
$ in millions |
 9
Noninterest Income
TE = Taxable equivalent
Continuing Operations
Highlights
Noninterest Income
Strength in core fee income categories helped to
offset prior year gains:
–
Investment banking & debt
placement
fees (+$11MM); cards and
payments income
(+$11MM); trust and investment services
(+$10MM) –
2Q12 leverage lease termination gain (-$31MM)
–
Lower gains from principal investing (-$17MM)
Investment banking and debt placement fees, up
46% from prior year on a rolling four quarter avg.
Noninterest income
Investment Banking & Debt Placement Fees
Revenue Diversity
$ in millions
Noninterest income as a % of revenue
Rolling Four Quarter Average
$ in millions |
 10
Focused Expense Management
Noninterest Expense
Personnel expense
$ in millions
Highlights
Significant progress made on efficiency initiative
–
Achieved approximately $171 million in
annualized expense savings through 2Q13
2Q13 expense included $37 million related to
efficiency initiative, of which $18 million was
severance
Expenses down $45 million from prior year
excluding charges related to efficiency initiative
and acquisitions
Nonpersonnel expense
Y-o-Y Change in Noninterest Expense
(c)
(a)
Non-GAAP measures: see Appendix for reconciliation
(b)
Excludes one-time gains of $54 million related to the redemption of trust
preferred securities (c)
Includes ongoing, one-time and amortization expenses
(d)
Excludes expenses for Victory Capital Management, which were moved to discontinued
operations in 1Q13 (e)
Includes quarterly run-rate of $171 million in annualized expense savings
realized through 2Q13 $377
Expense related to efficiency initiative:
$15
$16
$26
$37
Incremental annualized cost savings achieved:
$60
$45
$66
Efficiency Ratio
(a) |
 11
Nonperforming Assets
Net Charge-offs & Provision for Loan and Lease Losses
NPLs
NPLs to period-end loans
NCOs
Provision for loan and
lease losses
NCOs to average loans
$ in millions
NPLs held for sale,
OREO & other NPAs
Continued Improvement in Asset Quality
Highlights
Net loan charge-offs decreased 42% from 2Q12
to $45 million, or 34 bps of average loans
2Q13 commercial loan net charge-offs
were $5 million or 5 bps of average
loans Asset quality reaching normalized levels, with
net charge-offs expected to be at or below
targeted range
Allowance for Loan and Lease Losses
Allowance for loan and
lease losses to NPLs
Allowance for loan
and lease losses |
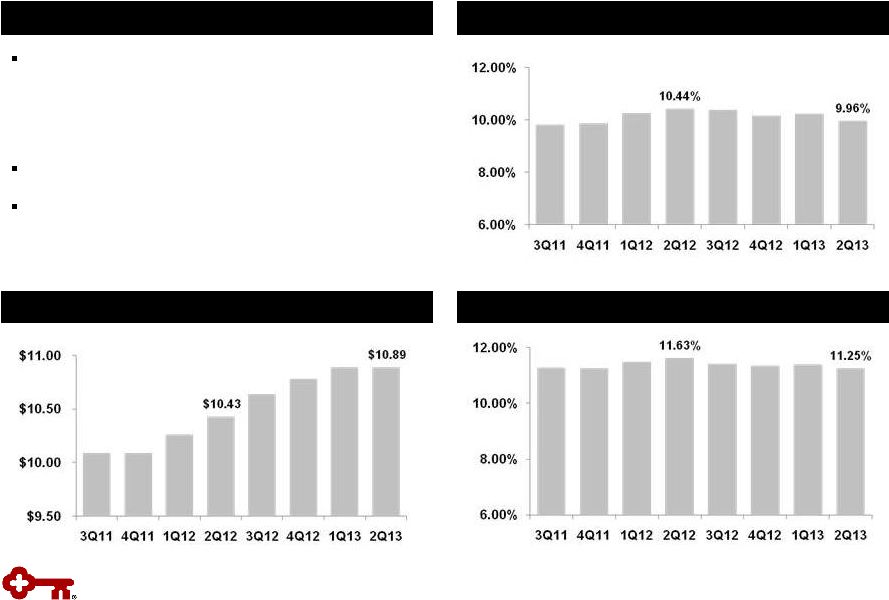 12
Disciplined execution of capital plan
–
Increased dividend 10%
–
Repurchased $112 million in common
shares during 2Q13
Well-positioned for transition to Basel III
Estimated Basel III Tier 1 common equity
ratio of 10.8%
(a), (b)
Tier 1 Common Equity
(b), (c)
Tangible Common Equity to Tangible Assets
(b)
Strong Capital Ratios
Highlights
Book Value per Share
(a)
Based upon June 30, 2013 pro forma analysis; see Appendix for further detail
(b)
Non-GAAP measure: see Appendix for reconciliations
(c)
6-30-13 ratio is estimated |
| 13
Appendix
*
*
*
*
*
*
*
*
*
*
*
*
*
*
*
*
*
*
* |
 14
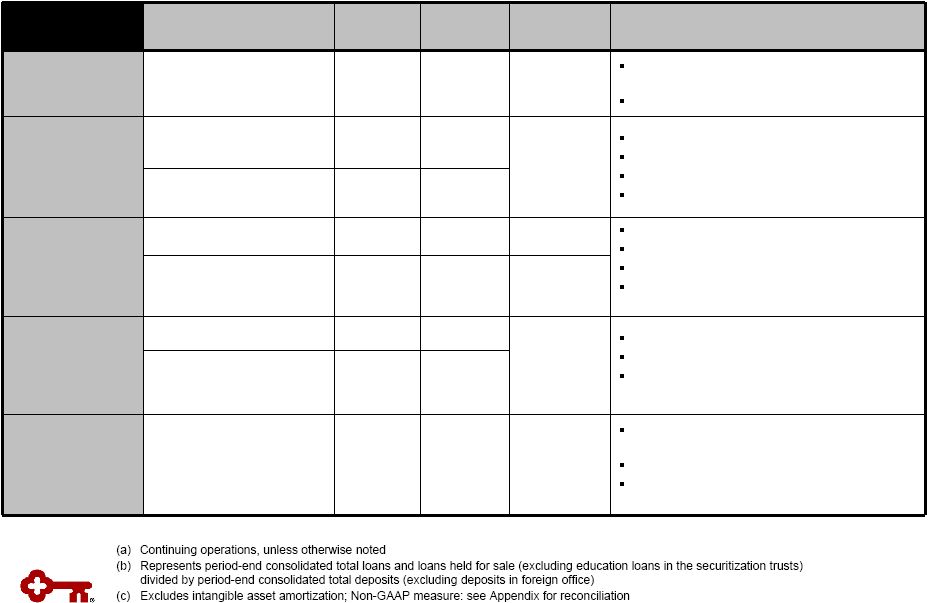
Progress on Targets for Success
KEY Business
Model
KEY Metrics
(a)
KEY
2Q13
KEY
1Q13
Targets
Action Plans
Core funded
Loan to deposit ratio
(b)
84%
87%
90-100%
Use integrated model to grow relationships
and loans
Improve deposit mix
Returning to a
moderate risk
profile
NCOs to average loans
.34%
.38%
40-60 bps
Focus on relationship clients
Exit noncore portfolios
Limit concentrations
Focus on risk-adjusted returns
Provision to average
loans
.21%
.42%
Growing high
quality, diverse
revenue streams
Net interest margin
3.13%
3.24%
>3.50%
Improve funding mix
Focus on risk-adjusted returns
Grow client relationships
Capitalize on Key’s total client solutions and
cross-selling capabilities
Noninterest income
to total revenue
42%
42%
>40%
Creating positive
operating
leverage
Cash efficiency ratio
(c)
69%
66%
60-65%
Improve efficiency and effectiveness
Better utilize technology
Change cost base to more variable from
fixed
Adj. cash efficiency ratio
(ex. efficiency initiative
charges)
(c)
65%
65%
Executing our
strategies
Return on average
assets
.95%
.99%
1.00-1.25%
Execute our client insight-driven
relationship model
Focus on operating leverage
Improved funding mix with lower cost core
deposits |
 15
Average Total Investment Securities
Highlights
Average AFS securities
$ in billions
High Quality Investment Portfolio
Portfolio composed of Agency or GSE backed
CMOs: Fannie, Freddie & CNMA
–
No private label MBS or financial paper
Average portfolio life at 6/30/13 of 3.2 years
compared to 2.8 years at 3/31/13
Unrealized net gain of $133 million on available-
for-sale securities portfolio at 6/30/13
Securities cash flows of $1.5 billion in both 2Q13
and 1Q13
Average portfolio balances higher by $1.6 billion
compared to 1Q13 due to investment of excess
liquidity
Yields on purchases were 137 bps lower than
2Q13 maturities
Securities to Total Assets
(b)
(a) Yield is calculated on the basis of amortized cost
(b) Includes end of period held-to-maturity and
available-for-sale securities Average yield
(a)
Average HTM securities |
 16
Asset Quality Trends
Quarterly Change in Criticized Outstandings
(a)
Delinquencies to Period-end Total Loans
(a)
Loan and lease outstandings
(b)
From continuing operations
30 –
89 days delinquent
90+ days delinquent
Continuing Operations
Continuing Operations |
 17
Period-
end
loans
Average
loans
Net loan
charge-offs
Net loan
charge-offs
(b)
/
average loans
(%)
Nonperforming
loans
(c)
Ending
allowance
(d)
Allowance /
period-end
loans
(d)
(%)
Allowance /
NPLs
(%)
6/30/13
2Q13
2Q13
1Q13
2Q13
1Q13
6/30/13
3/31/13
6/30/13
6/30/13
6/30/13
Commercial, financial and agricultural
(a)
$23,715
$23,480
$ 8
$ 2
.14
.03
$ 146
$ 142
$
352 1.48
241.10
Commercial real estate:
Commercial Mortgage
7,474
7,494
(2)
8
(.11)
.43
106
114
182
2.44
171.70
Construction
1,060
1,049
1
(7)
.38
(2.75)
26
27
34
3.21
130.77
Commercial lease financing
4,774
4,747
(2)
2
(.17)
.17
14
12
61
1.28
435.71
Real estate –
residential mortgage
2,176
2,176
4
6
.74
1.12
94
96
33
1.52
35.11
Home equity:
Key Community Bank
10,173
9,992
14
16
.56
.66
205
199
94
.92
45.85
Other
375
389
5
4
5.16
3.93
16
18
16
4.27
100.00
Consumer other –
Key Community Bank
1,424
1,392
5
7
1.44
2.11
3
3
33
2.32
N/M
Credit cards
701
697
6
8
3.45
4.61
11
13
33
4.71
300.00
Consumer other:
Marine
1,160
1,206
5
3
1.66
.93
30
25
35
3.02
116.67
Other
69
74
1
-
5.42
-
1
1
3
4.35
300.00
Continuing total
(e)
$53,101
$52,696
$ 45
$ 49
.34
.38
$ 652
$ 650
$
876 1.65
134.36
Discontinued operations
4,992
5,016
7
12
1.04
1.75
19
15
41
.82
215.79
Consolidated total
$58,093
$57,712
$ 52
$ 61
.38
.45
$ 671
$ 665
$
917 1.58
136.66
Credit Quality by Portfolio
Credit Quality
(a)
6-30-13
ending
loan
balances
include
$96
million
of
commercial
credit
card
balances;
6-30-13
average
loan
balances
include
$96
million
of
assets
from
commercial
credit
cards
(b)
Net loan charge-off amounts are annualized in calculation. NCO ratios for
discontinued operations and consolidated Key exclude education loans in the
securitization trusts since valued at fair-market value (c)
6-30-13 and 3-31-13 NPL amounts exclude $19 million and $22
million respectively of purchased credit impaired loans acquired in July 2012.
(d) 6-30-13 allowance by portfolio is estimated.
Allowance/period loans ratios for discontinued operations and consolidated Key exclude education
loans in the securitization trusts since valued at fair-market value
(e) 6-30-13 ending loan balances include purchased loans of $187
million of which $19 million were purchased credit impaired $ in millions
N/M
=
Not
Meaningful |
 18
(a)
Average LTVs are at origination. Current average LTVs for Community Bank total
home equity loans and lines is approximately 75%, which compares to 78% at
the end of the first quarter 2013. Community Bank –
Home Equity
Exit Portfolio –
Home Equity
Home Equity Loans –
6/30/13 |
 Balance Outstanding
Change
Net Loan Charge-offs
Balance on
Nonperforming Status
6-30-13
3-31-13
6-30-13
vs.
3-31-13
2Q13
1Q13
(c)
6-30-13
3-31-13
Residential
properties
–
homebuilder
$ 26
$ 29
$ (3)
$ 1
-
$ 8
$ 10
Marine and RV floor plan
28
29
(1)
-
$ (3)
7
6
Commercial
lease
financing
(a)
931
966
(35)
(2)
(5)
1
6
Total commercial loans
985
1,024
(39)
(1)
(8)
16
22
Home equity –
Other
375
401
(26)
5
4
16
18
Marine
1,160
1,254
(94)
5
3
31
26
RV and other consumer
69
79
(10)
1
-
-
-
Total consumer loans
1,604
1,734
(130)
11
7
47
44
Total exit loans in loan portfolio
$ 2,589
$ 2,758
$ (169)
$ 10
$ (1)
$ 63
$ 66
Discontinued
operations
–
education
lending
business
(not
included
in
exit
loans
above)
(b)
$ 4,992
$ 5,086
$ (94)
$ 7
$ 12
$ 19
$ 15
19
(a)
Includes (1) the business aviation, commercial vehicle, office products,
construction and industrial leases; (2) Canadian lease financing portfolios;
and (3) all remaining balances related to lease in, lease out; sale in, lease out;
service contract leases; and qualified technological equipment leases (b)
Includes loans in Key’s consolidated education loan securitization
trusts (c)
Credit amounts indicate recoveries exceeded charge-offs
$ in millions
Exit Loan Portfolio
Exit Loan Portfolio |
 GAAP
to Non-GAAP Reconciliation 20
$ in millions
(a)
Three months ended June 30, 2013 and March 31, 2013 exclude $107
million and $114 million, respectively, of period end purchased
credit card
receivable intangible assets
(b)
Net of capital surplus for the three months ended June 30, 2013
(c)
Includes net unrealized gains or losses on securities available for sale (except
for net unrealized losses on marketable equity securities), net gains or
losses on cash flow hedges, and amounts resulting from the application of the applicable accounting guidance for defined benefit and other
postretirement plans
(d)
Other assets deducted from Tier 1 capital and net risk-weighted assets consist
of disallowed intangible assets (excluding goodwill) and deductible
portions
of
nonfinancial
equity
investments.
There
were
no
disallowed
deferred
tax
assets
at
June
30,
2013,
March
31,
2013,
and
June
30,
2012
(e)
6-30-13 amount is estimated |
 GAAP
to Non-GAAP Reconciliation (continued) $ in millions
21
(a)
Three
months
ended
June
30,
2013
and
March
31,
2013
exclude
$110
million
and
$118
million,
respectively,
of
average
ending
purchased
credit
card receivable intangible assets
Three months ended
6-30-13
3-31-13
6-30-12
Average tangible common equity
Average Key shareholders' equity (GAAP)
$
10,314
$
10,279
$
10,100
Less:
Intangible assets (average)
(a)
1,023
1,027
931
Preferred Stock, Series A (average)
291
291
291
Average tangible common equity (non-GAAP)
$
9,000
$
8,961
$
8,878
Return on average tangible common equity from continuing operations
Net
income
(loss)
from
continuing
operations
attributable
to
Key
common
shareholders
(GAAP)
$
193
$
196
$
217
Average tangible common equity (non-GAAP)
9,000
8,961
8,878
Return on average tangible common equity from continuing operations
(non-GAAP) 8.60
%
8.87
%
9.83
%
Return on average tangible common equity consolidated
Net income (loss) attributable to Key common shareholders (GAAP)
$
198
$
199
$
231
Average tangible common equity (non-GAAP)
9,000
8,961
8,878
Return on average tangible common equity consolidated (non-GAAP)
8.82
%
9.01
%
10.46
%
Cash efficiency ratio
Noninterest expense (GAAP)
$
711
$
681
$
693
Less:
Intangible asset amortization on credit cards (GAAP)
7
8
—
Other intangible asset amortization (GAAP)
3
4
1
Adjusted noninterest expense (non-GAAP)
$
701
$
669
$
692
Net interest income (GAAP)
$
581
$
583
$
538
Plus:
Taxable-equivalent adjustment
5
6
6
Noninterest income (GAAP)
429
425
457
Total taxable-equivalent revenue (non-GAAP)
$
1,015
$
1,014
$
1,001
Cash efficiency ratio (non-GAAP)
69.06
%
65.98
%
69.13
%
Adjusted cash efficiency ratio
Adjusted noninterest expense (non-GAAP)
$
701
$
669
$
692
Less:
Efficiency initiative charges (non-GAAP)
37
15
—
Net adjusted noninterest expense (non-GAAP)
$
664
$
654
$
692
Total taxable-equivalent revenue (non-GAAP)
$
1,015
$
1,014
$
1,001
Adjusted cash efficiency ratio (non-GAAP)
65.42
%
64.50
%
69.13
% |
 Tier 1
Common Equity under Basel III (estimated) KeyCorp & Subsidiaries
22
Tier 1 Common Equity Under Basel III (Estimates)
(a)
$ in billions
Quarter ended
June 30, 2013
Tier 1 Common Equity under current regulatory rules
$
9.2 Adjustments from current regulatory rules
to Basel III: Deferred tax assets
(b)
(0.1)
Tier 1 common equity anticipated under Basel III
(c)
$
9.2 Total risk-weighted
assets under current regulatory rules
$
82.0 Adjustments from current regulatory rules to Basel
III: Loan commitments <1 year
0.8
Past Due Loans
0.3
Mortgage servicing assets
(d)
0.3
Deferred tax assets
(d)
0.3
Other
1.1
Total risk-weighted assets under Basel III
$
84.8 Tier 1 common equity to total risk-weighted assets
anticipated under Basel III 10.8
%
(a)
Tier
1
common
equity
is
a
non-generally
accepted
accounting
principle
(GAAP)
financial
measure
that
is
used
by
investors,
analysis
and
bank
regulatory agencies to assess the capital position of financial services
companies; management reviews Tier 1 common equity along with other
measures of capital as part of its financial analyses
(b)
Includes the deferred tax asset subject to future taxable income
for realization, primarily tax credit carryforwards
(c)
The amount of regulatory capital and risk-weighted assets estimated under
Basel III (as fully phased-in on January 1, 2019) is based upon the
federal banking agencies' final Basel III Rule; Key is subject to Basel III under
the final rule’s Standardized Approach (d)
Item is included in the 10%/15% exceptions bucket calculation and is
risk-weighted at 250% Table may not foot due to rounding
|