Attached files
| file | filename |
|---|---|
| 8-K - 8-K - JOHNSON CONTROLS INC | a8-kq3results.htm |
| EX-99.1 - EXHIBIT 99.1 - JOHNSON CONTROLS INC | exh991-johnsonctrlsq3fy13.htm |

July 18, 2013 Quarterly update FY 2013 third quarter

Forward-looking statements Johnson Controls, Inc. has made statements in this document that are forward-looking and, therefore, are subject to risks and uncertainties. All statements in this document other than statements of historical fact are statements that are, or could be, deemed "forward-looking statements" within the meaning of the Private Securities Litigation Reform Act of 1995. In this document, statements regarding future financial position, sales, costs, earnings, cash flows, other measures of results of operations, capital expenditures or debt levels and plans, objectives, outlook, targets, guidance or goals are forward-looking statements. Words such as “may,” “will,” “expect,” “intend,” “estimate,” “anticipate,” “believe,” “should,” “forecast,” “project” or “plan” or terms of similar meaning are also generally intended to identify forward-looking statements. Johnson Controls cautions that these statements are subject to numerous important risks, uncertainties, assumptions and other factors, some of which are beyond Johnson Controls’ control, that could cause Johnson Controls’ actual results to differ materially from those expressed or implied by such forward-looking statements. These factors include the strength of the U.S. or other economies, automotive vehicle production levels, mix and schedules, energy and commodity prices, availability of raw materials and component products, currency exchange rates, and cancellation of or changes to commercial contracts, as well as other factors discussed in Item 1A of Part I of Johnson Controls’ most recent Annual Report on Form 10-K for the year ended September 30, 2012 and Johnson Controls’ subsequent Quarterly Reports on Form 10-Q. Shareholders, potential investors and others should consider these factors in evaluating the forward-looking statements and should not place undue reliance on such statements. The forward-looking statements included in this document are only made as of the date of this document, and Johnson Controls assumes no obligation, and disclaims any obligation, to update forward-looking statements to reflect events or circumstances occurring after the date of this document. 2

Agenda Introduction Glen Ponczak, Vice President, Global Investor Relations Overview Steve Roell, Chairman and Chief Executive Officer Business results and financial review Alex Molinaroli, Vice Chairman Bruce McDonald, Executive Vice President and Chief Financial Officer Q&A 3

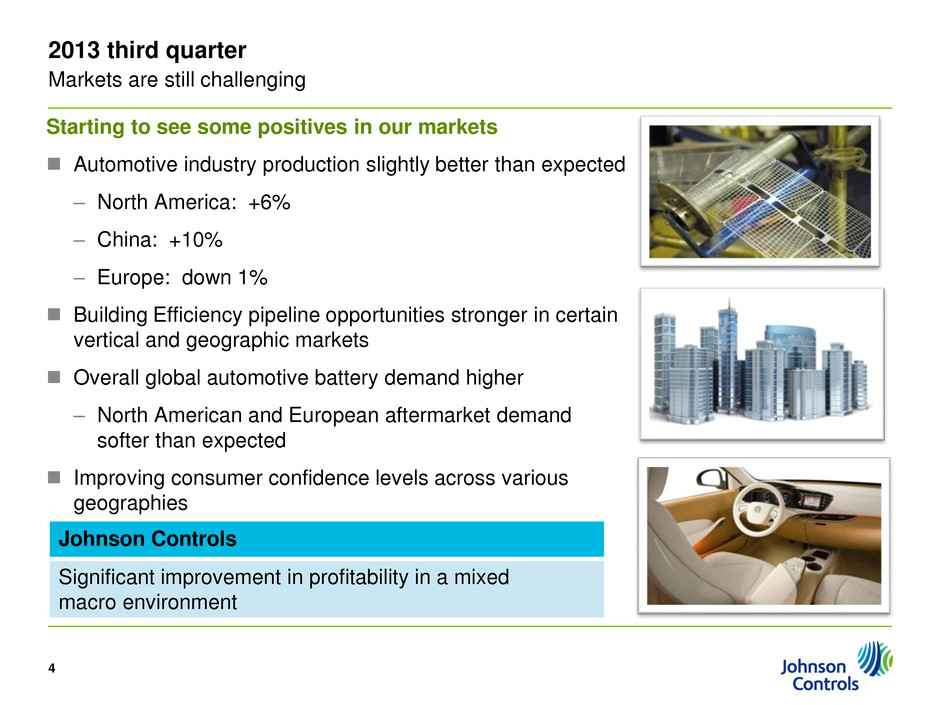
2013 third quarter Markets are still challenging Starting to see some positives in our markets Automotive industry production slightly better than expected – North America: +6% – China: +10% – Europe: down 1% Building Efficiency pipeline opportunities stronger in certain vertical and geographic markets Overall global automotive battery demand higher – North American and European aftermarket demand softer than expected Improving consumer confidence levels across various geographies 4 Johnson Controls Significant improvement in profitability in a mixed macro environment

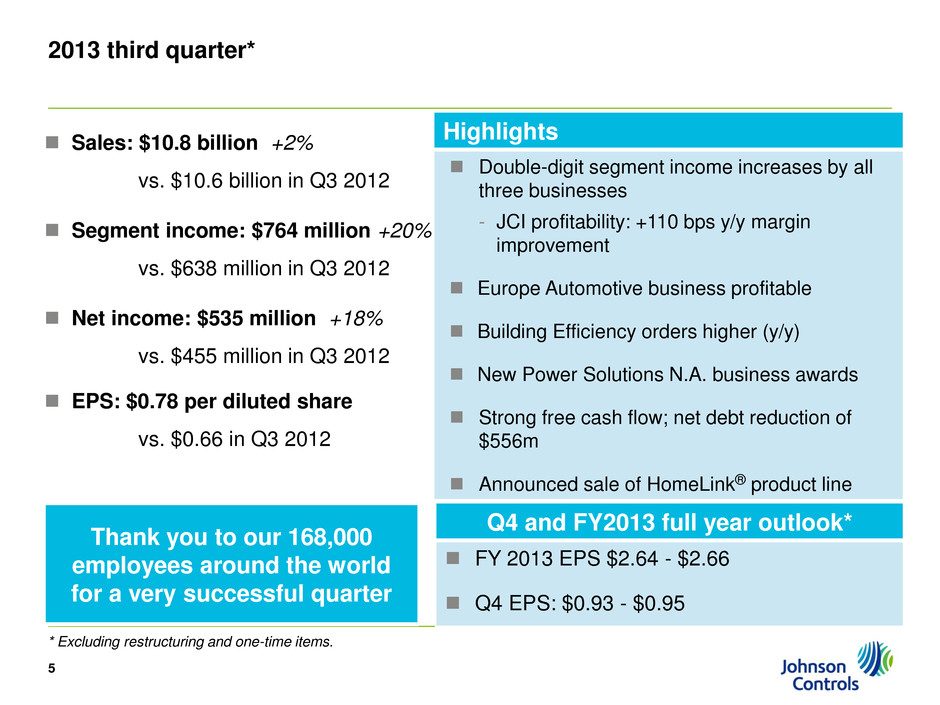
Sales: $10.8 billion +2% vs. $10.6 billion in Q3 2012 Segment income: $764 million +20% vs. $638 million in Q3 2012 Net income: $535 million +18% vs. $455 million in Q3 2012 EPS: $0.78 per diluted share vs. $0.66 in Q3 2012 5 Q4 and FY2013 full year outlook* FY 2013 EPS $2.64 - $2.66 Q4 EPS: $0.93 - $0.95 2013 third quarter* * Excluding restructuring and one-time items. Highlights Double-digit segment income increases by all three businesses - JCI profitability: +110 bps y/y margin improvement Europe Automotive business profitable Building Efficiency orders higher (y/y) New Power Solutions N.A. business awards Strong free cash flow; net debt reduction of $556m Announced sale of HomeLink® product line Thank you to our 168,000 employees around the world for a very successful quarter

Stronger year-over-year performance in the second half of fiscal 2013 Drivers of Q3 improvement expected to provide continued benefits in Q4 Benefits of restructuring ─ Earlier initiatives on track; additional actions taken in Q3 Lower lead core costs vs. record high levels in 2H 2012 Margin expansion in Building Efficiency due to benefits of cost containment and pricing initiatives Continuation of sequential profitability improvements in Automotive Experience European, South American and Metals businesses Improved North America and Europe automotive production comparables 6

2013 third quarter Power Solutions 2013 2012 Net sales $1.4B $1.3B +8% Global unit shipments slightly higher, but softer-than- expected aftermarket demand in North America and Europe – Americas and Asia, each up 1% – Europe up 7% Improved product mix and pricing Segment income $171M $153M +12% Benefits of higher volume, increased vertical integration and improved mix and pricing Benefit from ramp of South Carolina battery recycling facility Lead core prices remain elevated 7 Florence, South Carolina battery recycling facility Price Increase: July 1, 2013 3 - 4% price increase on N.A. aftermarket batteries to offset higher cost of spent battery cores, a key source of lead for recycling.

2013 third quarter Building Efficiency 2013 2012 Net sales $3.7B $3.8B -2% Soft N.A. and European demand negatively impacting sales Level sales in North America Service and Asia with lower revenue in GWS, North America Systems and Europe Segment income $314M $276M +14% Significantly higher segment income despite lower revenue Benefit of pricing initiatives and SG&A reductions – 120 bps improvement in segment income margins to 8.5% 8 Commercial backlog and orders (at June 30, 2013) Orders up 2%; positive in all geographic markets Bidding activity continues to trend higher in some markets Backlog ($5.1B), down 5% vs. year-ago ─ Higher demand in Latin America offset by softness in Energy Solutions and the Middle East

Building Efficiency Organizational Changes Combining North American Systems, Services and Solutions businesses – Single consistent customer interface – Facilitates bundled offerings – Increase margins by improving sales force productivity and streamlining administrative costs Establishing Global Workplace Solutions as a stand-alone business (to report to Alex Molinaroli) – Very different business model from rest of Building Efficiency – Separation enables greater focus on driving margin improvement 9

2013 third quarter Automotive Experience 2013 2012 Net sales $5.7B $5.5B +4% Higher revenue in North America and Europe partially offset by lower sales in Japan (F/X impact) Seating up 5%; Interiors and Electronics up 1% China sales (mostly non-consolidated) up 23% to $1.4B Segment income $279M $209M +33% Higher profitability in all geographic regions European profitability improvement attributable to higher volumes and better than expected Metals performance Restructuring actions progressing as planned Gain on sale of asset substantially offset by other charges 10 Fiscal Q3 production North America up 6% Europe down 1% China up 10% Results by geography North America segment margins: 7% Asia segment margins: 15% Europe: $11 million profit; $85 million sequential quarterly improvement

Automotive Electronics Divestiture Update Announced today: Definitive agreement to sell HomeLink® product line to Gentex Corporation Purchase price of approximately $700 million in cash Transaction expected to close on or about September 30, 2013 Process to sell remainder of Electronics business is progressing as planned – Several interested strategic buyers – Targeting announcement of definitive agreement by 2013 Q4 earnings release 11

Third quarter 2013 Financial highlights 12 (in millions) 2013 2012 % change Sales $10,831 $10,581 2% Gross profit % of sales 1,680 15.5% 1,541 14.6% 9% SG&A expenses 991 973 2% Equity income 75 70 7% Segment income $764 $638 20% 7.1% 6.0% Gross profit – Improved margins in Interiors, Metals and Building Efficiency SG&A – Benefits from restructuring actions offset by increased investments in innovation, emerging markets and higher engineering spend

Third quarter 2013 Financial highlights Financing – Attributable to higher debt levels Income tax provision – 20% effective tax rate, consistent with guidance (in millions, except earnings per share) 2013 (excluding items *) 2012 (excluding items *) 2013 (reported) 2012 (reported) Segment income $764 $638 $764 $638 Restructuring costs ----- ----- 143 52 Financing charges - net 67 59 67 59 Income before taxes 697 579 554 527 Income tax provision (benefit) 139 99 (40) 71 Net income 558 480 594 456 Income attributable to non-controlling interests 23 25 23 25 Net income attributable to JCI $535 $455 $571 $431 Diluted earnings per share $0.78 $0.66 $0.83 $0.63 13 *Q3 2013 items: $140 million tax benefit and $143 million pre-tax restructuring charge. Q3 2012 items: $28 million tax benefit and $52 million pre-tax restructuring charge.

Balance sheet / cash flow Cash provided from operating activities $1.0 billion – Net debt reduction of $556 million – Net debt to capitalization 31.7% Improved working capital performance – Trade Working Capital 6.5% of sales, 20 bps year-to-date improvement – Cash generated from Working Capital $283 million in Q3 Cap Ex of $265 million, full-year outlook remains at $1.2 billion Strong cash flow from operations to continue in Q4; net debt reduction of $600 - $650 million, excluding divestiture proceeds – $300 million of Debt maturities in Q4 funded from operations – Electronics proceeds expected to fund $800 million of Debt maturities in FY 14 Q2 14

Looking forward Q3 an inflection point, strong confidence in Q4 outlook – Continued sequential profitability improvements in Automotive Europe and South America – In Building Efficiency, our pipeline supports further improvement in our fourth quarter orders; Q4 revenue growth anticipated with further margin expansion – Power Solutions expected to deliver strong y/y improvement – Restructuring initiatives on track, additional actions announced 15 Guidance* Full-year 2013: $2.64 - $2.66 / share Q4: $0.93 - $0.95 / share (21% - 23% improvement) *Guidance excludes potential items such as: mark-to-market pension accounting, restructuring, tax adjustments, electronics business as a discontinued operation, etc.
