Attached files
| file | filename |
|---|---|
| EX-3.1 - EX-3.1 - Telaria, Inc. | a2215387zex-3_1.htm |
| EX-4.1 - EX-4.1 - Telaria, Inc. | a2215601zex-4_1.htm |
| EX-3.3 - EX-3.3 - Telaria, Inc. | a2215387zex-3_3.htm |
| EX-3.4 - EX-3.4 - Telaria, Inc. | a2215387zex-3_4.htm |
| EX-3.2 - EX-3.2 - Telaria, Inc. | a2215601zex-3_2.htm |
| EX-5.1 - EX-5.1 - Telaria, Inc. | a2215601zex-5_1.htm |
| EX-1.1 - EX-1.1 - Telaria, Inc. | a2215601zex-1_1.htm |
| EX-10.12 - EX-10.12 - Telaria, Inc. | a2215601zex-10_12.htm |
| EX-10.17 - EX-10.17 - Telaria, Inc. | a2215601zex-10_17.htm |
| EX-10.13 - EX-10.13 - Telaria, Inc. | a2215601zex-10_13.htm |
| EX-10.14 - EX-10.14 - Telaria, Inc. | a2215601zex-10_14.htm |
| EX-10.16 - EX-10.16 - Telaria, Inc. | a2215601zex-10_16.htm |
| EX-23.1 - EX-23.1 - Telaria, Inc. | a2215601zex-23_1.htm |
| EX-10.15 - EX-10.15 - Telaria, Inc. | a2215601zex-10_15.htm |
Use these links to rapidly review the document
TABLE OF CONTENTS
Table of Contents
As filed with the Securities and Exchange Commission on June 14, 2013.
Registration No. 333-188813
UNITED STATES
SECURITIES AND EXCHANGE COMMISSION
Washington, D.C. 20549
Amendment No. 1
to
FORM S-1
REGISTRATION STATEMENT
Under
The Securities Act of 1933
TREMOR VIDEO, INC.
(Exact name of Registrant as specified in its charter)
| Delaware | 7311 | 20-5480343 | ||
| (State or other jurisdiction of incorporation or organization) |
(Primary Standard Industrial Classification Code Number) |
(I.R.S. Employer Identification Number) |
53 West 23rd Street
New York, New York 10010
(646) 723-5300
(Address, including zip code, and telephone number, including area code, of Registrant's principal executive offices)
William Day
President and Chief Executive Officer
Tremor Video, Inc.
53 West 23rd Street
New York, New York 10010
(646) 723-5300
(Name, address, including zip code, and telephone number, including area code, of agent for service)
Copies to:
| Eric Jensen Nicole Brookshire Peyton Worley Cooley LLP 1114 Avenue of the Americas New York, New York 10036 Tel: (212) 479-6000 |
Adam Lichstein Senior Vice President, Chief Operating Officer and General Counsel 53 West 23rd Street New York, New York 10010 Tel: (646) 723-5300 |
Selim Day Michael Nordtvedt Wilson Sonsini Goodrich & Rosati Professional Corporation 1301 Avenue of the Americas New York, New York 10019 Tel: (212) 999-5800 |
Approximate date of commencement of proposed sale to the public:
As soon as practicable after the effective date of this registration statement.
If any of the securities being registered on this Form are to be offered on a delayed or continuous basis pursuant to Rule 415 under the Securities Act of 1933, check the following box. o
If this Form is filed to register additional securities for an offering pursuant to Rule 462(b) under the Securities Act, check the following box and list the Securities Act registration statement number of the earlier effective registration statement for the same offering. o
If this Form is a post-effective amendment filed pursuant to Rule 462(c) under the Securities Act, check the following box and list the Securities Act registration statement number of the earlier effective registration statement for the same offering. o
If this Form is a post-effective amendment filed pursuant to Rule 462(d) under the Securities Act, check the following box and list the Securities Act registration number of the earlier effective registration statement for the same offering. o
CALCULATION OF REGISTRATION FEE
|
||||||||
| Title of Each Class of Securities to be Registered |
Amount to be Registered(1) |
Proposed Maximum Aggregate Offering Price Per Share |
Proposed Maximum Aggregate Offering Price(2) |
Amount of Registration Fee(3) |
||||
|---|---|---|---|---|---|---|---|---|
Common Stock, $0.0001 par value per share |
8,625,000 | $13.00 | $112,125,000 | $15,300 | ||||
|
||||||||
- (1)
- Includes 1,125,000 shares that the underwriters have the option to purchase.
- (2)
- Estimated
solely for purposes of computing the amount of the registration fee pursuant to Rule 457(a) under the Securities Act. Includes the
aggregate offering price of additional shares that the underwriters have the option to purchase.
- (3)
- The registrant previously paid $11,770 of the registration fee with the initial filing of this Registration Statement.
Indicate by check mark whether the registrant is a large accelerated filer, an accelerated filer, a non-accelerated filer, or a smaller reporting company. See the definitions of "large accelerated filer," "accelerated filer" and "smaller reporting company" in Rule 12b-2 under the Securities Exchange Act of 1934. (Check one):
| Large Accelerated Filer o | Accelerated Filer o | Non-accelerated Filer ý | Smaller Reporting Company o |
The registrant hereby amends this Registration Statement on such date or dates as may be necessary to delay its effective date until the registrant shall file a further amendment that specifically states that this Registration Statement shall thereafter become effective in accordance with Section 8(a) of the Securities Act of 1933, as amended, or until the registration statement shall become effective on such date as the Commission, acting pursuant to said Section 8(a), may determine.
The information in this prospectus is not complete and may be changed. We may not sell these securities until the registration statement filed with the Securities and Exchange Commission is effective. This prospectus is not an offer to sell these securities and we are not soliciting offers to buy these securities in any state where the offer or sale is not permitted.
SUBJECT TO COMPLETION, DATED JUNE 14, 2013
Shares

Common Stock
We are selling 7,500,000 shares of common stock.
Prior to this offering, there has been no public market for our common stock. The initial public offering price of the common stock is expected to be between $11.00 and $13.00 per share. We have applied for the listing of our common stock on the New York Stock Exchange under the symbol "TRMR."
We are an "emerging growth company" as defined under the U.S. federal securities laws and, as such, may elect to comply with certain reduced public company reporting requirements for this and future filings.
The underwriters have an option to purchase a maximum of 1,125,000 additional shares to cover over-allotments of shares.
Investing in our common stock involves risks. See "Risk Factors" on page 11.
| |
Price to Public |
Underwriting Discounts and Commissions |
Proceeds to Tremor |
|||||||
|---|---|---|---|---|---|---|---|---|---|---|
| Per Share | $ | $ | $ | |||||||
| Total | $ | $ | $ | |||||||
Delivery of the shares of common stock will be made on or about , .
Neither the Securities and Exchange Commission nor any state securities commission has approved or disapproved of these securities or determined if this prospectus is truthful or complete. Any representation to the contrary is a criminal offense.
| Credit Suisse | Jefferies | |||
Canaccord Genuity |
Oppenheimer & Co. |
The date of this prospectus is , 2013.

TABLE OF CONTENTS
You should rely only on the information contained in this document or to which we have referred you. We have not and the underwriters have not authorized anyone to provide you with information that is different. This document may only be used where it is legal to sell these securities. The information in this document may only be accurate on the date of this document.
Dealer Prospectus Delivery Obligation
Until , all dealers that effect transactions in these securities, whether or not participating in this offering, may be required to deliver a prospectus. This is in addition to the dealer's obligation to deliver a prospectus when acting as an underwriter and with respect to unsold allotments or subscriptions.
For investors outside the United States: We have not and the underwriters have not done anything that would permit this offering, or possession or distribution of this prospectus, in any jurisdiction where action for that purpose is required, other than in the United States. Persons outside the United States who come into possession of this prospectus must inform themselves about, and observe any restrictions relating to, the offering of the shares of common stock and the distribution of this prospectus outside of the United States.
i
This summary highlights information contained elsewhere in this prospectus and does not contain all of the information that you should consider in making your investment decision. Before investing in our common stock, you should carefully read this entire prospectus, including our consolidated financial statements and the related notes and the information set forth under the sections titled "Risk Factors," "Special Note Regarding Forward-Looking Statements," and "Management's Discussion and Analysis of Financial Condition and Results of Operations," in each case included in this prospectus. Unless the context otherwise requires, we use the terms "Tremor Video," "company," "our," "us," and "we" in this prospectus to refer to Tremor Video, Inc. and, where appropriate, our consolidated subsidiaries.
Mission
Our mission is to bring the certainty of science to the art of brand marketing.
Our Company
We are a leading provider of technology-driven video advertising solutions enabling brand advertisers to engage consumers across multiple internet-connected devices including computers, smartphones, tablets and connected TVs. Our clients include some of the largest brand advertisers in the world including all of the top 10 automakers and 9 of the top 10 consumer packaged goods companies. Our relationships with leading brand advertisers and their agencies have helped us create a robust online video ecosystem that includes more than 500 premium websites and mobile applications, over 200 of which partner with us on an exclusive basis. Our proprietary technology, VideoHub, analyzes in-stream video content, detects viewer and system attributes, and leverages our large repository of stored data to optimize video ad campaigns for brand-centric metrics. VideoHub also provides advertisers and agencies with advanced analytics and measurement tools enabling them to understand why, when and where viewers engage with their video ads.
Online video advertising is amongst the fastest growing advertising formats in the United States. According to eMarketer, while overall advertising spend is expected to grow by 3.5% on a compounded annual basis between 2012 and 2016, online video advertising spend is expected to grow by 28.9%. eMarketer estimated total U.S. advertising spend in 2012 to be $165.8 billion, of which online video advertising spend was $2.9 billion, or only 1.7%. As online audiences continue to spend more time watching videos, online video advertising spend is projected to reach $8.0 billion in 2016. Within online video advertising, mobile video advertising spend is expected to grow from $244 million to $2.1 billion, reflecting a 71.1% compounded annual growth rate from 2012 to 2016. Despite this tremendous growth, several factors including audience and device fragmentation, inadequate brand-centric measurement and optimization technology, and lack of performance and placement transparency have made it challenging to effectively deliver online video advertising. Our technology is designed to address these challenges.
Our VideoHub technology is the backbone of the Tremor Video Network through which we offer advertisers access to engaged consumers at scale in brand safe environments across multiple devices. We specialize in delivering in-stream video advertisements, which are served to viewers immediately prior to or during the publisher's content when viewers are most engaged. This is in contrast to traditional in-banner video advertising, which is served on the periphery of publisher content where viewers may not be directing their attention. We further enhance advertisers' campaigns with innovative ad formats specifically developed to harness the creative aspects of online video, which often result in consumers choosing to extend their interaction with a brand's message significantly past the original ad experience. To align our solutions with the goals of brand advertisers, we offer a number of brand performance-based pricing models for in-stream video advertising such as cost per engagement, or CPE, pricing where we are compensated only when viewers actively engage with advertisers' campaigns.
1
As a result, we enable our clients to effectively purchase measurable brand results rather than just impressions or clicks. We also license VideoHub technology to advertisers and their agencies through an intuitive and customizable console, which we call VideoHub for Advertisers, or VHA.
We have developed strong relationships with brand advertisers and their agencies, who we believe view us as a strategic and trusted partner with a deep understanding of their industry-specific needs. We have also developed strong relationships with publishers due to our ability to provide consistent yield and monetization for their video content. We continuously evaluate and refine our publisher network to ensure that our advertisers have access to premium video inventory in brand safe environments. We believe these relationships have created a network effect whereby advertisers increase their spend with us because of the results we deliver utilizing our proprietary technology and our publishers' premium inventory, which in turn allows us to attract additional high quality publishers and thereby additional advertising spend.
From 2011 to 2012, our revenue increased from $90.3 million to $105.2 million. This included an increase in revenue derived from the delivery of in-stream video advertising from $75.5 million to $99.7 million, or 32.1%. Additionally, over this period, our gross margin improved from 35.2% to 41.7%, driven in part by the adoption of our performance-based pricing models, while our net loss has decreased from $21.0 million to $16.6 million. For the three months ended March 31, 2013 as compared to the same period of 2012, our revenue increased from $17.3 million to $24.8 million, or 43.4%, our gross margin improved from 31.9% to 44.1% and our net loss decreased from $9.1 million to $5.2 million. For the three months ended March 31, 2012 and 2013, our revenue from the delivery of in-stream video advertising increased from $15.7 million to $24.0 million, or 52.9%. As a percentage of total revenue, revenue attributable to performance-based pricing for 2011, 2012 and the three months ended March 31, 2013 was 7.9%, 22.7% and 36.1%, respectively.
Industry Background and Market Opportunity
Advertisers often view the advertising market as a funnel that maps a potential consumer's purchase decision process from the moment he or she is introduced to a brand to the point of purchase. At the top of the marketing funnel, advertisers are focused on building brand awareness amongst the largest possible number of potential consumers and use reach as the primary metric to measure success. Traditionally, advertisers have preferred national television and outdoor media, such as a Super Bowl commercial or Times Square billboard, to achieve brand awareness. At the bottom of the marketing funnel, advertisers are focused on generating specific actions by a consumer in a short period of time. At this stage of the funnel, advertisers have generally relied on direct response marketing, such as newspaper inserts and coupons, as well as online search and display advertising, where conversions are used to measure campaign success.
In the middle of the marketing funnel, advertisers seek to engage consumers and educate them about their brand in order to differentiate themselves from competitors and drive consumer preferences toward a particular branded product to influence future purchase decisions, which we refer to as brand lift. Historically, advertisers have sought to achieve middle of the funnel objectives through print, which can tell a deeper story about a product and its benefits, and allows the reader to linger as long as he or she likes, and to a lesser extent through local and cable television, which offers a more targeted audience for a product's message than national television. Traditional solutions for middle of the funnel marketing have significant limitations because they lack interactivity, the ability to measure and analyze the results of brand-centric ad campaigns in real-time and the ability to adjust campaigns in real-time to optimize for desired performance.
We believe in-stream video is a highly effective channel for brand advertisers to meet their middle of the funnel objectives by combining the rich "sight, sound and motion" of television, the opt-in engagement of print and the real-time measurement and optimization capabilities of online.
2
Several factors, including the availability of high-speed broadband and mobile network infrastructure, growth of internet-connected devices capable of video consumption, an increase in online video content and a behavioral shift towards online video viewing, are driving robust growth in online video consumption and creating a significant opportunity for in-stream video advertising. As a result, online video advertising is amongst the fastest growing advertising formats in the United States.
Tremor Video Technology and Solutions
VideoHub powers our video advertising solutions to effectively address the challenges faced by brand advertisers to achieve their middle of the funnel objectives.
Through VideoHub we deliver:
- •
- Brand-centric key performance indicators. We have
developed a suite of brand-centric key performance indicators, or KPIs, such as engagement (i.e., the interaction of a viewer with a video ad), brand lift (i.e., a positive shift in
preference towards a brand or branded product driven by exposure to a video ad and brand education), and time spent (i.e., the amount of time a viewer spends with a video ad), which are
tailored to the needs of brand advertisers.
- •
- Brand-centric optimization. Using a proprietary
algorithm, VideoHub builds a decision tree that predicts performance of the video ad campaign for the chosen KPI based on its analysis of a series of attributes, which we call signals. VideoHub
optimizes the campaign for the selected KPI by analyzing the signals of each ad request, such as video player size, geography, publisher, content category, length of video, browser type and viewer
data, and prioritizing the delivery of ads that are more likely to perform.
- •
- In-stream video analysis and
categorization. VideoHub performs an analysis on every video stream and categorizes it among one of approximately 72 video content
categories enabling us to further optimize a video ad campaign.
- •
- Ad performance transparency. VideoHub offers advertisers
transparency into the workings of its decision tree so that they can understand what signals are driving the performance of their video ad campaigns.
- •
- Ad placement transparency. VideoHub tracks the number of
impressions served to a specific publisher site and whether a video ad placement is fully, partially, or not visible to a viewer, which we refer to as viewability. With this functionality, advertisers
know where an ad campaign is running and can validate that their video ads are viewable.
- •
- Cross site and channel measurement. Our proprietary metric, eQ score+, allows advertisers to compare video inventory quality across different publisher sites by measuring attributes such as viewability, the size of the video player and ad completion rate. In addition, VideoHub provides advertisers and agencies access to metrics that measure audience reach and frequency of viewing by a particular audience, similar to what is used in the television industry, enabling them to compare the brand performance of their online and offline video ad campaigns.
The Tremor Video Network offers advertisers access to premium video inventory at scale across multiple internet-connected devices in brand safe environments.
Through the Tremor Video Network we deliver:
- •
- Scale and reach across multiple devices. The Tremor Video Network delivers scale and reach across multiple internet-connected devices, including computers, smartphones, tablets, and connected TVs, enabling our clients to use our solutions to address their online video advertising needs across these devices. We have partnered with more than 500 premium websites and mobile applications, over 200 of which partner with us on an exclusive basis.
3
- •
- Premium video content. We continuously evaluate and refine
our publisher network to ensure that our advertisers have access to high performing content in a brand safe environment.
- •
- Brand safety. Our technology prevents video ads from being
served within content that is identified as objectionable for the brand advertiser, including content that contains accidents, distasteful or obscene language, substance abuse, violence, gambling, sex
or crime.
- •
- In-stream video focus. We specialize in
delivering in-stream video advertisements, which can be served to viewers immediately prior to or during the publisher's content when they are most engaged.
- •
- Advanced ad formats. Our proprietary ad formats give brand
advertisers the ability to create a more engaging experience across multiple internet-connected devices, allowing viewers to explore content within the ad itself and learn more about the
brand.
- •
- Innovative pricing models. We offer innovative brand performance-based pricing for in-stream video advertising, such as CPE and cost per video completion, or CPVC, pricing where we are compensated only if the video is completed.
We also license VideoHub technology, packaged with an intuitive and customizable user interface, to advertisers and their agencies through our VHA solution.
Competitive Strengths
Our key competitive strengths include:
- •
- Differentiated and proprietary technology that analyzes in-stream video content, detects viewer and system
signals and leverages our large repository of stored data to effectively optimize video ad campaigns for brand-centric metrics, while reducing operational complexity and cost.
- •
- Our focus on innovation, which has allowed us to develop advanced ad formats, brand-centric performance-based pricing
models, in-stream video analysis and categorization, and advanced analytical tools.
- •
- Our strong multi-channel capabilities, which allow brand advertisers to deliver their video ad campaigns across multiple
internet-connected devices. This alleviates their need to pursue an ad hoc approach with multiple providers.
- •
- Strategic relationships with brand advertisers and their agencies that we serve through our highly experienced sales force
and creative teams. Our clients include some of the largest brand advertisers in the world, including all of the top 10 automakers and 9 of the top 10 consumer packaged goods companies.
- •
- A publisher network consisting of more than 500 premium websites and mobile applications, over 200 of which partner with
us on an exclusive basis. Under our exclusive arrangements, the publishers' video inventory is only available through our sales force and our exclusive publishers' sales
forces.
- •
- A large repository of data generated from over 20 billion in-stream video ad impressions delivered through the Tremor Video Network. We leverage this data asset and the insights we have gained from the billions of video impressions we have previously delivered to continuously refine our algorithms and improve our optimization capabilities.
4
Growth Strategy
The key elements of our growth strategy are to:
- •
- continue to develop innovative solutions that improve the transparency and enhance the effectiveness of online video
advertising;
- •
- attract new advertisers and agencies and increase our share of advertising budgets from existing advertisers and agencies,
and encourage advertisers to adopt performance-based pricing models;
- •
- increase our penetration in mobile, which includes smartphones and tablets, and connected TV;
- •
- attract new premium publisher partners and enter into new exclusive relationships where appropriate across multiple
devices;
- •
- pursue high margin licensing opportunities;
- •
- extend our technology to brand-focused, programmatic buying for online video advertising;
and
- •
- selectively expand our presence internationally.
Risks Related to Our Business
Our business is subject to a number of risks of which you should be aware before making an investment decision. These risks are discussed more fully in the section of this prospectus captioned "Risk Factors." These risks include, among others:
- •
- The market in which we compete and our business model is continuing to develop, therefore our past operating results may
not be indicative of future performance and our future operating results may fluctuate materially and may increase your investment risk.
- •
- Unfavorable conditions in the global economy or reductions in digital advertising spend could limit our ability to grow
our business and negatively affect our operating results.
- •
- If we fail to adapt and respond effectively to rapidly changing technology and changing client needs, our solutions may
become less competitive or obsolete.
- •
- The market in which we participate is intensely competitive and fragmented, and we may not be able to compete successfully
with our current or future competitors.
- •
- We may not be able to maintain our access to premium advertising inventory, and our growth could be impeded if we fail to
acquire new advertising inventory.
- •
- If we are unable to protect our intellectual property rights or if it is alleged or determined that our solutions or another aspect of our business infringe the intellectual property rights of others, our business could be harmed.
Corporate Information
Tremor Video, Inc. was originally organized as Tremor Media, LLC in November 2005 and converted into a corporation named "Tremor Media, Inc." under the laws of the State of Delaware in September 2006. We changed our name to Tremor Video, Inc. in June 2011.
Our principal executive office is located at 53 West 23rd Street, New York, New York 10010. Our telephone number is (646) 723-5300. Our website address is www.tremorvideo.com. Information contained in, or accessible through, our website does not constitute a part of, and is not incorporated into, this prospectus.
The Tremor Video logo and names Tremor Video, Tremor Video Network, VideoHub, VideoHub for Advertisers, VHA, eQ score+ and other trademarks or service marks of Tremor Video, Inc. appearing in this prospectus are the property of Tremor Video, Inc. and its consolidated subsidiaries. This prospectus contains additional trade names, trademarks and service marks of others, which are the property of their respective owners.
5
The Offering
Common stock offered by Tremor Video |
7,500,000 shares | |
Total common stock to be outstanding after this offering |
48,498,103 shares | |
Over-allotment option |
1,125,000 shares | |
Use of proceeds |
The principal purposes of this offering are to create a public market for our common stock and to facilitate our future access to the public equity markets, as well as to obtain additional capital. We intend to use the net proceeds from this offering for general corporate purposes. In addition, we may use a portion of the proceeds from this offering for acquisitions of complementary businesses, technologies or other assets, although we do not currently have any plans for any acquisitions. See the section of this prospectus titled "Use of Proceeds." | |
Risk factors |
See the section of this prospectus titled "Risk Factors" and the other information included in this prospectus for a discussion of factors you should carefully consider before deciding to invest in our common stock. | |
Proposed New York Stock Exchange symbol |
"TRMR" |
The number of shares of our common stock that will be outstanding after this offering is based on the number of shares outstanding as of March 31, 2013 and excludes:
- •
- 7,002,403 shares of common stock issuable upon the exercise of options outstanding as of March 31, 2013, at a
weighted-average exercise price of $3.39 per share;
- •
- 299,666 shares of common stock issuable upon the exercise of options that were granted after March 31, 2013, at a
weighted-average exercise price of $8.15 per share;
- •
- 1,333,333 shares of our common stock reserved for future issuance pursuant to our 2013 Equity Incentive Plan, or 2013
Plan, which will become effective prior to the completion of this offering and which will contain provisions that automatically increase their share reserves each year;
and
- •
- 142,534 shares of common stock issuable upon the exercise of preferred stock warrants that were outstanding as of March 31, 2013, at a weighted-average exercise price of $3.21 per share.
Unless otherwise indicated, this prospectus reflects and assumes the following:
- •
- a 1-for-1.5 reverse stock split of our common stock effected on June 13, 2013;
- •
- the renaming of all of our Series I common stock as common stock and securities convertible into or exercisable for
Series I common stock as securities convertible into or exercisable for common stock effected on June 13, 2013;
- •
- the reclassification of 1,266,883 outstanding options to acquire shares of Series II common stock into options to
acquire an aggregate of 1,266,883 shares of our common stock effected on June 13, 2013;
- •
- the automatic conversion of 1,047,357 outstanding shares of Series II common stock into an aggregate of 1,047,357 shares of our common stock, which will occur automatically upon the closing of this offering;
6
- •
- the automatic conversion of 32,563,192 outstanding shares of our preferred stock into an aggregate of 33,247,315 shares of
our common stock, which will occur automatically upon the closing of this offering (assuming a conversion ratio equal to approximately 1.1664 common shares for each Series F preferred share
based on an initial public offering price of $12.00 per share, the midpoint of the price range set forth on the cover page of this prospectus);
- •
- the filing and effectiveness of our certificate of incorporation in Delaware and the adoption of our bylaws, each of which
will occur upon the completion of this offering; and
- •
- no exercise by the underwriters' of their over-allotment option.
The number of shares of our common stock to be issued upon the automatic conversion of all outstanding shares of our Series F preferred stock depends in part on the anticipated initial public offering price of our common stock. The terms of our Series F preferred stock provide that the ratio at which each share of such series automatically converts into shares of our common stock in connection with this offering will increase if the anticipated initial public offering price is below $13.997 per share, which would result in additional shares of our common stock being issued upon conversion of our Series F preferred stock immediately prior to the closing of this offering. Based upon the anticipated initial public offering price of $12.00 per share, the midpoint of the price range set forth on the cover page of this prospectus, the outstanding shares of our Series F preferred stock will convert into an aggregate of 4,624,988 shares of our common stock immediately prior to the closing of this offering. For illustrative purposes only, the table below shows the number of shares of our common stock that would be issuable upon conversion of the Series F preferred stock at various initial public offering prices and the resulting total number of outstanding shares of our common stock as a result:
Assumed Public Offering Price ($) |
Approximate Series F Preferred Stock Conversion Ratio (#) |
Shares of Common Stock Issuable upon Conversion of Series F Preferred Stock (#) |
Total Common Stock Outstanding After this Offering (#) |
|||
|---|---|---|---|---|---|---|
| $11.00 | 1.2725 | 5,045,443 | 48,918,558 | |||
| $11.50 | 1.2171 | 4,826,075 | 48,699,190 | |||
| $12.00 | 1.1664 | 4,624,988 | 48,498,103 | |||
| $12.50 | 1.1198 | 4,439,989 | 48,313,104 | |||
| $13.00 | 1.0767 | 4,269,220 | 48,142,335 |
7
Summary Consolidated Financial Data
In the following tables, we provide our summary consolidated financial data. We have derived the summary consolidated statements of operations data for the years ended December 31, 2011 and 2012 and our consolidated balance sheet data as of December 31, 2012 from our audited consolidated financial statements appearing elsewhere in this prospectus, which have been audited by Ernst & Young LLP, our independent registered public accounting firm. We have derived the summary consolidated statements of operations data for the three months ended March 31, 2012 and 2013 and our consolidated balance sheet data as of March 31, 2013 from our unaudited consolidated financial statements appearing elsewhere in this prospectus. We have prepared the unaudited consolidated financial data on the same basis as the audited consolidated financial statements. We have included, in our opinion, all adjustments, consisting only of normal recurring adjustments that we consider necessary for a fair presentation of the financial information set forth in those statements. Our historical results are not necessarily indicative of the results to be expected in the future, and our interim results are not necessarily indicative of the results that should be expected for the full year. When you read this summary consolidated financial data, it is important that you read it together with the historical financial statements and related notes to those statements, as well as the sections of this prospectus titled "Selected Consolidated Financial Data" and "Management's Discussion and Analysis of Financial Condition and Results of Operations."
| |
Year Ended December 31, | Three Months Ended March 31, |
|||||||||||
|---|---|---|---|---|---|---|---|---|---|---|---|---|---|
| |
2011 | 2012 | 2012 | 2013 | |||||||||
| |
(in thousands, except per share and share data) |
||||||||||||
| |
|
|
(unaudited) |
||||||||||
Consolidated Statements of Operations Data: |
|||||||||||||
Revenue |
$ | 90,301 | $ | 105,190 | $ | 17,272 | $ | 24,765 | |||||
Cost of revenue |
58,502 | 61,317 | 11,769 | 13,841 | |||||||||
Gross profit |
31,799 | 43,873 | 5,503 | 10,924 | |||||||||
Operating expenses: |
|||||||||||||
Technology and development(1) |
5,900 | 8,144 | 1,651 | 2,697 | |||||||||
Sales and marketing(1) |
28,829 | 35,042 | 8,522 | 8,843 | |||||||||
General and administrative(1) |
10,880 | 10,824 | 2,795 | 2,920 | |||||||||
Depreciation and amortization |
6,088 | 5,992 | 1,478 | 1,502 | |||||||||
Total operating expense |
51,697 | 60,002 | 14,446 | 15,962 | |||||||||
Loss from operations |
(19,898 | ) | (16,129 | ) | (8,943 | ) | (5,038 | ) | |||||
Interest and other expense: |
|||||||||||||
Interest expense |
(321 | ) | (227 | ) | (75 | ) | (56 | ) | |||||
Other (expense) income |
(583 | ) | (8 | ) | (39 | ) | 5 | ||||||
Total interest and other expense |
(904 | ) | (235 | ) | (114 | ) | (51 | ) | |||||
Loss before income taxes |
(20,802 | ) | (16,364 | ) | (9,057 | ) | (5,089 | ) | |||||
Income tax expense |
(223 | ) | (280 | ) | (70 | ) | (70 | ) | |||||
Net loss |
$ | (21,025 | ) | $ | (16,644 | ) | $ | (9,127 | ) | $ | (5,159 | ) | |
Net loss per share—basic and diluted |
$ | (3.02 | ) | $ | (2.22 | ) | $ | (1.25 | ) | $ | (0.67 | ) | |
Pro forma net loss per share of common stock—basic and diluted(2) |
$ | (0.61 | ) | $ | (0.32 | ) | |||||||
Weighted-average shares of common stock outstanding used in computing net loss per share—basic and diluted |
6,952,952 | 7,499,986 | 7,318,320 | 7,729,218 | |||||||||
Weighted-average shares of common stock outstanding used in computing pro forma net loss per share—basic and diluted(2) |
40,747,301 | 40,976,533 | |||||||||||
Other Financial Data: |
|||||||||||||
In-stream advertising revenue(3) |
75,500 | 99,678 | $ | 15,745 | $ | 23,996 | |||||||
Adjusted EBITDA(4) |
$ | (10,927 | ) | $ | (7,218 | ) | $ | (6,665 | ) | $ | (2,797 | ) | |
8
| |
|
As of March 31, 2013 | ||||||||
|---|---|---|---|---|---|---|---|---|---|---|
| |
As of December 31, 2012 |
Actual | Pro forma as adjusted(5) |
|||||||
| |
(in thousands) |
|||||||||
| |
|
(unaudited) |
||||||||
Consolidated Balance Sheet Data: |
||||||||||
Cash and cash equivalents |
$ | 32,533 | $ | 31,533 | $ | 112,416 | ||||
Working capital |
39,892 | 37,334 | 118,217 | |||||||
Total assets |
129,723 | 122,196 | 203,079 | |||||||
Mandatorily redeemable convertible preferred stock |
162,466 | 162,561 | — | |||||||
Total liabilities |
30,729 | 27,670 | 26,572 | |||||||
Total stockholders' (deficit) equity |
(63,472 | ) | (68,035 | ) | 176,507 | |||||
- (1)
- Includes stock-based compensation expense as follows:
| |
Year Ended December 31, | Three Months Ended March 31, | |||||||||||
|---|---|---|---|---|---|---|---|---|---|---|---|---|---|
| |
2011 | 2012 | 2012 | 2013 | |||||||||
| |
(in thousands) |
||||||||||||
| |
|
|
(unaudited) |
||||||||||
Technology and development |
$ | 507 | $ | 422 | $ | 115 | $ | 115 | |||||
Sales and marketing |
670 | 1,020 | 292 | 279 | |||||||||
General and administrative |
1,706 | 1,477 | 393 | 345 | |||||||||
Total stock-based compensation expense |
$ | 2,883 | $ | 2,919 | $ | 800 | $ | 739 | |||||
- (2)
- Pro
forma basic and diluted net loss per share represents net loss divided by the pro forma weighted-average shares of common stock outstanding. Pro forma
weighted-average shares outstanding reflects the conversion of our preferred stock (using the if-converted method) into common stock as though the conversion had occurred on the first day
of the relevant period (assuming a conversion ratio equal to approximately 1.1664 common shares for each Series F preferred share based on an initial public offering price of $12.00 per share,
the midpoint of the price range set forth on the cover page of this prospectus). Each $1.00 increase in the assumed initial public offering price of $12.00 per share, which is the midpoint of the
range set forth on the cover page of this prospectus, would decrease the pro forma net loss per share by $0.10, assuming that the number of shares offered by us, as set forth on the cover page of this
prospectus, remains the same and after deducting estimated underwriting discounts and commissions. Each $1.00 decrease in the assumed initial public offering price of $12.00 per share, which is the
midpoint of the range set forth on the cover page of this prospectus, would increase the pro forma net loss per share by $0.09, assuming that the number of shares offered by us, as set forth on the
cover page of this prospectus, remains the same and after deducting estimated underwriting discounts and commissions. See the section of this prospectus titled "—Offering" for a
description of the number of shares issuable upon conversion of our Series F preferred stock depending on the price at which our shares are sold to the public.
- (3)
- In-stream
advertising revenue is the revenue we generate solely from the sale of in-stream video ads.
- (4)
- We
define Adjusted EBITDA as net loss plus (minus): other (income) expense, net, interest expense, income tax expense, depreciation and amortization expense
and stock-based compensation expense. We have included Adjusted EBITDA in this prospectus because it is a key measure used by our management and board of directors to understand and evaluate our core
operating performance and trends, to prepare and approve our annual budget and to develop short- and long-term operational plans. In particular, we believe that the exclusion of the
expenses eliminated in calculating Adjusted EBITDA can provide a useful measure for period-to-period comparisons of our core business. Accordingly, we believe that Adjusted
EBITDA provides useful information to investors and others in understanding and evaluating our operating results in the same manner as our management and board of directors.
Adjusted EBITDA is a non-GAAP financial measure. Our use of Adjusted EBITDA has limitations as an analytical tool, and you should not consider it in isolation or as a substitute for analysis of our financial results as reported under GAAP. Some of these limitations are: (a) although depreciation and amortization are non-cash charges, the assets being depreciated and amortized may have to be replaced in the future, and Adjusted EBITDA does not reflect cash and capital expenditure requirements for such replacements or for new capital expenditure requirements; (b) Adjusted EBITDA does not reflect changes in, or cash requirements for, our working capital needs; (c) Adjusted EBITDA does not reflect the potentially dilutive impact of equity-based compensation; (d) Adjusted EBITDA does not reflect tax payments that may
9
represent a reduction in cash available to us; and (e) other companies, including companies in our industry, may calculate Adjusted EBITDA or similarly titled measures differently, which reduces its usefulness as a comparative measure.
Because of these and other limitations, you should consider Adjusted EBITDA alongside our other GAAP-based financial performance measures, net loss and our other GAAP financial results. The following table presents a reconciliation of Adjusted EBITDA to net loss, the most directly comparable GAAP measure, for each of the periods indicated:
| |
Year Ended December 31, | Three Months Ended March 31, | |||||||||||
|---|---|---|---|---|---|---|---|---|---|---|---|---|---|
| |
2011 | 2012 | 2012 | 2013 | |||||||||
| |
(in thousands) |
||||||||||||
Net loss |
$ | (21,025 | ) | $ | (16,644 | ) | $ | (9,127 | ) | $ | (5,159 | ) | |
Adjustments: |
|||||||||||||
Other expense (income), net |
583 | 8 | 39 | (5 | ) | ||||||||
Interest expense |
321 | 227 | 75 | 56 | |||||||||
Income tax expense |
223 | 280 | 70 | 70 | |||||||||
Depreciation and amortization expense |
6,088 | 5,992 | 1,478 | 1,502 | |||||||||
Stock-based compensation expense |
2,883 | 2,919 | 800 | 739 | |||||||||
Total net adjustments |
10,098 | 9,426 | 2,462 | 2,362 | |||||||||
Adjusted EBITDA |
$ | (10,927 | ) | $ | (7,218 | ) | $ | (6,665 | ) | $ | (2,797 | ) | |
- (5)
- Reflects
on a pro forma basis the conversion described in footnote (2) above and, on an as adjusted basis, our sale of 7,500,000 shares of
common stock in this offering at an assumed initial public offering price of $12.00 per share, which is the midpoint of the range set forth on the cover page of this prospectus, after deducting
estimated underwriting discounts and commissions and estimated offering expenses payable by us. The pro forma as adjusted information presented in the summary balance sheet data is illustrative only
and will change based on the actual initial public offering price and other terms of this offering determined at pricing.
The pro forma as adjusted information presented in the summary balance sheet data is illustrative only and will change based on the actual initial public offering price and other terms of this offering determined at pricing. Each $1.00 increase or decrease in the assumed initial public offering price of $12.00 per share, which is the midpoint of the range set forth on the cover page of this prospectus, would increase or decrease each of cash and cash equivalents, working capital, total assets and total stockholders' (deficit) equity on a pro forma as adjusted basis by approximately $7.0 million, assuming that the number of shares offered by us, as set forth on the cover page of this prospectus, remains the same and after deducting the estimated underwriting discounts and commissions. We may also increase or decrease the number of shares we are offering. Each increase or decrease of 1,000,000 shares in the number of shares offered by us would increase or decrease each of cash and cash equivalents, working capital, total assets and total stockholders' (deficit) equity by approximately $11.2 million, assuming that the assumed initial price to public remains the same, and after deducting the estimated underwriting discounts and commissions.
10
Investing in our common stock involves a high degree of risk. You should consider carefully the risks and uncertainties described below, together with all of the other information included in this prospectus, including our consolidated financial statements and the related notes appearing at the end of this prospectus, before deciding to invest in our common stock. If any of the following risks actually occurs, our business, financial condition, results of operations and future growth prospects could be harmed. In that case, the market price of our common stock could decline, and you may lose all or part of your investment.
Risks Relating to Our Business and Industry
Because our business model is continuing to develop, our past operating results may not be indicative of future performance, and our future operating results may fluctuate materially and may increase your investment risk.
We were formed in November 2005 and have a limited operating history. In 2011, we made the strategic decision to focus our media business on in-stream video advertising and to move away from in-banner video advertising, which may not prove to be a successful strategy. As a result of our focus on delivering in-stream video advertising, we have experienced a significant reduction in our in-banner revenue. Substantially all of our revenue in 2012 was generated by the sales of in-stream video ads through the Tremor Video Network. Additionally, in 2012, we began licensing our VHA solution to brand advertisers and their agencies. Although we have experienced significant growth in revenue generation in recent periods, our relatively short operating history and developing business model make it difficult to assess our future prospects. The success of our business faces a number of challenges, including:
- •
- continuing to innovate and improve the technologies that enable us to provide our solutions;
- •
- expanding our existing relationships, and developing new relationships with, brand advertisers and premium publishers;
- •
- increasing the level of spending by our brand advertisers;
- •
- the growth, evolution and rate of adoption of industry standards;
- •
- offering competitive pricing to brand advertisers;
- •
- offering competitive rates to premium publishers;
- •
- delivering online video advertising campaign performance results that are superior to those that brand advertisers receive
through the use of competing providers or technologies;
- •
- competing effectively against traditional and online media companies to increase our share of brand advertising spend;
- •
- ensuring that our clients' video ads are shown in brand-safe environments;
- •
- maintaining and increasing the value of our brand and goodwill with brand advertisers and premium publishers;
- •
- effectively controlling our costs as we grow our business;
- •
- responding to evolving government regulations relating to the internet, telecommunications, privacy, marketing and
advertising aspects of our business;
- •
- developing market acceptance for our VHA solution; and
- •
- identifying, attracting, retaining and motivating qualified personnel.
Our ability to meet these challenges will help determine whether we can successfully leverage our business model to achieve profitability and growth in the future. We cannot assure our ability to achieve this goal, to generate consistent and improving operating results, or even to maintain the same
11
level of success that we have had to date. If we fail to meet these challenges, our operating results may fluctuate materially and may increase your investment risk.
We have incurred significant net losses since inception, and we expect our operating expenses to increase significantly in the foreseeable future. Accordingly, we may never achieve or sustain profitability.
We have incurred losses since we were formed and expect to incur losses in the future. We incurred net losses of $21.0 million, $16.6 million and $5.2 million in 2011, 2012 and the three months ended March 31, 2013, respectively, and we had an accumulated deficit of $86.7 million as of March 31, 2013. We do not know if we will be able to achieve profitability or maintain profitability on a continued basis. Although our revenue has increased substantially in recent periods, we may not be able to maintain this rate of revenue growth. We anticipate that our operating expenses will continue to increase as we scale our business and expand our operations. In particular, we plan to continue to invest in our technology and development efforts and sales and marketing efforts and further increase the number of our licensing solution focused sales and marketing professionals. We also expect our general and administrative expenses to increase in absolute dollars as a result of our preparation to become and operate as a public company. Our ability to achieve or sustain profitability is based on numerous factors, many of which are beyond our control. We may never be able to generate sufficient revenue to achieve or sustain profitability.
Unfavorable conditions in the global economy or the vertical markets we serve could limit our ability to grow our business and negatively affect our operating results.
General worldwide economic conditions have experienced significant instability in recent years. These conditions make it extremely difficult for brand advertisers and us to accurately forecast and plan future business activities, and could cause our brand advertisers to reduce or delay their advertising spending. Historically, economic downturns have resulted in overall reductions in advertising spending. For example, our operating results for the second and third quarters of 2011 were adversely affected by a reduction in video advertising spending because of uncertainty and volatility caused by the U.S. budget and European financial crises. Additionally, our operating results for the first quarter of 2012 were adversely affected by the challenging global economic outlook. If macroeconomic conditions deteriorate, advertisers may curtail or freeze spending on advertising in general and for solutions such as ours specifically. Furthermore, we generally sell through insertion orders with ad agencies. These insertion orders generally do not include long-term obligations and are cancelable upon short notice and without penalty in accordance with standard terms and conditions for the purchase of internet advertising published by the Interactive Advertising Bureau. Any reduction in advertising spending could limit our ability to grow our business and negatively affect our operating results.
In addition, our business may be materially and adversely affected by weak economic conditions in the specific vertical markets that we serve. In 2012, we derived the majority of our revenue from advertisers in the consumer packaged goods, entertainment and automotive industries.
We cannot predict the timing, strength or duration of any economic slowdown or recovery. In addition, even if the overall economy improves, we cannot assure you that the market for online video advertising solutions will experience growth or that we will experience growth.
If we fail to adapt and respond effectively to rapidly changing technology and client needs, our solutions may become less competitive or obsolete.
Our future success will depend on our ability to adapt and innovate. To attract new brand advertisers and increase spend by existing brand advertisers, we will need to expand and enhance our solutions to meet client needs, add functionality and address technological advancements. If we fail to develop new solutions that address brand advertiser needs, or enhance and improve our solutions in a timely manner or conform to industry standards, we may not be able to achieve or maintain adequate market acceptance of our solutions, and our solutions may become less competitive or obsolete.
12
Our ability to grow is also subject to the risk of future disruptive technologies. If new technologies emerge that are able to deliver video advertising solutions at lower prices or more efficiently or effectively than our solutions, such technologies could adversely impact our ability to compete. For example, if we fail to achieve success with a programmatic media buying solution or if our mobile solution, which we launched in the first quarter of 2011, is not considered effective, our business and growth prospects could be harmed.
The market in which we participate is intensely competitive and fragmented, and we may not be able to compete successfully with our current or future competitors.
The online video advertising market is highly competitive. We compete with large online video publishers such as Hulu, LLC and YouTube, LLC, which is owned by Google Inc., as well as advertising networks and exchanges, such as BrightRoll, Inc. and YuMe, Inc. Our VHA solution competes with ad tech infrastructure companies, such as Adap.tv, Inc. and Videology, Inc. They, or other companies that offer competing advertising solutions, may establish or strengthen cooperative relationships with brand advertisers, ad agencies, agency holding companies or publishers, thereby limiting our ability to promote our solutions and generate revenue. Competitive pressures could require us to reduce the prices we charge advertisers or increase the prices we pay to publishers. For example, the online video advertising industry has recently experienced and may continue to experience price erosion due to the influx of online video ad inventory as well as the automation of ad buying.
In the traditional media space, our primary competitors for middle of the funnel advertising spend are mainly cable TV broadcasters, radio broadcasters and print media publishers. Across the digital media landscape, we compete for advertising spend with large entities such as Facebook, Inc., Microsoft Corporation and Yahoo! Inc. as well as Adobe Systems Incorporated and Google Inc. that offer video advertising services as part of a larger solution for digital media buying. Many of these competitors and potential competitors have significant client relationships, much larger financial resources and longer operating histories than we have and may be less severely affected by changes in consumer preferences, regulations or other developments that may impact the online video advertising industry as a whole.
Our business may suffer to the extent that our advertisers and publishers purchase and sell online video advertising directly from each other or through other companies that are able to become intermediaries between advertisers and publishers. New technologies and methods of buying advertising present a dynamic competitive challenge, as market participants offer multiple new products and services, such as analytics, programmatic media buying and exchanges, aimed at capturing advertising spend. If the market shifts towards such new technologies and we are unable to either provide such solutions in a compelling manner or otherwise compete with such shift in ad spending, we may incur increased pricing pressure, reduced profit margins, increased sales and marketing expenses or the loss of market share.
We believe we compete for brand advertiser spend primarily on the basis of proven technology and optimization capabilities, pricing, quality and scale of online video inventory, depth and breadth of relationships with brand advertisers and premium publishers, multi-channel capabilities, brand-centric measurement, ability to ensure brand safety and transparency into ad performance and placement. Our competitors or potential competitors may adopt certain aspects of our business model, which could reduce our ability to differentiate our solutions. As market dynamics change, or as new and existing competitors introduce more competitive pricing or new or disruptive technologies, we may be unable to maintain our brand advertisers' existing spend with us, renew our agreements with existing exclusive premium publishers, or attract new advertisers or publishers at the same price or based on the same pricing model as previously used. As a result, we may be required to change our pricing model and incur additional expenses in response to competitive pressures, which could harm our revenue, profitability and operating results. For all of these reasons, we may not be able to compete successfully against our current and future competitors.
13
We operate in a new and rapidly evolving industry. If the online video advertising industry does not develop or develops more slowly than we expect, our operating results and growth prospects could be harmed.
Online video advertising is an emerging industry, and future demand and market acceptance for online video advertising is uncertain. Many brand advertisers have limited experience with online brand advertising, generally, and online video advertising specifically, and may continue to devote more significant portions of their advertising budgets to traditional, offline-based advertising, such as television and print, and may not devote significant portions of their advertising budgets to online video advertising. Additionally, we compete for online advertising spend with other products and technologies such as search, display and in-banner video as well as advertising networks and exchanges.
We believe that the continued growth and acceptance of online video ad spending by brand advertisers generally will depend on the perceived effectiveness and the acceptance of our solutions, which are still emerging and evolving, and the continued growth in commercial use of online media, as well as other factors. Additionally, brand advertisers may find online video advertising to be less effective than traditional offline channels, such as television, newspapers, radio and billboards, or other online methods for promoting their products and services, and they may reduce their spending on online video advertising from current levels as a result. Accordingly, if the market for online video advertising deteriorates, or develops more slowly than we expect, our operating results and growth prospects could be harmed.
We generate substantially all of our revenue from the Tremor Video Network.
We generate substantially all of our revenue from the Tremor Video Network. Due to the concentration in our revenue, we are potentially subject to greater risks than more diversified companies. While we began licensing VHA in 2012, there can be no assurance that a market will develop for this solution or that licensing revenue will increase. Additionally, we may develop other solutions from time to time, such as a publisher-focused solution and a programmatic buying solution, but there can be no assurance that we will successfully develop these solutions or that a market will develop for them. As a result, we expect to be substantially dependent upon revenue generated from the Tremor Video Network for the foreseeable future. Due to our limited historical experience, we may not be able to accurately predict future usage trends.
We may be unable to retain key advertisers, attract new advertisers or replace departing advertisers with advertisers that can provide comparable revenue to us.
Our success requires us to maintain and expand our relationships with our existing brand advertisers, including the ad agencies that represent them, and to develop new relationships with other brand advertisers and ad agencies. Generally, we sell through insertion orders with ad agencies. These insertion orders generally do not include long-term obligations requiring them to purchase from us and are cancelable upon short notice and without penalty in accordance with standard terms and conditions for the purchase of internet advertising published by the Interactive Advertising Bureau. As a result, we have limited visibility as to our future advertising revenue streams from our advertisers.
Our advertisers' usage may decline or fluctuate as a result of a number of factors, including, but not limited to:
- •
- the performance of their video ad campaigns and their perception of the efficacy and efficiency of their advertising spend
through the Tremor Video Network;
- •
- changes in the economic prospects of advertisers or the economy generally, which could alter current or prospective
advertisers' spending priorities;
- •
- our access to premium inventory;
- •
- our ability to deliver video ad campaigns in full, i.e., our ability to serve each requested impression;
14
- •
- their satisfaction with our solutions and our client support;
- •
- the ability of our optimization algorithms underlying our solutions to deliver better rates of return on video ad spend
dollars than competing solutions;
- •
- seasonal patterns in advertisers' spending, which tend to be discretionary;
- •
- the pricing of our or competing solutions; and
- •
- reductions in spending levels or changes in brand advertisers' strategies regarding video advertising spending.
If a major advertiser decides to materially reduce its advertising spend through the Tremor Video Network, it could do so on short or no notice. We cannot assure that our advertisers will continue to use the Tremor Video Network or that we will be able to replace in a timely or effective manner departing advertisers with new advertisers from whom we generate comparable revenue.
If an advertiser fails to pay for ad requests that we have fulfilled, we would still be required to pay the publisher for its ad inventory.
We purchase video ad inventory from our publishers to connect our advertiser clients with engaged audiences through the Tremor Video Network. If advertisers fail to pay for ad requests we have filled, we would still be required to pay the publisher for its ad inventory. Any significant failure by advertisers to pay us could adversely affect our operating results.
We are highly dependent on advertising agencies and their holding companies as intermediaries, and this may adversely affect our ability to attract and retain business.
Our business focuses on brand advertisers that rely upon advertising agencies in planning and purchasing advertising. Although we maintain relationships with the owners of brands, we do not contract with them directly. Instead, we sell to advertising agencies that utilize our solutions on behalf of their clients. Each advertising agency allocates advertising spend from brand advertisers across numerous channels. We do not have exclusive relationships with advertising agencies and we depend on agencies to work with us as they embark on marketing campaigns for brands.
If we fail to maintain satisfactory relationships with an advertising agency, we risk losing business from the brand advertisers represented by that agency. If the advertising agency is owned by a holding company, this risk is magnified because we also risk losing business from the other agencies owned by such holding company and the brand advertisers those agencies represent. Because advertising agencies act as intermediaries for multiple brand advertisers, our client base is more concentrated than might be reflected by the number of brand advertisers that run campaigns through the Tremor Video Network.
Further, our revenue could be adversely impacted by industry changes relating to the use of advertising agencies. For example, if brand advertisers seek to bring their marketing campaigns in-house rather than using an advertising agency, we would need to enter agreements with the brand advertisers directly, which we might not be able to do and which could increase our sales and marketing expense. Moreover, as a result of dealing primarily with advertising agencies, advertisers may attribute the value we provide to the advertising agency rather than to us, further limiting our ability to develop long term relationships directly with brand advertisers. Brand advertisers may move from one advertising agency to another, and, accordingly, even if we have a positive relationship with an advertising agency, we may lose the underlying business when an advertiser switches to a new agency. The presence of advertising agencies as intermediaries between us and the advertisers thus creates a challenge to building our own brand awareness and affinity with the advertisers that are the ultimate source of our revenue.
In addition, advertising agencies that are our clients also offer or may offer some of the components of our solutions, including selling ad inventory through their own trading desks. As such, these advertising agencies are, or may become, our competitors. If they further develop their
15
capabilities, they may be more likely to offer their own solutions to advertisers, and our ability to compete effectively could be compromised.
If brand advertisers do not perceive meaningful benefits from performance-based advertising solutions, then our revenue and gross margins may be adversely affected.
The Tremor Video Network enables brand advertisers to only pay for advertising that "performed," i.e., on a cost per engagement, or CPE, basis, or cost per video completion, or CPVC, basis. The market for performance-based advertising solutions is evolving and has not yet been widely adopted by brand advertisers. A significant and growing portion of our revenue is generated from ad campaigns that are priced on a performance basis. Under performance-based pricing models, advertisers only pay us if the applicable engagement metrics are satisfied. For example, under our CPE pricing model, we bill the advertiser only for instances in which the viewer actively engages with the video ad, such as by interacting with the elements of the video ad through clicks or screen touches or by rolling over certain elements of the video ad for at least three seconds. We believe performance-based pricing generally provides greater margins than CPM priced campaigns, because we are often able to serve our advertisers' engagement goals with a lower number of purchased impressions. Historically, a larger portion of brand advertisers' online advertising budgets have been based on the number of impressions served, such as cost per thousand impressions, or CPM, without regard to performance, and such advertisers may be reluctant or slow to adopt performance-based pricing solutions. We are subject to the risk that we may purchase ad inventory that we are unable to monetize if the purchased inventory does not perform for our advertisers. If brand advertisers do not perceive meaningful benefits from our performance-based advertising solutions, our revenue and gross margins may be adversely affected.
If we fail to maintain or increase our access to premium advertising inventory, our operating results may be harmed.
Our success requires us to maintain and expand our access to premium video advertising inventory. We do not own or control the video ad inventory upon which our business depends. We purchase this ad inventory from our publishers generally either in exclusive one year agreements or by spot purchases. These publishers are generally not required to provide us with a specified level of inventory, and we cannot assure you that our exclusive publishers will renew their agreements with us or continue to make their ad inventory available to us. In addition, we review our publishers and have removed, and may in the future remove, publishers from our network based on the quality of the inventory, viewer experience and our confidence in the integrity of their ad requests. As a result, we may have limited visibility as to our future access to inventory from publishers. If a publisher decides not to make video ad inventory available to us or if we decide to remove a publisher from our network, we may not be able to replace this ad inventory with comparable ad inventory quickly enough to fulfill our brand advertisers' requests.
Publishers have a variety of channels in which to sell their video ad inventory, including direct sales forces and ad exchanges. Under our exclusive arrangements, a publisher's direct sales force may sell their own video ad inventory, and many of our exclusive publishers maintain significant direct sales forces. Furthermore, the scope of exclusivity with respect to the third party monetization of video ad inventory varies with publishers, with some publishers imposing geographical, device, or inventory type limitations. Any increase in a publisher's direct sales efforts may negatively impact our access to that publisher's inventory. Additionally, if publishers sell their non-exclusive inventory through ad exchanges, or if our competitors offer higher prices for their ad inventory, our ability to obtain ad inventory on a cost-effective basis may be affected.
If we are unable to maintain or increase our access to premium video ad inventory, our operating results may be harmed.
16
We may not be able to adequately satisfy the supply from our exclusive publishers with demand from our advertisers.
Substantially all of our exclusive publisher agreements obligate us to fill a specified percentage of the video ad inventory that they make available to us, which we refer to as an ad request. In some cases, there is no cap on our fill obligation. If we are unable to deliver ad campaigns to this inventory, we will bear the loss on those unfilled ad requests. This risk can be magnified during certain times of the year when we see increased ad requests from our exclusive publishers coupled with reduced purchase demand from our advertisers.
Additionally, in order to satisfy our required fill obligations, we may have to serve less optimized inventory to our advertisers. This may negatively impact the performance of an ad campaign, which could particularly impact us with respect to our campaigns that are priced on a performance basis. As a result, our margins may be negatively impacted even if we are able to fully satisfy the fill obligation.
Any significant failure to adequately match demand from our advertisers with supply from our publishers would harm our operating results.
If we fail to detect fraud or other actions that impact video ad campaign performance, we could lose the confidence of advertisers or agencies, which would cause our business to suffer.
Our business relies on effectively and efficiently delivering video ad campaigns for brand advertisers. We have in the past, and may in the future, be subject to fraudulent and malicious activities. An example of such activities would be the use of bots, non-human traffic delivered by machines that are designed to simulate human users and artificially inflate user traffic on websites. These activities could overstate the performance of any given video ad campaign and could harm our reputation. It may be difficult to detect fraudulent or malicious activity because we do not own content and rely in part on our publisher partners for controls with respect to such activity. While we assess the campaign performance on our publishers' websites, such assessments may not detect or prevent fraudulent or malicious activity. Further, we may need to improve over time our processes for assessing the quality of publisher ad requests. If fraudulent or other malicious activity is perpetrated by others, and we fail to detect or prevent it, the affected advertisers may experience or perceive a reduced return on their investment and our reputation may be harmed. High levels of fraudulent or malicious activity could lead to dissatisfaction with our solutions, refusals to pay, refund demands or withdrawal of future business. If we fail to detect fraud or other actions that impact the performance of our video ad campaigns, we could lose the confidence of our advertisers or agencies, which could cause our business to suffer.
We only recently began licensing VHA and if a market for this solution fails to develop, our growth prospects could be adversely affected.
We only recently began licensing VHA to advertisers and their agencies and are developing a licensed solution for publishers. Licensing these solutions is a key element of our growth strategy. Demand for these solutions by advertisers, agencies or publishers may not develop or may develop more slowly than we expect. Third parties from which we license certain data utilized by these solutions may terminate such licenses or be unwilling to renew such licenses on terms that are satisfactory to us. Additionally, our ability to measure campaigns running through publishers that do not provide inventory to the Tremor Video Network depends on such publishers accepting our tags on their sites. If a publisher does not accept our tags, VHA will not be able to track video ad campaign performance across these sites. This inability could potentially diminish the value of VHA for non-Tremor Video Network video ad campaigns. Additionally, our competitors may develop competitive solutions that gain greater market acceptance than our licensed solutions. If the market for these solutions fails to develop, our growth prospects could be adversely affected.
17
Our sales efforts with advertisers, agencies and publishers require significant time and expense.
Attracting new brand advertisers, ad agencies and premium publishers requires significant time and expense, and we may not be successful in establishing new relationships or in maintaining or advancing our current relationships. For example, certain brand advertisers may have no or limited experience with online video advertising or may be unfamiliar with our solutions. In addition, brand advertisers' purchasing decisions typically are made and coordinated by their advertising agencies and require input from multiple constituencies. The process of selling our solutions to brand advertisers and ad agencies can therefore be time-consuming. With respect to our publishers, we often seek to establish exclusive long-term relationships to ensure access to premium content for our brand advertisers. As a result, we invest significant time in cultivating relationships with our publishers to ensure they understand the potential benefits of monetization of their inventory with us rather than with third-party media networks and exchanges. The relationship building process can take many months and may not result in us winning an opportunity with any given advertiser, agency or publisher.
Our technology and online video brand advertising are relatively new and often require us to spend substantial time and effort educating potential advertisers and publishers about our solutions, including providing demonstrations and comparisons against other available services. This process can be costly and time-consuming. If we are not successful in streamlining our sales processes with advertisers and publishers, our ability to grow our business may be adversely affected.
We experience quarterly fluctuations in our operating results due to a number of factors which make our future results difficult to predict and could cause our operating results to fall below expectations.
Our operating results have historically fluctuated and our future operating results may vary significantly from quarter to quarter due to a variety of factors, many of which are beyond our control. Period-to-period comparisons of our operating results should not be relied upon as an indication of our future performance. Given our relatively short operating history and the rapidly evolving online video advertising industry, our historical operating results may not be useful in predicting our future operating results.
Factors that may affect our quarterly operating results include the following:
- •
- changes in the economic prospects of advertisers, the industries we primarily serve, or the economy generally, which could
alter current or prospective advertisers' spending priorities, or could increase the time it takes us to close sales with advertisers;
- •
- the addition of new advertisers or the loss of existing advertisers;
- •
- changes in demand for our solutions;
- •
- changes in the amount, price and quality of available video advertising inventory from publishers;
- •
- the timing and amount of sales and marketing expenses incurred to attract new advertisers and publishers;
- •
- the cancellation or delay of campaigns by brand advertisers;
- •
- changes in our pricing policies, the pricing policies of our competitors or the pricing of online video advertising
generally;
- •
- timing differences at the end of each quarter between our payments to publishers for advertising inventory and our
collection of advertising revenue related to that inventory; and
- •
- costs related to acquisitions of other businesses.
Our operating results may fall below the expectations of market analysts and investors in some future periods. If this happens, even just temporarily, the market price of our common stock may fall.
18
Our revenue tends to be seasonal in nature.
Our revenue tends to be seasonal in nature, with the third and fourth quarters of each calendar year historically representing the largest percentage of our total revenue for the year and the first quarter of each calendar year historically representing the lowest percentage of our total revenue for the year. Many of the brand advertisers in the verticals we serve spend significant portions of their advertising budgets during the third quarter, in connection with summer, back to school and entertainment events, and in the fourth quarter, in connection with the holiday season. During the first quarter, brand advertisers generally devote less of their budgets to ad spending, and as a result, our exclusive publishers generally make a larger proportion of their ad inventory available to us. This combination generally results in lower revenue and gross margins for us during the first quarter of each calendar year. Our operating cash flows could also fluctuate materially from period to period as a result of these seasonal fluctuations.
We have made and may make additional acquisitions that could entail significant execution, integration and operational risks.
As part of our business strategy, we have in the past acquired, and may in the future acquire, companies, technologies and solutions that we believe complement our business. Acquisitions involve numerous risks, any of which could harm our business, including:
- •
- difficulties in integrating the technologies, solutions, operations, existing contracts and personnel of a target company;
- •
- difficulties in supporting and transitioning clients, if any, of a target company;
- •
- diversion of financial and management resources from existing operations or alternative acquisition opportunities;
- •
- failure to realize the anticipated benefits or synergies of a transaction;
- •
- failure to identify all of the problems, liabilities or other shortcomings or challenges of an acquired company,
technology, or solution, including issues related to intellectual property, solution quality or architecture, regulatory compliance practices, revenue recognition or other accounting practices or
employee or customer issues;
- •
- risks of entering new markets in which we have limited or no experience;
- •
- potential loss of key employees, brand advertisers and publishers from either our current business or a target company's
business;
- •
- inability to generate sufficient revenue to offset acquisition costs;
and
- •
- possible write-offs or impairment charges relating to acquired businesses.
In addition, we may incur indebtedness to complete an acquisition, which may impose operational limitations, or issue equity securities, which would dilute our stockholders' ownership. We may also unknowingly inherit liabilities from acquired businesses or assets that arise after the acquisition and are not adequately covered by indemnities. Additionally, acquisitions also frequently result in the recording of goodwill and other intangible assets which are subject to potential impairments in the future that could harm our financial results.
Foreign acquisitions involve unique risks in addition to those mentioned above, including those related to integration of operations across different cultures and languages, currency risks and the particular economic political and regulatory risks associated with specific countries. The failure to successfully evaluate and execute acquisitions or investments or otherwise adequately address the risks described above could materially harm our business and financial results.
19
We have limited international operations and any future international expansion may expose us to several risks, such as difficulty adapting our solutions for international markets.
We have limited experience in marketing, selling and supporting our solutions abroad. During 2011 and 2012, more than 95% of our revenue was generated in the United States. While we have offices outside of North America in Singapore and the United Kingdom, substantially all of our operations are located in the United States.
Any future international expansion of our business will involve a variety of risks, including:
- •
- localization of our solutions, including translation into foreign languages and adaptation for local practices;
- •
- unexpected changes in regulatory requirements, taxes, trade laws, tariffs, export quotas, custom duties or other trade
restrictions;
- •
- differing labor regulations where labor laws may be more advantageous to employees as compared to the United States;
- •
- more stringent regulations relating to data security and the unauthorized use of, or access to, commercial and personal
information, particularly in the European Union;
- •
- reluctance to allow personally identifiable data related to non-U.S. citizens to be stored in databases within
the United States, due to concerns over the U.S. government's right to access information in these databases or other concerns;
- •
- changes in a specific country's or region's political or economic conditions;
- •
- challenges inherent in efficiently managing an increased number of employees over large geographic distances, including
the need to implement appropriate systems, policies, benefits and compliance programs;
- •
- risks resulting from changes in currency exchange rates;
- •
- limitations on our ability to reinvest earnings from operations in one country to fund the capital needs of our operations
in other countries;
- •
- different or lesser intellectual property protection; and
- •
- exposure to liabilities under anti-corruption and anti-money laundering laws, including the U.S. Foreign Corrupt Practices Act and similar laws and regulations in other jurisdictions.
Operating internationally requires significant management attention and financial resources. We cannot be certain that the investment and additional resources required in establishing and expanding our international operations will produce desired levels of revenue or profitability. If we invest substantial time and resources to establish and expand our international operations and are unable to do so successfully and in a timely manner, our business and operating results will suffer.
We have not engaged in currency hedging activities to limit risk of exchange rate fluctuations. Changes in exchange rates affect our costs and earnings, and may also affect the book value of our assets located outside the United States and the amount of our stockholders' equity.
Our ability to raise capital in the future may be limited, and our failure to raise capital when needed could prevent us from growing.
Our business and operations may consume resources faster than we anticipate. In the future, we may need to raise additional funds to expand our marketing and sales and technology development efforts or to make acquisitions. Additional financing may not be available on favorable terms, if at all. If adequate funds are not available on acceptable terms, we may be unable to fund the expansion of
20
our marketing and sales and technology development efforts or take advantage of acquisition or other opportunities, which could harm our business and results of operations. Furthermore, if we issue additional equity securities, stockholders will experience dilution, and the new equity securities could have rights senior to those of our common stock. Because our decision to issue securities in any future offering will depend on market conditions and other factors beyond our control, we cannot predict or estimate the amount, timing or nature of our future offerings. As a result, our stockholders bear the risk of our future securities offerings reducing the market price of our common stock and diluting their interest.
Provisions of our debt instruments may restrict our ability to pursue our business strategies.
Our credit facility requires us, and any debt instruments we may enter into in the future may require us, to comply with various covenants that limit our ability to, among other things:
- •
- dispose of assets;
- •
- complete mergers or acquisitions;
- •
- incur indebtedness;
- •
- encumber assets;
- •
- pay dividends or make other distributions to holders of our capital stock;
- •
- make specified investments;
- •
- change certain key management personnel; and
- •
- engage in transactions with our affiliates.
These restrictions could inhibit our ability to pursue our business strategies. We are also subject to a financial covenant with respect to minimum monthly working capital levels. If we default under our credit facility, and such event of default is not cured or waived, the lender could terminate commitments to lend and cause all amounts outstanding with respect to the debt to be due and payable immediately, which in turn could result in cross defaults under other debt instruments.
Our assets and cash flow may not be sufficient to fully repay borrowings under all of our outstanding debt instruments if some or all of these instruments are accelerated upon a default. We may incur additional indebtedness in the future. The debt instruments governing such indebtedness could contain provisions that are as, or more, restrictive than our existing debt instruments. If we are unable to repay, refinance or restructure our indebtedness when payment is due, the lenders could proceed against the collateral granted to them to secure such indebtedness or force us into bankruptcy or liquidation.
We have experienced rapid growth in recent periods. If we fail to manage our growth effectively, our financial performance may suffer.
We have expanded our revenue, solutions, scale, employee headcount and overall business operations in recent periods. Our expansion has placed, and our expected future growth will continue to place, a significant strain on our managerial, operational, product development, sales and marketing, administrative, financial and other resources. For instance, we expect to be substantially dependent on our direct sales force to obtain new clients, and we plan to continue to expand our direct sales force both domestically and internationally. Newly hired sales personnel may not become productive as quickly as we would like, or at all, thus representing increased operating costs and lost opportunities which in turn would adversely affect our business, financial condition and operating results.
21
If we do not manage our growth effectively, successfully forecast demand for our solutions or manage our expected expenses accordingly, our operating results will be harmed. If we fail to manage our growth effectively, our financial performance may suffer.
We depend on key personnel to operate our business, and if we are unable to retain, attract and integrate qualified personnel, our ability to develop and successfully grow our business could be harmed.
In addition to the continued services of William Day, our President and Chief Executive Officer, and Steven Lee, a Senior Vice President and our Chief Technology Officer, we believe that our future success is highly dependent on the contributions of our senior management, as well as our ability to attract and retain highly skilled and experienced technical and other personnel in the United States and abroad. We do not have key person insurance on any of our executives. All of our employees, including our senior management, are free to terminate their employment relationship with us at any time, and their knowledge of our business, technology and industry may be difficult to replace. In addition, we believe that our senior management has developed highly successful and effective working relationships. If one or more of these individuals leave, we may not be able to fully integrate new executives or replicate the current dynamic and working relationships that have developed among our executive officers and other key personnel, and our operations could suffer. Qualified technical personnel are in high demand, particularly in the digital media industry, and we may incur significant costs to attract them. Many of the companies with which we compete for experienced personnel also have greater resources than us. Additionally, volatility or lack of performance in our stock price may also affect our ability to attract employees and retain our key employees. If we are unable to attract and retain our senior management and key employees, our ability to develop and successfully grow our business could be harmed.
Defects or errors in our solutions could harm our reputation, result in significant costs to us, impair our advertisers' ability to deliver effective advertising campaigns and impair our ability to meet our fill obligations with publishers.
The technology underlying our solutions, including our proprietary technology and technology provided by third-parties, may contain material defects or errors that can adversely affect our ability to operate our business and cause significant harm to our reputation. This risk is compounded by the complexity of the technology underlying our solutions and the large amounts of data we utilize. Errors, defects, disruptions in service or other performance problems in our solutions could result in the incomplete or inaccurate delivery of an ad campaign, including serving an ad campaign in an incomplete or inaccurate manner, in an incorrect geographical location or in an environment that is detrimental to the advertiser's brand health. Any such failure, malfunction, or disruption in service could result in damage to our reputation, our advertising clients withholding payment to us, advertisers or publishers making claims or initiating litigation against us, and our giving credits to our advertiser clients toward future advertising spend. In addition, the terms of our exclusive publisher agreements generally require us to pay for a percentage of the ad requests delivered by such publishers, even if we are unable to deliver our solutions due to disruptions in our technology. As a result, defects or errors in our solutions could harm our reputation, result in significant costs to us, impair our advertisers' ability to deliver effective advertising campaigns and impair our ability to meet our fill obligations with publishers.
System failures could significantly disrupt our operations and cause us to lose advertisers or publishers.
Our success depends on the continuing and uninterrupted performance of our solutions, which we utilize to place video ads, monitor the performance of advertising campaigns, manage our advertising inventory and respond to publisher ad calls. Our revenue depends on our ability to categorize video content and deliver ads as well as measure campaigns on a real-time basis. Sustained or repeated
22
system failures that interrupt our ability to deliver ads through the Tremor Video Network and provide access to our licensed solutions, including technological failures affecting our ability to deliver video ads quickly and accurately and to process viewers' responses to ads or fill publisher ad requests, could significantly reduce the attractiveness of our solutions and reduce our revenue. Our systems are vulnerable to damage from a variety of sources, including telecommunications failures, power outages, malicious human acts and natural disasters. In addition, any steps we take to increase the reliability and redundancy of our systems may be expensive and may not be successful in preventing system failures. Any such system failures could significantly disrupt our operations and cause us to lose advertisers or publishers.
Security breaches, computer viruses and computer hacking attacks could harm our business and results of operations.
We collect, store and transmit information of, or on behalf of, our advertisers and publishers. We take steps to protect the security, integrity and confidentiality of the information we collect, store or transmit, but there is no guarantee that inadvertent or unauthorized use or disclosure will not occur or that third parties will not gain unauthorized access to this information despite our efforts. Security breaches, computer malware and computer hacking attacks have become more prevalent in our industry and may occur on our systems or those of our information technology vendors in the future. Any security breach caused by hacking, which involves efforts to gain unauthorized access to information or systems, or to cause intentional malfunctions or loss or corruption of data, software, hardware or other computer equipment, or the inadvertent transmission of computer viruses or other harmful software code could result in the unauthorized disclosure, misuse, or loss of information, legal claims and litigation, indemnity obligations, regulatory fines and penalties, contractual obligations and liabilities, and other liabilities. In addition, if our security measures or those of our vendors are breached or unauthorized access to consumer data otherwise occurs, our solutions may be perceived as not being secure, and advertisers or publishers may reduce the use of or stop using our solutions.
While we and our publishers have security measures in place, these systems and networks are subject to ongoing threats and, therefore, these security measures may be breached as a result of employee error, failure to implement appropriate processes and procedures, malfeasance, third-party action, including cyber attacks or other international misconduct by computer hackers or otherwise. This could result in one or more third parties obtaining unauthorized access to our publishers' or advertisers' data or our data, including personally identifiable information or other viewer data, intellectual property and other confidential business information. Third parties may also attempt to fraudulently induce employees into disclosing sensitive information such as user names, passwords or other information in order to gain access to our advertisers' data or our data, including intellectual property and other confidential business information.
Because techniques used to obtain unauthorized access or sabotage systems change frequently and generally are not identified until they are launched against a target, we may be unable to anticipate these techniques or to implement adequate preventative or mitigation measures. Though it is difficult to determine what harm may directly result from any specific interruption or breach, any failure to maintain performance, reliability, security and availability of our network infrastructure or otherwise to maintain the confidentiality, security, and integrity of data that we store or otherwise maintain on behalf of third parties may harm our reputation and our relationships with advertisers, agencies or publishers or harm our ability to retain existing clients and attract new clients. Any of these could harm our business, financial condition and results of operations.
If such unauthorized disclosure or access does occur, we may be required to notify our advertisers, agencies or publishers or those persons whose information was improperly used, disclosed or accessed. We may also be subject to claims of breach of contract for such use or disclosure, investigation and penalties by regulatory authorities and potential claims by persons whose information was improperly
23
used or disclosed. The unauthorized use or disclosure of information may result in the termination of one or more of our commercial relationships or a reduction in advertiser, agency or publisher confidence and usage of our solutions. We may also be subject to litigation and regulatory action alleging the improper use, transmission or storage of confidential information, which could damage our reputation among our current and potential clients, require significant expenditures of capital and other resources and cause us to lose business and revenue.
Interruptions or delays in service from our third-party data center hosting facility and other third parties could impair the delivery of our solutions and harm our business.
We currently utilize a single third-party data center hosting facility located in Boston, Massachusetts. All of our data storage and analytics are conducted on, and the video ad campaigns we deliver are processed through, servers in this facility. We also rely on bandwidth providers, internet service providers and mobile networks to deliver video ads. Any damage to, or failure of, the systems of our third-party data center or our other third-party providers could result in interruptions to the availability or functionality of our service. If for any reason our arrangements with our data center or third-party providers are terminated, we could experience additional expense in arranging for new facilities, technology, services and support. In addition, the failure of our data center or any other third-party providers to meet our capacity requirements could result in interruptions in the availability or functionality of our solutions or impede our ability to scale our operations.
The occurrence of a natural disaster, an act of terrorism, vandalism or sabotage, a decision to close our third-party data center or the facilities of any third-party provider without adequate notice, or other unanticipated problems at these facilities could result in lengthy interruptions in the availability of our solutions. While we have disaster recovery arrangements in place, they have not been tested under actual disasters or similar events and may not effectively permit us to continue to provide our solutions in the event of any problems with respect to our data center or any other third-party facilities. To date, we have not experienced these types of events, but we cannot provide any assurances that they will not occur in the future. If any such event were to occur to our business, the delivery of our solutions could be impaired and our business harmed.
Our net operating loss carryforwards may expire unutilized or underutilized, which could prevent us from offsetting future taxable income.
We may be limited in the portion of net operating loss carryforwards that we can use in the future to offset taxable income for U.S. federal income tax purposes. At March 31, 2013, we had U.S. federal and state net operating loss carryforwards, or NOLs, of $83.4 million, which expire in various years beginning in 2026. A lack of future taxable income would adversely affect our ability to utilize these NOLs. In addition, under Section 382 of the Internal Revenue Code, a corporation that undergoes an "ownership change" is subject to limitations on its ability to utilize its NOLs to offset future taxable income. We believe that we experienced an ownership change under Section 382 of the Internal Revenue Code in prior years that may limit our ability to utilize a portion of the NOLs in the future. In addition, future changes in our stock ownership, including this or future offerings, as well as other changes that may be outside of our control, could result in additional ownership changes under Section 382 of the Internal Revenue Code. Our NOLs may also be impaired under similar provisions of state law. We have recorded a full valuation allowance related to our NOLs and other net deferred tax assets due to the uncertainty of the ultimate realization of the future benefits of those assets. Our NOLs may expire unutilized or underutilized, which could prevent us from offsetting future taxable income.
24
Risks Relating to Our Data Collection and Intellectual Property
Our ability to generate revenue depends on our ability to collect and use significant amounts of data to deliver video ads, and any limitations on the collection and use of this data could significantly diminish the value of our solutions.
Our ability to optimize the placement and scheduling of video advertisements for our advertisers and to grow our revenue depends on our ability to successfully leverage data that we collect from our advertisers, publishers, and third parties such as data providers. Our ability to successfully leverage such data, in turn, depends on our ability to collect and obtain rights to utilize such data.
When we deliver a video ad, we are often able to collect anonymous information about the placement of the video ad and the interaction of the user with the video ad. We currently employ cookies to conduct online video ad campaigns. Cookies are small files of non-personalized information placed on an internet consumer's computer. The cookies are used to collect information related to the consumer, such as demographic information and history of the consumer's interactions with our advertisers' and our publishers' websites, and any video ads we deliver. We also employ cookies and mobile tracking technology to deliver reporting on ads on web publishers' sites and in mobile applications. We may also be able to collect information about the user's location. As we collect and aggregate this data provided by billions of video ad impressions, we analyze it in order to optimize the placement and delivery of video ads across the advertising inventory provided to us by publishers. For example, we may use the collected information to limit the number of times a specific video ad is presented to the user, to provide a video ad to only certain types of users, or to provide a report to an advertiser or publisher regarding the performance of an advertising campaign or inventory, respectively.
Risks Related to Data Collected from Consumers
We participate in industry self-regulatory programs under which, in addition to other compliance obligations, we provide consumers with notice about our use of cookies and our collection and use of data in connection with the delivery of targeted advertising. In addition, consumers can currently opt out of the placement or use of our cookies for online targeted advertising purposes by either deleting or disabling cookies on their browsers, visiting websites that allow consumers to place an opt-out cookie on their browsers, which instructs advertisers and their service providers not to use certain data about the consumer's online activity for the delivery of targeted advertising, or by downloading browser plug-ins and other tools that can be set to: (1) identify cookies and other tracking technologies used on websites; (2) prevent websites from placing third-party cookies and other tracking technologies on the consumer's browser; or (3) block the delivery of online advertisements on websites and applications.
If consumer sentiment regarding privacy issues or the development and deployment of new browser solutions or other mechanisms that limit the use of cookies or other tracking technologies or data collected through use of such technologies results in a material increase in the number of consumers who choose to opt out or are otherwise using browsers where they need to, and fail to, configure the browser to accept cookies, our ability to collect valuable and actionable data would be impaired. Consumers may become increasingly resistant to the collection, use, and sharing of information used to deliver targeted advertising and may take steps to prevent such collection and use of information. Consumers may elect not to allow data collection, use, or sharing for targeted advertising for a number of reasons, such as privacy concerns or pricing mechanisms that may charge the user based upon the amount or types of data consumed on the device. Consumers may also elect to opt out of receiving targeted advertising specifically from our solutions.
Risks Related to Data Collected from Publishers and Advertisers
In order to effectively operate our video advertising campaigns, we collect data from advertisers, publishers, and other third parties. If we are not able to obtain sufficient rights to data from these third parties, we may not be able to utilize data in our solutions. Although our arrangements with advertisers and publishers generally permit us to collect non-personally identifiable and aggregate data from
25
advertising campaigns, some of our advertisers and publishers do not allow us to collect some or all of this data or limit our use of this data, and future advertisers and publishers may do so in the future. For example, publishers may not agree to permit us to place our data collection tags on their sites or agree to provide us with the data generated by interactions with the content on their sites. It would be difficult to comply with these requests, and to do so would cause us to spend significant amounts of resources. It could also make it difficult for us to deliver effective advertising campaigns that meet the demands of our advertisers.
We and many of our advertisers and publishers voluntarily participate in several trade associations and industry self-regulatory groups that promulgate best practice guidelines or codes of conduct addressing the delivery of promotional content to users, and tracking of users or devices for the purpose of delivering targeted advertising. We could be adversely affected by changes to these guidelines and codes in ways that are inconsistent with our practices or in conflict with the laws and regulations of U.S. or international regulatory authorities. If we are perceived as not operating in accordance with industry best practices or any such guidelines or codes with regard to privacy, our reputation may suffer, we could lose relationships with advertisers or publishers, and we could be subject to proceedings or actions against us by governmental entities or others as described below. Any limitation on our ability to collect data about user behavior and interaction with content could make it more difficult for us to deliver effective video advertising campaigns that meet the demands of our advertisers.
Risks Related to Data Collection Technology
Changes in device and software features and new technologies could make it easier for internet consumers to prevent the placement of cookies. In particular, the default settings of consumer devices and software may be set to prevent the placement of cookies unless the consumer actively elects to allow them. For example, Apple Inc.'s Safari browser currently does not accept third-party cookies as a default, and consumers must activate a browser setting to enable cookies to be set. Mozilla Corporation and Microsoft Inc. also have announced plans to adopt similar defaults in future versions of their respective Firefox and Internet Explorer browsers. On February 22, 2012, the Digital Advertising Alliance announced that its members will work to add browser-based header signals to the set of tools by which consumers can express their preferences not to be tracked online. On March 26, 2012, the U.S. Federal Trade Commission, or the FTC, issued a report on consumer privacy, which calls for the development and implementation of a persistent Do Not Track mechanism to enable consumers to choose whether to allow the tracking of their online search and browsing activities. Various industry participants have worked to develop and finalize standards relating to a Do Not Track mechanism, and such standards may be implemented and adopted by industry participants at any time.
Network carriers, providers of mobile device operating systems, and device manufacturers may also impact our ability to collect data on internet-connected devices. These carriers, operating system providers, and device manufacturers are increasingly promoting features that allow device users to disable some of the functionality of the device or its operating system, which may impair or disable the collection of data on their devices.
Any interruptions, failures, or defects in our data collection, mining, analysis, and storage systems could limit our ability to aggregate and analyze user data from our clients' advertising campaigns. If that happens, we may not be able to optimize the placement of advertising for the benefit of our advertisers, which could make our solutions less valuable, and, as a result, we may lose clients and our revenue may decline.
If web, smartphones, tablet and connected TV devices, their operating systems or content distribution channels, including those controlled by our competitors, develop in ways that prevent our advertising from being delivered to their users, our ability to grow our business could be impaired.
Our business model depends upon the continued compatibility of our solutions with most internet-connected devices across online, mobile, tablet and connected TV distribution channels, as well as the
26
major operating systems that run on them. The design of these devices and operating systems are controlled by third parties with whom we do not have any formal relationships. These parties frequently introduce new devices, and from time to time they may introduce new operating systems or modify existing ones. In some cases, the parties that control the development of internet-connected devices and operating systems include companies that we regard as our competitors, including some of our most significant competitors. For example, Google Inc. controls the Android operating system and also controls a significant number of mobile devices. If our solutions were unable to work on these devices or operating systems, either because of technological constraints or because a maker of these devices or developer of these operating systems wished to impair our ability to provide video ads on them, our ability to grow our business could be impaired.
Our business practices with respect to data could give rise to liabilities or reputational harm as a result of governmental regulation, legal requirements or industry standards relating to consumer privacy and data protection.
U.S. and foreign governments have enacted, considered, or are considering legislation or regulations that could significantly restrict our ability to collect, augment, analyze, use, and share anonymous data, such as by regulating the level of consumer notice and consent required before a company can employ cookies or other electronic tools to track people online. Federal, state, and international laws and regulations govern the collection, use, retention, sharing, and security of data that we collect across our solutions. We strive to comply with all applicable laws, regulations, self-regulatory requirements, policies, and legal obligations relating to privacy and data protection. However, it is possible that these requirements may be interpreted and applied in a manner that is inconsistent from one jurisdiction to another and may conflict with other rules or our practices. As we expand our operations globally, compliance with regulations that differ from country to country may also impose substantial compliance burdens on our business. In particular, the European Union has traditionally taken a broader view as to what is considered personal information and has imposed greater obligations under data privacy laws and regulations. In addition, individual EU member countries have had discretion with respect to their interpretation and implementation of the regulations, which has resulted in variation of privacy standards from country to country. We may be subject to foreign laws regulating online and mobile advertising even in jurisdictions where we do not have any physical presence to the extent a digital media content provider has advertising inventory that we manage or to the extent that we collect and use data from consumers in those jurisdictions. Any failure, or perceived failure, by us to comply with U.S. federal, state, or international laws, including laws and regulations regulating privacy, data security, or consumer protection, or other policies, self-regulatory requirements or legal obligations could result in proceedings or actions against us by governmental entities or others. We are aware of several ongoing lawsuits filed against companies in our industry alleging various violations of privacy- or data security-related laws.
Our subsidiary ScanScout was in the past subject to an FTC inquiry regarding its use of "Flash" cookies. As a result of our acquisition of ScanScout in December 2010, we are now subject to an FTC order regarding certain notice, disclosure and choice obligations regarding the use of cookies and our collection and use of data in connection with the delivery of targeted advertising. See the section titled "Business—Government Regulation; Industry Alliances" for a more complete description of this order. In addition, ScanScout was subject to a putative class action legal proceeding regarding its use of "Flash" cookies, which was settled in March 2012 and dismissed with prejudice.
The regulatory framework for privacy issues worldwide is evolving, and various government and consumer agencies and public advocacy groups have called for new regulation and changes in industry practices, including some directed at the advertising industry in particular. It is possible that new laws and regulations will be adopted in the United States and internationally, or existing laws and regulations may be interpreted in new ways that would affect our business particularly with regard to collection or use of data to target ads to consumers.
27
A number of U.S. state and federal bills have been proposed and are under consideration that contain provisions that would regulate how companies, such as ours, can use cookies and other tracking technologies to collect and use information about individuals and their online behaviors. At least one such bill presently has been proposed in the U.S. Congress. The U.S. government, including the FTC and the Department of Commerce, has announced that it is reviewing the need for greater regulation of the collection of consumer information, including regulation aimed at restricting some targeted advertising practices. The FTC has also adopted revisions to its rules implementing the Children's Online Privacy Protection Act, or COPPA Rules, effective July 1, 2013, that broaden the applicability of the COPPA Rules, including the types of information that would be subject to these regulations, and could effectively limit the information that we or our advertisers collect and use through certain online publishers and the content of video ads our advertisers may display.
Many European Union member states are in the process of or have already enacted legislation to implement the European Union ePrivacy Directive (Directive 2009/136/EC amending Directive 2009/136/CE) requiring advertisers to obtain specific types of notice and consent from individuals before using cookies or other technologies to track individuals and their online behavior and deliver targeted advertisements. In particular, to comply with certain of these requirements, the use of cookies or other similar technologies may require the user's affirmative, opt-in consent. Further, the European Commission has proposed a General Data Protection Regulation that may strengthen EU laws regarding notice and consent for tracking technology. The EU proposals, if implemented, may result in a greater compliance burden with respect to collecting information about persons in Europe. Complying with any new regulatory requirements could force us to incur substantial costs or require us to change our business practices in a manner that could compromise our ability to effectively pursue our growth strategy.
Any proceeding or action brought against us by a governmental entity or others relating to noncompliance with U.S federal, state, or international laws, self-regulatory requirements, policies, or other legal obligations relating to privacy or data protection could hurt our reputation, force us to spend significant amounts in defense of these proceedings, distract our management, increase our costs of doing business, adversely affect the demand for our solutions, and ultimately result in the imposition of monetary liability. We may also be contractually liable to indemnify and hold harmless our advertisers and publishers from the costs or consequences of noncompliance with privacy-related laws, regulations, self-regulatory requirements or other legal obligations, or inadvertent or unauthorized use or disclosure of data that we store or handle as part of providing our solutions.
Changes in global privacy-related laws and regulations and self-regulatory regimes may also impact our advertisers and publishers and adversely affect the demand for our solutions or otherwise harm our business, results of operations, and financial condition. For instance, privacy laws or regulations could require digital media content providers to take additional measures to facilitate consumer privacy preferences, in which case we will be reliant upon them to do so. In addition, digital media content providers could become subject to regulatory restrictions that would require them to limit or cease altogether the collection and/or use of data by third parties such as ourselves. For example, one potential form of restriction on the use of cookies would allow the website that the consumer has elected to visit, a first-party website, to continue to place cookies on the user's browser or device without explicit consent, but would require the user's explicit consent for a third party to place its cookies on the user's browser or device. Additionally, the March 2012 FTC staff report recommends that websites offer consumers a choice about whether the owner of the website can use third parties like us to track the activity for marketing purposes (e.g., delivery of targeted advertising). We are a third party in this context, and therefore currently depend on the ability to place our cookies on browsers and devices of users that visit the websites of our digital media content providers and to track devices for the purpose of ad delivery reporting on mobile devices, and if we were restricted from doing so because of compliance with laws or regulatory and industry best practices or recommendations
28
by digital media content providers, our ability to gather the data on which we rely would be impaired. Further, we could be placed at a competitive disadvantage to large competitors such as Google, Facebook, Microsoft, and Yahoo! who have heavily trafficked, first-party properties that would continue to have greater ability to collect visitor data and use such data for marketing purposes.
Any failure to protect our intellectual property rights could negatively impact our business.
We regard the protection of our intellectual property, which includes trade secrets, copyrights, trademarks, domain names, one patent and several patent applications, as critical to our success. We strive to protect our intellectual property rights by relying on federal, state and common law rights, as well as contractual restrictions. We generally enter into confidentiality and invention assignment agreements with our employees and contractors, and confidentiality agreements with parties with whom we conduct business in order to limit access to, and disclosure and use of, our proprietary information. However, we may not be successful in executing these agreements with every party who has access to our confidential information or contributes to the development of our intellectual property. Those agreements that we do execute may be breached, and we may not have adequate remedies for any such breach. These contractual arrangements and the other steps we have taken to protect our intellectual property may not prevent the misappropriation of our intellectual property, or deter independent development of similar intellectual property by others. Breaches of the security of our solutions, databases or other resources could expose us to a risk of loss or unauthorized disclosure of information collected, stored, or transmitted for or on behalf of advertisers or publishers, or of cookies, data stored in cookies, other user information, or other proprietary or confidential information.
We currently own one granted European patent, which we registered in France, Germany and Great Britain. Additionally, we currently own eight pending U.S. patent applications that we are currently prosecuting with the U.S. Patent and Trademark Office, although there can be no assurance that any of these patent applications will ultimately be issued a patent. We also register certain domain names, trademarks and service marks in the United States and in certain locations outside the United States. We also rely upon common law protection for certain marks, such as "Tremor Video." Any of our patents, trademarks or other intellectual property rights may be challenged by others or invalidated through administrative process or litigation. While we have a patent and certain patent applications pending, we may be unable to obtain patent protection for the technology covered in our patent applications. In addition, our existing patents and any patents that may be issued in the future may not provide us with competitive advantages, or may be successfully challenged by third parties. Our competitors and others could attempt to capitalize on our brand recognition by using domain names or business names similar to ours. Domain names similar to ours have been registered in the United States and elsewhere. We may be unable to prevent third parties from acquiring or using domain names and other trademarks that infringe on, are similar to, or otherwise decrease the value of our brands, trademarks or service marks. Effective trade secret, copyright, trademark, domain name and patent protection are expensive to develop and maintain, both in terms of initial and ongoing registration requirements and the costs of defending our rights. We may be required to protect our intellectual property in an increasing number of jurisdictions, a process that is expensive and may not be successful or which we may not pursue in every location. We may, over time, increase our investment in protecting our intellectual property through additional patent filings that could be expensive and time-consuming.
Additionally, in the United States, the central provisions of the Leahy-Smith America Invents Act, or AIA, became effective recently. Among other things, this law switched U.S. patent rights from the former "first-to-invent" system to a "first inventor-to-file" system. This may result in inventors and companies having to file patent applications more frequently to preserve rights in their inventions. This may favor larger competitors that have the resources to file more patent applications.
29
Monitoring unauthorized use of our intellectual property is difficult and costly. Our efforts to protect our proprietary rights and intellectual property may not be adequate to prevent their misappropriation or misuse. Further, we may not be able to detect unauthorized use of, or take appropriate steps to enforce, our intellectual property rights. Our competitors may also independently develop similar technology. The laws of some foreign countries may not be as protective of intellectual property rights as those in the United States, and mechanisms for enforcement of intellectual property rights may be inadequate. Effective patent, trademark, copyright and trade secret protection may not be available to us in every country in which our solutions or technology are hosted or available. Further, legal standards relating to the validity, enforceability and scope of protection of intellectual property rights are uncertain. The laws in the United States and elsewhere change rapidly, and any future changes could adversely affect us and our intellectual property. Our failure to meaningfully protect our intellectual property could result in competitors offering solutions that incorporate our most technologically advanced features, which could seriously reduce demand for our solutions. In addition, we may in the future find it necessary or appropriate to initiate infringement claims or litigation, whether to protect our intellectual property or to determine the enforceability, scope and validity of the intellectual property rights of others. Litigation, whether we are a plaintiff or a defendant, can be expensive, time-consuming and may divert the efforts of our technical staff and managerial personnel, which could harm our business, whether or not such litigation results in a determination that is unfavorable to us. In addition, litigation is inherently uncertain. Accordingly, despite our efforts, we may be unable to prevent third parties from infringing upon or misappropriating our intellectual property.
Our business may suffer if it is alleged or determined that our solutions or another aspect of our business infringes the intellectual property rights of others.
The online advertising industry is characterized by the existence of large numbers of patents, copyrights, trademarks, trade secrets and other intellectual property and proprietary rights. Companies in this industry are often required to defend against litigation claims that are based on allegations of infringement or other violations of intellectual property rights. Our technologies may not be able to withstand any third-party claims or rights against their use.
Our success depends, in part, upon non-infringement of intellectual property rights owned by others and being able to resolve claims of intellectual property infringement or misappropriation without major financial expenditures or adverse consequences. We currently face, and expect to face in the future, claims by third parties that we infringe upon or misappropriate their intellectual property rights, and we may be found to be infringing upon or to have misappropriated such rights. Such claims may be made by competitors or other parties. We cannot assure you that we are not infringing or violating any third-party intellectual property rights. From time to time, we or our clients may be subject to legal proceedings relating to our solutions or underlying technology and the intellectual property rights of others, particularly as we expand the complexity and scope of our business. As a result of disclosure of information in filings required of a public company, our business and financial condition will become more visible, which we believe may result in threatened or actual litigation, including by competitors and other third parties.
Regardless of whether claims that we are infringing patents or infringing or misappropriating other intellectual property rights have any merit, these claims are time-consuming and costly to evaluate and defend, and can impose a significant burden on management and employees. The outcome of any litigation is inherently uncertain, and we may receive unfavorable interim or preliminary rulings in the course of litigation. There can be no assurances that favorable final outcomes will be obtained in all cases. We may decide to settle lawsuits and disputes on terms that are unfavorable to us. Some of our competitors have substantially greater resources than we do and are able to sustain the costs of
30
complex intellectual property litigation to a greater degree and for longer periods of time than we could. Claims that we are infringing patents or other intellectual property rights could:
- •
- subject us to significant liabilities for monetary damages, which may be tripled in certain instances, and the attorneys
fees of others;
- •
- prohibit us from developing, commercializing or continuing to provide some or all of our solutions unless we obtain
licenses from, and pay royalties to, the holders of the patents or other intellectual property rights, which may not be available on commercially favorable terms, or at all;
- •
- subject us to indemnification obligations or obligations to refund fees to, and adversely affect our relationships with,
our current or future advertisers, agencies, and publishers;
- •
- result in injunctive relief against us, or otherwise result in delays or stoppages in providing all or certain aspects of
our solutions;
- •
- cause advertisers, agencies, or publishers to avoid working with us;
- •
- divert the attention and resources of management and technical personnel;
and
- •
- require technology or branding changes to our solutions that would cause us to incur substantial cost and that we may be unable to execute effectively or at all.
In addition, we may be exposed to claims that the content contained in ad campaigns violates the intellectual property or other rights of third parties. Such claims could be made directly against us or against the publishers from whom we purchase ad inventory. Generally, under our agreements with publishers, we are required to indemnify the publisher against any such claim with respect to an ad we served. We attempt to mitigate this exposure by generally requiring our advertisers and/or ad agencies to indemnify us for any damages from any such claims. There can be no assurance, however, that our advertisers will have the ability to satisfy their indemnification obligations to us, and pursuing any claims for indemnification may be costly or unsuccessful. As a result, we may be required to satisfy our indemnification obligations to our publishers or claims against us with our assets. This result could harm our reputation, business, financial condition and results of operations.
We use open source software in our solutions that may subject our technology to general release or require us to re-engineer our solutions, which may cause harm to our business.
Our technology incorporates or is distributed with software or data licensed from third parties, including some software distributed under so-called "open source" licenses, which we use without charge. Some of these licenses contain requirements that we make available source code for modifications or derivative works we create based upon the open source software, and that we license such modifications or derivative works under the terms of a particular open source license or other license granting third parties certain rights of further use. By the terms of certain open source licenses, we could be required to release the source code of our proprietary software, and to make our proprietary software available under open source licenses, if we combine our proprietary software with open source software in certain manners. Although we monitor our use of open source software, we cannot be sure that all open source software is reviewed prior to use in our proprietary software, that our programmers have not incorporated open source software into our proprietary software, or that they will not do so in the future. Additionally, the terms of many open source licenses to which we are subject have not been interpreted by U.S. or foreign courts. There is a risk that open source software licenses could be construed in a manner that imposes unanticipated conditions or restrictions on our ability to provide our solutions to our clients. In addition, the terms of open source software licenses may require us to provide software that we develop, using such open source software, to others on unfavorable license terms. As a result of our current or future use of open source software, we may
31
face claims or litigation, be required to release our proprietary source code, pay damages for breach of contract, re-engineer our technology, discontinue sales in the event re-engineering cannot be accomplished on a timely basis, or take other remedial action that may divert resources away from our development efforts, any of which could adversely affect our business, financial condition or operating results.
We rely on data, other technology, and intellectual property licensed from other parties, the failure or loss of which could increase our costs and delay or prevent the delivery of our solutions.
We utilize various types of data, other technology, and intellectual property licensed from unaffiliated third parties in order to provide certain elements of our solutions. Any errors or defects in any third-party data or other technology could result in errors in our solutions that could harm our business. In addition, licensed technology, data, and intellectual property may not continue to be available on commercially reasonable terms, or at all. Any loss of the right to use any of these on commercially reasonable terms, or at all, could result in delays in producing or delivering our solutions until equivalent data, other technology, or intellectual property is identified and integrated, which delays could harm our business. In this situation we would be required to either redesign our solutions to function with technology, data or intellectual property available from other parties or to develop these components ourselves, which would result in increased costs. Furthermore, we might be forced to limit the features available in our current or future solutions. If we fail to maintain or renegotiate any of these technology or intellectual property licenses, we could face significant delays and diversion of resources in attempting to develop similar or replacement technology, or to license and integrate a functional equivalent of the technology or intellectual property. The occurrence of any of these events may have an adverse effect on our business, financial condition and operating results.
Risks Related to Being a Public Company
If we fail to maintain proper and effective internal and disclosure controls, our ability to produce accurate financial statements and other disclosures on a timely basis could be impaired.
The Sarbanes-Oxley Act of 2002, or the Sarbanes-Oxley Act, requires, among other things, that we maintain effective disclosure controls and procedures and internal control over financial reporting. Commencing January 1, 2014, we must perform system and process evaluation and testing of our internal control over financial reporting to allow management to report on, and our independent registered public accounting firm potentially to attest to, the effectiveness of our internal control over financial reporting as required by Section 404 of the Sarbanes-Oxley Act. As an "emerging growth company" under the Jumpstart Our Business Startups, or JOBS Act, we expect to avail ourselves of the exemption from the requirement that our independent registered public accounting firm attest to the effectiveness of our internal control over financial reporting; however, we may no longer avail ourselves of this exemption when we cease to be an "emerging growth company." This will require that we incur substantial additional professional fees and internal costs to expand our accounting and finance functions and that we expend significant management efforts. Prior to this offering, we were never required to test our internal controls within a specified period, and, as a result, we may experience difficulty in meeting these reporting requirements in a timely manner. Moreover, if we or our independent registered public accounting firm identifies deficiencies in our internal control over financial reporting that are deemed to be material weaknesses, the market price of our stock could decline and we could be subject to sanctions or investigations by the SEC or other regulatory authorities, which would require additional financial and management resources.
We may in the future discover areas of our internal control over financial reporting that need improvement. Our internal control over financial reporting will not prevent or detect all error and all fraud. A control system, no matter how well designed and operated, can provide only reasonable, not absolute, assurance that the control system's objectives will be met. Because of the inherent limitations
32
in all control systems, no evaluation of controls can provide absolute assurance that misstatements due to error or fraud will not occur or that all control issues and instances of fraud will be detected.
If we are not able to comply with the requirements of Section 404 of the Sarbanes-Oxley Act in a timely manner, or if we are unable to maintain proper and effective disclosure controls and procedures or proper and effective internal control over our financial reporting, we may not be able to produce timely and accurate financial statements and other disclosures, and we may conclude that our internal controls over financial reporting are not effective. If that were to happen, the market price of our stock could decline and we could be subject to sanctions or investigations by the New York Stock Exchange, or NYSE, the SEC or other regulatory authorities.
Risks associated with being a public company.
As a public company, and particularly after we cease to be an "emerging growth company," we will incur significant legal, accounting and other expenses that we did not incur as a private company. In addition, the Sarbanes-Oxley Act of 2002 and rules subsequently implemented by the SEC and NYSE impose numerous requirements on public companies, including requiring changes in corporate governance practices. Also, the Exchange Act requires, among other things, that we file annual, quarterly and current reports with respect to our business and operating results. Our management and other personnel will need to devote a substantial amount of time to compliance with these laws and regulations. These requirements have increased and will continue to increase our legal, accounting, and financial compliance costs and have made and will continue to make some activities more time consuming and costly. For example, we expect these rules and regulations to make it more difficult and more expensive for us to obtain director and officer liability insurance, and we may be required to accept reduced policy limits and coverage or to incur substantial costs to maintain the same or similar coverage. These rules and regulations could also make it more difficult for us to attract and retain qualified persons to serve on our board of directors or our board committees or as executive officers.
As an "emerging growth company" under the JOBS Act we are permitted to, and intend to, rely on exemptions from certain disclosure requirements.
We are an "emerging growth company" and, for as long as we continue to be an "emerging growth company," we may choose to take advantage of exemptions from various reporting requirements applicable to other public companies including, but not limited to, not being required to have our independent registered public accounting firm audit our internal control over financial reporting as required by Section 404 of the Sarbanes-Oxley Act, reduced disclosure obligations regarding executive compensation in our periodic reports and proxy statements, and not being required to hold a nonbinding advisory vote on executive compensation or obtain stockholder approval of "golden parachute" payments. We could be an "emerging growth company" for up to five years following the completion of this offering, although, if we have more than $1.0 billion in annual revenue, if the market value of our common stock that is held by non-affiliates exceeds $700 million as of June 30 of any year, or we issue more than $1.0 billion of non-convertible debt over a three year period before the end of that five-year period, we would cease to be an "emerging growth company" as of the December 31 following such occurrence. Investors may find our common stock less attractive if we choose to rely on these exemptions, in which case the price of our common stock may suffer or there may be a less active trading market for our common stock and our stock price may be more volatile.
33
Risks Related to This Offering and Ownership of Our Common Stock
An active public trading market may not develop or be sustained following this offering, and you may not be able to sell your shares at or above the initial public offering price.
Before this offering, there was no public trading market for our common stock. If a market for our common stock does not develop or is not sustained, it may be difficult for you to sell your shares of common stock at an attractive price or at all. The initial public offering price of our common stock will be determined through negotiations between us and the underwriters. This initial public offering price may not be indicative of the market price of our common stock after the offering. In the absence of an active trading market for our common stock, investors may not be able to sell their common stock at or above the initial public offering price or at the time that they would like to sell and may reduce the fair market value of their shares. We cannot predict the prices at which our common stock will trade.
The market price of our common stock may be volatile, which could result in substantial losses for investors purchasing shares in this offering.
The market price of our common stock could be subject to significant fluctuations after this offering in response to various factors, some of which are beyond our control including:
- •
- price and volume fluctuations in the overall stock market, or in the market for the stock of comparable companies, from
time to time;
- •
- adverse changes in the regulatory environment;
- •
- actual or anticipated changes in our earnings or fluctuations in our operating results or the results of our competitors;
- •
- changes in the market perception of online video advertising platforms generally or in the effectiveness of our solutions
in particular;
- •
- announcements of technological innovations, new solutions, acquisitions, strategic alliances or significant agreements by
us or by our competitors;
- •
- issuance of new or changed securities analysts' reports or recommendations for our or our competitors' stock;
- •
- litigation involving us;
- •
- changes in general economic, industry and market conditions and trends;
- •
- expiration of contractual lock-up agreements with our executive officers, directors and security holders;
- •
- recruitment or departure of key personnel; and
- •
- the other factors described in this section of the prospectus titled "Risk Factors."
In the past, following periods of volatility in the market price of a company's securities, securities class action litigation has often been brought against that company. Because of the potential volatility of our stock price, we may become the target of securities litigation in the future. Securities litigation could result in substantial costs and divert management's attention and resources from our business.
Sales of substantial amounts of our common stock in the public markets, or the perception that they might occur, could reduce the price that our common stock might otherwise attain and may dilute your voting power and your ownership interest in us.
Sales of a substantial number of shares of our common stock, or the perception that a substantial number of shares could be sold, could reduce the market price of our common stock. After the closing
34
of this offering, we will have 48,498,103 shares of common stock outstanding (or 49,623,103 shares assuming exercise of the underwriters' over-allotment option in full) based on the 40,998,103 shares of common stock outstanding at March 31, 2013. All of the shares expected to be sold in this offering will be freely-tradable without restriction or further registration under the Securities Act of 1933, as amended, or the Securities Act, unless they are held by our "affiliates" as that term is defined in Rule 144 under the Securities Act. The resale of 40,922,107 shares, or 84.3% of our outstanding shares after this offering, are currently, and will be following the closing of this offering, restricted as a result of securities laws or lock-up agreements; however, subject to applicable securities law restrictions, these shares will be able to be sold in the public market beginning 180 days after the date of this prospectus. In addition, the shares subject to outstanding options and warrants, for which 4,154,985 shares and 142,534 shares, respectively, were exercisable as of March 31, 2013 will become available for sale immediately upon the exercise of such options or warrants and the expiration or waiver of any applicable lock-up agreements. For more information, see the section of this prospectus titled "Shares Eligible for Future Sale."
Moreover, after this offering, holders of an aggregate of approximately 33,389,849 shares of our common stock (including shares underlying the warrants described in the section of this prospectus titled "Shares Eligible for Future Sale") or 68.8% of our common stock, will have rights, subject to some conditions, to require us to file registration statements covering the sale of their shares or to include their shares in registration statements that we may file for ourselves or other stockholders. We also intend to register for offer and sale all shares of common stock that we may issue under our stock-based compensation plans. Once we register the offer and sale of these shares, they can be freely sold in the public market upon issuance, subject to the lock-up agreements described in the section of this prospectus titled "Underwriting."
Additionally, Credit Suisse Securities (USA) LLC and Jefferies LLC, on behalf of the underwriters, may in their sole discretion and only with our consent, at any time with or without notice, release all or any portion of the shares subject to the lock-up agreements, which would result in more shares being available for sale in the public market at earlier dates. Sales of common stock by existing stockholders in the public market, the availability of these shares for sale, our issuance of securities or the perception that any of these events might occur could materially and adversely affect the market price of our common stock. In addition, the sale of these securities could impair our ability to raise capital through the sale of additional stock.
In addition, in the future, we may issue additional shares of common stock or other equity or debt securities convertible into common stock in connection with a financing, acquisition, litigation settlement, employee arrangements or otherwise. Any such issuance could result in substantial dilution to our existing stockholders and could cause our stock price to decline.
Concentration of ownership of our common stock among our existing executive officers, directors and principal stockholders may prevent new investors from influencing significant corporate decisions.
Our executive officers, directors and principal stockholders and their respective affiliates beneficially owned, in the aggregate, approximately 71.1% of our outstanding common stock as of May 31, 2013, and we expect that upon completion of this offering, that same group will beneficially own at least 60.6% of our common stock. These persons, acting together, are able to significantly influence all matters requiring stockholder approval, including the election and removal of directors and any merger or other significant corporate transactions. The interests of this group of stockholders may not coincide with our interests or the interests of other stockholders.
35
Our management will have broad discretion over the use of the proceeds we receive from this offering and might not apply the proceeds in ways that increase the value of your investment.
The primary purposes of the offering are to create a public market for our common stock and to facilitate access to public equity markets. Our management will have broad discretion to use our net proceeds from this offering, and you will be relying on the judgment of our management regarding the application of these proceeds. Our management might not apply our net proceeds of this offering in ways that increase the value of your investment. We intend to use the net proceeds from this offering for general corporate purposes. In addition, we may use a portion of the proceeds from this offering for acquisitions of complementary businesses, technologies or other assets. Our management might not be able to yield a significant return, if any, on any investment of these net proceeds. You will not have the opportunity to influence our decisions on how to use our net proceeds from this offering.
If securities or industry analysts do not publish, or cease publishing, research or reports about us, our business or our market, if they publish negative evaluations of our stock, or if we fail to meet the expectations of analysts, the price of our stock and trading volume could decline.
The trading market for our common stock will be influenced by the research and reports that industry or securities analysts may publish about us, our business, our market or our competitors. If no or few analysts commence coverage of us, the trading price of our stock would likely decrease. Even if we do obtain analyst coverage, if one or more of the analysts covering our business issues an adverse opinion of our company because we fail to meet their expectations or otherwise, the price of our stock could decline. If one or more of these analysts cease to cover our stock, we could lose visibility in the market for our stock, which in turn could cause our stock price to decline.
Anti-takeover provisions in our certificate of incorporation and bylaws to be in effect upon completion of this offering, as well as provisions of Delaware law, might discourage, delay or prevent a change in control of our company or changes in our board of directors or management and, therefore, depress the price of our common stock.
Our certificate of incorporation and bylaws to be in effect upon completion of this offering and Delaware law contain provisions that may discourage, delay or prevent a merger, acquisition or other change in control that stockholders may consider favorable, including transactions in which you might otherwise receive a premium for your shares of our common stock or transactions that our stockholders might otherwise deem to be in their best interests. These provisions may also prevent or frustrate attempts by our stockholders to replace or remove members of our board of directors or our management. Therefore, these provisions could adversely affect the price of our stock. Our corporate governance documents include provisions:
- •
- establishing a classified board of directors with staggered three-year terms so that not all members of our
board of directors are elected at one time;
- •
- providing that directors may be removed by stockholders only for cause;
- •
- preventing the ability of our stockholders to call and bring business before special meetings and to take action by
written consent in lieu of a meeting;
- •
- requiring advance notice of stockholder proposals for business to be conducted at meetings of our stockholders and for
nominations of candidates for election to our board of directors;
- •
- permitting the board of directors to issue up to 10,000,000 shares of preferred stock with any rights, preferences and
privileges as they may designate;
- •
- limiting the liability of, and providing indemnification to, our directors and officers;
- •
- providing that vacancies may be filled by remaining directors;
36
- •
- preventing cumulative voting; and
- •
- providing for a supermajority requirement to amend our bylaws.
As a Delaware corporation, we are also subject to provisions of Delaware law, including Section 203 of the General Corporation Law of the State of Delaware, which prohibits a Delaware corporation from engaging in a broad range of business combinations with any "interested" stockholder for a period of three years following the date on which the stockholder became an "interested" stockholder. Any provision of our certificate of incorporation or bylaws or Delaware law that has the effect of delaying or deterring a change in control could limit the opportunity for our stockholders to receive a premium for their shares of our common stock and could also affect the price that some investors are willing to pay for our common stock.
37
SPECIAL NOTE REGARDING FORWARD-LOOKING STATEMENTS
This prospectus contains forward-looking statements that involve substantial risks and uncertainties. The forward-looking statements are contained principally in the sections of this prospectus entitled "Prospectus Summary," "Risk Factors," "Management's Discussion and Analysis of Financial Condition and Results of Operations" and "Business," but are also contained elsewhere in this prospectus. In some cases, you can identify forward-looking statements by the words "anticipate," "believe," "continue," "could," "estimate," "expect," "intend," "may," "might," "objective," "ongoing," "plan," "predict," "project," "potential," "should," "will," or "would," and or the negative of these terms, or other comparable terminology intended to identify statements about the future. These statements involve known and unknown risks, uncertainties and other factors that may cause our actual results, levels of activity, performance or achievements to be materially different from the information expressed or implied by these forward-looking statements. Although we believe that we have a reasonable basis for each forward-looking statement contained in this prospectus, we caution you that these statements are based on a combination of facts and factors currently known by us and our expectations of the future, about which we cannot be certain. Forward-looking statements include statements about:
- •
- the expansion of the online video advertising market;
- •
- the adoption of brand-centric metrics, advanced ad formats and performance-based pricing models;
- •
- our ability to increase revenue from new and existing advertisers with respect to the Tremor Video Network and VHA
solution;
- •
- the increase in broadband speed, sales of internet-connected devices and time spent viewing online videos;
- •
- our ability to ensure a high level of brand safety for our clients;
- •
- our ability to acquire an adequate supply of premium video advertising inventory from publishers on terms that are
favorable to us;
- •
- the effects of increased competition as well as innovations by new and existing competitors in our market;
- •
- our ability to effectively innovate and scale our technology;
- •
- our ability to effectively manage our growth;
- •
- our ability to successfully expand our reach beyond current core verticals and manage our international expansion;
- •
- our ability to protect viewers' information and adequately address privacy concerns;
- •
- the effect of regulatory developments and industry standards regarding internet privacy and other matters;
- •
- our ability to maintain, protect and enhance our intellectual property;
- •
- costs associated with defending intellectual property infringement and other claims;
- •
- potential acquisition and integration of complementary business and technologies;
- •
- our expected use of proceeds;
- •
- statements regarding future revenue, gross margins, hiring plans, expenses, capital expenditures, capital requirements and stock performance;
38
- •
- our ability to detect fraudulent or malicious activity; and
- •
- our ability to attract and retain qualified employees and key personnel.
You should refer to the "Risk Factors" section of this prospectus for a discussion of important factors that may cause our actual results to differ materially from those expressed or implied by our forward-looking statements. As a result of these factors, we cannot assure you that the forward-looking statements in this prospectus will prove to be accurate. Furthermore, if our forward-looking statements prove to be inaccurate, the inaccuracy may be material. In light of the significant uncertainties in these forward-looking statements, you should not regard these statements as a representation or warranty by us or any other person that we will achieve our objectives and plans in any specified time frame or at all. We undertake no obligation to publicly update any forward-looking statements, whether as a result of new information, future events or otherwise, except as required by law. The Private Securities Litigation Reform Act of 1995 and Section 27A of the Securities Act do not protect any forward-looking statements that we make in connection with this offering.
You should read this prospectus and the documents that we reference in this prospectus and have filed as exhibits to the registration statement, of which this prospectus is a part, completely and with the understanding that our actual future results may be materially different from what we expect. We qualify all of our forward-looking statements by these cautionary statements.
This prospectus contains market data and industry forecasts that were obtained from industry publications. These data involve a number of assumptions and limitations, and you are cautioned not to give undue weight to such estimates. We have not independently verified any third-party information. While we believe the market position, market opportunity and market size information included in this prospectus is generally reliable, such information is inherently imprecise.
39
We estimate that the net proceeds from our issuance and sale of 7,500,000 shares of our common stock in this offering will be approximately $80.9 million, or approximately $93.4 million if the underwriters exercise their over-allotment option in full, based upon an assumed initial public offering price of $12.00 per share, which is the midpoint of the range set forth on the cover page of this prospectus, and after deducting estimated underwriting discounts and commissions and estimated offering expenses.
Each $1.00 increase or decrease in the assumed initial public offering price of $12.00 per share, which is the midpoint of the range set forth on the cover page of this prospectus, would increase or decrease the net proceeds to us from this offering by approximately $7.0 million, assuming that the number of shares offered by us, as set forth on the cover page of this prospectus, remains the same, and after deducting the estimated underwriting discounts and commissions. We may also increase or decrease the number of shares we are offering. Each increase or decrease of 1,000,000 shares in the number of shares offered by us would increase or decrease the net proceeds to us from this offering by approximately $11.2 million, assuming that the assumed initial price to public remains the same, and after deducting the estimated underwriting discounts and commissions. We do not expect that a change in the initial price to the public or the number of shares by these amounts would have a material effect on uses of the proceeds from this offering, although it may accelerate the time at which we will need to seek additional capital.
The principal purposes of this offering are to create a public market for our common stock and to facilitate our future access to the public equity markets, as well as to obtain additional capital. We intend to use the net proceeds from this offering for general corporate purposes. In addition, we may use a portion of the proceeds from this offering for acquisitions of complementary businesses, technologies or other assets, although we do not currently have any plans for any acquisitions. We may allocate funds from other sources to fund some or all of these activities.
The expected use of net proceeds from this offering represents our intentions based upon our present plans and business conditions. We cannot predict with certainty all of the particular uses for the proceeds of this offering or the amounts that we will actually spend on the uses set forth above. Accordingly, our management will have significant flexibility in applying the net proceeds of this offering.
The timing and amount of our actual expenditures will be based on many factors, including cash flows from operations and the anticipated growth of our business. Pending their use, we intend to invest the net proceeds of this offering in a variety of capital-preservation investments, including short- and intermediate-term, interest-bearing, investment-grade securities.
We have never declared or paid any dividends on our common stock or any other securities. We anticipate that we will retain all of our future earnings, if any, for use in the operation and expansion of our business and do not anticipate paying cash dividends in the foreseeable future. Additionally, our ability to pay dividends on our common stock is limited by restrictions under the terms of the agreements governing our credit facility. Payment of future cash dividends, if any, will be at the discretion of the board of directors after taking into account various factors, including our financial condition, operating results, current and anticipated cash needs, the requirements of current or then-existing debt instruments and other factors the board of directors deems relevant.
40
The following table sets forth our cash and cash equivalents and our capitalization as of March 31, 2013:
- •
- on an actual basis; and
- •
- on a pro forma basis as adjusted to reflect (1) the conversion of the outstanding shares of our preferred stock into common stock, which will occur automatically upon the closing of this offering, (2) the reclassification of our preferred stock warrant liability to additional paid-in-capital upon the automatic conversion of our preferred stock warrants into warrants exercisable for common stock, which will occur automatically upon the closing of this offering, and (3) our sale of 7,500,000 shares of common stock in this offering at an assumed initial public offering price of $12.00 per share, which is the midpoint of the range set forth on the cover page of this prospectus, after deducting estimated underwriting discounts and commissions and estimated offering expenses.
You should read this table together with the sections of this prospectus titled "Selected Financial and Other Data," "Management's Discussion and Analysis of Financial Condition and Results of Operations" and our financial statements and the related notes appearing elsewhere in this prospectus.
| |
As of March 31, 2013 | ||||||
|---|---|---|---|---|---|---|---|
| |
Actual | Pro forma as adjusted(1) |
|||||
| |
(unaudited) |
||||||
| |
(in thousands, except share and per share data) |
||||||
Cash and cash equivalents |
$ | 31,533 | $ | 112,416 | |||
Warrants for purchase of mandatorily redeemable convertible preferred stock |
1,098 | — | |||||
Mandatorily redeemable convertible preferred stock, $0.0001 par value(2): |
|||||||
32,742,929 shares authorized, 32,563,192 shares issued and outstanding, actual; no shares authorized, issued and outstanding, pro forma as adjusted |
$ | 162,561 | $ | — | |||
Stockholders' (deficit) equity: |
|||||||
Preferred stock, $0.0001 per share; no shares authorized, issued or outstanding, actual; 10,000,000 shares authorized, no shares issued or outstanding, pro forma as adjusted |
— | — | |||||
Common stock, $0.0001 par value; 100,000,000 shares authorized, 7,750,788 shares issued and outstanding, actual; 250,000,000 shares authorized, 48,498,103 shares issued and outstanding, pro forma as adjusted(2) |
1 | 5 | |||||
Additional paid-in-capital(2) |
18,442 | 271,132 | |||||
Accumulated other comprehensive income |
251 | 251 | |||||
Accumulated deficit |
(86,729) | (94,881) | |||||
Total stockholders' (deficit) equity |
(68,035) | 176,507 | |||||
Total capitalization |
$ | 95,624 | $ | 176,507 | |||
- (1)
- Each $1.00 increase or decrease in the assumed initial public offering price of $12.00 per share, which is the midpoint of the range set forth on the cover page of this prospectus, would increase or decrease pro forma as adjusted cash and cash equivalents, additional paid-in capital, total stockholders' (deficit) equity and total capitalization by approximately $7.0 million, assuming that the number of shares offered by us, as set forth on the cover page of this prospectus, remains the same, and after deducting the estimated underwriting discounts and commissions. We may also increase or decrease the number of shares we are offering. Each increase or decrease of 1,000,000 shares in the number of shares offered by us would increase or decrease each of cash and cash equivalents, additional paid-in capital, total stockholders' (deficit) equity and total capitalization by approximately $11.2 million, assuming that the assumed initial price to public remains the same, and after deducting the estimated underwriting discounts and commissions. The pro
41
forma as adjusted information discussed above is illustrative only and will adjust based on the actual initial price to public and other terms of this offering determined at pricing.
- (2)
- The number of shares of our common stock to be issued upon the automatic conversion of all outstanding shares of our Series F preferred stock depends in part on the anticipated initial public offering price of our common stock. The terms of our Series F preferred stock provide that the ratio at which each share of these series of preferred stock automatically convert into shares of our common stock in connection with this offering will increase if the anticipated initial public offering price is below $13.997 per share, which would result in additional shares of our common stock being issued upon conversion of our Series F preferred stock immediately prior to the closing of this offering. Based upon the anticipated initial public offering price of $12.00 per share, the midpoint of the price range set forth on the cover page of this prospectus, the outstanding shares of our Series F preferred stock will convert into an aggregate of 4,624,988 shares of our common stock immediately prior to the closing of this offering. See the section of this prospectus titled "Prospectus Summary—Offering" for a description of the number of shares issuable upon conversion of our Series F preferred stock depending on the price at which our shares are sold to the public.
The pro forma as adjusted accumulated deficit and additional paid-in capital amounts in the table above include the effects of a $7.9 million deemed dividend for the assumed fair value of additional shares of common stock issued upon the conversion of our Series F preferred stock at the assumed initial public offering price of $12.00 per share, which is the midpoint of the range set forth on the cover page of this prospectus. See "Unaudited Pro Forma Presentation" in note 2 to our consolidated financial statements. The deemed dividend will increase the net loss allocable to common stockholders in the calculation of pro forma basic and diluted net loss per share.
The number of shares of our common stock that will be outstanding after this offering excludes:
- •
- 7,002,403 shares of common stock issuable upon the exercise of options outstanding as of March 31, 2013, at a
weighted-average exercise price of $3.39 per share;
- •
- 299,666 shares of common stock issuable upon the exercise of options that were granted after March 31, 2013, at a
weighted-average exercise price of $8.15 per share;
- •
- 1,333,333 shares of our common stock reserved for future issuance pursuant to the 2013 Plan which will become effective
prior to the completion of this offering and which contains provisions that automatically increase their share reserves each year; and
- •
- 142,534 shares of common stock issuable upon the exercise of preferred stock warrants that were outstanding as of March 31, 2013, at a weighted-average exercise price of $3.21 per share.
42
If you invest in our common stock, your interest will be diluted to the extent of the difference between the initial public offering price per share of our common stock and the pro forma net tangible book value per share of our common stock immediately after this offering.
As of March 31, 2013, our net tangible book value was $(121.9) million, or $(2.97) per share of common stock. Our pro forma net tangible book value per share represents the amount of our total tangible assets reduced by the amount of our total liabilities and divided by the total number of shares of our common stock outstanding as of March 31, 2013, assuming and after giving effect to (1) the conversion of outstanding shares of preferred stock into shares of our common stock (assuming a conversion ratio equal to approximately 1.1664 common shares for each Series F preferred share based on an initial public offering price of $12.00 per share, the midpoint of the price range set forth on the cover page of this prospectus), (2) the reclassification of the preferred stock warrant liability to stockholders' deficit upon the closing of this offering, (3) the issuance of 7,500,000 shares of common stock in this offering and (4) receipt of the net proceeds from the sale of shares of common stock in this offering at an assumed initial price to public of $12.00 per share (the midpoint of the price range set forth on the cover of this prospectus), after deducting underwriting discounts and commissions and estimated offering expenses. This represents an immediate increase in pro forma net tangible book value of $1.51 per share to our existing stockholders and an immediate dilution of $9.47 per share to investors purchasing shares in this offering.
The following table illustrates this per share dilution:
Assumed initial public offering price per share |
$ | 12.00 | |||||
Historical net tangible book value per share as of March 31, 2013 |
$ | (2.97 | ) | ||||
Pro forma increase per share attributable to conversion of preferred stock |
3.97 | ||||||
Pro forma increase per share attributable to reclassification of preferred stock warrant liability |
0.02 | ||||||
Pro forma net tangible book value per share before this offering |
$ | 1.02 | |||||
Pro forma as adjusted increase in pro forma net tangible book value per share attributable to new investors participating in this offering |
1.51 | ||||||
Pro forma as adjusted net tangible book value per share after this offering |
2.53 | ||||||
Dilution per share to investors participating in this offering |
$ | 9.47 | |||||
The dilution information discussed above is illustrative only and will change based on the actual initial public offering price and other terms of this offering determined at pricing. Each $1.00 increase or decrease in the assumed initial public offering price of $12.00 per share would increase or decrease our pro forma as adjusted net tangible book value by approximately $7.0 million, or approximately $0.16 per share, and the dilution per share to investors participating in this offering by approximately $0.84 per share, assuming that the number of shares offered by us, as set forth on the cover page of this prospectus, remains the same, and after deducting the estimated underwriting discounts and commissions. We may also increase or decrease the number of shares we are offering. An increase in the number of shares offered by us by 1,000,000 would increase the pro forma as adjusted net tangible book value by approximately $11.2 million, or $0.18 per share, and the pro forma dilution per share to investors in this offering would be $9.29 per share, assuming that the assumed initial price to public remains the same, and after deducting the estimated underwriting discounts and commissions. Similarly, a decrease in the number of shares offered by us by 1,000,000 shares would decrease the pro forma as adjusted net tangible book value by approximately $11.2 million, or $0.18 per share, and the pro forma dilution per share to investors in this offering would be $9.65 per share, assuming that the assumed initial price to public remains the same, and after deducting the estimated underwriting discounts and
43
commissions. The pro forma information discussed above is illustrative only and will adjust based on the actual initial price to public and other terms of this offering determined at pricing. See the section of this prospectus titled "Prospectus Summary—Offering" for a description of the number of shares issuable upon conversion of our Series F preferred stock depending on the price at which our shares are sold to the public.
If the underwriters exercise their over-allotment option in full, the pro forma as adjusted net tangible book value per share after the offering would be $2.72 per share, the increase in the pro forma as adjusted net tangible book value per share to existing stockholders would be $1.70 per share and the dilution to new investors purchasing common stock in this offering would be $9.28 per share.
The following table sets forth as of March 31, 2013, on a pro forma basis as described above, the number of shares of common stock purchased or to be purchased from us, the total consideration paid by or to be paid and the weighted-average price per share paid or to be paid by existing stockholders and by the new investors purchasing shares of our common stock in this offering at an assumed initial public offering price of $12.00 per share, which is the midpoint of the range set forth on the cover page on this prospectus, before deducting estimated underwriting discounts and commissions and estimated offering expenses payable by us:
| |
Shares purchased | Total consideration | |
|||||||||||||
|---|---|---|---|---|---|---|---|---|---|---|---|---|---|---|---|---|
| |
Weighted- average price per share |
|||||||||||||||
| |
Number | Percent | Amount | Percent | ||||||||||||
Existing stockholders |
40,998,103 | 84.5 | % | $ | 181,029,000 | 66.8 | % | $ | 4.42 | |||||||
New investors |
7,500,000 | 15.5 | 90,000,000 | 33.2 | % | 12.00 | ||||||||||
Total |
48,498,103 | 100 | % | $ | 271,029,000 | 100 | % | |||||||||
Each $1.00 increase or decrease in the assumed initial public offering price of $12.00 per share, which is the midpoint of the range set forth on the cover page of this prospectus, would increase or decrease the total consideration paid by new investors by $7.0 million, assuming that the number of shares offered by us, as set forth on the cover page of this prospectus, remains the same and after deducting estimated underwriting discounts and commissions. We may also increase or decrease the number of shares we are offering. An increase or decrease of 1,000,000 shares in the number of shares offered by us would increase or decrease total consideration paid by new investors by $11.2 million, assuming that the assumed initial price to public remains the same and after deducting estimated underwriting discounts and commissions.
In addition, if the underwriters exercise their over-allotment option in full, the number of shares held by the existing stockholders after this offering would be reduced to 40,998,103, or 82.6% of the total number of shares of our common stock outstanding after this offering, and the number of shares held by new investors would increase to 8,625,000, or 17.4% of the total number of shares of our common stock outstanding after this offering.
The number of shares of common stock to be outstanding following this offering is based on 40,998,103 shares of common stock outstanding as of March 31, 2013, giving effect to the conversion of all outstanding shares of Series II and preferred stock into an aggregate of 34,294,672 shares of common stock upon the closing of this offering. The outstanding share information in the table above excludes as of March 31, 2013:
- •
- 7,002,403 shares of common stock issuable upon the exercise of options outstanding as of March 31, 2013, at a
weighted-average exercise price of $3.39 per share;
- •
- 299,666 shares of common stock issuable upon the exercise of options that were granted after March 31, 2013, at a weighted-average exercise price of $8.15 per share;
44
- •
- 1,333,333 shares of our common stock reserved for future issuance pursuant to the 2013 Plan which will become effective
prior to the completion of this offering and which contains provisions that automatically increase their share reserves each year; and
- •
- 142,534 shares of common stock issuable upon the exercise of preferred stock warrants that were outstanding as of March 31, 2013, at a weighted-average exercise price of $3.21 per share.
The shares of our common stock reserved for future issuance under our equity incentive plans will be subject to automatic annual increases in accordance with the terms of the plans. To the extent that options or warrants are exercised, new options are issued under our equity incentive plans, or we issue additional shares of common stock in the future, there will be further dilution to investors participating in this offering. In addition, we may choose to raise additional capital because of market conditions or strategic considerations, even if we believe that we have sufficient funds for our current or future operating plans. If we raise additional capital through the sale of equity or convertible debt securities, the issuance of these securities could result in further dilution to our stockholders.
45
SELECTED CONSOLIDATED FINANCIAL DATA
The following tables set forth our selected consolidated financial data. The following selected consolidated financial data for the years ended December 31, 2011 and 2012 and the selected consolidated balance sheet data as of December 31, 2011 and 2012 are derived from our audited consolidated financial statements, which have been audited by Ernst & Young LLP, our independent registered public accounting firm. The selected consolidated financial data for the three months ended March 31, 2012 and 2013 and the selected consolidated balance sheet data as of March 31, 2013 are derived from our unaudited consolidated financial statements appearing elsewhere in this prospectus. The data should be read together with "Management's Discussion and Analysis of Financial Condition and Results of Operations" and in conjunction with the consolidated financial statements, related notes, and other financial information included elsewhere in this prospectus. We have prepared the unaudited financial data on the same basis as the audited financial statements. The unaudited consolidated financial data includes, in the opinion of our management, all adjustments, consisting only of normal recurring adjustments that are necessary for a fair presentation of the financial information set forth in these statements. Our historical results are not necessarily indicative of the results to be expected in the future, and our interim results are not necessarily indicative of the results that should be expected for the full year.
| |
Year Ended December 31, | Three Months Ended March 31, |
|||||||||||
|---|---|---|---|---|---|---|---|---|---|---|---|---|---|
| |
2011 | 2012 | 2012 | 2013 | |||||||||
| |
(in thousands, except share and per share data) |
||||||||||||
| |
|
|
(unaudited) |
||||||||||
Consolidated Statements of Operations Data: |
|||||||||||||
Revenue |
$ | 90,301 | $ | 105,190 | $ | 17,272 | $ | 24,765 | |||||
Cost of revenue |
58,502 | 61,317 | 11,769 | 13,841 | |||||||||
Gross profit |
31,799 | 43,873 | 5,503 | 10,924 | |||||||||
Operating expenses: |
|||||||||||||
Technology and development(1) |
5,900 | 8,144 | 1,651 | 2,697 | |||||||||
Sales and marketing(1) |
28,829 | 35,042 | 8,522 | 8,843 | |||||||||
General and administrative(1) |
10,880 | 10,824 | 2,795 | 2,920 | |||||||||
Depreciation and amortization |
6,088 | 5,992 | 1,478 | 1,502 | |||||||||
Total operating expenses |
51,697 | 60,002 | 14,446 | 15,962 | |||||||||
Loss from operations |
(19,898 | ) | (16,129 | ) | (8,943 | ) | (5,038 | ) | |||||
Interest and other expense: |
|||||||||||||
Interest expense |
(321 | ) | (227 | ) | (75 | ) | (56 | ) | |||||
Other (expense) income |
(583 | ) | (8 | ) | (39 | ) | 5 | ||||||
Total interest and other expense |
(904 | ) | (235 | ) | (114 | ) | (51 | ) | |||||
Loss before income taxes |
(20,802 | ) | (16,364 | ) | (9,057 | ) | (5,089 | ) | |||||
Income tax expense |
(223 | ) | (280 | ) | (70 | ) | (70 | ) | |||||
Net loss |
$ | (21,025 | ) | $ | (16,644 | ) | $ | (9,127 | ) | $ | (5,159 | ) | |
Net loss per share—basic and diluted |
$ | (3.02 | ) | $ | (2.22 | ) | $ | (1.25 | ) | $ | (0.67 | ) | |
Pro forma net loss per share of common stock—basic and diluted(2) |
$ | (0.61 | ) | $ | (0.32 | ) | |||||||
Weighted-average shares of common stock outstanding used in computing net loss per share—basic and diluted |
6,952,952 | 7,499,986 | 7,318,320 | 7,729,218 | |||||||||
Weighted-average shares of common stock outstanding used in computing pro forma net loss per share—basic and diluted(2) |
40,747,301 | 40,976,533 | |||||||||||
Other Financial Data: |
|||||||||||||
In-stream advertising revenue(3) |
$ | 75,500 | $ | 99,678 | $ | 15,745 | $ | 23,996 | |||||
Adjusted EBITDA(4) |
$ | (10,927 | ) | $ | (7,218 | ) | $ | (6,665 | ) | $ | (2,797 | ) | |
46
| |
As of December 31, | As of March 31, | ||||||||
|---|---|---|---|---|---|---|---|---|---|---|
| |
2011 | 2012 | 2013 | |||||||
| |
(in thousands) |
|||||||||
| |
|
|
(unaudited) |
|||||||
Consolidated Balance Sheet Data: |
||||||||||
Cash, cash equivalents and short-term investments |
$ | 40,366 | $ | 32,533 | $ | 31,533 | ||||
Working capital |
49,601 | 39,892 | 37,334 | |||||||
Total assets |
137,980 | 129,723 | 122,196 | |||||||
Mandatorily redeemable convertible preferred stock |
162,082 | 162,466 | 162,561 | |||||||
Total liabilities |
26,506 | 30,729 | 27,670 | |||||||
Total stockholders' deficit |
(50,608 | ) | (63,472 | ) | (68,035 | ) | ||||
- (1)
- Includes stock-based compensation expense as follows:
| |
Year Ended December 31, | Three Months Ended March 31, |
|||||||||||
|---|---|---|---|---|---|---|---|---|---|---|---|---|---|
| |
2011 | 2012 | 2012 | 2013 | |||||||||
| |
(in thousands) |
||||||||||||
Technology and development |
$ | 507 | $ | 422 | $ | 115 | $ | 115 | |||||
Sales and marketing |
670 | 1,020 | 292 | 279 | |||||||||
General and administrative |
1,706 | 1,477 | 393 | 345 | |||||||||
Total stock-based compensation expense |
$ | 2,883 | $ | 2,919 | $ | 800 | $ | 739 | |||||
- (2)
- Pro
forma basic and diluted net loss per share represents net loss divided by the pro forma weighted-average shares of common stock outstanding, as though
the conversion of the preferred stock into common stock occurred on the first day of the relevant period. Pro forma weighted-average shares outstanding reflects the conversion of the preferred stock
(using the if-converted method) into common stock as though the conversion had occurred on the first day of the relevant period (assuming a conversion ratio equal to approximately 1.1664
common shares for each Series F preferred share based on an initial public offering price of $12.00 per share, the midpoint of the price range set forth on the cover page of this prospectus).
Each $1.00 increase in the assumed initial public offering price of $12.00 per share, which is the midpoint of the range set forth on the cover page of this prospectus, would decrease the pro forma
net loss per share by $0.10, assuming that the number of shares offered by us, as set forth on the cover page of this prospectus, remains the same and after deducting estimated underwriting discounts
and commissions. Each $1.00 decrease in the assumed initial public offering price of $12.00 per share, which is the midpoint of the range set forth on the cover page of this prospectus, would increase
the pro forma net loss per share by $0.09, assuming that the number of shares offered by us, as set forth on the cover page of this prospectus, remains the same and after deducting estimated
underwriting discounts and commissions. See the section of this prospectus titled "Offering" for a description of the number of shares issuable upon conversion of our Series F preferred stock
depending on the price at which our shares are sold to the public.
- (3)
- In-stream
advertising revenue is the revenue we generate solely from the sale of in-stream video ads.
- (4)
- We
define Adjusted EBITDA as net loss plus (minus): other (income) expense, net, interest expense, income tax expense, depreciation and amortization expense
and stock-based compensation expense. We have included Adjusted EBITDA in this prospectus because it is a key measure used by our management and board of directors to understand and evaluate our core
operating performance and trends, to prepare and approve our annual budget and to develop short- and long-term operational plans. In particular, we believe that the exclusion of the
expenses eliminated in calculating Adjusted EBITDA can provide a useful measure for period-to-period comparisons of our core business. Accordingly, we believe that Adjusted
EBITDA provides useful information to investors and others in understanding and evaluating our operating results in the same manner as our management and board of directors.
Adjusted EBITDA is a non-GAAP financial measure. Our use of Adjusted EBITDA has limitations as an analytical tool, and you should not consider it in isolation or as a substitute for analysis of our financial results as reported under GAAP. Some of these limitations are: (a) although depreciation and amortization are non-cash charges, the assets being depreciated and amortized may have to be replaced in the future, and Adjusted EBITDA does not reflect cash and capital expenditure requirements for such replacements or for new capital expenditure requirements; (b) Adjusted EBITDA does not reflect changes in, or cash requirements for, our working capital needs; (c) Adjusted EBITDA does not reflect the potentially dilutive impact of equity-based compensation; (d) Adjusted EBITDA does not reflect tax payments that may represent a reduction in cash available to us; and (e) other companies, including companies in our industry, may calculate Adjusted EBITDA or similarly titled measures differently, which reduces its usefulness as a comparative measure.
47
Because of these and other limitations, you should consider Adjusted EBITDA alongside our other GAAP-based financial performance measures, net loss and our other GAAP financial results. The following table presents a reconciliation of Adjusted EBITDA to net loss, the most directly comparable GAAP measure, for each of the periods indicated:
| |
Year Ended December 31, | Three Months Ended March 31, | |||||||||||
|---|---|---|---|---|---|---|---|---|---|---|---|---|---|
| |
2011 | 2012 | 2012 | 2013 | |||||||||
| |
(in thousands) |
||||||||||||
Net loss |
$ | (21,025 | ) | $ | (16,644 | ) | $ | (9,127 | ) | $ | (5,159 | ) | |
Adjustments: |
|||||||||||||
Other expense (income), net |
583 | 8 | 39 | (5 | ) | ||||||||
Interest expense |
321 | 227 | 75 | 56 | |||||||||
Income tax expense |
223 | 280 | 70 | 70 | |||||||||
Depreciation and amortization expense |
6,088 | 5,992 | 1,478 | 1,502 | |||||||||
Stock-based compensation expense |
2,883 | 2,919 | 800 | 739 | |||||||||
Total net adjustments |
10,098 | 9,426 | 2,462 | 2,362 | |||||||||
Adjusted EBITDA |
$ | (10,927 | ) | $ | (7,218 | ) | $ | (6,665 | ) | $ | (2,797 | ) | |
48
MANAGEMENT'S DISCUSSION AND ANALYSIS OF FINANCIAL CONDITION
AND RESULTS OF OPERATIONS
You should read the following discussion and analysis of our financial condition and results of operations in conjunction with the consolidated financial statements and the related notes to those statements included later in this prospectus. In addition to historical financial information, the following discussion contains forward-looking statements that reflect our plans, estimates, beliefs and expectations that involve risks and uncertainties. Our actual results and the timing of events could differ materially from those discussed in these forward-looking statements. Factors that could cause or contribute to these differences include those discussed below and elsewhere in this prospectus, particularly in "Risk Factors" and "Special Note Regarding Forward-Looking Statements."
Overview
We are a leading provider of technology-driven video advertising solutions enabling brand advertisers to engage consumers across multiple internet-connected devices including computers, smartphones, tablets and connected TVs. Our clients include some of the largest brand advertisers in the world including all of the top 10 automakers and 9 of the top 10 consumer packaged goods companies. Our relationships with leading brand advertisers and their agencies have helped us create a robust online video ecosystem that includes more than 500 premium websites and mobile applications, over 200 of which partner with us on an exclusive basis. Our proprietary technology, VideoHub, analyzes in-stream video content, detects viewer and system attributes, and leverages our large repository of stored data to optimize video ad campaigns for brand-centric metrics. VideoHub also provides advertisers and agencies with advanced analytics and measurement tools enabling them to understand why, when and where viewers engage with their video ads.
We derive substantially all of our revenue by delivering in-stream video advertising on behalf of a diversified base of brand advertisers in the United States through the Tremor Video Network. We also recently began licensing VideoHub technology to advertisers and agencies through an intuitive, customizable user interface, which we call VideoHub for Advertisers, or VHA.
We were organized in 2005 and initially we delivered both video display and banner ads, which we refer to as in-banner video ads, and in-stream video ads. In late 2010, we completed the acquisition of ScanScout, Inc., or ScanScout, through which we acquired our differentiating video analysis and optimization technology. In 2011, we enhanced and integrated this technology into our solutions and, consistent with our focus on being a strategic partner for brand advertisers, we decided to focus our business solely on in-stream video advertising and to move away from in-banner video advertising. In-stream video ads are better suited for brand advertisers because they can be served to viewers immediately prior to or during the publisher's content commanding attention when viewers are most engaged as opposed to in-banner video ads, which are served on the periphery of publisher content where viewers may not direct their attention. We believe our market opportunity and growth prospects will be enhanced by our focus on in-stream video ads because such ads are better suited to address advertisers' brand-centric goals. As such, we have increased our technology investments and sales focus on our in-stream products and deemphasized investments in and sales of in-banner products. As a result of our focus on delivering in-stream advertising coupled with our differentiated optimization technology, we have experienced significant growth in our in-stream video advertising revenue. From 2011 to 2012, our in-stream video advertising revenue grew from $75.5 million to $99.7 million, or 32.1%, and for the three months ended March 31, 2012 and 2013, our in-stream video advertising revenue grew from $15.7 million to $24.0 million, or 52.9%. Consistent with our strategy, our revenue from in-banner advertising revenue declined from $14.8 million to $3.8 million from 2011 to 2012. Our revenue from in-banner video ads was $1.2 million and $0.1 million for the three months ended March 31, 2012 and 2013, respectively. We do not expect revenue from in-banner video ads to be meaningful in future periods.
49
To further align the Tremor Video Network with the needs of brand advertisers, we offer a number of performance-based pricing models for in-stream video advertisements. These models include cost per engagement, or CPE, pricing where we are compensated only when viewers actively engage with advertisers' campaigns, such as by interacting with the elements of the video ad through clicks or screen touches or by rolling over certain elements of the video ad for at least three seconds, and cost per video completion, or CPVC, pricing where we are compensated only when a viewer completes the video ad. We believe our performance-based pricing models offer higher gross margins than traditional cost per thousand impressions, or CPM, pricing models, which are based solely on the number of ad impressions delivered, because we are often able to serve our advertisers' performance goals with a lower number of purchased impressions. As viewers increase time spent viewing video on internet-connected devices such as smartphones and tablets, we expect brand advertisers to devote increasing amounts of advertising spend to these channels. Smartphones and tablets are inherently interactive and we believe that our in-stream advertising capabilities and higher margin CPE pricing model is well suited to address the growing market for mobile video ads. As a percentage of total revenue, revenue attributable to performance-based pricing, such as CPE and CPVC, for 2011 and 2012 was 7.9% and 22.7%, respectively, and for the three months ended March 31, 2012 and 2013, was 14.2% and 36.1% respectively. We intend to continue to increase the sales of video ad campaigns with performance-based pricing to drive revenue growth and increased margins.
In 2012, we also began licensing VideoHub technology to advertisers and agencies through VHA. VHA affords advertisers transparency and analytical tools to measure the effectiveness of video ad campaigns across all of their video ad buys, whether or not those campaigns are run through the Tremor Video Network. We are also investing in the development of an enterprise solution for publishers to enable their direct sales force to better monetize their video ad inventory. In 2012 and the three months ended March 31, 2013, we generated $1.7 million and $0.6 million, respectively, of licensing revenue from our advertiser and publisher solutions, and we expect licensing revenue to increase in future periods. We believe that our margins on our licensing revenue will be higher than those for the Tremor Video Network.
We have increased our revenue from $90.3 million in 2011 to $105.2 million in 2012. Over the same period, our gross margin improved from 35.2% to 41.7% due in part to the contribution of revenue derived from CPE and CPVC sales. Our net loss decreased from $21.0 million in 2011 to $16.6 million in 2012. Our Adjusted EBITDA improved from a loss of $10.9 million in 2011 to a loss of $7.2 million in 2012, as we improved the operating leverage in our business. For the three months ended March 31, 2013 as compared to the same period of 2012, our revenue increased from $17.3 million to $24.8 million, or 43.4%, our gross margin improved from 31.9% to 44.1% due in part to the contribution of revenue derived from CPE and CPVC sales, our net loss decreased from $9.1 million to $5.2 million and our Adjusted EBITDA improved from a loss of $6.7 million to a loss of $2.8 million as we continued to improve the operating leverage in our business.
50
Key Metrics
We monitor the key metrics set forth in the table below to help us evaluate growth trends, establish budgets, measure the effectiveness of our sales and marketing efforts and assess our operational efficiencies.
| |
Year Ended December 31, | Three Months Ended March 31, | |||||||||||
|---|---|---|---|---|---|---|---|---|---|---|---|---|---|
| |
2011 | 2012 | 2012 | 2013 | |||||||||
| |
(dollars in thousands) |
||||||||||||
Revenue |
$ | 90,301 | $ | 105,190 | $ | 17,272 | $ | 24,765 | |||||
Gross margin |
35.2 | % | 41.7 | % | 31.9 | % | 44.1 | % | |||||
Net loss |
$ | (21,025 | ) | $ | (16,644 | ) | $ | (9,127 | ) | $ | (5,159 | ) | |
In-stream advertising revenue |
$ | 75,500 | $ | 99,678 | $ | 15,745 | $ | 23,996 | |||||
Adjusted EBITDA |
$ | (10,927 | ) | $ | (7,218 | ) | $ | (6,665 | ) | $ | (2,797 | ) | |
Revenue and Gross Margin
In the past, we generated a significant portion of revenue from the delivery of in-banner video ads. Beginning in 2011, we shifted our focus to in-stream video ads. As a result, revenue from the delivery of in-stream video ads has increased year over year as a percentage of our total revenue, and revenue from the delivery of in-banner video ads has decreased. By the end of 2013, we do not expect to have meaningful revenue from in-banner ads.
Historically, gross margin has been positively affected by campaigns priced on a performance basis. As a percentage of total revenue, revenue attributable to performance-based pricing, such as CPE and CPVC, for 2011 and 2012 was 7.9% and 22.7%, respectively, and for the three months ended March 31, 2012 and 2013, was 14.2% and 36.1%, respectively. We anticipate that there will be a continued shift towards performance-based pricing.
In 2012, we also began to license VideoHub technology to advertisers and agencies through VHA. In the near-term, we are investing in the development of our publisher solution and programmatic buying solution, the enhancement of our VHA solution, and the expansion of our sales and support for these solutions. Over time we expect the licensing portion of our business to become a more significant contributor to our operating results, which we believe would have a positive impact on our gross margin.
Adjusted EBITDA
Adjusted EBITDA represents our net loss before net interest and other expense, taxes, and depreciation and amortization, and adjusted to eliminate the impact of stock-based compensation expense, which is a non-cash item. Adjusted EBITDA is a key measure used by management to evaluate operating performance, generate future operating plans and make strategic decisions regarding the allocation of capital. In particular, the exclusion of certain expenses in calculating Adjusted EBITDA facilitates operating performance comparisons on a period-to-period basis and, in the case of exclusion of the impact of stock-based compensation, excludes an item that we do not consider to be indicative of our core operating performance. Adjusted EBITDA is not a measure calculated in accordance with GAAP. Please see footnote (4) to the table in the section titled "Selected Consolidated Financial Data—Adjusted EBITDA" in this prospectus for a discussion of the limitations of Adjusted EBITDA and a reconciliation of adjusted EBITDA to net loss, the most comparable GAAP measurement, for the years ended December 31, 2011 and 2012, and for the three months ended March 31, 2012 and 2013.
51
Components of Operating Results
We operate in one segment, online video advertising services. The key elements of our operating results include:
Revenue
We generate revenue primarily by delivering in-stream video advertisements for brand advertisers and agencies through the Tremor Video Network. In 2012, we also began selling licenses to advertisers to use VHA.
We generally price delivery of our video ads on a CPM, CPE or CPVC basis. We recognize revenue for video ad delivery through the Tremor Video Network upon the delivery of impressions served for CPM ad campaigns, engagement by the consumer with a video ad for CPE ad campaigns and the completion of a video ad for CPVC ad campaigns. The prices we charge our clients also vary depending upon the ad format chosen and the device type through which the campaign runs, but are generally consistent across computers, smartphones and tablets. We offer our Tremor Video Network solution to advertisers by entering into insertion orders with ad agencies on behalf of advertisers. These insertion orders are cancellable upon short notice and without penalty consistent with standard terms and conditions for the purchase of internet advertising for media buys one year or less published by the Interactive Advertising Bureau.
We recently began generating revenue from licenses of VHA to advertisers and agencies. We provide basic VHA access to advertisers with respect to their video ad campaigns running through the Tremor Video Network and charge a license fee for advanced analytics. We also license VHA to advertisers and agencies for video advertising campaigns running outside the Tremor Video Network. The license fee varies depending upon the level of access to our video advertising analytics and the volume of impressions being analyzed through VHA. We recognize revenue with respect to this solution on a CPM basis based upon the number of impressions being analyzed in a given month. In limited cases, we charge a minimum monthly fee. Typically, our license terms are for one year periods. In 2012, we also generated licensing revenue from a publisher focused solution based on assets acquired from Tube Mogul, Inc., or TubeMogul, in January 2012.
Our revenue recognition policies are discussed in more detail in the section below titled "—Critical Accounting Policies and Significant Judgments and Estimates."
Cost of Revenue
Our cost of revenue primarily represents the video advertising inventory costs under our publisher contracts, third party hosting fees, and third party serving fees incurred to deliver the video ads run through the Tremor Video Network. Cost of revenue also includes costs from our licenses from third party data providers utilized in our VHA solution. Substantially all of our cost of revenue is attributable to video advertising inventory costs under our publisher contracts. We recognize cost of revenue on a publisher-by-publisher basis at the same time as we recognize the associated advertising revenue. Substantially all of our exclusive publisher contracts contain minimum percentage fill rates on qualified video ad requests, which effectively means that we must purchase this inventory from our exclusive publishers even if we lack a video advertising campaign to deliver. We recognize the difference between our contractually required fill rate and the number of video ads actually delivered by us on the publisher's website, if any, as a cost of revenue as of the end of each applicable monthly period. Historically, the impact of the difference between the contractually required fill rate and the number of ads delivered has not been material. Costs owed to publishers but not yet paid are recorded in our consolidated balance sheets as accounts payable and accrued expenses.
52
Operating Expenses
Operating expenses consist of technology and development, sales and marketing, general and administrative and depreciation and amortization expenses. Salaries, incentive compensation, stock-based compensation and other personnel-related costs are the most significant components of each of these expense categories other than depreciation and amortization expenses. We grew from 185 employees at January 1, 2011 to 249 employees at March 31, 2013, and we expect to continue to hire new employees in order to support our anticipated revenue growth. We include stock-based compensation expense in connection with the grant of stock options in the applicable operating expense category based on the respective equity award recipient's function.
Technology and Development Expense. Technology and development expense primarily consists of salaries, incentive compensation, stock-based compensation and other personnel-related costs for development, network operations and engineering personnel. Additional expenses in this category include costs related to the development, quality assurance and testing of new technology and maintenance and enhancement of existing technology and infrastructure as well as consulting, travel and other related overhead. We engage third-party consulting firms for various technology and development efforts, such as documentation, quality assurance and support. Due to the rapid development and changes in our business, we have expensed technology and development expenses in the same year that the costs are incurred. The number of employees in technology and development functions grew from 44 at January 1, 2011 to 68 at March 31, 2013. We intend to continue to invest in our technology and development efforts by hiring additional personnel and by using outside consulting firms for various initiatives. We believe continuing to invest in technology and development efforts is essential to maintaining our competitive position.
Sales and Marketing Expense. Sales and marketing expense primarily consists of salaries, incentive compensation, stock-based compensation and other personnel-related costs for our marketing and creative employees and our advertiser focused, publisher focused and licensing solution focused sales and sales support employees. Additional expenses in this category include marketing programs, consulting, travel and other related overhead. The number of employees in sales and marketing functions grew from 115 at January 1, 2011 to 154 at March 31, 2013. We expect our sales and marketing expense to increase in the foreseeable future as we continue to grow the Tremor Video Network, further increase the number of our licensing solution focused sales and marketing professionals and expand our marketing activities.
General and Administrative Expense. General and administrative expense primarily consists of salaries, incentive compensation, stock-based compensation and other personnel-related costs for business operations, administration, finance and accounting, legal, information systems and human resources employees. Additional expenses in this category include consulting and professional fees, travel, insurance and other corporate expenses. The number of employees in general and administrative functions grew from 26 at January 1, 2011 to 27 at March 31, 2013. We expect our general and administrative expenses to increase in absolute dollars as a result of our preparation to become and operate as a public company and the continuing growth of our business. After the completion of this offering, these expenses will also include costs associated with compliance with the Sarbanes-Oxley Act and other regulations governing public companies, directors' and officers' liability insurance, increased professional services and an enhanced investor relations function.
Depreciation and Amortization Expense. Depreciation and amortization expense primarily consists of our depreciation expense related to investments in property, equipment and software as well as the amortization of intangible assets originating from our acquisitions of ScanScout in December 2010 and Transpera, Inc., or Transpera, in February 2011 and certain intangible assets from TubeMogul in January 2012. These acquired intangible assets include technology, customer relationships, trademarks and trade names and non-competition agreements.
53
Interest and Other Expense
Interest and other expense consists primarily of interest income, interest expense, foreign exchange transaction gains and losses, changes in the fair value of our preferred stock warrant liability, and changes in the fair value of a contingent consideration payment associated with the Transpera acquisition. Interest income is derived from interest received on our cash and cash equivalents. Interest expense consists primarily of the interest incurred on outstanding borrowings under our credit facility.
The fair value of our preferred stock warrant liability is re-measured at the end of each reporting period and any changes in fair value are recognized on our statements of operations as other income or expense. Upon completion of this offering, our preferred stock warrants will automatically, in accordance with their terms, become warrants to purchase our common stock, which will result in the reclassification of the preferred stock warrant liability to additional paid-in capital, and no further changes in fair value will be recognized in other income or expense.
Results of Operations
The following table is a summary of our consolidated statement of operations data for each of the periods indicated. The period-to-period comparisons of the results are not necessarily indicative of our results for future periods.
| |
Year Ended December 31, | Quarter Ended March 31, | |||||||||||||||||||||||
|---|---|---|---|---|---|---|---|---|---|---|---|---|---|---|---|---|---|---|---|---|---|---|---|---|---|
| |
2011 | 2012 | 2012 | 2013 | |||||||||||||||||||||
| |
Amount | Percentage of Revenue |
Amount | Percentage of Revenue |
Amount | Percentage of Revenue |
Amount | Percentage of Revenue |
|||||||||||||||||
| |
(dollars in thousands) |
||||||||||||||||||||||||
Consolidated Statement of Operations Data: |
|||||||||||||||||||||||||
Revenue |
$ | 90,301 | 100.0 | % | $ | 105,190 | 100.0 | % | $ | 17,272 | 100.0 | % | $ | 24,765 | 100.0 | % | |||||||||
Cost of revenue |
58,502 | 64.8 | 61,317 | 58.3 | 11,769 | 68.1 | 13,841 | 55.9 | |||||||||||||||||
Gross profit |
31,799 | 35.2 | 43,873 | 41.7 | 5,503 | 31.9 | 10,924 | 44.1 | |||||||||||||||||
Operating expenses: |
|||||||||||||||||||||||||
Technology and development |
5,900 | 6.5 | 8,144 | 7.7 | 1,651 | 9.6 | 2,697 | 10.9 | |||||||||||||||||
Sales and marketing |
28,829 | 31.9 | 35,042 | 33.3 | 8,522 | 49.3 | 8,843 | 35.7 | |||||||||||||||||
General and administrative |
10,880 | 12.0 | 10,824 | 10.3 | 2,795 | 16.2 | 2,920 | 11.8 | |||||||||||||||||
Depreciation and amortization |
6,088 | 6.8 | 5,992 | 5.7 | 1,478 | 8.6 | 1,502 | 6.1 | |||||||||||||||||
Total operating expenses |
51,697 | 57.2 | 60,002 | 57.0 | 14,446 | 83.7 | 15,962 | 64.5 | |||||||||||||||||
Loss from operations |
(19,898 | ) | (22.0 | ) | (16,129 | ) | (15.3 | ) | (8,943 | ) | (51.8 | ) | (5,038 | ) | (20.4 | ) | |||||||||
Interest and other expense |
(904 | ) | (1.0 | ) | (235 | ) | (0.2 | ) | (114 | ) | (0.7 | ) | (51 | ) | (0.2 | ) | |||||||||
Loss before income taxes |
(20,802 | ) | (23.0 | ) | (16,364 | ) | (15.5 | ) | (9,057 | ) | (52.5 | ) | (5,089 | ) | (20.6 | ) | |||||||||
Income tax expense |
(223 | ) | (0.3 | ) | (280 | ) | (0.3 | ) | (70 | ) | (0.3 | ) | (70 | ) | (0.3 | ) | |||||||||
Net loss |
$ | (21,025 | ) | (23.3 | )% | $ | (16,644 | ) | (15.8 | )% | $ | (9,127 | ) | (52.8 | )% | $ | (5,159 | ) | (20.9 | )% | |||||
54
Comparison of Quarters Ended March 31, 2012 and 2013
| |
Quarter Ended March 31, |
Change Increase/(Decrease) |
|||||||||||
|---|---|---|---|---|---|---|---|---|---|---|---|---|---|
| |
2012 | 2013 | Amount | Percentage | |||||||||
| |
(dollars in thousands) |
|
|
||||||||||
Revenue |
$ | 17,272 | $ | 24,765 | $ | 7,493 | 43.4 | % | |||||
Revenue. The increase in revenue from the three months ended March 31, 2012 compared to the three months ended March 31, 2013 was primarily attributable to a $8.3 million increase in our in-stream video advertising revenue, representing 52.9% growth period-over-period, which included an increased mix of our performance-based ad products compared to our CPM-priced ad products, and a $0.3 million increase in revenue from licensing solutions. The increase in revenue was partially offset by a $1.1 million reduction in in-banner video advertising revenue to $0.1 million due to our decision in 2011 to focus solely on the sale of in-stream video advertising and de-emphasize in-banner advertising.
| |
Quarter Ended March 31, |
Change Increase/(Decrease) |
|||||||||||
|---|---|---|---|---|---|---|---|---|---|---|---|---|---|
| |
2012 | 2013 | Amount | Percentage | |||||||||
| |
(dollars in thousands) |
|
|
||||||||||
Cost of revenue |
$ | 11,769 | $ | 13,841 | $ | 2,072 | 17.6 | % | |||||
Gross profit |
5,503 | 10,924 | 5,421 | 98.5 | |||||||||
Gross margin |
31.9 | % | 44.1 | % | |||||||||
Cost of Revenue, Gross Profit and Gross Margin. The increase in cost of revenue from the three months ended March 31, 2012 compared to the three months ended March 31, 2013 was driven primarily by $1.5 million of increased video advertising inventory costs, resulting from our revenue increase, and a $0.4 million increase in data, ad serving and hosting costs. The increase in our gross profit from the three months ended March 31, 2012 compared to the three months ended March 31, 2013 was driven by a 43.4% increase in revenue partially offset by a 17.6% increase in our cost of revenue.
Historically, our performance-priced ad campaigns have offered higher gross margins than our traditional CPM priced campaigns. The 12.2 percentage point improvement in our gross margin from 2012 to 2013 was primarily attributable to the relative mix of our performance-priced ad campaigns compared to our CPM-priced ad campaigns as well as greater operational efficiency.
| |
Quarter Ended March 31, |
Change Increase/(Decrease) |
|||||||||||
|---|---|---|---|---|---|---|---|---|---|---|---|---|---|
| |
2012 | 2013 | Amount | Percentage | |||||||||
| |
(dollars in thousands) |
|
|
||||||||||
Technology and development |
$ | 1,651 | $ | 2,697 | $ | 1,046 | 63.4 | % | |||||
% of Total revenue |
9.6 | % | 10.9 | % | |||||||||
Technology and Development. The increase in technology and development expense from the three months ended March 31, 2012 compared to the three months ended March 31, 2013 was primarily attributable to a $0.8 million increase in salaries, incentive compensation, stock-based compensation
55
costs and other personnel-related costs associated with the increase in headcount and a $0.2 million increase in consulting expense, professional fees and overhead costs.
| |
Quarter Ended March 31, |
Change Increase/(Decrease) |
|||||||||||
|---|---|---|---|---|---|---|---|---|---|---|---|---|---|
| |
2012 | 2013 | Amount | Percentage | |||||||||
| |
(dollars in thousands) |
|
|
||||||||||
Sales and marketing |
$ | 8,522 | $ | 8,843 | $ | 321 | 3.8 | % | |||||
% of Total revenue |
49.3 | % | 35.7 | % | |||||||||
Sales and Marketing. The increase in sales and marketing expense from the three months ended March 31, 2012 to the three months ended March 31, 2013 was primarily attributable to a $0.4 million increase in salaries, incentive compensation, stock-based compensation and other personnel-related costs, as we increased the number of sales and marketing personnel to support our expanding advertiser base offset by a $0.1 million decrease in consulting and recruiting fees.
| |
Quarter Ended March 31, |
Change Increase/(Decrease) |
|||||||||||
|---|---|---|---|---|---|---|---|---|---|---|---|---|---|
| |
2012 | 2013 | Amount | Percentage | |||||||||
| |
(dollars in thousands) |
|
|
||||||||||
General and administrative |
$ | 2,795 | $ | 2,920 | $ | 125 | 4.5 | % | |||||
% of Total revenue |
16.2 | % | 11.8 | % | |||||||||
General and Administrative. The increase in general and administrative expense from the three months ended March 31, 2012 compared to the three months ended March 31, 2013 was primarily attributable to a $0.4 million increase in salaries, incentive compensation, stock-based compensation costs and other personnel-related costs associated with the increase in headcount offset by a $0.3 million decrease in consulting, recruiting and travel and entertainment expense.
| |
Quarter Ended March 31, |
Change Increase/(Decrease) |
|||||||||||
|---|---|---|---|---|---|---|---|---|---|---|---|---|---|
| |
2012 | 2013 | Amount | Percentage | |||||||||
| |
(dollars in thousands) |
|
|
||||||||||
Depreciation and amortization |
$ | 1,478 | $ | 1,502 | $ | 24 | 1.6 | % | |||||
% of Total revenue |
8.6 | % | 6.1 | % | |||||||||
Depreciation and Amortization. The increase in depreciation and amortization expense from the three months ended March 31, 2012 compared to the three months ended March 31, 2013 was primarily attributable by the increase in amortization due to our acquisition of certain intangible assets from TubeMogul, which we completed in January 2012.
| |
Quarter Ended March 31, |
Change Increase/(Decrease) |
|||||||||||
|---|---|---|---|---|---|---|---|---|---|---|---|---|---|
| |
2012 | 2013 | Amount | Percentage | |||||||||
| |
(dollars in thousands) |
|
|
||||||||||
Interest and other expense |
$ | (114 | ) | $ | (51 | ) | $ | (63 | ) | (55.3 | )% | ||
% of Total revenue |
0.7 | % | 0.2 | % | |||||||||
Interest and Other Expense. The decrease in interest and other expense from the three months ended March 31, 2012 compared to the three months ended March 31, 2013 was primarily attributable to $24,000 related to a reduction in the interest rate related to our revolving credit facility and a $46,000 reduction in mark-to-market expense related to our preferred stock warrant liability.
56
Comparison of Years Ended December 31, 2011 and 2012
| |
Year Ended December 31, | Change Increase/(Decrease) |
|||||||||||
|---|---|---|---|---|---|---|---|---|---|---|---|---|---|
| |
2011 | 2012 | Amount | Percentage | |||||||||
| |
(dollars in thousands) |
|
|
||||||||||
Revenue |
$ | 90,301 | $ | 105,190 | $ | 14,889 | 16.5 | % | |||||
Revenue. The increase in revenue from 2011 to 2012 was primarily attributable to a $24.2 million increase in our in-stream video advertising revenue, representing 32.1% growth, which included an increased mix of our performance-based ad products compared to our CPM priced ad products, and $1.7 million in revenue from licensing solutions. The increase in revenue was partially offset by a $11.0 million reduction to $3.8 million in in-banner video advertising revenue due to our decision at the beginning of 2011 to increase our focus on the sale of in-stream video advertising and de-emphasize in-banner advertising.
| |
Year Ended December 31, | Change Increase/(Decrease) |
|||||||||||
|---|---|---|---|---|---|---|---|---|---|---|---|---|---|
| |
2011 | 2012 | Amount | Percentage | |||||||||
| |
(dollars in thousands) |
|
|
||||||||||
Cost of revenue |
$ | 58,502 | $ | 61,317 | $ | 2,815 | 4.8 | % | |||||
Gross profit |
31,799 | 43,873 | 12,074 | 38.0 | |||||||||
Gross margin |
35.2 | % | 41.7 | % | |||||||||
Cost of Revenue, Gross Profit and Gross Margin. The increase in cost of revenue from 2011 to 2012 was driven primarily by $2.2 million of increased video advertising inventory costs, resulting from our revenue increase, and a $0.6 million increase in data and hosting costs. The increase in our gross profit from 2011 to 2012 was driven by a 16.5% increase in revenue partially offset by a 4.8% increase in our cost of revenue.
Historically, our performance-priced ad campaigns have offered higher gross margins than our traditional CPM pricing. The 6.5 percentage point improvement in our gross margin from 2011 to 2012 was primarily attributable to the relative mix of our performance-priced ad campaigns compared to our CPM-priced ad campaigns as well as greater operational efficiency.
| |
Year Ended December 31, | Change Increase/(Decrease) |
|||||||||||
|---|---|---|---|---|---|---|---|---|---|---|---|---|---|
| |
2011 | 2012 | Amount | Percentage | |||||||||
| |
(dollars in thousands) |
|
|
||||||||||
Technology and development |
$ | 5,900 | $ | 8,144 | $ | 2,244 | 38.0 | % | |||||
% of Total revenue |
6.5 | % | 7.7 | % | |||||||||
Technology and Development. The increase in technology and development expense from 2011 to 2012 was primarily attributable to a $2.0 million increase in salaries, incentive compensation, stock-based compensation costs and other personnel-related costs associated with the increase in headcount described above and a $0.2 million increase in consulting expense and travel and entertainment expense.
| |
Year Ended December 31, | Change Increase/(Decrease) |
|||||||||||
|---|---|---|---|---|---|---|---|---|---|---|---|---|---|
| |
2011 | 2012 | Amount | Percentage | |||||||||
| |
(dollars in thousands) |
|
|
||||||||||
Sales and marketing |
$ | 28,829 | $ | 35,042 | $ | 6,213 | 21.6 | % | |||||
% of Total revenue |
31.9 | % | 33.3 | % | |||||||||
57
Sales and Marketing. The increase in sales and marketing expense from 2011 to 2012 was primarily attributable to a $6.3 million increase in salaries, incentive compensation, stock-based compensation and other personnel-related costs, as we increased the number of sales and marketing personnel to support our expanding advertiser base. In addition, we experienced a $0.2 million increase in travel and entertainment expense as a result of increased marketing activities as well as our increased sales and marketing headcount. This was offset by a $0.3 million decrease in professional development expenses.
| |
Year Ended December 31, | Change Increase/(Decrease) |
|||||||||||
|---|---|---|---|---|---|---|---|---|---|---|---|---|---|
| |
2011 | 2012 | Amount | Percentage | |||||||||
| |
(dollars in thousands) |
|
|
||||||||||
General and administrative |
$ | 10,880 | $ | 10,824 | $ | (56 | ) | (0.5 | )% | ||||
% of Total revenue |
12.0 | % | 10.3 | % | |||||||||
General and Administrative. General and administrative expense was relatively flat from 2011 to 2012.
| |
Year Ended December 31, | Change Increase/(Decrease) |
|||||||||||
|---|---|---|---|---|---|---|---|---|---|---|---|---|---|
| |
2011 | 2012 | Amount | Percentage | |||||||||
| |
(dollars in thousands) |
|
|
||||||||||
Depreciation and amortization |
$ | 6,088 | $ | 5,992 | $ | (96 | ) | (1.6 | )% | ||||
% of Total revenue |
6.8 | % | 5.7 | % | |||||||||
Depreciation and Amortization. The decrease in depreciation and amortization expense from 2011 to 2012 was primarily attributable to the completion of amortization of certain intangible assets acquired in the ScanScout acquisition and the Transpera acquisition, which we completed in February 2011, partially offset by the increase in amortization due to our acquisition of certain intangible assets from TubeMogul, which we completed in January 2012.
| |
Year Ended December 31, | Change Increase/(Decrease) |
|||||||||||
|---|---|---|---|---|---|---|---|---|---|---|---|---|---|
| |
2011 | 2012 | Amount | Percentage | |||||||||
| |
(dollars in thousands) |
|
|
||||||||||
Interest and other expense |
$ | 904 | $ | 235 | $ | (669 | ) | (74.0 | )% | ||||
% of Total revenue |
(1.0 | )% | (0.2 | )% | |||||||||
Interest and Other Expense. The decrease in interest and other expense from 2011 to 2012 was primarily attributable to $0.1 million related to a reduction in the interest rate related to our revolving credit facility and a $0.4 million reduction in mark-to-market expense related to our preferred stock warrant liability.
58
Quarterly Results of Operations
The tables below show our unaudited consolidated quarterly results of operations for each of our eight most recently completed quarters as well as the percentage of total revenue for each line item shown. This information has been derived from our unaudited financial statements, which, in the opinion of management, have been prepared on the same basis as our audited financial statements and include all adjustments, consisting of normal recurring adjustments and accruals, necessary for the fair presentation of the financial information for the quarters presented. This information should be read in conjunction with the consolidated financial statements and related notes included elsewhere in this prospectus.
| |
Three Months Ended | ||||||||||||||||||||||||
|---|---|---|---|---|---|---|---|---|---|---|---|---|---|---|---|---|---|---|---|---|---|---|---|---|---|
| |
June 30, 2011 |
September 30, 2011 |
December 31, 2011 |
March 31, 2012 |
June 30, 2012 |
September 30, 2012 |
December 31, 2012 |
March 31, 2013 |
|||||||||||||||||
| |
(in thousands) |
||||||||||||||||||||||||
Consolidated Statement of Operations Data: |
|||||||||||||||||||||||||
Revenue |
$ | 22,274 | $ | 22,723 | $ | 26,834 | $ | 17,272 | $ | 25,206 | $ | 30,174 | $ | 32,538 | $ | 24,765 | |||||||||
Cost of revenue |
13,917 | 15,178 | 17,483 | 11,769 | 14,980 | 16,704 | 17,864 | 13,841 | |||||||||||||||||
Gross profit |
8,357 | 7,545 | 9,351 | 5,503 | 10,226 | 13,470 | 14,674 | 10,924 | |||||||||||||||||
Operating expenses: |
|||||||||||||||||||||||||
Technology and development |
1,484 | 1,403 | 1,452 | 1,651 | 1,996 | 2,215 | 2,282 | 2,697 | |||||||||||||||||
Sales and marketing |
7,511 | 7,107 | 7,252 | 8,522 | 8,688 | 8,869 | 8,963 | 8,843 | |||||||||||||||||
General and administrative |
2,524 | 2,562 | 2,986 | 2,795 | 2,735 | 2,461 | 2,833 | 2,920 | |||||||||||||||||
Depreciation and amortization |
1,554 | 1,558 | 1,511 | 1,478 | 1,480 | 1,510 | 1,524 | 1,502 | |||||||||||||||||
Total operating expenses |
13,073 | 12,630 | 13,201 | 14,446 | 14,899 | 15,055 | 15,602 | 15,962 | |||||||||||||||||
Loss from operations |
(4,716 | ) | (5,085 | ) | (3,850 | ) | (8,943 | ) | (4,673 | ) | (1,585 | ) | (928 | ) | (5,038 | ) | |||||||||
Interest and other income (expense), net |
58 | (989 | ) | (347 | ) | (114 | ) | (37 | ) | (20 | ) | (64 | ) | (51 | ) | ||||||||||
Loss before income taxes |
(4,658 | ) | (6,074 | ) | (4,197 | ) | (9,057 | ) | (4,710 | ) | (1,605 | ) | (992 | ) | (5,089 | ) | |||||||||
Income tax expense |
(50 | ) | (65 | ) | (45 | ) | (70 | ) | (70 | ) | (70 | ) | (70 | ) | (70 | ) | |||||||||
Net loss |
$ | (4,708 | ) | $ | (6,139 | ) | $ | (4,242 | ) | $ | (9,127 | ) | $ | (4,780 | ) | $ | (1,675 | ) | $ | (1,062 | ) | $ | (5,159 | ) | |
Other Financial Data: |
|||||||||||||||||||||||||
In-stream advertising revenue(1) |
$ | 18,466 | $ | 19,807 | $ | 23,749 | $ | 15,745 | $ | 23,649 | $ | 28,895 | $ | 31,389 | $ | 23,996 | |||||||||
Adjusted EBITDA(2) |
$ | (2,404 | ) | $ | (2,875 | ) | $ | (1,482 | ) | $ | (6,665 | ) | $ | (2,502 | ) | $ | 653 | $ | 1,296 | $ | (2,797 | ) | |||
- (1)
- In-stream revenue is the revenue we generate solely attributable to the sale of in-stream video ads.
- (2)
- We define Adjusted EBITDA as net loss plus (minus): other (income) expense, net, interest expense, income tax expense, depreciation and amortization expense and stock-based compensation expense. Please see footnote (4) to the table of the section of this prospectus titled "Selected Consolidated Financial Data" for more information. Adjusted EBITDA is a non-GAAP financial measure. Below is a reconciliation of Adjusted EBITDA to net loss, the most directly comparable financial measure calculated and presented in accordance with generally accepted accounting principles in the United States, or GAAP.
| |
Three Months Ended | ||||||||||||||||||||||||
|---|---|---|---|---|---|---|---|---|---|---|---|---|---|---|---|---|---|---|---|---|---|---|---|---|---|
| |
June 30, 2011 |
September 30, 2011 |
December 31, 2011 |
March 31, 2012 |
June 30, 2012 |
September 30, 2012 |
December 31, 2012 |
March 31, 2013 |
|||||||||||||||||
| |
(in thousands) |
||||||||||||||||||||||||
Reconciliation of Adjusted EBITDA to Net Loss: |
|||||||||||||||||||||||||
Net loss |
$ | (4,708 | ) | $ | (6,139 | ) | $ | (4,242 | ) | $ | (9,127 | ) | $ | (4,780 | ) | $ | (1,675 | ) | $ | (1,062 | ) | $ | (5,159 | ) | |
Adjustments: |
|||||||||||||||||||||||||
Other (income), expense, net |
(58 | ) | 989 | 347 | 114 | 37 | 20 | 64 | 51 | ||||||||||||||||
Income tax expense |
50 | 65 | 45 | 70 | 70 | 70 | 70 | 70 | |||||||||||||||||
Depreciation and amortization expense |
1,554 | 1,558 | 1,511 | 1,478 | 1,480 | 1,510 | 1,524 | 1,502 | |||||||||||||||||
Stock-based compensation expense |
758 | 652 | 857 | 800 | 691 | 728 | 700 | 739 | |||||||||||||||||
Total net adjustments |
2,304 | 3,264 | 2,760 | 2,462 | 2,278 | 2,328 | 2,358 | 2,362 | |||||||||||||||||
Adjusted EBITDA |
$ | (2,404 | ) | $ | (2,875 | ) | $ | (1,482 | ) | $ | (6,665 | ) | $ | (2,502 | ) | $ | 653 | $ | 1,296 | $ | (2,797 | ) | |||
59
| |
Three Months Ended | ||||||||||||||||||||||||
|---|---|---|---|---|---|---|---|---|---|---|---|---|---|---|---|---|---|---|---|---|---|---|---|---|---|
| |
June 30, 2011 |
September 30, 2011 |
December 31, 2011 |
March 31, 2012 |
June 30, 2012 |
September 30, 2012 |
December 31, 2012 |
March 31, 2013 |
|||||||||||||||||
| |
(as a percentage of revenue) |
||||||||||||||||||||||||
Consolidated Statement of Operations Data: |
|||||||||||||||||||||||||
Revenue |
100.0 | % | 100.0 | % | 100.0 | % | 100.0 | % | 100.0 | % | 100.0 | % | 100.0 | % | 100.0 | % | |||||||||
Cost of revenue |
62.5 | 66.8 | 65.2 | 68.1 | 59.4 | 55.4 | 54.9 | 55.9 | |||||||||||||||||
Gross profit |
37.5 | 33.2 | 34.8 | 31.9 | 40.6 | 44.6 | 45.1 | 44.1 | |||||||||||||||||
Operating expenses: |
|||||||||||||||||||||||||
Technology and development |
6.7 | 6.2 | 5.4 | 9.6 | 7.9 | 7.3 | 7.0 | 10.9 | |||||||||||||||||
Sales and marketing |
33.7 | 31.3 | 27.0 | 49.3 | 34.5 | 29.4 | 27.5 | 35.7 | |||||||||||||||||
General and administrative |
11.3 | 11.3 | 11.1 | 16.2 | 10.8 | 8.2 | 8.7 | 11.8 | |||||||||||||||||
Depreciation and amortization |
7.0 | 6.8 | 5.6 | 8.6 | 5.9 | 5.0 | 4.8 | 6.1 | |||||||||||||||||
Total operating expenses |
58.7 | 55.6 | 49.1 | 83.7 | 59.1 | 49.9 | 48.0 | 64.5 | |||||||||||||||||
Loss from operations |
(21.2 | ) | (22.4 | ) | (14.3 | ) | (51.8 | ) | (18.5 | ) | (5.3 | ) | (2.9 | ) | (20.4 | ) | |||||||||
Interest and other income (expense) |
0.3 | (4.4 | ) | (1.3 | ) | (0.7 | ) | (0.1 | ) | (0.1 | ) | (0.1 | ) | (0.2 | ) | ||||||||||
Loss before income taxes |
(20.9 | ) | (26.8 | ) | (15.6 | ) | (52.5 | ) | (18.6 | ) | (5.4 | ) | (3.0 | ) | (20.6 | ) | |||||||||
Income tax expense |
(0.2 | ) | (0.2 | ) | (0.2 | ) | (0.3 | ) | (0.4 | ) | (0.2 | ) | (0.3 | ) | (0.3 | ) | |||||||||
Net loss |
(21.1 | )% | (27.0 | )% | (15.8 | )% | (52.8 | )% | (19.0 | )% | (5.6 | )% | (3.3 | )% | (20.9 | )% | |||||||||
In-stream advertising revenue(1) |
82.9 | % | 87.2 | % | 88.5 | % | 91.2 | % | 93.8 | % | 95.8 | % | 96.5 | % | 96.9 | % | |||||||||
Adjusted EBITDA(2) |
(10.8 | )% | (12.7 | )% | (5.5 | )% | (38.6 | )% | (9.9 | )% | 2.2 | % | 4.0 | % | (11.3 | )% | |||||||||
- (1)
- In-stream revenue is the revenue we generate solely attributable to the sale of in-stream video ads.
- (2)
- We define Adjusted EBITDA as net loss plus (minus): other (income) expense, net, interest expense, income tax expense, depreciation and amortization expense, and stock-based compensation expense. Please see footnote (4) to the table of the section of this prospectus titled "Selected Consolidated Financial Data" for more information. Adjusted EBITDA is a non-GAAP financial measure. Below is a reconciliation of Adjusted EBITDA to net loss, the most directly comparable financial measure calculated and presented in accordance with GAAP.
| |
Three Months Ended | ||||||||||||||||||||||||
|---|---|---|---|---|---|---|---|---|---|---|---|---|---|---|---|---|---|---|---|---|---|---|---|---|---|
| |
June 30, 2011 |
September 30, 2011 |
December 31, 2011 |
March 31, 2012 |
June 30, 2012 |
September 30, 2012 |
December 31, 2012 |
March 31, 2013 |
|||||||||||||||||
| |
(as a percentage of revenue) |
||||||||||||||||||||||||
Reconciliation of Adjusted EBITDA to Net Loss: |
|||||||||||||||||||||||||
Net loss |
(21.1 | )% | (27.0 | )% | (15.8 | )% | (52.8 | )% | (19.0 | )% | (5.6 | )% | (3.3 | )% | (20.9 | )% | |||||||||
Adjustments: |
|||||||||||||||||||||||||
Other (income), expense, net |
(0.3 | ) | 4.4 | 1.3 | 0.7 | 0.1 | 0.1 | 0.1 | 0.2 | ||||||||||||||||
Income tax expense |
0.2 | 0.2 | 0.2 | 0.3 | 0.4 | 0.2 | 0.3 | 0.3 | |||||||||||||||||
Depreciation and amortization expense |
7.0 | 6.8 | 5.6 | 8.6 | 5.9 | 5.0 | 4.8 | 6.1 | |||||||||||||||||
Stock-based compensation expense |
3.4 | 2.9 | 3.2 | 4.6 | 2.7 | 2.5 | 2.1 | 3.0 | |||||||||||||||||
Total net adjustments |
10.3 | 14.3 | 10.3 | 14.2 | 9.1 | 7.8 | 7.3 | 9.6 | |||||||||||||||||
Adjusted EBITDA |
(10.8 | )% | (12.7 | )% | (5.5 | )% | (38.6 | )% | (9.9 | )% | 2.2 | % | 4.0 | % | (11.3 | )% | |||||||||
Quarterly Trends; Seasonality
Our overall operating results fluctuate from quarter to quarter as a result of a variety of factors, some of which are outside our control. We have experienced rapid growth since our inception. For instance, we migrated our business from in-banner video advertising to in-stream video advertising and placed a greater focus on performance-based pricing over the last two years. These changes have resulted in substantial growth in our revenue and corresponding increases in operating expenses to support our growth. Our operating results were impacted by relationships with new and existing advertisers and publishers, changes in our investment in sales and marketing and technology and development from quarter to quarter, and increases in employee headcount. Our historical results are not necessarily indicative of the results to be expected in the future.
Our quarterly revenue has increased from $22.3 million for the quarter ended June 30, 2011 to $24.8 million for the quarter ended March 31, 2013, and our gross margin has increased from 37.5% to 44.1% over the same period. Our increase in quarterly revenue was mainly due to an increased number of advertisers using the Tremor Video Network and increased spending from our existing advertisers as well an increased percentage of our campaigns priced on a performance basis. We believe revenue for the second and third quarters of 2011 was relatively flat due to a reduction in video advertising spending because of uncertainty and volatility caused by the U.S. budget and European financial crises during the third quarter of 2011. Our increase in gross margin in 2012 has been largely the result of an
60
increased percentage of our campaigns priced on a performance basis. Our in-stream advertising revenue as a percentage of revenue has increased for each quarter from June 30, 2011 through March 31, 2013, as we shifted our focus away from the delivery of in-banner video ads to in-stream video ads.
Our revenue also tends to be seasonal in nature, with the third and fourth quarters of each calendar year historically representing the largest percentage of our total revenue for the year and the first quarter of each calendar year historically representing the lowest percentage of our total revenue for the year. Many of the brand advertisers in the verticals we serve spend significant portions of their advertising budgets during the third quarter, in connection with summer, back to school and entertainment events, and in the fourth quarter, in connection with the holiday season. During the first quarter, our brand advertisers generally devote less of their budgets to ad spending, and as a result, our exclusive publishers generally make a larger proportion of their ad inventory available to us. This combination generally results in lower revenue and gross margins for us during the first quarter of each calendar year. Our revenue for the first quarter of 2012 was adversely impacted by the level of overall spending in the video advertising industry as well as by the seasonal spending trends in the video advertising industry.
Liquidity and Capital Resources
Working Capital
The following table summarizes our cash, cash equivalents and short-term investments, accounts receivable and working capital for the periods indicated:
| |
As of December 31, |
As of March 31, |
||||||||
|---|---|---|---|---|---|---|---|---|---|---|
| |
2011 | 2012 | 2013 | |||||||
| |
|
|
(unaudited) |
|||||||
| |
(dollars in thousands) |
|||||||||
Cash, cash equivalents and short-term investments |
$ | 40,366 | $ | 32,533 | $ | 31,533 | ||||
Accounts receivable, net of allowances |
33,839 | 36,011 | 30,363 | |||||||
Working capital |
49,601 | 39,892 | 37,334 | |||||||
Our cash and cash equivalents at March 31, 2013 were held for working capital purposes. We do not enter into investments for trading or speculative purposes. Our policy is to invest any cash in excess of our immediate requirements in investments designed to preserve the principal balance and provide liquidity. Accordingly, our cash and cash equivalents are invested primarily in demand deposit accounts and money market funds that are currently providing only a minimal return.
Sources of Liquidity
To date, we have funded our operations principally through private placements of our capital stock and bank borrowings. We have raised $118.6 million, net of costs and expenses, from the sale of preferred stock.
We are party to a loan and security agreement with Silicon Valley Bank, which we refer to as our credit facility. Pursuant to the credit facility, we can incur revolver borrowings up to the lesser of $25.0 million and a borrowing base equal to 80.0% of eligible accounts receivable. Any outstanding principal amount must be paid at maturity. Interest accrues at a floating rate equal to the lender's prime rate plus 0.5% and is payable monthly. We are charged a fee of 0.2% of any unused borrowing capacity. This fee is payable quarterly but no fee is charged for a particular quarter if the average principal amount of borrowings during such quarter is more than $10.0 million. The credit facility matures in December 2014. As of March 31, 2013, we had $6.0 million aggregate principal amount of revolver borrowings outstanding which accrued interest at 3.75%.
61
The credit facility contains customary conditions to borrowings, events of default and negative covenants, including covenants that restrict our ability to dispose of assets, merge with or acquire other entities, incur indebtedness, incur encumbrances, make distributions to holders of our capital stock, make investments or engage in transactions with our affiliates. We are also subject to a financial covenant with respect to minimum monthly working capital levels. Our obligations under the credit facility are secured by substantially all of our assets other than our intellectual property, although we have agreed not to encumber any of our intellectual property without the lender's prior written consent. We were in compliance with all covenants as of March 31, 2013.
We have issued the lender (1) a warrant to acquire 35,520 shares of our Series A preferred stock at an exercise price of $1.2669, (2) a warrant to acquire 33,930 shares of our Series B-1 preferred stock at an exercise price of $4.8629 and (3) a warrant to acquire 31,659 shares of our Series C preferred stock at an exercise price of $3.7904.
Operating and Capital Expenditure Requirements
We believe our existing cash balances will be sufficient to meet our anticipated cash requirements through at least the next 12 months. During this period, we expect our capital expenditure requirements to be approximately $2.0 million. If our available cash balances, net proceeds from this offering and available borrowings under our credit facility are insufficient to satisfy our liquidity requirements, we will need to raise additional funds to support our operations, and such funding may not be available to us on acceptable terms, or at all. If we are unable to raise additional funds when needed, our operations and ability to execute our business strategy could be adversely affected. We may seek to raise additional funds through equity, equity-linked or debt financings. If we raise additional funds through the incurrence of indebtedness, such indebtedness would have rights that are senior to holders of our equity securities and could contain covenants that restrict our operations. Any additional equity financing may be dilutive to our stockholders.
Historical Cash Flows
The following table summarizes our historical cash flows for the periods indicated:
| |
As of and for the Year Ended December 31, |
As of and for the Three Months Ended March 31, |
|||||||||||
|---|---|---|---|---|---|---|---|---|---|---|---|---|---|
| |
2011 | 2012 | 2012 | 2013 | |||||||||
| |
|
|
(unaudited) |
||||||||||
| |
(dollars in thousands) |
||||||||||||
Cash (used in) provided by: |
|||||||||||||
Operating activities |
$ | (18,797 | ) | $ | (5,103 | ) | $ | 3,740 | $ | (815 | ) | ||
Investing activities |
(1,197 | ) | 5,547 | 3,659 | (137 | ) | |||||||
Financing activities |
35,940 | 433 | 44 | 46 | |||||||||
Operating Activities
Cash used in operating activities is primarily influenced by the amount of cash we invest in personnel and infrastructure to support the anticipated growth of our business and the increase in the number of advertisers using our solutions. Cash used in operating activities has typically been generated from net losses and by changes in our operating assets and liabilities, particularly in the areas of accounts receivable and accounts payable and accrued expenses, adjusted for non-cash expense items such as depreciation, amortization and stock-based compensation.
For the three months ended March 31, 2013, our net cash used in operating activities was $0.8 million and consisted of a net loss of $5.2 million, partially offset by $2.3 million in adjustments for non-cash items and $2.1 million of cash provided by working capital. Net loss was primarily driven by expansion of our operations and by our investment in technology and development personnel to facilitate our growth. Adjustments for non-cash items primarily consisted of depreciation and
62
amortization expense of $1.5 million, non-cash stock compensation expense of $0.7 million and bad debt expense of $0.1 million. The increase in cash resulting from changes in working capital primarily consisted of an increase in operating cash flow due to a $5.6 million decrease in accounts receivable, as well as a $0.2 million increase in deferred revenue as a result of more clients prepaying for the delivery of video ads. This was partially offset by a $3.3 million decrease in accounts payable and accrued expenses and accrued cost of revenue, driven primarily by an decrease in inventory costs under our publisher contracts, offset by an increase in accrued payroll and payroll related expenses resulting from an increase in the number of our employees. In addition, there was an increase in prepaid expenses and other current assets of $0.5 million, primarily the result of additional deposit requirements for new office space and future advertising and marketing events and professional development events.
In 2012, our net cash used in operating activities was $5.1 million and consisted of a net loss of $16.6 million, partially offset by $9.0 million in adjustments for non-cash items and $2.5 million of cash provided by working capital. Net loss was primarily driven by expansion of our operations and by our investment in technology and development personnel to facilitate our growth. Adjustments for non-cash items primarily consisted of non-cash stock compensation expense of $2.9 million, depreciation and amortization expense of $6.0 million and bad debt expense of $0.1 million. The increase in cash resulting from changes in working capital primarily consisted of an increase in operating cash flow due to a $4.8 million increase in accounts payable and accrued expenses and accrued cost of revenue, driven primarily by an increase in inventory costs under our publisher contracts, and an increase in accrued payroll and payroll related expenses resulting from an increase in the number of our employees. In addition there was a $0.2 million increase in deferred revenue as a result of more clients prepaying for the delivery of video ads. This was partially offset by an increase in accounts receivable of $2.2 million, primarily driven by increased revenue during the year as we continue to expand our operations, an increase in prepaid expenses and other current assets of $0.3 million, primarily the result of additional deposit requirements for new office space and future advertising and marketing events and professional development events.
In 2011, our net cash used in operating activities was $18.8 million and consisted of a net loss of $21.0 million and a $7.1 million decrease in cash resulting from changes in working capital, partially offset by $9.3 million in adjustments for non-cash items. Net loss was primarily driven both by expansion of our operations and by our investment in technology and development and personnel to facilitate our growth. Adjustments for non-cash items primarily consisted of non-cash stock compensation expense of $2.9 million, depreciation and amortization expense of $6.1 million and mark-to-market expense of $0.3 million. The increased depreciation and amortization expense primarily related to increased capital expenditure requirements and our intangible assets resulting from the acquisition of a business. The decrease in cash resulting from changes in working capital primarily consisted of an increase in accounts receivable of $4.4 million, primarily driven by increased revenue during the year as we continued to expand our operations. Additionally, there was a $3.1 million decrease in accounts payable and accrued expenses and accrued cost of revenue, driven primarily by an increase in inventory costs under our publisher contracts, and an increase in accrued payroll and payroll related expenses resulting from an increase in the number of our employees. This was partially offset by an increase in cash flow due to a $0.4 million increase in deferred rent primarily due to several new office leases contracted during 2012.
Investing Activities
Our investing activities have consisted primarily of purchases of property and equipment, as well as business acquisitions.
For the three months ended March 31, 2013, our net cash used in investing activities was $0.1 million used in the purchase of property and equipment.
In 2012, net cash provided by investing activities was $5.5 million and consisted of $8.7 million in maturities of short-term investments, partially offset by $2.0 million paid as part of an acquisition and $1.2 million used in the purchase of property and equipment.
63
In 2011, net cash used in investing activities was $1.2 million and consisted of $0.5 million of net purchases of short-term investments and $0.7 million used in the purchase of property and equipment.
Financing Activities
Our financing activities have consisted primarily of the issuance of preferred stock, proceeds from the exercise of stock options, and borrowings and repayments under our credit facility.
For the three months ended March 31, 2013, our net cash provided by financing activities was $46,000 received upon the exercise of stock options.
In 2012, net cash provided by financing activities was $0.4 million received upon the exercise of stock options.
In 2011, net cash provided by financing activities was $35.9 million and consisted of $35.7 million in net proceeds from our Series F preferred stock financing and $0.3 million in cash received upon the exercise of stock options, partially offset by $0.1 million used to repurchase common stock from three of our employees.
Contractual Obligations
The following table discloses aggregate information about material contractual obligations and periods in which payments were due as of December 31, 2012. Future events could cause actual payments to differ from these estimates.
| |
Payment due by period | |||||||||||||||
|---|---|---|---|---|---|---|---|---|---|---|---|---|---|---|---|---|
Contractual Obligations
|
Total | Less than 1 year |
1-3 years | 3-5 years | More than 5 years |
|||||||||||
| |
(in thousands) |
|||||||||||||||
Operating lease obligations |
$ | 9,924 | $ | 1,615 | $ | 3,948 | $ | 3,003 | $ | 1,358 | ||||||
Purchase obligations |
620 | 281 | 339 | — | — | |||||||||||
Total |
$ | 10,544 | $ | 1,896 | $ | 4,287 | $ | 3,003 | $ | 1,358 | ||||||
The amounts in the table above are associated with agreements that are enforceable and legally binding, which specify significant terms including payment terms related to services and the approximate timing of the transaction. Obligations under the contract that we can cancel without a significant penalty are not included in the table.
The table above does not reflect revolver borrowings under our credit facility.
Off-Balance Sheet Arrangements
As of March 31, 2013, we did not have any off-balance sheet arrangements, as defined in Item 303(a)(4)(ii) of SEC Regulation S-K, such as the use of unconsolidated subsidiaries, structured finance, special purpose entities or variable interest entities.
Critical Accounting Policies and Significant Judgments and Estimates
Our management's discussion and analysis of our financial condition and results of operations is based on our consolidated financial statements, which have been prepared in accordance with GAAP. The preparation of these consolidated financial statements requires us to make estimates and assumptions that affect the reported amounts of assets and liabilities, disclosure of contingent assets and liabilities at the date of the consolidated financial statements and the reported amounts of revenue and expenses during the reported period. In accordance with GAAP, we base our estimates on
64
historical experience and on various other assumptions that we believe are reasonable under the circumstances. Actual results may differ from these estimates under different assumptions or conditions.
Critical accounting policies and estimates are those we consider to be the most important to the portrayal of our financial condition and results of operations because they require the most difficult, subjective or complex judgments, often as a result of the need to make estimates about the effect of matters that are inherently uncertain. Our critical accounting policies and estimates include those related to the following:
Revenue Recognition
We generate revenue primarily from the delivery of in-stream video advertisements for brand advertisers and agencies through the Tremor Video Network. We also generate revenue from selling licenses to advertisers, agencies and publishers. Revenue is recognized when the related services are delivered based on the specific terms of the contract, which are commonly based on the number of impressions delivered or by the actions of viewers. We recognize revenue when four basic criteria are met: (1) persuasive evidence exists of an arrangement with the client reflecting the terms and conditions under which the services will be provided; (2) services have been provided or delivery has occurred; (3) the fee is fixed or determinable; and (4) collection is reasonably assured. Collectability is assessed based on a number of factors, including the creditworthiness of a client and transaction history. Amounts billed or collected in excess of revenue recognized are included as deferred revenue.
We recognize revenue from the delivery of video ads in the period in which the video ads are delivered. Specifically, we recognize revenue for video ad delivery through the Tremor Video Network upon the delivery of each impression served for CPM ad campaigns, engagement by the consumer with a video ad for CPE ad campaigns or the completion of a video ad by the consumer for CPVC ad campaigns. These actions are verified primarily by a combination of third party reporting systems and, to a lesser extent, our internal systems.
In the normal course of business, we act as an intermediary in executing transactions with third parties. The determination of whether revenue should be reported on a gross or net basis is based on an assessment of whether we are acting as the principal or an agent in our transactions. In determining whether we act as the principal or an agent, we follow the accounting guidance for principal-agent considerations. The determination of whether we are acting as a principal or an agent in a transaction involves judgment and is based on an evaluation of the terms of each arrangement. While none of the factors individually are considered presumptive or determinative, because we are the primary obligor and are responsible for (1) identifying and contracting with third-party advertisers, (2) establishing the selling prices of the video ads sold, (3) performing all billing and collection activities, including retaining credit risk, and (4) bearing sole responsibility for fulfillment of the advertising, we act as the principal in these arrangements and therefore report revenue earned and costs incurred related to these transactions on a gross basis.
The license fees for our VHA and publisher solutions are based on the number of impressions being analyzed through these solutions. We recognize revenue with respect to these solutions on a CPM basis based on the number of impressions being analyzed in a given month. Typically, our license terms are for one year periods.
Accounts Receivable, Net of Allowances for Doubtful Accounts
We carry our accounts receivable at net realizable value. On a periodic basis, our management evaluates our accounts receivable and determines whether to provide an allowance or if any accounts should be written down and charged to expense as a bad debt. The evaluation is based on a past history of collections, current credit conditions, the length of time the account is past due and a past
65
history of write-downs. A receivable is considered past due if we have not received payments based on agreed-upon terms. We generally do not require any security or collateral to support our receivables
Business Combinations
In business combinations, we determine the acquisition purchase price as the sum of the consideration we provide. The underlying principles require that we recognize separately from goodwill the assets acquired and the liabilities assumed, generally at their acquisition date fair values. Goodwill as of the acquisition date is measured as the excess of consideration transferred and the net of the acquisition date fair values of the assets acquired and the liabilities assumed. While we use our best estimates and assumptions as a part of the purchase price allocation process to accurately value assets acquired and liabilities assumed at the acquisition date, our estimates are inherently uncertain and subject to refinement. As a result, during the measurement period, which may be up to one year from the acquisition date, we may record adjustments to the assets acquired and liabilities assumed with the corresponding offset to goodwill. Upon the conclusion of the measurement period or final determination of the values of assets acquired or liabilities assumed, whichever comes first, any subsequent adjustments are recorded in the consolidated statements of operations. The direct transaction costs associated with the business combination are expensed as incurred.
When we issue stock-based awards to an acquired company's selling stockholders, we evaluate whether the awards are contingent consideration or compensation for post-business combination services. Our evaluation includes, among other things, whether the vesting of the stock-based awards is contingent on the continued employment of the selling stockholder beyond the acquisition date. If continued employment is required for vesting, the awards are treated as compensation for post-acquisition services and recognized as future compensation expense over the required service period.
Goodwill and Intangible Assets
Goodwill represents the excess of the purchase price in a business combination over the fair value of net tangible and intangible assets acquired. Goodwill is not amortized, but rather is subject to an impairment test.
Goodwill acquired in business combinations are assigned to the reporting unit that is expected to benefit from the combination as of the acquisition date. We assesses goodwill for impairment, using a qualitative process, annually as of October 1, or more frequently if an event occurs or circumstances change that would more likely than not reduce the fair value of a reporting unit below its carrying value. We operate as one operating segment as a singular reporting unit for goodwill impairment testing purposes. We adopted Accounting Standards Update, or ASU, 2011-08, "Testing Goodwill for Impairment," which gives companies the option to qualitatively assess whether it is more likely than not that the fair value of a reporting unit is less than its carrying value. If it is not more likely than not that the fair value of the reporting unit is less than its carrying value, no further assessment of that reporting unit's goodwill is necessary. If it is more likely than not that the fair value of the reporting unit is less than its carrying value, then the goodwill must be tested using a two-step process based on prior accounting guidance, and if the carrying value of a reporting unit's goodwill exceeds its implied fair value, an impairment loss equal to the excess is recorded. In performing our qualitative assessment, we considered a number of factors, including macroeconomic conditions, the market for our industry, any developments with respect to our operating costs, the financial performance of our reporting unit, any changes to management or key personnel, and any changes to our intangible assets and their value. We concluded that there were no negative developments with respect to these factors that indicated that any goodwill is at risk of impairment.
For 2011 and 2012, no impairment losses have been identified, and no reporting unit was at risk of impairment, including under the first step of the two-step impairment determination process.
66
Intangible assets that are not considered to have an indefinite useful life are amortized over their estimated useful lives on a straight-line method as follows:
Technology |
5 to 7 years | |
Customer relationships |
5 to 10 years | |
Trademarks and trade names |
5 to 7 years | |
Non-competition agreements |
1 year |
Intangible assets are reviewed for impairment whenever events or changes in circumstances such as, but not limited to, significant declines in revenue, earnings or cash flows or material adverse changes in the business climate indicate that the carrying amount of an asset may be impaired. There were no indicators of impairment to intangible assets for 2011 and 2012.
Stock-Based Compensation
We have granted stock options with the following exercise prices for the dates reflected below:
Grant Date
|
Number of Options Granted |
Exercise Price Per Share |
Common Stock Fair Market Value Per Share at Grant Date |
Aggregate Fair Market Value of Options Granted |
|||||||||
|---|---|---|---|---|---|---|---|---|---|---|---|---|---|
April 19, 2012 |
143,000 | (1)(2) | $ | 5.01 | $ | 5.01 | $ | 716,430 | |||||
April 25, 2012 |
33,333 | (2) | 5.01 | 5.01 | 167,000 | ||||||||
July 26, 2012 |
1,229,338 | (2) | 5.01 | 5.01 | 6,158,987 | ||||||||
August 7, 2012 |
33,333 | 5.01 | 5.01 | 167,000 | |||||||||
August 8, 2012 |
36,666 | (2) | 5.01 | 5.01 | 183,700 | ||||||||
November 16, 2012 |
429,666 | 5.60 | 5.60 | 2,403,985 | |||||||||
December 7, 2012 |
60,000 | 5.60 | 5.60 | 335,700 | |||||||||
March 5, 2013 |
266,666 | 5.90 | 5.90 | 1,572,000 | |||||||||
May 9, 2013 |
158,000 | 8.15 | 8.15 | 1,286,910 | |||||||||
May 23, 2013 |
100,000 | 8.15 | 8.15 | 814,500 | |||||||||
June 4, 2013 |
41,666 | 8.15 | 8.15 | 339,370 | |||||||||
- (1)
- Options exercisable for an additional 22,222 shares of our common stock granted on this date with an exercise price of $6.06 per share were cancelled prior to our option repricing on July 26, 2012 as a result of employee terminations.
- (2)
- On July 26, 2012 and August 8, 2012, we repriced options to purchase 1,089,338 and 36,666 shares of our common stock, respectively, to $5.01 per share, the estimated fair market value of our common stock on such dates, from $6.06 per share. Of the 1,089,338 options repriced on July 26, 2012, 106,333 of such options were originally granted on April 19, 2012 and 33,333 of such options were originally granted on April 25, 2012 and the remaining options were granted prior to April 2012. These options had a Black-Scholes option fair values ranging from $2.205 to $2.34. In accordance with ASC Topic 718, we incurred a one-time stock compensation charge of approximately $11,000 on the incremental value of the vested repriced options. In addition, we recorded an additional incremental value of $0.3 million related to the unvested repriced options, which will be amortized over their remaining vesting period.
Based upon the assumed initial public offering price of $12.00 per share, which is the midpoint of the estimated offering price range set forth on the cover page of this prospectus, the aggregate intrinsic value of options outstanding as of March 31, 2013 was $59.7 million, of which $39.6 million related to vested options and $20.1 million related to unvested options.
We account for stock-based compensation in accordance with the authoritative guidance on stock compensation. Under the fair value recognition provisions of this guidance, stock-based compensation is measured at the grant date based on the fair value of the award and is recognized as expense, net of estimated forfeitures, over the requisite service period, which is generally the vesting period of the respective award.
Determining the fair value of stock-based awards at the grant date requires judgment. We use the Black-Scholes option-pricing model to determine the fair value of stock options. The determination of the grant date fair value of options using an option-pricing model is affected by our estimated common
67
stock fair value as well as assumptions regarding a number of other complex and subjective variables. These variables include the fair value of our common stock, the expected term of the options, our expected stock price volatility, risk-free interest rates, and expected dividends, which are estimated as follows:
- •
- Fair value of our common stock. Because our stock is not
publicly traded, we must estimate the fair value of common stock, as discussed in "—Common Stock Valuations" below.
- •
- Expected term. The expected term represents the period
that our stock-based awards are expected to be outstanding. As we do not have sufficient historical experience for determining the expected term of the stock option awards granted, we have based our
expected term on the simplified method, which represents the average period from vesting to the expiration of the award.
- •
- Expected volatility. As we do not have a trading history
for our common stock, the expected stock price volatility for our common stock was estimated by taking the average historic price volatility for industry peers based on daily price observations over a
period equivalent to the expected term of the stock option grants. We did not rely on implied volatilities of traded options in our industry peers' common stock because the volume of activity was
relatively low. We intend to continue to consistently apply this process using the same or similar public companies until a sufficient amount of historical information regarding the volatility of our
own common stock share price becomes available.
- •
- Risk-free rate. The risk-free
interest rate is based on the yields of U.S. Treasury securities with maturities similar to the expected term of the options for each option group.
- •
- Dividend yield. We have never declared or paid any cash dividends and do not presently plan to pay cash dividends in the foreseeable future. Consequently, we used an expected dividend yield of zero.
If any of the assumptions used in the Black-Scholes model changes significantly, stock-based compensation for future awards may differ materially compared with the awards granted previously.
The following table presents the weighted-average assumptions used to estimate the fair value of options granted during the periods presented:
| |
Year Ended December 31, | Three Months Ended March 31, |
||||
|---|---|---|---|---|---|---|
| |
2011 | 2012 | 2013 | |||
| |
|
|
(unaudited) |
|||
Volatility |
54%–56% | 56%–57% | 47% | |||
Risk-free interest rate |
1.36%–2.87% | 0.60%–1.17% | 1.01%–1.03% | |||
Expected life (in years) |
6.77 | 5.12–6.09 | 5.97–6.07 | |||
Dividend yield |
—% | —% | —% | |||
Common Stock Valuations
The fair value of the common stock underlying our stock options was determined by our board of directors, which intended all options granted to be exercisable at a price per share not less than the per share fair value of our common stock underlying those options on the date of grant. The valuations of our common stock were determined in accordance with the guidelines outlined in the American Institute of Certified Public Accountants Practice Aid, Valuation of Privately-Held-Company Equity Securities Issued as Compensation. The assumptions we used in the valuation model were based on future expectations combined with management judgment. In the absence of a public trading market, our board of directors with input from management exercised significant judgment and considered
68
numerous objective and subjective factors to determine the fair value of our common stock as of the date of each option grant, including the following factors:
- •
- contemporaneous third-party valuations performed at periodic intervals by a valuation firm conducted as of June 30,
2012, September 30, 2012, December 31, 2012 and March 31, 2013;
- •
- a series of transactions from September 2011 through October 2012 pursuant to which one of our preferred stockholders
acquired an aggregate of 2,101,887 shares of our common stock from certain of our stockholders for an aggregate purchase price of $10.1 million and a weighted average per share price of $4.80;
- •
- the prices, rights, preferences and privileges of our preferred stock relative to the common stock;
- •
- the purchases of shares of preferred stock by venture capital firms;
- •
- our operating and financial performance and forecast;
- •
- current business conditions;
- •
- significant new customer wins;
- •
- our stage of development;
- •
- the likelihood of achieving a liquidity event for the shares of common stock underlying these stock options, such as an
initial public offering or sale of our company, given prevailing market conditions;
- •
- any adjustment necessary to recognize a lack of marketability for our common stock;
- •
- the market performance of comparable publicly-traded technology companies;
and
- •
- U.S. and global capital market conditions.
In order to determine the fair value of our common stock underlying option grants, we considered contemporaneous valuations of our stock from a third-party valuation firm that provided us with their estimate of our enterprise value. Our board of directors determined the best approach to determine the fair value of our stock options was to use a blend of market and income approaches to determine our enterprise value and the probability-weighted expected return model, or PWERM, to determine the related allocation. The market-based approach considers multiples of financial metrics based on both acquisitions and trading multiples of a selected per group of technology companies. Future and present values for the common stock were calculated taking into consideration the preferred share liquidation and conversion rights. PWERM models potential future liquidity events and applies probabilities to each scenario. These future liquidity events are then discounted to present value and, after applying the relevant probability for each potential event, result in a probability-weighted equity value of the company. In addition, we considered secondary sales of our common stock that occurred during the period leading up to the valuation date, and ultimately weighted the PWERM estimated value and the weighted average price per share of such secondary sales to determine the fair value of our common stock.
A database of all publicly-traded companies was screened to determine a broad industry sector and potential peer-group companies. This initial screen selected companies that primarily operated in the information technology software industry and that (1) traded on one of the major U.S. stock exchanges and (2) traded at a common per share value of greater than one dollar. From this industry sector list, comparable companies were selected based on several factors, including business description, business model, primary industry and revenue growth. More specifically, the comparable company selection focused on companies that provide advertising, marketing and media-based software solutions. Furthermore, companies with historical and projected revenue growth comparable to ours were selected.
69
The selected group of comparable companies was consistently used in both the market and income approaches. Additionally, this same comparable company group was partially relied upon in determining appropriate multiples in the initial public offering, or IPO, scenario of the PWERM described more fully below. Where relevant, the comparable company group was held constant in determining per share value for all equity classes.
Significant factors considered by our board of directors in determining the fair market value of our common stock at these grant dates included:
April 2012. The U.S. economy and financial markets continued to strengthen during the first quarter of 2012. We also continued to see strength in our business during this period. While total revenue decreased from $18.5 million for the three months ended March 31, 2011 to $17.3 million for the three months ended March 31, 2012, we began to see the impact of the increased adoption of our performance-priced video ads. We performed the PWERM allocation methodology to value our common stock as of September 6, 2011. Management's estimates of the probability of each scenario were 25% for an IPO, 30% for a strategic merger or sale, 40% for continuing as a private company, and 5% for dissolution. We determined the enterprise value under the market approach using the financial information of companies in our peer group and under the income approach using a weighted-average cost of capital or discount rate of 20%. The discount rate was based on several company-specific and general economic factors, primarily the strength in our business and the U.S. economy and markets as a whole, and their indications of economic risk. Based on these factors, the PWERM analysis resulted in an estimated fair market value of our common stock of $6.06 per share. Based on this valuation and other factors described above, our board of directors granted options to purchase 198,333 shares of common stock with an exercise price of $6.06 per share. After the April 2012 option grants, we determined that the September 6, 2011 valuation report, which our board of directors, relied in part in determining the fair value of our common stock did not take into consideration $9.3 million of secondary sales of common stock, which occurred between September 2011 and April 2012 at a weighted average purchase price of $4.85 per share. In July 2012 and August 2012, our board of directors repriced 139,666 and 36,666, respectively, of these options to $5.01 per share based upon a July 2012 valuation report discussed below. The remaining 22,000 options were cancelled in connection with the termination of employment of certain employees. Please see footnote (2) to the above table for further information.
July and August 2012. The U.S. financial markets began to show some weakness in the second quarter of 2012 as concerns regarding global financial uncertainties grew; however, we continued to see strength in our business. Total revenue increased from $22.3 million for the three months ended June 30, 2011 to $25.2 million for the three months ended June 30, 2012. In September 2011 through October 2012, one of our preferred stock investors, in a series of transactions, acquired 2,101,900 shares of our common stock for aggregate purchase price of $10.1 million and a weighted average purchase price of $4.80. We performed the PWERM allocation methodology to value our common stock as of June 30, 2012. Management's estimates of the probability of each scenario were 25% for an IPO, 30% for a strategic merger or sale, 40% for continuing as a private company, and 5% for dissolution. We determined the enterprise value under the market approach using the financial information of companies in our peer group and under the income approach using a weighted-average cost of capital or discount rate of 20%, which was constant from the prior valuation as of March 31, 2012. Based on these factors, the PWERM analysis resulted in an estimated fair value of our common stock of $6.45 per share. In addition, we considered secondary sales of our common stock that occurred between April 2012 and June 2012, with a weighted average price of $4.53 per share. We applied a weighting of 25% to the PWERM estimated value of $6.45 per share and 75% to the value indicated by the secondary sales of our common stock of $4.53 per share, to arrive at a fair value of $5.01 per share. Based on this valuation and other factors described herein, our board of directors granted options to purchase 140,000 shares and 33,333 shares of common stock in July and August 2012,
70
respectively, with an exercise price of $5.01 per share. In addition, in July and August 2012, our board of directors repriced 1,089,338 options and 36,666 options, respectively, to $5.01 per share. Please see footnote (2) to the above table for further information. These options were previously granted from September 2011 through April 2012 based upon the September 6, 2011 valuation report discussed above. This valuation report did not take into consideration certain secondary sales of our common stock that occurred in September 2011, which significantly impacted the relative weighting of the factors used in the calculation of the fair value of our common stock as of such date.
November and December 2012. The U.S. financial markets continued to show some weakness in the third quarter of 2012 over concerns regarding global financial uncertainties; however, we continued to see strength in our business. Total revenue increased from $22.7 million for the three months ended September 30, 2011 to $30.2 million for the three months ended September 30, 2012. We performed the same PWERM allocation methodology as in the previous quarter to value our common stock as of September 30, 2012. Management's estimates of the probability of each scenario were 25% for an IPO, 30% for a strategic merger or sale, 40% for continuing as a private company and 5% for dissolution. We determined the enterprise value under the market approach using the financial information of companies in our peer group and under the income approach using a weighted-average cost of capital or discount rate of 20%. Based on these factors, the PWERM analysis resulted in an estimated fair value of our common stock of $6.39 per share. In addition, we took into account a secondary sale of our common stock that occurred in October 2012. We applied a weighting of 75% to the PWERM estimated value of $6.39 per share and 25% to the value indicated by a secondary sale of our common stock of $3.225 per share in October 2012, to arrive at a fair market value of $5.60 per share. The weighting of PWERM relative to secondary sales was increased from that applied in prior valuations due to there being a limited number of secondary sales near the valuation date. Based on this valuation and other factors described herein, our board of directors granted options to purchase 429,666 shares and 60,000 shares of common stock in November and December 2012, respectively, with an exercise price of $5.60 per share.
March 2013. The U.S. financial markets continued to show some weakness as well as volatility in the fourth calendar quarter of 2012 over concerns regarding global financial uncertainties and the U.S. elections; however, we continued to see strength in our business. Total revenue increased from $26.8 million for the three months ended December 31, 2011 to $32.5 million for the three months ended December 31, 2012. We performed the same PWERM methodology as in the previous quarter to value our common stock as of December 31, 2012. Management's estimates of the probability of each scenario were 25% for an IPO, 30% for a strategic merger or sale, 40% for continuing as a private company, and 5% for dissolution. We determined the enterprise value under the market approach using the financial information of companies in our peer group and under the income approach using a weighted-average cost of capital or discount rate of 20%. Based on these factors, the PWERM analysis resulted in an estimated fair value of our common stock of $6.78 per share. In addition, we took into account a secondary sale of our common stock that occurred in October 2012. We applied a weighting of 75% to the PWERM estimated value of $6.78 per share and 25% to the value indicated by the secondary sale of our common stock of $3.225 per share, to arrive at a fair market value of $5.90 per share. Based on this valuation and other factors described herein, our board of directors granted options to purchase 266,666 shares of common stock with an exercise price of $5.90 per share.
May and June 2013. The U.S. financial markets began to show improvement in the first quarter of 2013, and we continued to see strength in our business. Total revenue increased from $17.3 million for the three months ended March 31, 2012 to $24.8 million for the three months ended March 31, 2013. We performed the same PWERM methodology as in the previous quarter to value our common stock as of March 31, 2013. Management's estimates of the probability of each scenario were 50% for an IPO, 15% for a strategic merger or sale, 30% for continuing as a private company, and 5% for
71
dissolution. We determined the enterprise value under the market approach using the financial information of companies in our peer group and under the income approach using a weighted-average cost of capital or discount rate of 20%. Based on these factors, the PWERM analysis resulted in an estimated fair value of our common stock of $8.15 per share. Based on this valuation and other factors described herein, our board of directors granted options to purchase 299,666 shares of common stock with an exercise price of $8.15 per share.
The difference between $8.15, the fair value per share for the May 2013 and June 2013 grants and issuances, and $12.00 per share, which is the midpoint of the estimated offering price range set forth on the cover page of this prospectus, was largely attributable to the fact that the valuation for the May 2013 and June 2013 grants and issuances took into account a 20% non-marketability discount rate.
Income Taxes
We account for income taxes under the asset and liability method. We recognize deferred tax assets and liabilities for the future tax consequences attributable to differences between the financial statement carrying amounts of existing assets and liabilities and their respective tax bases, as well as for operating loss and tax credit carryforwards. We measure deferred tax assets and liabilities using enacted tax rates expected to apply to taxable income in the years in which we expect to recover or settle those temporary differences. We recognize the effect of a change in tax rates on deferred tax assets and liabilities in the results of operations in the period that includes the enactment date. We reduce the measurement of a deferred tax asset, if necessary, by a valuation allowance if it is more likely than not that we will not realize some or all of the deferred tax asset. As a result of our historical operating performance and the cumulative net losses incurred to date, we do not have sufficient objective evidence to support the recovery of our net deferred tax assets. Accordingly, we have established a valuation allowance against our net deferred tax assets for financial reporting purposes because we believe it is not more likely than not that these deferred tax assets will be realized.
We account for uncertain tax positions by recognizing the financial statement effects of a tax position only when, based upon technical merits, it is "more-likely-than-not" that the position will be sustained upon examination. We recognize potential interest and penalties associated with unrecognized tax positions in income tax expense.
At March 31, 2013, we had U.S. federal and state net operating loss carryforwards, or NOLs, of $83.4 million, which expire in various years beginning in 2026. A lack of future taxable income would adversely affect our ability to utilize these NOLs. In addition, under Section 382 of the Internal Revenue Code, a corporation that undergoes an "ownership change" is subject to limitations on its ability to utilize its NOLs to offset future taxable income. We believe that we experienced an ownership change under Section 382 of the Internal Revenue Code in prior years that may limit our ability to utilize a portion of the NOLs in the future.
Quantitative and Qualitative Disclosures about Market Risk
Market risk is the risk of loss to future earnings, to fair values or to future cash flows that may result from changes in the price of a financial instrument. The value of a financial instrument may change as a result of changes in interest rates, exchange rates, equity prices and other market changes. We are exposed to market risk related to changes in interest rates and foreign currency exchange rates. We do not use derivative financial instruments for speculative, hedging or trading purposes, although in the future we may enter into exchange rate hedging arrangements to manage the risks described below.
Interest Rate Risk
We maintain a short-term investment portfolio consisting mainly of highly liquid, short-term money market funds, which we consider to be cash equivalents. These investments earn interest at variable
72
rates and, as a result, decreases in market interest rates would generally result in decreased interest income. A 1.0% decline in interest rates occurring January 1, 2013 and sustained through the period ended December 31, 2013, would not be material. We do not enter into investments for trading or speculative purposes.
We are exposed to market risks related to fluctuations in interest rates related to our $25.0 million revolving credit facility. As of March 31, 2013, we had incurred borrowings with an aggregate principal amount of $6.0 million. Interest on our credit facility is tied to the lender's prime rate and fluctuates periodically. As a result, the interest rates on our outstanding debt obligations may fluctuate from time to time. A sensitivity analysis was performed on the outstanding portion of our debt obligations as of December 31, 2012. Based on the aggregate principal amount of the revolver borrowings as of December 31, 2012 and the then prevailing interest rate, should the interest rate on our credit facility increase by 10.0% beginning January 1, 2013 and sustained through the period ended December 31, 2013, or interest expense would increase by approximately $22,000.
Foreign Currency Exchange Risk
Due to our international operations, we are exposed to foreign exchange risk related to foreign denominated revenues and costs, which must be translated into U.S. dollars. Historically, our primary exposures have been related to non-U.S. dollar denominated operating expenses in the United Kingdom and Singapore. The effect of a 10.0% adverse change in exchange rates on foreign denominated cash, receivables and payables would not have been material for the periods presented. Substantially all of our advertiser contracts are currently denominated in U.S. dollars. Therefore, we have minimal foreign currency exchange risk with respect to our revenue. These exposures may change over time as our business practices evolve and if our exposure increases, adverse movements in foreign currency exchanges rates could have a material adverse impact on our financial results.
Inflation
We do not believe that inflation has had a material effect on our business, financial condition or results of operations. We continue to monitor the impact of inflation in order to minimize its effects through pricing strategies, productivity improvements and cost reductions. If our costs were to become subject to significant inflationary pressures, we may not be able to fully offset such higher costs through price increases. Our inability or failure to do so could harm our business, financial condition and results of operations.
Recent Accounting Pronouncements
We have reviewed recent accounting pronouncements and concluded that they are either not applicable to our business or that no material effect is expected on the consolidated financial statements as a result of future adoption.
Emerging Growth Company Status
Section 107 of the Jumpstart Our Business Startups Act of 2012, or the JOBS Act, provides that an "emerging growth company" can take advantage of the extended transition period provided in Section 7(a)(2)(B) of the Securities Act for complying with new or revised accounting standards. In other words, an "emerging growth company" can delay the adoption of certain accounting standards until those standards would otherwise apply to private companies. However, we are choosing to "opt out" of such extended transition period, and as a result, we will comply with new or revised accounting standards on the relevant dates on which adoption of such standards is required for non-emerging growth companies. Section 107 of the JOBS Act provides that our decision to opt out of the extended transition period for complying with new or revised accounting standards is irrevocable.
73
Mission
Our mission is to bring the certainty of science to the art of brand marketing.
Overview
We are a leading provider of technology-driven video advertising solutions enabling brand advertisers to engage consumers across multiple internet-connected devices including computers, smartphones, tablets and connected TVs. Our clients include some of the largest brand advertisers in the world including all of the top 10 automakers and 9 of the top 10 consumer packaged goods companies. Our relationships with leading brand advertisers and their agencies have helped us create a robust online video ecosystem that includes more than 500 premium websites and mobile applications, over 200 of which partner with us on an exclusive basis. Our proprietary technology, VideoHub, analyzes in-stream video content, detects viewer and system attributes, and leverages our large repository of stored data to optimize video ad campaigns for brand-centric metrics. VideoHub also provides advertisers and agencies with advanced analytics and measurement tools enabling them to understand why, when and where viewers engage with their video ads.
Our clients strive to create and maintain a favorable image of their brand, differentiate themselves from competitive brands and influence consumers' purchase decisions to maximize market share. Traditional media channels are limited in their ability to achieve these goals because they lack interactivity and the ability to measure and optimize ad campaigns in real-time. We believe online video is a highly effective channel for brand advertisers to engage and influence consumers by combining the rich "sight, sound and motion" of television and the interactivity, engagement, real-time measurement and optimization of online.
Online video advertising is amongst the fastest growing advertising formats in the United States. According to eMarketer, while overall advertising spend is expected to grow by 3.5% on a compounded annual basis between 2012 and 2016, online video advertising spend is expected to grow by 28.9%. eMarketer estimated total U.S. advertising spend in 2012 to be $165.8 billion, of which online video advertising spend was $2.9 billion, or only 1.7%. As online audiences continue to spend more time watching videos, online video advertising spend is projected to reach $8.0 billion in 2016. Within online video advertising, mobile video advertising spend is expected to grow from $244 million to $2.1 billion, reflecting a 71.1% compounded annual growth rate from 2012 to 2016. Despite this tremendous growth, several factors, including audience and device fragmentation, inadequate brand-centric measurement and optimization technology, and lack of performance and placement transparency, have made it challenging to effectively deliver online video advertising.
VideoHub is designed to effectively address the challenges faced by brand advertisers. VideoHub optimizes an advertiser's campaign against brand-centric key performance indicators, or KPIs, by building a decision tree that analyzes the attributes, which we call signals, of every ad request, such as video player size, geography, publisher, content category and length, browser type and viewer data. VideoHub then prioritizes the delivery of ads that are more likely to achieve the desired performance objectives. VideoHub also offers advertisers transparency into the workings of its decision tree so that they can understand what signals are driving the performance of their video ad campaigns. Further, VideoHub affords advertisers the ability to easily perform ad delivery validation and placement verification.
Our VideoHub technology is the backbone of the Tremor Video Network through which we offer advertisers access to engaged consumers at scale in brand safe environments across multiple devices. We specialize in delivering in-stream video advertisements, which are served to viewers immediately prior to or during the publisher's content when viewers are most engaged. This is in contrast to
74
traditional in-banner video advertising, which is served on the periphery of publisher content where viewers may not be directing their attention. We further enhance advertisers' campaigns with innovative ad formats specifically developed to harness the creative aspects of online video, which often result in consumers choosing to extend their interaction with a brand's message significantly past the original ad experience. To align our solutions with the goals of brand advertisers, we offer a number of brand performance-based pricing models for in-stream video advertising such as cost per engagement, or CPE, pricing, where we are compensated only when viewers actively engage with advertisers' campaigns. As a result, we enable our clients to effectively purchase measurable brand results rather than just impressions or clicks.
Driven by client demand, in 2012 we began licensing VideoHub technology to advertisers and their agencies through an intuitive and customizable console, which we call VideoHub for Advertisers, or VHA. VHA helps advertisers and their agencies manage online video brand marketing efforts by providing advanced analytic and measurement tools. By licensing VHA, advertisers and their agencies are able to gain transparency into the performance of ad campaigns across the entirety of their video ad buys, including on publisher sites that are not part of the Tremor Video Network. By providing an enterprise solution that works both on and off the Tremor Video Network, we deepen our relationships with our clients and broaden our influence in the online video ecosystem. We believe this best positions us to benefit from the anticipated growth in online video advertising.
We have developed strong relationships with brand advertisers and their agencies, who we believe view us as a strategic and trusted partner with a deep understanding of their industry-specific needs. We have also developed strong relationships with publishers due to our ability to provide consistent yield and monetization for their video content. We continuously evaluate and refine our publisher network to ensure that our advertisers have access to premium content in brand safe environments. We believe these relationships have created a network effect whereby advertisers increase their spend with us because of the results we deliver utilizing proprietary technology and our publishers' premium inventory, which in turn allows us to attract additional high quality publishers and thereby additional advertising spend.
From 2011 to 2012, our revenue increased from $90.3 million to $105.2 million. This included an increase in revenue derived from the delivery of in-stream video advertising from $75.5 million to $99.7 million, or 32.1%. Additionally, over this period, our gross margin improved from 35.2% to 41.7%, driven in part by the adoption of our performance-based pricing models, while our net loss has decreased from $21.0 million to $16.6 million. For the three months ended March 31, 2013 as compared to the same period of 2012, our revenue increased from $17.3 million to $24.8 million, or 43.4%, our gross margin improved from 31.9% to 44.1% and our net loss decreased from $9.1 million to $5.2 million. As a percentage of total revenue, revenue attributable to performance-based pricing for 2011, 2012 and the three months ended March 31, 2013 was 7.9%, 22.7% and 36.1%, respectively.
75
Industry Background
Advertisers often view the advertising market as a funnel that maps a potential consumer's purchase decision process from the moment he or she is introduced to a brand to the point of purchase.
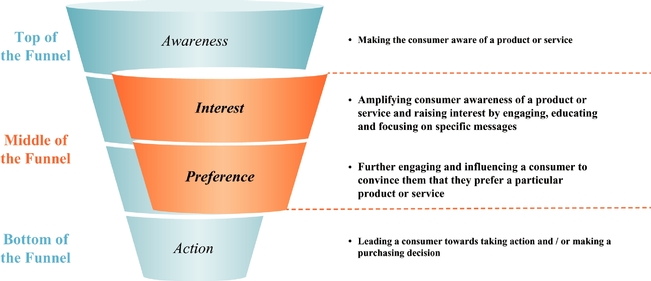
At the top of the marketing funnel, advertisers are focused on building brand awareness amongst the largest possible number of potential consumers and use reach as the primary metric to measure success. Traditionally, advertisers have preferred national television and outdoor media, such as a Super Bowl commercial or Times Square billboard, to achieve this brand awareness. At the bottom of the marketing funnel, advertisers are focused on generating specific actions by a consumer in a short period of time. At this stage of the funnel, advertisers have generally relied on direct response marketing, such as newspaper inserts and coupons, as well as online search and online display advertising, where conversions are used to measure campaign success.
In the middle of the marketing funnel, advertisers seek to engage consumers and educate them about their brand in order to differentiate themselves from competitors and drive consumer preferences toward a particular branded product to influence future purchase decisions, which we refer to as brand lift. Historically, advertisers have sought to achieve middle of the funnel objectives through print, which can tell a deeper story about the product and its benefits and allows the reader to linger as long as he or she likes, and to a lesser extent through local and cable television, which offers a more targeted audience for a product's message than national television. Traditional solutions for middle of the funnel marketing have significant limitations such as:
- •
- Lack of interaction with consumers. Static content does
not allow consumers to interact with an ad.
- •
- Lack of brand-centric real-time
measurements. Brand-centric campaign results typically are not available until several weeks after a campaign is
completed.
- •
- Lack of optimization. Campaign delivery cannot be altered in real-time to optimize for performance based on campaign observations.
A paramount challenge for brand advertisers today is finding methods to achieve middle of the funnel objectives at scale. For brands that have already dedicated significant advertising spend to television to establish awareness of their products, future success depends on a clear understanding of
76
what creative messaging and data attributes can drive brand lift and preference shift to capture market share. This is the essence of middle of the funnel brand advertising.
We believe in-stream video is a highly effective channel for brand advertisers to meet their middle of the funnel objectives by combining the best aspects of television, print and online advertising:
- •
- "Sight, sound and motion" of
television. In-stream video provides advertisers with a high production quality and a rich medium to create a compelling
story about their products.
- •
- Opt-in engagement of print. With advanced ad
formats, in-stream video empowers viewers to engage with the ads for as long as they like and receive informative content.
- •
- Real-time measurement and optimization of online. With a capable technology platform, in-stream video ad campaigns can be tracked, measured and optimized against a given KPI.
Market Opportunity
Key Trends Driving Growth of Online Video Consumption
The convergence of several technological and behavioral factors is driving robust growth in online video consumption creating a significant opportunity for in-stream video advertising. These factors include:
- •
- Connected device growth. Sales of internet-connected
devices have grown significantly over the past several years and are expected to continue to grow. According to IDC, global smartphone shipments are expected to grow from 722.4 million units in
2012 to 1.5 billion units in 2017. In addition, IDC also estimates that approximately 19.3 million tablets were shipped in 2010, which is expected to increase to a total of
252 million units by 2015. The current generation of smartphones and tablets are designed for high-speed internet connectivity and enable greater video consumption.
- •
- High-speed broadband and mobile network
infrastructure. Broadband and mobile connections are increasingly available at higher speeds. We believe that this trend will continue.
- •
- Increased online video content. The amount of video
content available online has increased significantly over the past several years. This includes content originally created for offline consumption, professionally produced video for online
distribution as well as user generated content.
- •
- Behavioral shift in video viewing. The demand for online video is growing rapidly as consumers are increasing consumption of video on their computers, smartphones, tablets and connected TVs. According to comScore, the number of hours spent viewing online videos has increased from 558 million in July 2008 to 4.1 billion in July 2012, reflecting a compound annual growth rate of 65%. According to IDC, from 2012 to 2015, the number of online streaming video users across all platforms in the United States is expected to grow from 182 million to 227 million.
Online Video Advertising Market
Online video advertising is amongst the fastest growing advertising formats in the United States. According to eMarketer, while overall advertising spend is expected to grow by 3.5% on a compounded annual basis between 2012 and 2016, online video advertising spend is expected to grow by 28.9%. eMarketer estimated total U.S. advertising spend in 2012 to be $165.8 billion, of which online video advertising spend was $2.9 billion, or only 1.7%. As online audiences continue to spend more time watching videos, online video advertising spend is projected to reach $8.0 billion in 2016. Within online video advertising, mobile video advertising spend is expected to grow from $244 million to $2.1 billion,
77
reflecting a 71.1% compounded annual growth rate from 2012 to 2016. We believe that we are well-positioned to capture a significant portion of this growing online video advertising market.
Despite this tremendous growth opportunity, brand advertisers face several challenges to the adoption of online video advertising that require sophisticated technology to solve:
- •
- Audience and device fragmentation. Video content is
available online across a wide variety of sites including those that aggregate content, sites of traditional offline content producers with an online presence, sites that produce content specifically
for online consumption, and a variety of additional sites that syndicate content. Audiences are viewing this video content across a growing number of devices including computers, smartphones, tablets
and connected TVs all with different screen sizes, screen resolutions, functionality, network connections, hardware and operating system types. For example, a viewer may watch one episode of his
favorite program at home on his connected TV and the next episode on a tablet while traveling. This fragmentation coupled with the myriad of video player sizes, video formats and content length, makes
it difficult for brand advertisers to reach viewers at scale on a consistent basis.
- •
- Complexity of analyzing video and optimizing
campaigns. Analyzing and categorizing in-stream video, with its visual, audio and meta data, is a complex technological
challenge, particularly compared to analyzing the text and web pages used for search or online display ads. Optimizing campaigns for middle of the funnel objectives such as brand lift and preference
shift presents significant challenges due to the difficulty of identifying the attributes that impact these performance metrics.
- •
- Absence of performance transparency. Given the diversity
of environments, content and viewer attributes associated with online video, it is difficult for brand advertisers to analyze these attributes in real-time and understand how they
correlate to the performance objectives of their online video ad campaigns.
- •
- Premium inventory and brand safety challenges. Brand
advertisers pay careful attention to the context in which their advertisements appear because of concerns that inappropriate content will not only prevent the success of their advertising campaign but
also tarnish their brand. While there is a proliferation of online video content, much of this video content is not professionally produced and may not be appropriate for a premium brand advertiser.
Further, even certain professionally produced content on a premium site may not be appropriate for a brand advertiser. For example, an automaker would not want an ad to run within or adjacent to
content regarding a celebrity being arrested for driving while intoxicated. As a result, many brand advertisers seek to impose content restrictions to attempt to ensure that their advertising appears
in the appropriate context.
- •
- Lack of placement transparency. Unlike traditional media
where advertisers have greater control over and visibility into where their ads appear, online advertising may be delivered across thousands of publishers and an advertiser may have little or no
insight into where their ads appear. In addition, due to various technical factors, including a viewer's browser window dimensions, the dimensions of the website on which the video ad appears, the
location of a video player on a website, and the scroll position at the time a video ad is delivered, a video ad is not always viewable. Brand advertisers need the ability to verify and validate
whether a video ad is fully, partially or not visible to a viewer.
- •
- Lack of consistent and standard measurements. Advertisers lack the ability to effectively measure and compare brand performance across different online publishers. Additionally, advertisers do not have the ability to evaluate brand campaign performance across online and offline channels using traditional media measurements such as gross rating points.
78
Tremor Video Technology and Solutions
VideoHub
VideoHub powers our video advertising solutions and is designed to effectively address the challenges faced by brand advertisers and achieve their middle of the funnel objectives.
Through VideoHub we deliver:
- •
- Brand-centric key performance indicators. We have
developed a suite of brand-centric key performance indicators, or KPIs, such as engagement (i.e., the interaction of a viewer with a video ad), brand lift (i.e., a positive shift in
preference towards a brand or branded product driven by exposure to a video ad and brand education), and time spent (i.e., the amount of time a viewer spends with a video ad), which are
tailored to the needs of brand advertisers. Before the launch of a video advertising campaign, a brand advertiser selects the KPI against which it wants to optimize the performance of its campaign.
For example, if a CPG advertiser chooses our brand lift KPI, VideoHub uses our proprietary survey functionality to help identify whether consumers feel more favorably about their product after
watching a specific video ad compared to consumers that were not exposed to the ad. Throughout a campaign, VideoHub analyzes and stores data for all KPIs in our suite, not only the KPI selected by the
advertiser for optimization. As a result, an advertiser can understand what signals enhance a specific performance objective even if it has not chosen to optimize a campaign against that KPI.
- •
- Distinct signals to drive optimization. By analyzing the results of over 20 billion in-stream video ads served through the Tremor Video Network, we have identified a proprietary suite of distinct signals that we believe correlate most strongly to campaign performance. We are continually refining our suite of signals as we amass additional data and gain further insights into what drives a successful video ad campaign. VideoHub currently analyzes the following distinct signals in order to optimize a video ad campaign:

- •
- Brand-centric optimization. Using a proprietary training algorithm, VideoHub trains a series of statistical predictive models to build a decision tree that predicts performance of the video ad campaign for the chosen KPI. VideoHub optimizes the campaign against the selected KPI using a filter that analyzes the signals of each ad request and prioritizes the delivery of ads that are more likely to perform. If a client chooses to optimize a video ad campaign for engagement, VideoHub will continuously track and analyze the signals described above to determine which signals are most correlated with achieving a high engagement rate and deliver ad campaigns in
The signals VideoHub utilizes to optimize an ad campaign vary by device type.
79
- •
- In-stream video analysis and
categorization. VideoHub performs an analysis on every video stream and categorizes it among one of approximately 72 video content
categories. We also have the ability to scan and categorize content by analyzing the audio track and certain visual elements. This functionality enables us to optimize video ad campaigns and also
helps us to identify various categories of inappropriate content in order to prevent video ads from being shown within video streams in these categories.
- •
- Ad performance transparency. VideoHub offers advertisers
transparency into the workings of its decision tree so that they can understand what signals are driving the performance of their video ad campaigns. These insights into campaign performance can not
only inform future online advertising decisions but also influence offline advertising decisions. For example, a yogurt brand launched an offline and online ad campaign directed at soccer moms but
learned through VideoHub that male high school and college athletes were engaging with the video ads, suggesting a secondary market for the product. The advertiser could use this insight to refine its
offline advertising strategy to appeal more to this new audience.
- •
- Ad placement transparency. VideoHub tracks the number of
impressions served to a specific publisher site and whether a video ad placement is fully, partially or not visible to a viewer, which we refer to as viewability. With this functionality, advertisers
know where an ad campaign is running and can validate that their video ads are viewable.
- •
- Cross site and channel measurement. Our proprietary metric, eQ score+, allows advertisers to compare video inventory quality across different publisher sites by measuring attributes such as viewability, the size of the video player and ad completion rate. When coupled with pricing information, these insights help advertisers compare the relative value of video inventory across publishers. In addition, VideoHub provides advertisers and agencies access to metrics that measure audience reach and frequency of viewing by a particular audience, similar to what is used in the television industry, enabling them to compare the brand performance of their online and offline video ad campaigns (while speaking the language of television advertising buyers).
response to ad requests that meet these criteria. For example, if VideoHub determines that ad requests associated with sports content that are made on a Friday night from a Safari browser (i.e., the content category, day of week, time of day and browser type signals) are driving engagement for an ad campaign, it will seek to deliver that ad campaign in response to matching ad requests. During the flight of a video ad campaign, the decision tree is continually learning and improving based on the signals that are elevating performance for the chosen KPI. We are able to continuously improve our decision tree training algorithm as we amass additional data.
VideoHub has also received accreditation from the Media Rating Council, which is an independent industry organization whose mission is to ensure valid, reliable and effective audience-measurement services, for five metrics that help advertisers, agencies and publishers to measure the accuracy and effectiveness of online video advertising. These metrics are (1) average viewability percentage, or how much of an ad can be seen on a digital screen at certain intervals during the video ad, (2) engagement rate, when a viewer clicks on an interactive slate within the ad unit or rolls over a trigger on the ad unit for three seconds or longer, (3) clicks, (4) served ad impressions and (5) unique cookies reach, or a count of unique cookies that represent unduplicated instances of exposure of a viewer to video ads during a specified measurement period.
Tremor Video Network
The Tremor Video Network offers advertisers access to premium video inventory at scale across multiple devices in brand safe environments.
80
Through the Tremor Video Network we deliver:
- •
- Scale and reach across multiple devices. The Tremor Video
Network delivers scale and reach across multiple internet-connected devices, including computers, smartphones, tablets and connected TVs, enabling our clients to use our solutions to address their
online video advertising needs across these devices. Through VideoHub, we are able to optimize ad campaigns for each type of device. We have partnered with more than 500 premium websites and mobile
applications, over 200 of which partner with us on an exclusive basis. These relationships enable publishers to more effectively monetize their video content. We have served over 20 billion
in-stream video ads, and in 2012 alone, we delivered on average over 600 million in-stream video ad impressions per month.
- •
- Premium video content. We continuously evaluate and refine
our publisher network to ensure that our advertisers have access to high performing content in a brand safe environment. We consider a premium publisher to be a publisher that has professionally
produced content, offers a quality video viewing experience, including size and placement of the video player, and delivers strong brand-centric performance results to brand advertisers.
- •
- Brand safety. Our technology scans and categorizes every
video within the Tremor Video Network and prevents video ads from being served within content that is identified as objectionable for the brand advertiser, including content that contains accidents,
distasteful or obscene language, substance abuse, violence, gambling, sex or crime. We believe that the combination of our video scanning technology, selective manual content reviews and publisher
inventory selection practices ensures a high level of brand safety for our clients.
- •
- In-stream video focus. We specialize in
delivering in-stream video advertisements, which can be served to viewers immediately prior to or during the publisher's content when they are the most engaged. We believe
in-stream video is better aligned with brand advertisers' middle of the funnel objectives than either display or video in-banner advertising, both of which are served on the
periphery of publisher content where viewers may not direct their attention. Moreover, we believe that in-stream video advertising solves many of the challenges of mobile advertising that
are created by screen size limitations since the publisher content within which the video ad is served will generally occupy the entire mobile screen. Our technology is able to adjust video ads for
varying screen sizes.
- •
- Advanced ad formats. Our proprietary ad formats give brand
advertisers the ability to create a more engaging experience across multiple devices, allowing viewers to explore content within the ad itself and learn more about the brand. Examples of our
proprietary ad formats include:
- •
- Super Pre-Roll. Makes traditional
pre-roll ads interactive and engaging by adding elements within the video player such as location search, movie show times, social media sharing, and the ability to watch additional video
content from a brand.
- •
- Pre-Roll Plus. Incorporates an engaging call to
action intended to drive increased awareness of the advertiser's goal, which appears shortly after the video starts and runs for its duration.
- •
- Pre-Roll Extended Play. Provides the viewer the
option to continue to watch the entire video ad (up to five minutes) all within the traditional pre-roll ad unit.
- •
- Innovative pricing models. We offer innovative brand performance-based pricing models for in-stream video advertisements that are tied to the effectiveness of the Tremor Video Network, as
81
- •
- CPE pricing, where we are compensated only when viewers actively engage with advertisers' campaigns, such as by
interacting with the elements of the video ad through clicks or screen touches or by rolling over certain elements of the video ad for at least three seconds; and
- •
- CPVC pricing, where we are compensated only when viewers complete the video ad.
advertisers using these models pay us only if their video ad campaigns perform. These performance-based pricing models include:
The percentage of users that engage with an ad campaign, or the engagement rate, can vary depending on the characteristics of the ad campaign, including the ad format, advertiser vertical, length of video ad and player size. Generally, we experience engagement rates that range between 1.0% and 5.0%. We believe that advertisers are attracted to our performance-based pricing models because these models more closely tie advertising spend to actual campaign performance. We also provide CPE pricing for our mobile offering.
VideoHub for Advertisers (VHA)
Driven by client demand, in 2012, we began licensing VHA, a software platform that clients access through a web portal. By licensing VHA, advertisers and their agencies can use VHA across the entirety of their video ad buys, including on publisher sites that are not part of the Tremor Video Network. In order to analyze video ad campaigns running outside the Tremor Video Network, VideoHub generates a tracking code which is associated with the video ad unit that the advertiser or agency wishes to analyze through VHA. When the video ad is served by a publisher that has agreed to deliver the video ad campaign, the tracking code communicates data regarding the video ad to VideoHub. Advertisers and agencies can then access VideoHub's advanced analysis of this data through VHA in order to gain valuable insights into campaign performance, including the performance of the campaign on a particular publisher's site.
We believe that the breadth of our VHA solution helps agencies achieve greater operational efficiency as it relieves them from the need to integrate and support multiple, disparate technology solutions. By providing this enterprise solution to advertisers and their agencies, on and off the Tremor Video Network, we believe we can deepen our relationships with our clients and broaden our influence in the online video ecosystem.
Competitive Strengths
Our key competitive strengths include:
Differentiated and Proprietary Technology
VideoHub is the product of more than seven years of development exclusively focused on perfecting the measurement, optimization and transparency of online video advertising for leading brand advertisers. Our technology is supported and enhanced by our technology and development department which as of March 31, 2013 consisted of 68 employees. VideoHub analyzes and categorizes in-stream video content, detects viewer and system signals, and leverages our large repository of stored data to optimize video ad campaigns for brand-centric metrics such as engagement, brand lift and time spent. VideoHub provides performance and placement transparency to our advertising clients across multiple devices whether or not those campaigns run through the Tremor Video Network.
Focus on Innovation in the Video Advertising Ecosystem
We are an innovator in online video advertising. We believe our innovations, such as advanced ad formats, brand-centric performance-based pricing models, including CPE, in-stream video analysis and categorization and advanced analytics tools, including eQ+ score and our proprietary measurement for
82
in-stream video ad viewability, differentiate us from our competitors. We believe that our ability to continually innovate will further improve our market position.
Strong Multi-Channel Capabilities
We provide brand advertisers with a one-stop-shop for their video ad campaigns by delivering those campaigns over multiple internet-connected devices including computers, smartphones, tablets and connected TVs with different screen sizes, screen resolutions, functionality, network connections, hardware and operating system types. Our technology is able to adjust video ads for varying screen sizes, and through VideoHub, we are able to optimize video campaigns for each type of device. Our advanced ad formats and cost per engagement pricing are available on smartphones and tablets as well as computers. Our multi-channel capabilities also allow publishers to monetize their content across multiple internet-connected devices. This alleviates their need to pursue an ad hoc approach with multiple providers.
Strategic Relationships with Brand Advertisers, Agencies and Agency Holding Companies
We have built deep relationships with leading brand advertisers, advertising agencies and the holding companies that own many of these agencies. Our clients include some of the largest brand advertisers in the world, including all of the top 10 automakers and 9 of the top 10 CPG companies. We have built deep industry specific expertise by aligning our sales force around our target verticals. We believe that the advertisers, the agencies with which they work and the holding companies that own many of these agencies view us as a strategic and trusted partner that can guide and support their ad campaigns through all stages of planning, execution and measurement.
Our Premium Publisher Network
We have partnered with more than 500 premium websites and mobile applications, over 200 of which partner with us on an exclusive basis, enabling these publishers to more effectively monetize their video content. This network helps us attract and retain large brand advertisers that spend significant media dollars. Premium publishers work with us because of our deep brand advertiser relationships and our ability to maximize the value of their online video content across multiple devices. We believe our technology and innovative performance-based pricing models have allowed us to generate superior yield compared to traditional impression-based pricing, which enables us to attract additional premium publishers by providing them better monetization.
Significant Data Asset
We have built a large repository of data generated from over 20 billion in-stream video ad impressions delivered through the Tremor Video Network. This data asset grows richer over time as additional campaigns run through the Tremor Video Network. We leverage this data asset and the insights we have gained from the billions of video impressions we have previously delivered to continuously refine our algorithms and improve our optimization capabilities.
Growth Strategy
Continually Innovate and Expand our Solutions
We will continue to invest in our technology to maintain and extend our leadership in the online video advertising ecosystem. We are focused on providing brand advertisers with brand-centric metrics, video ad placement and performance transparency and optimization capabilities to enhance campaign effectiveness. We will also continue to focus on introducing new ad formats that improve the effectiveness of our video ads and pricing models that further align our financial results with campaign
83
performance. We believe that these innovations will continue to increase client loyalty and the amount of their spending with us.
Expand Existing and Build New Relationships with Brand Advertisers, Agencies and Agency Holding Companies
We believe that the combination of our proprietary technology, brand-centric approach, deep client relationships and our broad knowledge of the video advertising industry is unique and highly attractive to brand advertisers and their agencies. We plan to capitalize on opportunities to build on our relationships with existing advertisers and attract new clients. We will continue to develop preferred relationships with the largest agency holding companies that position us to benefit from the increased online video spending by their constituent agencies. By focusing on our relationships with agency holding companies, we believe our sales efforts will become more efficient by shortening the prequalification period and sales cycle with the respective holding companies' constituent agencies. We intend to expand our reach beyond our current core industry verticals, including CPG, automotive and entertainment, to add other verticals in which companies spend significantly on brand advertising, such as technology and telecommunications, retail and financial services.
Increased Penetration in Mobile and Connected TV
We launched our mobile offering in the first quarter of 2011 and have experienced increasing adoption since its introduction. The number of mobile ad impressions that we delivered as a percentage of total ad impressions has ranged from less than 2.0% in 2011 to more than 8.0% in the first quarter of 2013. As viewers increasingly consume content on smartphones and tablets, we expect brand advertisers to devote increasing amounts of advertising spend towards mobile channels. Mobile is inherently an interactive channel, and we are promoting our performance-based pricing models such as CPE to take advantage of this interactivity. Moreover, our strategic focus on in-stream advertising positions us to solve many of the challenges of mobile advertising that are created by screen size limitations since the video ad served will generally occupy the entire mobile screen. In addition, we are integrating VideoHub with an increasing number of connected TV publishers, enabling our clients to take advantage of potential growth in this emerging channel.
Grow our Premium Publisher Network
We offer premium publishers quality advertising demand at scale and help them effectively monetize their content. We have partnered with more than 500 premium websites and mobile applications, over 200 of which partner with us on an exclusive basis. We plan to grow our premium publisher base, increase our share of the in-stream video inventory generated by our publishers and enter into additional exclusive arrangements where appropriate. We believe these premium publisher relationships will allow us to deliver high performing campaigns for brand advertisers resulting in increased advertising spend through the Tremor Video Network. In addition, we are focused on developing an enterprise solution for publishers to enable their direct sales force to better monetize their video ad inventory.
Pursue High Margin Licensing Opportunities
We are focused on expanding the adoption and resulting licensing revenue of VHA. We plan to grow VHA licensing revenue by entering into agreements with new agencies and driving adoption of VHA across more brands within agencies with which we have existing licensing agreements. VHA allows brand advertisers and their agencies to measure the effectiveness of video ad campaigns whether or not those campaigns are run through the Tremor Video Network. We believe our clients will recognize the strategic value of VHA, which will enable us to strengthen our relationships with them.
84
Extend our Technology to Brand-focused, Programmatic Buying
Programmatic buying is a relatively new development in online advertising in which an advertising exchange brings together buyers and sellers of ad inventory, often in real-time. Based on the perceived value of the ad inventory, or the viewer, a bid is placed by relevant advertisers and the highest bidding advertiser gets the opportunity to serve the ad to the viewer. To date, programmatic buying has been largely limited to display and in-banner video advertising. Its expansion to online video advertising has been impacted by the lack of necessary data for effective programmatic buying of video ads. We believe that our technology is well suited to enable differentiated brand-focused programmatic buying for in-stream video advertising and we intend to extend our technology to encompass such functionality. We believe that our future entry into this space will drive incremental revenue.
Expand Our Global Presence
We license certain aspects of VideoHub to video ad networks and exchanges in geographies where we do not currently have a direct presence to enable these licensees to improve the performance and monetization of their video inventory. We aim to further increase our presence in strategic locations around the world through additional partnerships and commercial agreements. We believe that international markets will increasingly experience similar market trends to those in the United States that make video advertising attractive to brand advertisers. Accordingly, we believe international markets represent opportunities for growth.
Clients
Advertisers and Agencies
As of March 31, 2013, we had 372 advertiser clients, including all of the top 10 automaker advertisers and 9 of the top 10 CPG advertisers. The following sets forth a list of representative advertisers by vertical in 2012:
| Auto | CPG | |
|---|---|---|
Ford Motor Company |
Colgate-Palmolive Company |
|
General Motors Company |
Kraft Foods Inc. |
|
Hyundai Corporation |
Merck & Co. Inc. |
|
Nissan Motor Company |
Procter & Gamble Company |
|
Toyota Motor Corporation |
Reckitt Benckiser Plc |
| Entertainment | Others | |
|---|---|---|
Fox Broadcasting Corp. |
Cotton Inc. |
|
NBCUniversal Media, LLC |
Google Inc. |
|
Open Road Films, Inc. |
Lowe's Cos. Inc. |
|
Paramount Home Entertainment, Inc. |
Marriott International Inc. |
|
Walt Disney Company |
Microsoft Corp. |
The following is a list of representative advertising agencies with whom we worked in 2012:
| Carat DraftFCB, Inc. Mediaedge: cia UK Limited MediaStorm LLC MindShare, Inc. |
Moxie Interactive, Inc. OMD USA Inc. Starcom MediaVest Group Zenith Optimedia Ltd. Zimmerman Advertising LLC |
Revenue contribution from individual brand advertisers varies from period to period. We do not believe our business is substantially dependent upon any individual advertiser as no individual
85
advertiser represented more than 10% of our revenue in 2011, 2012 and the three months ended March 31, 2013. We maintain close relationships directly with brand advertisers and we consider them to be our clients, as the video ad campaigns we run are those of the advertiser and we work closely with them to execute their video ad campaigns on the Tremor Video Network. However, we primarily market and sell our solutions to advertising agencies on behalf of their advertiser clients. We do not directly contract with brand advertisers; rather, we contract directly with the advertising agencies representing these brands or the large agency holding companies that own and control many of the advertising agencies. However, brand advertisers are ultimately responsible to us for all contractual payment obligations. In 2011, 2012 and the three months ended March 31, 2013, we derived 18.0%, 13.8% and 17.9%, respectively, of our revenue from brand advertisers represented by the Starcom MediaVest Group.
Once an advertiser or its agency determines to run a video ad campaign through the Tremor Video Network, we execute an insertion order with the ad agency on behalf of the advertiser reflecting campaign parameters such as size and duration of the campaign, type of video ad format, devices on which the campaign will run, the KPI for which to optimize performance and the desired pricing model. Prior to running the campaign, the advertiser and its agency often work with our creative team to provide the creative direction of the campaign and design and build an advanced ad unit. The completed video ad is then uploaded to our ad server by our operations personnel. Once uploaded, the video ad is available to be served to the publisher ad inventory available on our Tremor Video Network. When a publisher makes an ad request, VideoHub analyzes the signals associated with that ad request and prioritizes the delivery of video ad campaigns that are more likely to perform, utilizing our optimization technology and taking into consideration the applicable campaign parameters. During a campaign flight, through VHA a client may access analytics about the performance of its video ad campaign and validate the placement of its video ads and number of impressions delivered.
The insertion orders entered into with ad agencies on behalf of advertisers are cancellable upon short notice and without penalty consistent with standard terms and conditions for the purchase of internet advertising for media buys one year or less published by the Interactive Advertising Bureau. These insertion orders generally require payment within 60 days of invoice, which we send on a monthly basis.
We provide basic VHA access to advertisers with respect to their video ad campaigns running through the Tremor Video Network and charge a license fee for advanced analytics. We also license VHA to advertisers and agencies to track the performance of their video advertising campaigns across their ad buys. The license fee varies depending upon the level of access to our video advertising analytics and the volume of impressions actually analyzed through VHA during the term of the license. Typically, our license terms are for one year periods and are cancellable upon 30 days advance notice in case of a breach. Our clients are required to remit payment for use of VHA within 30 calendar days after the applicable month end.
Publisher Partners
Publishers provide us with the video content within which we deliver video advertising campaigns on behalf of our advertiser clients. We have partnered with more than 500 premium websites and mobile applications, over 200 of which partner with us on an exclusive basis. We consider a premium publisher to be a publisher that has professionally produced content, offers a quality video viewing experience, which includes size and placement of the video player, and delivers brand metric performance results to brand advertisers.
We enter into agreements with our exclusive publisher partners that typically have a one year term and provide for a minimum fill rate, or a percentage of video ad inventory made available by the publisher to the Tremor Video Network that we must utilize in a given month, at a fixed CPM. At the
86
end of each month, we calculate the amounts owed to our exclusive publishers based on the greater of (1) the number of video ads delivered in any given month and (2) the minimum fill rate. We are generally required to remit payment for these impressions within 60 days of month end. The scope of these exclusive relationships varies, with some publishers imposing geographical, device or inventory type limitations. For example, under an exclusive relationship, we may be a publisher's exclusive partner only for in-stream video in the United States. A publisher's direct sales force may continue to sell their video ad inventory to advertisers or agencies directly. With respect to our non-exclusive publishers, we purchase video ad inventory on an as needed basis at a fixed CPM. We are generally required to remit payment for these impressions within 60 days of month end.
Case Studies
Advertisers
Large Automotive Company
A large automotive company, or automotive company, has been an advertiser with us since 2009. In 2012, they began significantly leveraging our advanced ad formats and performance-based pricing model to reach engaged consumers at scale across the Tremor Video Network.
In the fourth quarter of 2012, the automotive company ran six different video ad campaigns through the Tremor Video Network, all optimized toward the engagement KPI and priced on a CPE basis. Three of these campaigns were broad national efforts by the automotive company for its car models to get consumers to engage and spend more time with its messaging and increase consideration for its brand. Three of these efforts leveraged our ability to find Spanish language consumers in order to engage that market segment with the brand messaging for its car models. By creating a Super Pre-Roll video ad unit in Spanish, we were able to reach a critical audience for this automotive company connecting it to only interested, relevant consumers.
Each video advertising campaign resulted in strong performance against its selected KPI, while simultaneously providing robust real-time insight into the signals that were driving campaign success. For example, this campaign achieved an engagement rate of 3.2% and drove significant time spent with the brand message, as consumers who engaged with the video ad unit spent, on average, 84 seconds with a 30 second video ad unit. Campaign results revealed that engagement was optimized when a viewer was exposed to a video ad 2-4 times, with diminished returns thereafter.
As a result of these successful campaigns, we are seeing strong momentum with the automotive company and have continued to run video ad campaigns for them in the first quarter of 2013 across multiple divisions.
Large CPG Company
A large CPG company began advertising with us in 2008, primarily using our solution to extend the reach of its video ad campaigns and build awareness online. Since 2011, the CPG company has increasingly leveraged our advanced ad formats, brand-centric KPIs, multi-screen capabilities and performance-based pricing models to drive brand goals.
For example, in August 2012, one of the CPG company's brands looked to us for the launch of a new product campaign. The CPG company's goal was to increase engagement and time spent with the video ad. We worked closely with the CPG company's agencies to understand its campaign goals and built an immersive Super Pre-Roll ad unit that invited viewers to engage with the video ad to see additional video content and other product features. The campaign, which was priced on a CPE basis, was very successful, achieving average engagement rates of 5 to 6% and an impressive time spent metric, as viewers that engaged with the video ad spent on average 50 seconds with a 30 second video
87
ad unit. Based on these results, the CPG company extended the campaign with additional flights in late 2012 and early 2013.
As a result of this and other successful campaigns, the CPG company has significantly expanded its relationship with us in recent years. From 2010 to 2012, the CPG company:
- •
- increased advertising spend with us reflecting a compound annual growth rate of 53%;
- •
- expanded the number of its brands using the Tremor Video Network from 9 to 17;
and
- •
- increased average expenditure by brand.
Moreover, from 2011 to 2012, the percentage of its ad spend on campaigns running through the Tremor Video Network that were optimized for brand lift and engagement KPIs increased from none to 33% and the percentage of the CPG company's ad spend attributable to CPE pricing increased from none to 10%.
Large Consumer Product Company
A large consumer product company was the first advertiser to run a campaign that was optimized for brand lift through the Tremor Video Network. This campaign, which was designed for one of its new products, ran in the fourth quarter of 2011. In response to a survey, approximately 115,000 consumers answered that they were more likely to try the new product after viewing the video ad. Following this initial success, the consumer product company has continued to increase its use of our brand lift optimizer for campaigns running through the Tremor Video Network. In 2012, it spent approximately $2.7 million across 13 advertising campaigns that were optimized for brand lift, representing 71% of its total spend with us in 2012. In the aggregate, these campaigns resulted in a positive shift of approximately 2.5 million consumers who indicated in a survey that they were more likely to buy the company's advertised products after viewing the video ad delivered by the Tremor Video Network.
Large Entertainment Company
In 2011, a large entertainment company ran four video ad campaigns through the Tremor Video Network to promote its sports programming with the goal of increasing reach among male audiences between the ages 18 and 34. In 2012, the entertainment company significantly increased its advertising spend with us, running 25 different campaigns across sports and six original programs. A primary goal for the entertainment company for these campaigns was to increase engagement and reach viewers across multiple devices. Accordingly, in 2012, 30% of its video ad spend with us was on campaigns priced on a CPE basis and 28% of its video ad spend with us was on mobile campaigns. In the third quarter of 2012, it ran its first "four screen" campaign across computers, smartphones, tablets and connected TVs, for the second season premiere of a popular TV show. The campaign was optimized for engagement and utilized our advanced video ad units.
In early 2013, the entertainment company continued to run "four screen" campaigns across computers, smartphones, tablets and connected TVs, for the second season premieres of two popular TV shows. Both campaigns were optimized for engagement and utilized our advanced video ad units. In late first quarter of 2013, we continued to expand our relationship by executing campaigns for additional TV programming.
Large Technology Company
A large technology company began using the Tremor Video Network in 2008 and was one of the first adopters of our CPE pricing model in 2010, as it recognized the value of consumer engagement to
88
brand building. From 2010 to 2012, the percentage of the technology company's ad spend with us that was earmarked against brand-centric KPIs increased from 8% to 46%.
In the fourth quarter of 2012, the technology company launched a video ad campaign for a new product on the Tremor Video Network that was optimized for brand lift. Through our optimization technology, we were able to serve the campaign in environments and to viewers in a manner that drove a more favorable perception of the product. As a result of the success of this campaign, the technology company subsequently renewed the campaign in the first two quarters of 2013. As of April 2013, survey results show that these campaigns have shifted 360,000 viewers to more favorable perceptions and stronger consideration of the technology company's advertised product.
Publishers
A+E Networks
A+E Networks® is a leading media company that owns a group of television channels including A&E®, HISTORY®, bio.® and Lifetime® as well as related premium websites such as aetv.com, history.com, biography.com and mylifetime.com. We began working with A+E Networks in July 2008. In January 2011, A+E Networks elected to make our relationship exclusive based on our ability to effectively monetize their online video content across all of their sites. As A+E Networks' exclusive partner, we are the only third party able to deliver video ads into their premium video content. The number of impressions from A+E Networks' sites that were served by Tremor Video Network grew by 50% from 2011 to 2012, making A+E Networks one of our largest exclusive partners. Based on the success of this exclusive relationship, in January 2013, A+E Networks enlarged the scope of the exclusive relationship to include video content delivered to A+E Networks mobile phones and tablets. We believe that our exclusive access to A+E Networks' premium video content helps us deliver strong performance for our advertisers and further differentiates us from our competitors.
Viacom Media Networks
Viacom Media Networks, a division of Viacom International Inc., oversees the operations of many television channels and websites, including MTV, VH1, Comedy Central and Nick at Nite. We began working with Viacom Media Networks in February 2011 when they selected us as their exclusive partner for the monetization of unsold advertising inventory in connection with online video content across more than 20 premium sites in the United States. In January 2013, Viacom Media Networks extended its exclusive partnership with us through December 2014. We believe that our exclusive access to unsold inventory on Viacom Media Networks' premium video content helps us deliver strong performance for our advertisers and further differentiates us from our competitors. In particular, Viacom Media Networks' long form video content results in high completion rates for our video ads. In addition, since January 2013, Viacom Media Networks has been utilizing our VideoHub analytics solution, which we believe provides insights into video ad campaigns sold by Viacom Media Networks' direct sales team. We believe these insights will strengthen Viacom's relationships with its advertisers and strengthen our relationship with Viacom because of the incremental value-add we believe we are able to provide through VideoHub analytics.
Sales
As of March 31, 2013, we had total sales and marketing staff of 154, with 139 based in the United States, and 15 based internationally. For 2011, 2012 and the three months ended March 31, 2013, our total sales and marketing expenses were $28.8 million, $35.0 million and $8.8 million, respectively.
89
Advertiser and Agency Sales
Our sales strategy is focused on targeting the most "video ready" brand advertisers, including those advertisers that are large television advertising spenders and have internet display and search budgets. Our advertiser sales force is structured around the verticals that are most ready to spend on online video. Our core verticals include automotive, CPG and entertainment. In addition, we have increasingly focused on the technology and telecommunications, retail and financial services verticals as potential areas for expansion.
We also have developed and will continue to develop preferred relationships with key agency holding companies that position us to benefit from increased online video spending by their constituent agencies. Brand advertisers' purchasing decisions typically are made and coordinated by their advertising agencies and require input from multiple constituencies and the sales process therefore can be time-consuming. We have invested significant resources in establishing relationships with our brand advertisers, agencies and agency holding companies.
Our sales executives and account managers are assigned to specific advertisers to oversee relationships and provide guidance throughout the campaign process from launch to post campaign review. Our creative team also works with advertisers to create innovative ad campaigns that are specifically suited for in-stream video viewing and optimizing viewer engagement, providing much needed insight to advertisers with limited exposure to digital advertising. We generally locate sales and marketing personnel across the United States to align with the geographies of our advertisers and agencies.
VHA Sales
Our enterprise sales organization is responsible for client acquisition, account management and overall market awareness of our VHA solution. We established our enterprise sales organization in the United States in 2011 and in Europe in 2012. We expect to continue to grow our enterprise sales and account management headcount in all of our principal markets and extend our offering into countries where we currently do not have a direct sales presence.
Publisher Development
Our publisher initiatives utilize a full-service development and support strategy. Our team of publisher development professionals is responsible for ensuring that we are meeting the ongoing needs of our publishers throughout the duration of the relationship, and is supported by engineers with deep technical expertise. We invest significant time in cultivating relationships with our publishers to ensure they understand the potential benefits of monetizing their inventory with us rather than with third-party media networks and exchanges. This relationship building process can be time consuming and we have invested significant resources in establishing relationships with our publisher partners.
Technology and Development
Our technology and development efforts are focused on significant investments in VideoHub, which powers the Tremor Video Network and VHA.
As of March 31, 2013, we had a total of 68 employees engaged in technology and development functions. For 2011, 2012 and the three months ended March 31, 2013, our total technology and development expenses were $5.9 million, $8.1 million and $2.7 million, respectively.
Competition
We operate in a dynamic and competitive market, influenced by trends in both the overall advertising market as well as the online video advertising industry. The competitive dynamics of our
90
market are unpredictable because our market is in an early stage of development, rapidly evolving, fragmented and subject to potential disruption by new technological innovations. The Tremor Video Network competes with large online video publishers such as Hulu, LLC and YouTube, LLC, which is owned by Google Inc., as well as advertising networks and exchanges, such as BrightRoll, Inc. and YuMe, Inc. We also compete for advertiser spending with publishers, such as CBS, CNN and ESPN, who rely on their own sales organizations to attract brand advertisers across their properties. Our VHA solution competes with ad tech infrastructure companies, such as Adap.tv, Inc. and Videology, Inc.
In the traditional media space, our primary competitors for middle of the funnel advertising spend are mainly cable TV broadcasters, radio broadcasters and print media publishers. Across the digital media landscape, we compete for advertising spend with large entities such as Facebook, Inc., Microsoft Corporation and Yahoo! Inc. as well as Adobe Systems Incorporated and Google Inc. that offer video advertising services as part of a larger solution for digital media buying. Many of these competitors have significant client relationships, much larger financial resources and longer operating histories than we have.
We believe the principal competitive factors in our industry include the following:
- •
- proven technology and optimization capabilities;
- •
- pricing;
- •
- quality and scale of online video inventory;
- •
- depth and breadth of relationships with brand advertisers and premium publishers;
- •
- multi-channel capabilities;
- •
- brand-centric measurement;
- •
- ability to ensure brand safety; and
- •
- transparency into ad performance and placement.
We believe that we compete favorably with respect to all of these factors and that we are well positioned as a leading provider of technology-driven video advertising solutions to brand advertisers.
Intellectual Property
Our ability to protect our intellectual property and our technology will be an important factor in the success and continued growth of our business. We rely on a combination of trade secrets, copyrights, patents and trademarks, as well as contractual protections, to establish and protect our intellectual property and protect our proprietary technology. We currently own one granted European patent, which we registered in France, Germany and Great Britain and expires in 2029. Additionally, we currently own eight pending U.S. patent applications that we are currently prosecuting with the U.S. Patent and Trademark Office. We register certain domain names, trademarks and service marks in the United States and in certain locations outside the United States. We also rely upon common law protection for certain marks, such as "Tremor Video." We generally enter into confidentiality and invention assignment agreements with our employees and contractors, and confidentiality agreements with parties with whom we conduct business in order to limit access to, and disclosure and use of, our proprietary information. We also use measures designed to control access to our technology and proprietary information. We view our trade secrets and know-how as a significant component of our intellectual property assets, which we believe differentiate us from our competitors.
Despite our efforts to preserve and protect our intellectual property, our efforts may not prevent the misappropriation of our intellectual property or technology, or deter independent development of similar intellectual property or technology by others. Policing unauthorized use of our technology and
91
intellectual property is difficult. Third parties may attempt to copy, reverse engineer or otherwise obtain our proprietary technology, or otherwise violate our intellectual property rights. Unauthorized disclosure by our employees, contractors or other third parties could also occur. Effective intellectual property protection may not be available in the United States or other jurisdictions in which we operate and the efforts we have taken to protect our proprietary rights may not be sufficient or effective. Any impairment or loss of our intellectual property, or any inability to enforce our intellectual property rights effectively, could harm our business or our ability to compete. Also, protecting our technology and intellectual property is costly and time-consuming. Any unauthorized disclosure or use of our intellectual property or technology could make it more expensive for us to do business and could harm our operating results.
Additionally, we expect that products in our industry may be subject to third-party infringement lawsuits as the number of competitors grows and the functionality of products in different industry segments overlaps. We currently face, and expect to face in the future claims by third parties that we infringe upon or misappropriate their intellectual property rights, and we may be found to be infringing upon or to have misappropriated such rights. We cannot assure you that we are not infringing or violating any third-party intellectual property rights. Such claims may be made by competitors or other entities. In the future, we, or our clients, may be the subject of legal proceedings alleging that our solutions or underlying technology infringe or violate the intellectual property rights of others.
We also encourage you to review the risk factors above titled "Any failure to protect our intellectual property rights could negatively impact our business" and "Our business may suffer if it is alleged or determined that our solutions or another aspect of our business infringes the intellectual property rights of others."
Governmental Regulation; Industry Alliances
We are subject to numerous U.S. and foreign laws and regulations that are applicable to companies engaged in the online video advertising business, including video advertising on mobile devices. In addition, many areas of law that apply to our business are still evolving, and could potentially affect our business to the extent they restrict our business practices or impose a greater risk of liability. We are aware of several ongoing lawsuits filed against companies in our industry alleging various violations of privacy or data security related laws.
Privacy
Privacy and data protection laws and regulations play a significant role in our business. In the United States, at both the state and federal level, there are laws that govern activities such as the collection, use and disclosure of data by companies like us. Online advertising activities in the United States have primarily been subject to regulation by the Federal Trade Commission, or the FTC, which has regularly relied upon Section 5 of the Federal Trade Commission Act, or Section 5, to enforce against unfair and deceptive trade practices. Section 5 has been the primary regulatory tool used to enforce against alleged violations of consumer privacy interests. In addition, our solutions reach devices and users throughout the world, including in Australia, Canada, Europe, South America and Asia. As a result, some of our activities may also be subject to the laws of foreign jurisdictions. In particular, European data protection laws can be more restrictive regarding the collection, use, and disclosure of data than those in the United States. As we continue to expand into other foreign countries and jurisdictions, we may be subject to additional laws and regulations that may affect how we conduct business.
Additionally, U.S. and foreign governments have enacted, considered or are considering legislation or regulations that could significantly restrict industry participants' ability to collect, augment, analyze, use and share anonymous data, such as by regulating the level of consumer notice and consent required
92
before a company can employ cookies or other electronic tools to track people online. The European Union, or EU, and some EU member states have already implemented legislation and regulations requiring advertisers to obtain specific types of notice and consent from individuals before using cookies or other technologies to track individuals and their online behavior and deliver targeted advertisements. It remains a possibility that additional legislation and regulations may be passed or otherwise issued in the future. We also participate in industry self-regulatory programs under which, in addition to other compliance obligations, we provide consumers with notice about our use of cookies and our collection and use of data in connection with the delivery of targeted advertising and allow them to opt-out from the use of data we collect for the delivery of targeted advertising. The rules and policies of the self-regulatory programs that we participate in are updated from time to time and may impose additional restrictions upon us in the future.
Any failure, or perceived failure, by us to comply with U.S. federal, state, or international laws or regulations pertaining to privacy or data protection, or other policies, self-regulatory requirements or legal obligations could result in proceedings or actions against us by governmental entities or others.
In December 2011, the FTC issued an order in connection with the resolution of allegations that from April 2007 until September 2009, before we acquired ScanScout, ScanScout's privacy policy was deceptive with respect to cookies and consumers' ability to opt-out from data collection. The order requires that we do not misrepresent the extent to which data from or about a particular user or the user's online activities is collected, used, disclosed, or shared, or the extent to which users may exercise control over the collection, use, disclosure, or sharing of data collected from or about them, their computers or devices, or their online activities. It also requires that we: (1) notify users that our websites collect information for the purpose of sending targeted advertisements, along with a hyperlink to an opt-out mechanism, (2) include a hyperlink to such opt-out mechanism within or immediately adjacent to display advertisements; (3) undertake reasonable efforts to develop and implement a hyperlink to such opt out mechanism within or immediately adjacent to video advertisements; and (4) engage in recordkeeping and reporting obligations. The obligations under the order remain in effect until the latter of December 14, 2031, or the date 20 years after the date, if any, on which the U.S. government or the FTC files a complaint in federal court alleging any violation of the order. A violation of the order could lead to an FTC action for civil penalties. In addition, ScanScout was subject to a putative class action legal proceeding regarding its use of "Flash" cookies, which was settled in March 2012 and dismissed with prejudice.
Advertising
Even though we generally receive certain contractual protections from our advertisers with respect to their video ads, we may nevertheless be subject to regulations concerning the content of ads. Federal and state laws governing intellectual property or other third-party rights could apply to the content of ads we place. Laws and regulations regarding unfair and deceptive advertising, sweepstakes, advertising to children, and other consumer protection regulations, may also apply to the ads we place on behalf of clients.
Industry Alliances
Given the developmental stage of video advertising, industry practices are rapidly evolving. We are participating members of the Digital Advertising Alliance, or DAA, including the DAA Principles and Communications Advisory Committee, which oversees the DAA and its working groups. We also participate in a wide range of IAB committees, councils and working groups, such as the IAB Public Policy Council, the Networks and Exchanges Committee, the Digital Video VAST & VPAID Standards Update Working Group, the Digital Video Committee, as well as other industry groups that are focused on establishing best practices for the online video advertising industry. In February 2013, our Chief Revenue Officer, Randy Kilgore, was elected as Chairman of the Interactive Advertising Bureau board of directors.
93
Employees
As of March 31, 2013, we had 249 employees, of which 68 were primarily engaged in technology and development, 154 were engaged in sales and marketing, and 27 were engaged in general and administrative. Substantially all of these employees are located in the United States. None of our employees is represented by a labor union or covered by a collective bargaining agreement. We consider our relationship with our employees to be good.
Facilities
Our principal offices occupy approximately 22,000 square feet of leased office space in New York, New York pursuant to a lease agreement that expires in 2021. We also lease offices in San Francisco, California; Santa Monica, California; Chicago, Illinois; Boston, Massachusetts; Southfield, Michigan; Irving, Texas; London, England; and Singapore. We also utilize a third-party data center hosting facility located in Boston, Massachusetts. We believe our facilities are adequate for our current and near-term needs.
Legal Proceedings
From time to time we are involved in legal proceedings or subject to claims arising in the ordinary course of our business. Although the results of litigation and claims cannot be predicted with certainty, we do not believe we are a party to any legal proceedings that, if determined adversely to us, would individually or taken together have a material adverse effect on our business, operating results, financial condition or cash flows. Regardless of the outcome, litigation can have an adverse impact on us because of defense and settlement costs, diversion of management resources and other factors.
94
Directors and Executive Officers
The following table sets forth information concerning our directors and executive officers, including their ages as of April 15, 2013:
Name
|
Age | Position | |||
|---|---|---|---|---|---|
Executive Officers: |
|||||
William Day |
48 | President, Chief Executive Officer and Director | |||
Todd Sloan |
50 | Senior Vice President, Chief Financial Officer and Treasurer | |||
Lauren Wiener |
45 | President, Global Sales and Marketing | |||
Steven Lee |
37 | Senior Vice President and Chief Technology Officer | |||
Adam Lichstein |
45 | Senior Vice President, Chief Operating Officer, General Counsel and Secretary | |||
Non-Employee Directors: |
|||||
Laura Desmond |
48 | Director | |||
Randall Glein(1)(3) |
47 | Director | |||
Rachel Lam(1) |
45 | Director | |||
Warren Lee(2)(3) |
43 | Director | |||
James Rossman(2) |
47 | Director | |||
Robert Schechter(1) |
64 | Director | |||
- (1)
- Member of the audit committee.
- (2)
- Member of the compensation committee.
- (3)
- Member of the nominating and corporate governance committee.
Executive Officers
William Day has served as a member of our board of directors and our Chief Executive Officer since December 2010. From September 2008 to December 2010, Mr. Day served as the Chief Executive Officer of ScanScout, Inc., or ScanScout, until it merged with us in December 2010. From August 2007 to September 2008, Mr. Day served as Chief Media Officer of Marchex, Inc., a local consumer search and merchant ad platform. Mr. Day co-founded About.com, Inc., a public online resource company, in June 1996 and served at the company in a variety of capacities through December 2003, including as its President and Chief Executive Officer. Mr. Day received a B.S. in mechanical engineering from Yale University and an M.B.A. from The Wharton School of the University of Pennsylvania. The board of directors believes that Mr. Day should serve on our board of directors due to his extensive knowledge of our business, his experience in founding and building technology companies as well as his corporate vision and operational knowledge, which provide strategic guidance to our board of directors.
Todd Sloan has served as a Senior Vice President and our Chief Financial Officer since December 2011. From May 2010 to December 2011, Mr. Sloan served as the Chief Financial Officer of AdKeeper Inc., an internet advertising company. From January 2009 to April 2010, he served as the Chief Financial Officer of Operative Media, Inc., an ad management technology company. From September 2007 to December 2008, he served as the Chief Financial Officer at Heavy, Inc., a broadband entertainment company. From 2002 until August 2007, he served as Executive Vice President Corporate Development and Chief Financial Officer of NetRatings, Inc., a public audience measurement and analysis company. From 1999 to 2001, Mr. Sloan served as Chief Financial Officer of About.com, Inc. Mr. Sloan received a B.B.A. in finance and accounting from the University of Wisconsin—Madison.
Lauren Wiener has served as our President, Global Sales and Marketing since October 2012. From 2003 to 2012, Ms. Wiener served in various capacities at Meredith Digital at Meredith Corporation, a media and marketing company, including Senior Vice President, Digital from May 2008 to October
95
2012, Vice President, Digital from October 2005 to May 2008, and Managing Director, Digital Sales and Marketing from July 2003 to October 2005. Ms. Wiener received a B.A. in history from Yale University and an M.B.A. from the Harvard Business School.
Steven Lee has served as a Senior Vice President and our Chief Technology Officer since December 2010. From December 2011 until May 2013, Mr. Lee served as a member of our board of directors. In November 2005, Mr. Lee co-founded ScanScout and served as its Chief Technical Officer from November 2005 to December 2010. Mr. Lee received a B.S. in electrical science and engineering and an M.E. in electrical engineering and computer science from Massachusetts Institute of Technology. The board of directors believes that Mr. Lee's extensive knowledge of our business as a co-founder of ScanScout, his insight into our day-to-day operational activities and his thorough technical understanding of our products allow him to make valuable contributions to our board of directors.
Adam Lichstein has served as a Senior Vice President and our Chief Operating Officer and General Counsel since April 2012. From December 2010 to April 2012, Mr. Lichstein served as our Senior Vice President, Publisher Development and General Counsel. From February 2010 to December 2010, Mr. Lichstein served as Senior Vice President, Operations and General Counsel of ScanScout. From April 2007 to February 2010, he served as Chief Operating Officer of ShopText, Inc., a mobile commerce and promotions company. Mr. Lichstein received a B.A. in history from Dartmouth College and a J.D. from New York University School of Law.
Non-Employee Directors
Laura Desmond has served as a member of our board of directors since January 2012. Since 2008, Ms. Desmond has served as the Global Chief Executive Officer of Starcom MediaVest Group, a global marketing services company which is part of the Publicis Groupe, S.A. She is also a member of the Publicis Groupe P12, an executive committee comprised of the company's top global leaders. Prior to her appointment as Global Chief Executive Officer in 2008, Ms. Desmond was Chief Executive Officer of SMG—The Americas from 2007 to 2008, where she managed a network spanning the United States, Canada and Latin America. She was Chief Executive Officer of MediaVest, based in New York, from 2003 to 2007, and from 2000 to 2002 she was Chief Executive Officer of SMG's Latin America group. Ms. Desmond also serves on the board of directors of Adobe, Inc., a multinational computer software company. She received a B.B.A. in marketing from the University of Iowa. The board of directors believes that Ms. Desmond should serve on our board of directors due to her experience as Global Chief Executive Officer of SMG as well as her prior senior executive positions at SMG. The board of directors believes Ms. Desmond's deep expertise in global media and marketing technology organizations, leadership capabilities and business acumen also allow her to make valuable contributions to our board of directors. In addition, her service on other board of directors gives her valuable industry knowledge and perspective.
Randall Glein has served as a member of our board of directors since April 2010. Since August 2006, he has served as a Managing Director of DFJ Growth Fund, a venture capital fund, which he co-founded. He currently serves on the boards of directors of several private technology companies. Mr. Glein received an M.B.A. from UCLA Anderson, an M.S. in electrical engineering from the University of Southern California, and a B.S. in electrical engineering from the University of Florida. The board of directors believes that Mr. Glein's experience over two decades in the technology and media industries as a venture capital investor, operating executive and entrepreneur allow him to make valuable contributions to our board of directors.
Rachel Lam has served as a member of our board of directors since May 2013. Since 2003, she has served as Group Managing Director of the Time Warner Investments group, the strategic investing arm of Time Warner Inc. She currently serves on the board of directors of several private technology and
96
digital media companies. Ms. Lam received a B.S. degree in industrial engineering and operations research from U.C. Berkeley and an M.B.A. degree from Harvard Business School. The board of directors believes that Ms. Lam's experience with digital media and technology companies allows her to make valuable contributions to our board of directors.
Warren Lee has served as a member of our board of directors since September 2006. Since June 2011, he has served as a General Partner of Canaan Partners, a venture capital firm. From July 2005 until June 2011, he served in various capacities at Canaan Partners including Principal then Partner. He currently also serves on the boards of directors of several private technology companies. Mr. Lee received a B.S. in computer science, and a B.A. in economics from Stanford University and an M.B.A. from The Wharton School of the University of Pennsylvania. The board of directors believes that Mr. Lee's experience in digital media and internet investments allows him to make valuable contributions to our board of directors.
James Rossman has served as a member of our board of directors since January 2011. Mr. Rossman served as our chairman from August 2012 to May 2013. From April 2009 to June 2012, he served as President and Chief Operating Officer of AKQA Inc., a digital services company. From April 2001 to March 2009, Mr. Rossman served as Chief Operating Officer of Digitas, Inc., an integrated advertising agency and a member of the Publicis Groupe, S.A. Mr. Rossman received a B.A. in economics from Trinity College and an M.B.A. from the Kellogg School of Management at Northwestern University. The board of directors believes that Mr. Rossman's experience in marketing and advertising allows him to make valuable contributions to our board of directors.
Robert Schechter has served as a member of our board of directors since June 2013. From 1995 to 2008, he served as the Chief Executive Officer of NMS Communications Corporation (now known as LiveWire Mobile, Inc.), a global provider of hardware and software solutions for the communications industry, and served as the chairman of its board of directors from 1996 to 2008. He currently serves on the board of directors of PTC Inc., a provider of software solutions and related services for product development, where he is the chair of the audit committee and a member of the compensation committee. He also currently serves on the board of directors of EXA Corp, a developer of computational fluid dynamics solutions and another privately held company. Mr. Schechter received a B.S. degree from Rensselaer Polytechnic Institute and an M.B.A. from the Wharton School of the University of Pennsylvania. The board of directors believes that Mr. Schechter's prior management, international operating, financial and sales and marketing experience as a senior executive at publicly traded companies as well as his current and past service on the board of directors of a range of public and private companies allows him to make valuable contributions to our board of directors.
Family Relationships
There are no family relationships among any of our executive officers or directors.
Board Composition
Our board of directors currently consists of seven members. Each director is currently elected to the board of directors for a one-year term, to serve until the election and qualification of a successor director at our annual meeting of stockholders, or until the director's earlier removal, resignation or death.
All of our directors currently serve on the board of directors pursuant to the voting provisions of a sixth amended and restated voting agreement between us and several of our stockholders. This agreement will terminate upon the completion of this offering, after which there will be no further contractual obligations regarding the election of our directors. See the section titled "Related Party Transactions" for a description of this agreement.
97
In accordance with our certificate of incorporation, which will be in effect immediately after this offering, our board of directors will be divided into three classes with staggered three-year terms. At each annual meeting of stockholders, the successors to directors whose terms then expire will be elected to serve from the time of election and qualification until the third annual meeting following election. Our directors will be divided among the three classes as follows:
- •
- Class I, which will consist of Mr. Glein and Mr. Lee, and whose term will expire at our first annual
meeting of stockholders to be held after the completion of this offering;
- •
- Class II, which will consist of Ms. Desmond, Mr. Rossman and Ms. Lam, and whose term will
expire at our second annual meeting of stockholders to be held after the completion of this offering; and
- •
- Class III, which will consist of Mr. Day and Mr. Schechter, and whose term will expire at our third annual meeting of stockholders to be held after the completion of this offering.
Our bylaws, which will become effective upon completion of this offering, will provide that the authorized number of directors may be changed only by resolution approved by a majority of our board of directors. Any additional directorships resulting from an increase in the number of directors will be distributed among the three classes so that, as nearly as possible, each class will consist of one-third of the directors.
The division of our board of directors into three classes with staggered three-year terms may delay or prevent a change of our management or a change in control.
Director Independence
Our board of directors has undertaken a review of the independence of the directors and considered whether any director has a material relationship with us that could compromise his or her ability to exercise independent judgment in carrying out his or her responsibilities. Based upon information requested from and provided by each director concerning such director's background, employment and affiliations, including family relationships, our board of directors determined that Mmes. Desmond and Lam and Messrs. Glein, Lee, Rossman and Schechter, representing six of our seven directors, are "independent directors" as defined under applicable stock exchange rules and the independence requirements contemplated by Rule 10A-3 under the Securities Exchange Act of 1934, as amended, or the Exchange Act. In making these determinations, our board of directors considered the current and prior relationships that each non-employee director has with our company and all other facts and circumstances that our board of directors deemed relevant in determining their independence, including the beneficial ownership of our capital stock by each non-employee director and the transactions involving them described in the section of this prospectus titled "Certain Relationships and Related-Party Transactions."
Lead Independent Director
Our corporate governance guidelines provide that one of our independent directors shall serve as a lead independent director at any time when an independent director is not serving as the chairman of the board of directors. Our board of directors has appointed Mr. Lee, effective upon the closing of this offering, to serve as our lead independent director. As lead independent director, Mr. Lee will preside over periodic meetings of our independent directors, coordinate activities of the independent directors and perform such additional duties as our board of directors may otherwise determine and delegate.
Board Committees
Our board of directors has established an audit committee and a compensation committee and intends to form a nominating and corporate governance committee in connection with this offering,
98
each of which has the composition and responsibilities described below. From time to time, the board may establish other committees to facilitate the management of our business.
Audit Committee
Our audit committee consists of three directors, Messrs. Glein and Schechter and Ms. Lam. The composition of our audit committee meets the requirements for independence under current NYSE listing standards and SEC rules and regulations. Each member of our audit committee meets the financial literacy requirements of the NYSE listing standards. Mr. Schechter is the chairman of the audit committee and our board of directors has determined that Mr. Schechter is an audit committee "financial expert" as defined by Item 407(d) of Regulation S-K under the Securities Act of 1933, as amended, or the Securities Act. The principal duties and responsibilities of our audit committee include, among other things:
- •
- selecting a qualified firm to serve as the independent registered public accounting firm to audit our financial
statements;
- •
- helping to ensure the independence and performance of the independent registered public accounting firm;
- •
- discussing the scope and results of the audit with the independent registered public accounting firm, and reviewing, with
management and the independent accountants, our interim and year-end operating results;
- •
- developing procedures for employees to submit concerns anonymously about questionable accounting or audit matters;
- •
- reviewing our policies on risk assessment and risk management;
- •
- reviewing related party transactions;
- •
- obtaining and reviewing a report by the independent registered public accounting firm at least annually, that describes
our internal quality-control procedures, any material issues with such procedures, and any steps taken to deal with such issues when required by applicable law;
and
- •
- approving (or, as permitted, pre-approving) all audit and all permissible non-audit services, other than de minimis non-audit services, to be performed by the independent registered public accounting firm.
Our audit committee will operate under a written charter, to be effective immediately prior to the completion of this offering, that satisfies the applicable rules of the SEC and the listing standards of the NYSE.
Compensation Committee
Our compensation committee consists of two directors, Messrs. Lee and Rossman, each of whom is a non-employee member of our board of directors as defined in Rule 16b-3 under the Exchange Act and an outside director as that term is defined in Section 162(m) of the Internal Revenue Code of 1986, or the Code. Mr. Rossman is the chairman of the compensation committee. The composition of our compensation committee meets the requirements for independence under current NYSE listing standards and SEC rules and regulations. The principal duties and responsibilities of our compensation committee include, among other things:
- •
- reviewing and approving, or recommending that our board of directors approve, the compensation of our executive officers;
- •
- reviewing and recommending to our board of directors the compensation of our directors;
99
- •
- reviewing and approving, or recommending that our board of directors approve, the terms of compensatory arrangements with
our executive officers;
- •
- administering our stock and equity incentive plans;
- •
- reviewing and approving, or recommending that our board of directors approve, incentive compensation and equity plans;
and
- •
- reviewing and establishing general policies relating to compensation and benefits of our employees and reviewing our overall compensation philosophy.
Our compensation committee will operate under a written charter, to be effective immediately prior to the completion of this offering, that satisfies the applicable rules of the SEC and the listing standards of the NYSE.
Nominating and Corporate Governance Committee
The nominating and corporate governance committee consists of two directors, Messrs. Glein and Lee. Mr. Lee is the chairman of the nominating and corporate governance committee. The composition of our nominating and governance committee meets the requirements for independence under current NYSE listing standards and SEC rules and regulations. The nominating and corporate governance committee's responsibilities include, among other things:
- •
- identifying, evaluating and selecting, or recommending that our board of directors approve, nominees for election to our
board of directors and its committees;
- •
- evaluating the performance of our board of directors and of individual directors;
- •
- considering and making recommendations to our board of directors regarding the composition of our board of directors and
its committees;
- •
- reviewing developments in corporate governance practices;
- •
- evaluating the adequacy of our corporate governance practices and reporting;
- •
- developing and making recommendations to our board of directors regarding corporate governance guidelines and matters;
and
- •
- overseeing an annual evaluation of the board's performance.
Our nominating and governance committee will operate under a written charter, to be effective immediately prior to the completion of this offering, that satisfies the applicable rules of the SEC and the listing standards of the NYSE.
Code of Business Conduct and Ethics
In connection with this offering, we have adopted a Code of Business Conduct and Ethics, or the Code of Conduct, applicable to all of our employees, executive officers and directors, which will become effective immediately prior to the completion of this offering. Following the completion of this offering, the Code of Conduct will be available on our website at www.tremorvideo.com. The nominating and corporate governance committee of our board of directors will be responsible for overseeing the Code of Conduct and must approve any waivers of the Code of Conduct for employees, executive officers and directors. We expect that any amendments to the Code of Conduct, or any waivers of its requirements, will be disclosed on our website.
100
Compensation Committee Interlocks and Insider Participation
None of our executive officers currently serves, or in the past year has served, as a member of the board of directors or compensation committee of any entity that has one or more executive officers serving on our board of directors or compensation committee.
Non-Employee Director Compensation
We grant options to our independent directors who are not employees or affiliated with our largest venture capital and private equity firm investors upon joining our board of directors, subject to monthly vesting over four years. On January 19, 2011, our board of directors granted James Rossman an option for 103,593 shares of our common stock at an exercise price of $4.28 per share. In recognition of Mr. Rossman's appointment as chairman of our board of directors, on August 7, 2012, our board of directors also granted Mr. Rossman an option for an additional 33,333 shares of our common stock at an exercise price of $5.01 per share. On January 19, 2012, our board of directors granted Laura Desmond an option for 116,666 shares of our common stock at an exercise price of $6.06 per share, which option exercise price was modified to be $5.01 per share in July 2012. In connection with Robert Schechter's appointment to our board of directors, on June 4, 2013, our board of directors granted Mr. Schechter an option for 41,666 shares of our common stock at an exercise price of $8.15 per share. Each of the foregoing option grants vests, subject to continued service with our company, in equal monthly installments over four years measured from the date of the grant. Additionally, each director has a three year period to exercise the option grant after they no longer serve on our board of directors. All of the unvested shares subject to these options vest upon the closing of a change in control.
Other than the option grants listed above, our directors were not historically entitled to receive any compensation in connection with their service on our board of directors, except for reimbursement of direct expenses incurred in connection with attending meetings of the board or committees thereof.
Our board of directors has adopted a director compensation policy for non-employee directors to be effective upon the closing of this offering. Pursuant to this policy, non-employee directors will be compensated $30,000 annually for their services and will not receive any additional compensation for any regular board meeting attended. Our lead non-employee director will receive an additional annual retainer of $20,000. Non-employee directors will receive $5,000 annually for serving on the audit committee, compensation committee, and nominating and corporate governance committee. In addition, directors who are chairpersons of a particular committee will also receive additional annual compensation of $15,000 for the audit committee, and $10,000 for the compensation committee, and $7,500 for the nominating and corporate governance committee. Non-employee directors will also be reimbursed for their reasonable out-of-pocket expenses incurred in attending meetings of our board of directors. Non-employee directors will be granted annually equity-based awards having an aggregate grant date fair value of $100,000 in the form of restricted stock units. Any restricted stock unit grant will vest in full on the meeting date of the next annual stockholders' meeting. Newly appointed directors will receive equity-based awards having an aggregate grant date fair value of $200,000 which may be in the form of stock options, restricted stock units, or a combination of both. These awards will vest under the same terms as the annual awards. In accordance with the policy of her employer, Ms. Lam will not participate in our non-employee director compensation policy. We intend to grant each of our non-employee directors, other than Ms. Lam, restricted stock units having an aggregate grant date fair value of $100,000 based upon the closing price of our common stock on the date of this offering.
101
2012 Director Compensation Table
The following table sets forth information regarding the compensation earned for service on our board of directors during the year ended December 31, 2012 by our directors who were not also our employees. William Day, our President and Chief Executive Officer, is also a director. Steven Lee, a Senior Vice President and our Chief Technology Officer, was also a director until May 23, 2013. Mr. Day does not and Mr. Lee did not receive any additional compensation for their services as directors. Mr. Day's compensation as an executive officer is set forth below under the section of this prospectus titled "Executive Compensation—Summary Compensation Table."
Name
|
Option Awards ($)(1)(5) |
Total ($) | |||||
|---|---|---|---|---|---|---|---|
Laura Desmond |
$ | 293,619 | $ | 293,619 | |||
Randall Glein |
— | — | |||||
Jason Glickman(2) |
— | — | |||||
Michael Gordon(2) |
— | — | |||||
Rachel Lam(3) |
— | — | |||||
Warren Lee |
— | — | |||||
Robert Migliorino(2) |
— | — | |||||
David Orfao(2) |
— | — | |||||
James Rossman |
87,670 | 87,670 | |||||
Robert Schechter(4) |
— | — | |||||
- (1)
- This column reflects the full grant date fair value for options granted during the year as measured pursuant to Accounting Standards Codification, or ASC, Topic 718 as stock-based compensation in our financial statements. Unlike the calculations contained in our financial statements, this calculation does not give effect to any estimate of forfeitures related to service-based vesting, but assumes that the director will perform the requisite service for the award to vest in full. The assumptions we used in valuing options are described in note 12 to our consolidated financial statements included in this prospectus. With respect to Ms. Desmond's award, reflects an incremental increase in fair value of $28,151 of an option to acquire 116,666 shares of our common stock that was repriced in July 2012.
- (2)
- This director served on our board of directors until May 23, 2013.
- (3)
- Ms. Lam was appointed to our board of directors in May 2013.
- (4)
- Mr. Schechter was appointed to our board of directors in June 2013.
- (5)
- The table below shows the aggregate number of option awards outstanding for each of our non-employee directors as of December 31, 2012:
Name
|
Aggregate Option Awards Outstanding (#) |
|||
|---|---|---|---|---|
Laura Desmond |
116,666 | (1) | ||
Randall Glein |
— | |||
Jason Glickman(4) |
66,666 | (2) | ||
Michael Gordon(4) |
— | |||
Rachel Lam(5) |
— | |||
Warren Lee |
— | |||
Robert Migliorino(4) |
— | |||
David Orfao(4) |
— | |||
James Rossman |
214,700 | (3) | ||
Robert Schechter(6) |
— | |||
- (1)
- 1/48 of the total shares underlying this option grant vest in equal monthly installments over four years commencing January 19, 2012.
- (2)
- 25% of the total shares underlying this option grant vest after 12 months, with the remaining shares vesting 1/48 per month for each of the 36 months thereafter commencing on April 6, 2011.
- (3)
- As to 103,593 shares: 1/48 of the total shares underlying this option grant vest in equal monthly installments over four years commencing on January 19, 2011. As to 33,333 shares: 1/48 of the total shares underlying this option grant vest in equal monthly installments over four years commencing on August 7, 2012. 77,774 shares subject to such options were fully vested as of December 31, 2012.
- (4)
- This director served on our board of directors until May 23, 2013.
- (5)
- Ms. Lam was appointed to our board of directors in May 2013.
- (6)
- Mr. Schechter was appointed to our board of directors in June 2013.
102
2012 Summary Compensation Table
The following table sets forth information regarding compensation earned during the year ended December 31, 2012 by our named executive officers, which include our principal executive officer, the next two most highly compensated executive officers for 2012, and one additional current employee who served as an executive officer during part of 2012 for whom disclosure is required pursuant to SEC rules.
Name and Principal Position
|
Salary ($) | Bonus | Option Awards ($)(1) |
Non-Equity Incentive Plan Compensation ($)(2) |
Total ($) | |||||||||||
|---|---|---|---|---|---|---|---|---|---|---|---|---|---|---|---|---|
William Day |
$ | 397,917 | $ | — | $ | — | $ | 124,026 | $ | 521,943 | ||||||
Lauren Wiener(3) |
93,782 | 40,000 | (4) | 992,707 | — | 1,126,489 | ||||||||||
Adam Lichstein |
270,849 | — | 93,766 | (5) | 90,833 | 454,848 | ||||||||||
Randy Kilgore(6) |
375,000 | 5,112 | (7) | — | 186,696 | 566,808 | ||||||||||
- (1)
- This column reflects the full grant date fair value for options granted during the year as measured pursuant to ASC Topic 718 as stock-based compensation in our consolidated financial statements. Unlike the calculations contained in our financial statements, this calculation does not give effect to any estimate of forfeitures related to service-based vesting, but assumes that the named executive officer will perform the requisite service for the award to vest in full. The assumptions we used in valuing options are described in note 12 to our consolidated financial statements included in this prospectus.
- (2)
- These amounts represented non-equity incentive plan compensation pursuant to our 2012 bonus plan, other than for Mr. Kilgore where such amounts represent payments pursuant to his sales commission plan where commissions were derived as a percentage of achievement of our revenue goals. For additional information with respect to our 2012 bonus plan see the section of this prospectus titled "—2012 Bonus Plan."
- (3)
- Ms. Wiener joined us in October 2012 and her cash compensation information reflects a partial year of service.
- (4)
- This amount represented a cash payment Ms. Wiener was entitled to receive so long as Ms. Wiener remained an employee in good standing through December 31, 2012.
- (5)
- Reflects $8,817 of incremental increase in fair value of an option to acquire 33,333 shares of our common stock that was repriced in July 2012.
- (6)
- Mr. Kilgore was an executive officer until October 2012 and remains a Senior Vice President and our Chief Revenue Officer.
- (7)
- This amount includes a discretionary bonus paid to Mr. Kilgore with respect to 2012.
103
Outstanding Equity Awards as of December 31, 2012
The following table provides information about outstanding stock options held by each of our named executive officers at December 31, 2012. Our named executive officers did not hold any restricted stock or other stock awards as of December 31, 2012.
Name
|
Number of Securities Underlying Unexercised Options (#) Exercisable |
Number of Securities Underlying Unexercised Options (#) Unexercisable |
Option Exercise Price ($) |
Option Expiration Date |
|||||||||
|---|---|---|---|---|---|---|---|---|---|---|---|---|---|
William Day |
332,366 | — | $ | 1.49 | 9/1/2018 | (1) | |||||||
|
147,668 | 25,212 | 1.11 | 2/11/2020 | (2) | ||||||||
|
524,333 | 524,332 | 4.28 | 2/2/2021 | (3) | ||||||||
Lauren Wiener |
— | 340,000 | 5.60 | 12/6/2022 | (4) | ||||||||
Adam Lichstein |
34,588 | 14,242 | 1.11 | 2/11/2020 | (5) | ||||||||
|
79,183 | 79,183 | 4.28 | 2/2/2021 | (6) | ||||||||
|
— | 33,333 | 5.01 | 4/24/2022 | (7) | ||||||||
Randy Kilgore |
270,120 | — | 0.20 | 3/22/2017 | (8) | ||||||||
|
102,254 | — | 0.84 | 7/23/2018 | (9) | ||||||||
|
31,944 | 44,722 | 4.28 | 4/5/2021 | (10) | ||||||||
- (1)
- The shares subject to this option were fully vested as of September 2, 2012.
- (2)
- 25% of the total shares underlying this option vested on July 1, 2010. The remaining shares vest 1/48 at the end of each full month over the next 36 months thereafter, subject to continued service to us through each vesting date. This option may be subject to accelerated vesting as described below.
- (3)
- 25% of the total shares underlying this option vested on December 9, 2011. The remaining shares vest 1/48 per month over the next 36 months thereafter, subject to continued service to us through each vesting date. This option may be subject to accelerated vesting as described below.
- (4)
- 25% of the total shares underlying this option will vest on October 22, 2013. The remaining shares vest 1/48 per month over the next 36 months thereafter, subject to continued service to us through each vesting date. This option may be subject to accelerated vesting as described below.
- (5)
- 25% of the total shares underlying this option vested on February 16, 2011. The remaining shares vest 1/48 per month over the next 36 months thereafter, subject to continued service to us through each vesting date. This option may be subject to accelerated vesting as described below.
- (6)
- 25% of the total shares underlying this option vested on December 9, 2011. The remaining shares vest 1/48 per month over the next 36 months thereafter, subject to continued service to us through each vesting date. This option may be subject to accelerated vesting as described below.
- (7)
- 25% of the total shares underlying this option will vest on April 25, 2013. The remaining shares vest 1/48 per month over the next 36 months thereafter, subject to continued service to us through each vesting date. This option may be subject to accelerated vesting as described below.
- (8)
- The shares subject to this option were fully vested as of September 18, 2010.
- (9)
- The shares subject to this option were fully vested as of January 1, 2012.
- (10)
- 25% of the total shares underlying this option vested on April 6, 2012. The remaining shares vest 1/48 per month over the next 36 months thereafter, subject to continued service to us through each vesting date. This option may be subject to accelerated vesting as described below.
Employment Arrangements
The initial terms and conditions of employment for each of our named executive officers are set forth in employee offer letters. These offer letters generally provide for payment of continued salary and health insurance premiums for certain periods following either a termination without cause or resignation for good reason (as defined in the applicable offer letter), in exchange for a release of claims. These offer letters also provide for accelerated vesting of specified equity awards following a change in control transaction and following termination within a specified period of time following a change in control transaction. Each of our named executive officers is an at will employee.
104
The amount and terms of these benefits reflect the negotiations of each of our named executive officers with us. We consider these severance and change in control benefits critical to attracting and retaining high caliber executives. We believe that appropriately structured severance benefits, including accelerated vesting provisions, minimize the distractions and reduce the risk that an executive voluntarily terminates his or her employment with us during times of uncertainty, such as before an acquisition is completed. We believe that our existing arrangements allow each named executive officer to focus on continuing normal business operations and, for change in control benefits, on the success of a potential business combination, rather than on how business decisions that may be in the best interest of our stockholders will impact his or her own financial security.
The following table sets forth their current base salaries, 2013 bonus target, and a summary of the material severance and change in control arrangements with our named executive officers:
Named Executive Officer
|
2013 Salary and Bonus Target | Severance and Change in Control Benefits | ||
|---|---|---|---|---|
William Day |
Salary: $400,000 Bonus Target: $150,000 |
Severance: If we terminate his employment for any reason other than for cause, death or disability or Mr. Day resigns for good reason, and he delivers a general release of claims to us and continues to comply with his confidentiality invention assignment agreement, he is entitled to receive the following severance benefits: (1) 12 months of continued salary; (2) 100% of that fiscal year's target bonus; (3) paid COBRA coverage for 12 months; and (4) 25% acceleration of the shares subject to his option to acquire 1,048,666 shares of our common stock granted on February 3, 2011. | ||
|
Change in Control: Upon the closing of a change in control transaction, Mr. Day is entitled to 100% acceleration of the unvested shares subject to his option to acquire 172,880 shares of our common stock granted on February 12, 2010 and 25% acceleration of the unvested shares subject to his option to acquire 1,048,666 shares of our common stock granted on February 3, 2011. Further, if Mr. Day is terminated without cause or resigns for good reason within 12 months following the closing of a change in control transaction, Mr. Day is entitled to 100% acceleration of the unvested shares subject to his option to acquire 1,048,666 shares of our common stock granted on February 3, 2011. |
|||
|
Upon termination of employment, Mr. Day has a five year period to exercise any of the vested or accelerated February 3, 2011 options that do not qualify as incentive stock options under the Code and any of the vested or accelerated February 12, 2010 options, provided that no option exercise period will extend beyond the 10 year term of the applicable option. |
|||
|
105
Named Executive Officer
|
2013 Salary and Bonus Target | Severance and Change in Control Benefits | ||
|---|---|---|---|---|
Lauren Wiener |
Salary: $475,000 |
Severance: If we terminate her employment for any reason other than for cause, death or disability or Ms. Wiener resigns for good reason, and she delivers a general release of claims to us and continues to comply with her confidentiality invention assignment agreement, Ms. Wiener is entitled to receive the following severance benefits: (1) six months of continued salary; (2) a pro rated portion of that year's target bonus and any earned but unpaid bonuses from prior periods; and (3) paid COBRA coverage for six months. |
||
|
Change in Control: If we terminate her employment for any reason other than for cause, death or disability or Ms. Wiener resigns for good reason following the closing of a change in control transaction, Ms. Wiener is entitled to 50% acceleration of the unvested shares subject to her option to acquire 340,000 shares of our common stock granted on December 7, 2012. |
|||
|
Upon termination of employment, Ms. Wiener has a five year period to exercise any vested or accelerated options granted on December 7, 2012, that do not qualify as incentive stock options under the Code, provided that no option exercise period will extend beyond the 10 year term of the applicable option. |
|||
Adam Lichstein |
Salary: $275,000 |
Severance: If we terminate his employment for any reason other than for cause, death or disability or Mr. Lichstein resigns for good reason, and he delivers a general release of claims to us and continues to comply with his confidentiality invention assignment agreement, Mr. Lichstein is entitled to receive the following severance benefits: (1) six months of continued salary; (2) a pro rated portion of that year's target bonus; and (3) continued COBRA coverage for the same periods of time as his continued salary payments. |
106
Named Executive Officer
|
2013 Salary and Bonus Target | Severance and Change in Control Benefits | ||
|---|---|---|---|---|
|
Change in Control: Upon the closing of a change in control transaction, Mr. Lichstein is entitled to 50% of the unvested shares subject to his option to acquire 48,831 shares of our common stock granted on February 12, 2010. Further, if Mr. Lichstein is terminated without cause or resigns for good reason within 12 months following the closing of a change in control transaction, Mr. Lichstein is entitled to (1) 50% acceleration of the unvested shares subject to his option to acquire 158,366 shares of our common stock granted on February 3, 2011; (2) 50% acceleration of the unvested shares subject to his option to acquire 33,333 shares of our common stock granted on April 25, 2012 and (3) 50% acceleration of the unvested shares subject to his option to acquire 100,000 shares of our common stock granted on May 23, 2013. |
|||
|
Upon termination of employment, Mr. Lichstein has a five year period to exercise any vested or accelerated options granted on February 12, 2010, February 3, 2011 or May 23, 2013 that do not qualify as incentive stock options under the Code, provided that no option exercise period will extend beyond the 10 year term of the applicable option. |
|||
Randy Kilgore |
Salary: $400,000 |
Severance: If we terminate his employment for any reason other than for cause, death or disability or Mr. Kilgore resigns for good reason, and he delivers a general release of claims to us and continues to comply with his confidentiality invention assignment agreement, Mr. Kilgore is entitled to receive the following severance benefits: (1) three months of continued salary if his termination of employment occurs before a change in control transaction and six months of continued salary if his termination of employment occurs following a change in control transaction; (2) a pro rated portion of that year's target bonus; and (3) continued COBRA coverage for the same periods of time as his continued salary payments. |
||
|
Change in Control: If we terminate Mr. Kilgore's employment without cause following a change in control, and he delivers a general release of claims to us, Mr. Kilgore is entitled to 50% acceleration of any of his then unvested shares subject to his option to acquire 270,120 shares of our common stock granted on March 23, 2007. |
107
The definitions of "cause," "change in control," "disability" and "good reason" referenced above are defined in the individual offer letters with each of the named executive officers, respectively, or the applicable equity incentive plan under which the stock option was granted.
2012 Bonus Plan
In 2012, Messrs. Day and Lichstein were eligible to earn annual performance bonuses based on individual and company performance pursuant to our 2012 bonus plan. The company component included revenue, gross margin, Adjusted EBITDA and year-end cash objectives and the individual component was measured by individual performance goals set by our compensation committee. The amount of the bonus earned, and the evaluations of individual and company performance were based on defined allocation ranges and formulas. In 2012, Mr. Kilgore was eligible to earn an annual bonus payment pursuant to his sales commission plan where commissions were derived as a percentage of achievement of our revenue goals. In March 2012, the compensation committee established individual target annual cash bonus opportunities for Messrs. Day and Lichstein for 2012. Ms. Wiener, who joined us in October 2012, received a guaranteed annual bonus payment provided she remained employed by us through December 31, 2012. There was also an ability to receive cash for performance in excess of these objectives capped at 150% of the target award for Mr. Day and 200% of the target award for Mr. Lichstein. The applicable targets for our named executive officers under the 2012 bonus plan were as follows: $150,000 for Mr. Day and $100,000 for Mr. Lichstein. Under his commission plan, Mr. Kilgore had an annual target of $225,000.
2012 Option Repricing
On July 26, 2012 and August 8, 2012, we repriced options to purchase 1,089,338 and 36,666 shares of our common stock, respectively, to $5.01 per share, the estimated fair market value of our common stock on such dates, from $6.06 per share. Of the 1,089,338 options repriced on July 26, 2012, 106,333 of such options were originally granted on April 19, 2012 and 33,666 of such options were originally granted on April 25, 2012 and the remaining options were granted prior to April 2012. No other modifications were made to these options. Of these repriced options, 150,000 options were held by our named executive officers and directors. For additional information with respect to the repriced options held by our named executive officers and directors, see the sections of this prospectus titled "—2012 Summary Compensation Table" and "Management—2012 Director Compensation Table," respectively.
Equity Incentive Plans
2013 Equity Incentive Plan
Our board of directors adopted and our stockholders approved our 2013 Equity Incentive Plan, or our 2013 plan, in June 2013. We do not expect to utilize our 2013 plan until after the closing of this offering, at which point no further grants will be made under our 2008 plan. No awards have been granted and no shares of our common stock have been issued under our 2013 plan.
Stock Awards. The 2013 plan provides for the grant of incentive stock options within the meaning of Section 422 of the Internal Revenue Code of 1986, as amended, or the Code, nonstatutory stock options, stock appreciation rights, restricted stock awards, restricted stock unit awards, performance-based stock awards, and other forms of equity compensation (collectively, stock awards). Additionally, the 2013 plan provides for the grant of performance cash awards. Incentive stock options may be granted only to employees. All other awards may be granted to employees, including officers, and to non-employee directors and consultants.
Share Reserve. Initially, the aggregate number of shares of our common stock that may be issued pursuant to stock awards under the 2013 plan after the 2013 plan becomes effective is 1,333,333 shares. Additionally, the number of shares of our common stock reserved for issuance under our 2013 plan will automatically increase on January 1 of each year, beginning on January 1, 2014 (assuming the 2013 plan becomes effective before such date) and continuing through and including January 1, 2023, by
108
4.00% of the total number of shares of our capital stock outstanding on December 31 of the preceding calendar year, or a lesser number of shares determined by our board of directors. The maximum number of shares that may be issued upon the exercise of incentive stock options under our 2013 plan is 53,333,333 shares.
No person may be granted stock awards covering more than 6,666,666 shares of our common stock under our 2013 plan during any calendar year pursuant to stock options, stock appreciation rights and other stock awards whose value is determined by reference to an increase over an exercise or strike price of at least 100% of the fair market value on the date the stock award is granted. Additionally, no person may be granted in a calendar year a performance stock award covering more than 3,333,333 shares or a performance cash award having a maximum value in excess of $10,000,000. Such limitations are designed to help assure that any deductions to which we would otherwise be entitled with respect to such awards will not be subject to the $1,000,000 limitation on the income tax deductibility of compensation paid to any covered executive officer imposed by Section 162(m) of the Code.
If a stock award granted under the 2013 plan expires or otherwise terminates without being exercised in full, or is settled in cash, the shares of our common stock not acquired pursuant to the stock award again will become available for subsequent issuance under the 2013 plan. In addition, the following types of shares under the 2013 plan may become available for the grant of new stock awards under the 2013 plan: (1) shares that are forfeited to or repurchased by us prior to becoming fully vested; (2) shares withheld to satisfy income or employment withholding taxes; or (3) shares used to pay the exercise or purchase price of a stock award. Shares issued under the 2013 plan may be previously unissued shares or reacquired shares bought by us on the open market. As of the date hereof, no awards have been granted and no shares of our common stock have been issued under the 2013 plan.
Administration. Our board of directors, or a duly authorized committee thereof, has the authority to administer the 2013 plan. Our board of directors may also delegate to one or more of our officers the authority to (1) designate employees (other than other officers) to be recipients of certain stock awards, and (2) determine the number of shares of common stock to be subject to such stock awards. Subject to the terms of the 2013 plan, our board of directors or the authorized committee, referred to herein as the plan administrator, determines recipients, dates of grant, the numbers and types of stock awards to be granted and the terms and conditions of the stock awards, including the period of their exercisability and vesting schedule applicable to a stock award. Subject to the limitations set forth below, the plan administrator will also determine the exercise price, strike price or purchase price of awards granted and the types of consideration to be paid for the award.
The plan administrator has the authority to modify outstanding awards under our 2013 plan. Subject to the terms of our 2013 plan, the plan administrator has the authority to reduce the exercise, purchase or strike price of any outstanding stock award, cancel any outstanding stock award in exchange for new stock awards, cash or other consideration, or take any other action that is treated as a repricing under generally accepted accounting principles, with the consent of any adversely affected participant.
Stock Options. Incentive and nonstatutory stock options are granted pursuant to stock option agreements adopted by the plan administrator. The plan administrator determines the exercise price for a stock option, within the terms and conditions of the 2013 plan, provided that the exercise price of a stock option generally cannot be less than 100% of the fair market value of our common stock on the date of grant. Options granted under the 2013 plan vest at the rate specified by the plan administrator.
The plan administrator determines the term of stock options granted under the 2013 plan, up to a maximum of 10 years. Unless the terms of an option holder's stock option agreement provide otherwise, if an option holder's service relationship with us, or any of our affiliates, ceases for any reason other than disability, death or cause, the option holder may generally exercise any vested
109
options for a period of three months following the cessation of service. The option term may be extended in the event that exercise of the option following such a termination of service is prohibited by applicable securities laws or our insider trading policy. If an option holder's service relationship with us or any of our affiliates ceases due to disability or death, or an optionholder dies within a certain period following cessation of service, the optionholder or a beneficiary may generally exercise any vested options for a period of 12 months in the event of disability and 18 months in the event of death. In the event of a termination for cause, options generally terminate immediately. In no event may an option be exercised beyond the expiration of its term.
Acceptable consideration for the purchase of common stock issued upon the exercise of a stock option will be determined by the plan administrator and may include (1) cash, check, bank draft or money order, (2) a broker-assisted cashless exercise, (3) the tender of shares of our common stock previously owned by the optionholder, (4) a net exercise of the option if it is an nonqualified stock option, and (5) other legal consideration approved by the plan administrator.
Unless the plan administrator provides otherwise, options generally are not transferable except by will, the laws of descent and distribution, or pursuant to a domestic relations order. An optionholder may designate a beneficiary, however, who may exercise the option following the option holder's death.
Tax Limitations on Incentive Stock Options. The aggregate fair market value, determined at the time of grant, of our common stock with respect to incentive stock options that are exercisable for the first time by an optionholder during any calendar year under all of our stock plans may not exceed $100,000. Options or portions thereof that exceed such limit will generally be treated as nonqualified stock options. No incentive stock option may be granted to any person who, at the time of the grant, owns or is deemed to own stock possessing more than 10% of our total combined voting power or that of any of our affiliates unless (1) the option exercise price is at least 110% of the fair market value of the stock subject to the option on the date of grant, and (2) the term of the incentive stock option does not exceed five years from the date of grant.
Restricted Stock Awards. Restricted stock awards are granted pursuant to restricted stock award agreements adopted by the plan administrator. Restricted stock awards may be granted in consideration for (1) cash, check, bank draft or money order, (2) services rendered to us or our affiliates, or (3) any other form of legal consideration. Common stock acquired under a restricted stock award may, but need not, be subject to a share repurchase option in our favor in accordance with a vesting schedule to be determined by the plan administrator. Rights to acquire shares under a restricted stock award may be transferred only upon such terms and conditions as set by the plan administrator. Except as otherwise provided in the applicable award agreement, restricted stock unit awards that have not vested will be forfeited upon the participant's cessation of continuous service for any reason.
Restricted Stock Unit Awards. Restricted stock unit awards are granted pursuant to restricted stock unit award agreements adopted by the plan administrator. Restricted stock unit awards may be granted in consideration for any form of legal consideration. A restricted stock unit award may be settled by cash, delivery of stock, a combination of cash and stock as deemed appropriate by the plan administrator, or in any other form of consideration set forth in the restricted stock unit award agreement. Additionally, dividend equivalents may be credited in respect of shares covered by a restricted stock unit award. Except as otherwise provided in the applicable award agreement, restricted stock units that have not vested will be forfeited upon the participant's cessation of continuous service for any reason.
Stock Appreciation Rights. Stock appreciation rights are granted pursuant to stock appreciation grant agreements adopted by the plan administrator. The plan administrator determines the strike price for a stock appreciation right, which generally cannot be less than 100% of the fair market value of our common stock on the date of grant. Upon the exercise of a stock appreciation right, we will pay the participant an amount equal to (1) the excess of the per share fair market value of our common stock on the date of exercise over the strike price, multiplied by (2) the number of shares of common stock
110
with respect to which the stock appreciation right is exercised. A stock appreciation right granted under the 2013 plan vests at the rate specified in the stock appreciation right agreement as determined by the plan administrator.
The plan administrator determines the term of stock appreciation rights granted under the 2013 plan, up to a maximum of ten years. Unless the terms of a participant's stock appreciation right agreement provides otherwise, if a participant's service relationship with us or any of our affiliates ceases for any reason other than cause, disability or death, the participant may generally exercise any vested stock appreciation right for a period of three months following the cessation of service. The stock appreciation right term may be further extended in the event that exercise of the stock appreciation right following such a termination of service is prohibited by applicable securities laws. If a participant's service relationship with us, or any of our affiliates, ceases due to disability or death, or a participant dies within a certain period following cessation of service, the participant or a beneficiary may generally exercise any vested stock appreciation right for a period of 12 months in the event of disability and 18 months in the event of death. In the event of a termination for cause, stock appreciation rights generally terminate immediately upon the occurrence of the event giving rise to the termination of the individual for cause. In no event may a stock appreciation right be exercised beyond the expiration of its term.
Performance Awards. If certain material terms of the 2013 plan are approved by our stockholders after we are publicly traded, the 2013 plan permits the grant of performance-based stock and cash awards that may qualify as performance-based compensation that is not subject to the $1,000,000 limitation on the income tax deductibility of compensation paid to a covered executive officer imposed by Section 162(m) of the Code. To help assure that the compensation attributable to performance-based awards will so qualify, our compensation committee can structure such awards so that stock or cash will be issued or paid pursuant to such award only after the achievement of certain pre-established performance goals during a designated performance period.
The performance goals that may be selected include one or more of the following: (1) earnings (including earnings per share and net earnings); (2) earnings before interest, taxes and depreciation; (3) earnings before interest, taxes, depreciation and amortization; (4) total stockholder return; (5) return on equity or average stockholder's equity; (6) return on assets, investment, or capital employed; (7) stock price; (8) margin (including gross margin); (9) income (before or after taxes); (10) operating income; (11) operating income after taxes; (12) pre-tax profit; (13) operating cash flow; (14) sales or revenue targets; (15) increases in revenue or product revenue; (16) expenses and cost reduction goals; (17) improvement in or attainment of working capital levels; (18) economic value added (or an equivalent metric); (19) market share; (20) cash flow; (21) cash flow per share; (22) share price performance; (23) debt reduction; (24) implementation or completion of projects or processes; (25) customer satisfaction; (26) stockholders' equity; (27) capital expenditures; (28) debt levels; (29) operating profit or net operating profit; (30) workforce diversity; (31) growth of net income or operating income; (32) billings; (33) earnings before interest, taxes, depreciation, amortization and legal settlements; (34) earnings before interest, taxes, depreciation, amortization, legal settlements and other income (expense); (35) earnings before interest, taxes, depreciation, amortization, legal settlements, other income (expense) and stock-based compensation; (36) earnings before interest, taxes, depreciation, amortization, legal settlements, other income (expense), stock-based compensation and changes in deferred revenue; (37) bookings; (38) the number of users, including but not limited to unique users; (39) employee retention and (40) to the extent that an award is not intended to comply with Section 162(m) of the Code, other measures of performance selected by our board of directors.
The performance goals may be based on a company-wide basis, with respect to one or more business units, divisions, affiliates, or business segments, and in either absolute terms or relative to the performance of one or more comparable companies or the performance of one or more relevant indices. Unless specified otherwise (1) in the award agreement at the time the award is granted or (2) in such other document setting forth the performance goals at the time the goals are established,
111
we will appropriately make adjustments in the method of calculating the attainment of performance goals as follows: (1) to exclude restructuring and/or other nonrecurring charges; (2) to exclude exchange rate effects, as applicable, for non-U.S. dollar denominated goals; (3) to exclude the effects of changes to generally accepted accounting principles; (4) to exclude the effects of any statutory adjustments to corporate tax rates; (5) to exclude the effects of any "extraordinary items" as determined under generally accepted accounting principles. In addition, we retain the discretion to reduce or eliminate the compensation or economic benefit due upon attainment of the goals; (6) to exclude the dilutive effects of acquisitions or joint ventures; (7) to assume that any divested business achieved performance objectives at targeted levels during the balance of a performance period following such divestiture; (8) to exclude the effect of any change in our outstanding shares of common stock by reason of any stock dividend or split, stock repurchase, reorganization, recapitalization, merger, consolidation, spin-off, combination or exchange of shares or other similar corporate change, or any distributions to common stockholders other than regular cash dividends; (9) to exclude the effects of stock-based compensation and the award of bonuses under our bonus plans; (10) to exclude costs incurred in connection with potential acquisitions or divestitures that are required to be expensed under generally accepted accounting principles in the United States; (11) to exclude the goodwill and intangible asset impairment charges that are required to be recorded under generally accepted accounting principles in the United States; and (12) to exclude the effect of any other unusual, non-recurring gain or loss or other extraordinary item. The performance goals may differ from participant to participant and from award to award.
Other Stock Awards. The plan administrator may grant other awards based in whole or in part by reference to our common stock. The plan administrator will set the number of shares under the stock award and all other terms and conditions of such awards.
Changes to Capital Structure. In the event that there is a specified type of change in our capital structure, such as a stock split or recapitalization, appropriate adjustments will be made to (1) the class and maximum number of shares reserved for issuance under the 2013 plan, (2) the class and maximum number of shares by which the share reserve may increase automatically each year, (3) the class and maximum number of shares that may be issued upon the exercise of incentive stock options, (4) the class and maximum number of shares subject to stock awards that can be granted in a calendar year (as established under the 2013 plan pursuant to Section 162(m) of the Code) and (5) the class and number of shares and exercise price, strike price, or purchase price, if applicable, of all outstanding stock awards.
Corporate Transactions. In the event of certain specified significant corporate transactions, the plan administrator has the discretion to take any of the following actions with respect to stock awards:
- •
- arrange for the assumption, continuation or substitution of a stock award by a surviving or acquiring entity or parent
company;
- •
- arrange for the assignment of any reacquisition or repurchase rights held by us to the surviving or acquiring entity or
parent company;
- •
- accelerate the vesting of the stock award and provide for its termination prior to the effective time of the corporate
transaction;
- •
- arrange for the lapse of any reacquisition or repurchase right held by us;
- •
- cancel or arrange for the cancellation of the stock award in exchange for such cash consideration, if any, as our board of
directors may deem appropriate; or
- •
- make a payment equal to the excess of (1) the value of the property the participant would have received upon exercise of the stock award over (2) the exercise price otherwise payable in connection with the stock award.
Our plan administrator is not obligated to treat all stock awards, even those that are of the same type, in the same manner.
112
Under the 2013 plan, a corporate transaction is generally the consummation of (1) a sale or other disposition of all or substantially all of our consolidated assets, (2) a sale or other disposition of at least 90% of our outstanding securities, (3) a merger, consolidation or similar transaction following which we are not the surviving corporation, or (4) a merger, consolidation or similar transaction following which we are the surviving corporation but the shares of our common stock outstanding immediately prior to such transaction are converted or exchanged into other property by virtue of the transaction.
Change in Control. The plan administrator may provide, in an individual award agreement or in any other written agreement between a participant and us that the stock award will be subject to additional acceleration of vesting and exercisability in the event of a change in control. Under the 2013 plan, a change in control is generally (1) the acquisition by a person or entity of more than 50% of our combined voting power other than by merger, consolidation or similar transaction; (2) a consummated merger, consolidation or similar transaction immediately after which our stockholders cease to own more than 50% of the combined voting power of the surviving entity; or (3) a consummated sale, lease or exclusive license or other disposition of all or substantially all of our consolidated assets.
Amendment and Termination. Our board of directors has the authority to amend, suspend, or terminate our 2013 plan, provided that such action does not materially impair the existing rights of any participant without such participant's written consent. No incentive stock options may be granted after the tenth anniversary of the date our board of directors adopted our 2013 plan.
2008 Stock Plan
Our board of directors adopted, and our stockholders approved, the 2008 Stock Plan, or the 2008 plan, in May 2008. The 2008 plan was most recently amended by our board of directors and approved by our stockholders in December 2012. As of March 31, 2013, there were 439,950 shares remaining available for the grant of stock awards under our 2008 plan and there were outstanding stock awards covering a total of 5,355,322 shares that were granted under our 2008 plan. Following this offering, no further grants will be made under our 2008 plan and all outstanding stock awards granted under our 2008 plan will continue to be governed by the terms of our 2008 plan.
Stock Awards. Our 2008 plan provides for the grant of incentive stock options to our employees, and for the grant of nonstatutory stock options, restricted stock awards and the right to purchase stock to our employees, non-employee directors and consultants, collectively, "stock awards."
Share Reserve. The aggregate number of shares of our common stock originally reserved for issuance pursuant to stock awards under the 2008 plan was the sum of (1) 1,407,518 shares (which was the number of shares subject to the 2006 plan's available share reserve as of the effective date of the 2008 plan) and (2) any shares subject to stock options or other stock awards under the 2006 plan that expire or terminate for any reason. The 2008 plan has been amended nine times, with the most recent amendment approved by our board of directors and stockholders in December 2012, to increase the share reserve to 6,547,744 shares of our common stock. Shares of our common stock previously issued under the 2008 plan but reacquired by us, and shares subject to an outstanding option or other stock right that expires or is cancelled without being exercised, will be added to the number of shares then available for issuance under the 2008 plan.
Shares of our common stock previously issued under the 2008 plan but reacquired by us, and shares subject to an outstanding option or other stock right that expires or is cancelled without being exercised, will be added to the number of shares then available for issuance under the 2008 plan.
Administration. Our board of directors, or a duly authorized committee thereof, each referred to herein as the plan administrator, has the authority to administer the 2008 plan. Subject to the terms of the 2008 plan, the plan administrator has full authority and discretion to take any actions it deems necessary or advisable to administer the plan.
Stock Options. Incentive and nonstatutory stock options are granted pursuant to stock option agreements adopted by the plan administrator. The plan administrator determines the exercise price for
113
a stock option, within the terms and conditions of the 2008 plan, provided that the exercise price of an option generally cannot be less than 100% of the fair market value of our common stock on the date of grant. Options granted under the 2008 plan vest at the rate specified by the plan administrator.
The plan administrator determines the term of stock options granted under the 2008 plan, up to a maximum of 10 years. Unless the terms of an option holder's stock option agreement provide otherwise, if an option holder's service relationship with us, or any of our affiliates, ceases for any reason other than disability or death, the option holder may generally exercise any vested options for a period of three months following the cessation of service. If an option holder's service relationship with us or any of our affiliates ceases due to disability or death, the option holder or a beneficiary may generally exercise any vested options for a period of 6 months in the event of disability and 12 months in the event of death. In no event may an option be exercised beyond the expiration of its term.
Acceptable consideration for the purchase of common stock issued upon the exercise of a stock option will be determined by the plan administrator and may include cash or, at the discretion of the plan administrator, by (1) the tender of shares of our common stock previously owned by the optionholder, (2) delivery of a promissory note, (3) proceeds from a broker-assisted cashless exercise and (4) other legal consideration approved by the plan administrator.
Unless the plan administrator provides otherwise, options generally are not transferable except by will or the laws of descent and distribution. An optionholder may designate a beneficiary, however, who may exercise the option following the option holder's death.
Tax Limitations on Incentive Stock Options. The aggregate fair market value, determined at the time of grant, of our common stock with respect to incentive stock options that are exercisable for the first time by an optionholder during any calendar year under all of our stock plans may not exceed $100,000. Options or portions thereof that exceed such limit will generally be treated as nonqualified stock options. No incentive stock option may be granted to any person who, at the time of the grant, owns or is deemed to own stock possessing more than 10% of our total combined voting power or that of any of our affiliates unless (1) the option exercise price is at least 110% of the fair market value of the stock subject to the option on the date of grant, and (2) the term of the incentive stock option does not exceed five years from the date of grant.
Changes to Capital Structure. In the event that there is a specified type of change in our capital structure, such as a stock split or recapitalization, appropriate adjustments will be made to (1) the number of shares available for future grants under the 2008 plan, and (2) the number of shares covered by, and the exercise price of, each outstanding option.
Corporate Transactions. In the event of a merger or consolidation of the company, outstanding stock awards (1) will be assumed, continued or substituted for similar stock awards by the surviving or acquiring corporation, (2) will become fully vested and exercisable, and will be cancelled on the closing date, provided that with respect to any option the option holder has been provided with a period of time before the closing to exercise the option, or (3) with respect to options, cancelled in exchange for a cash payment equal to the excess, if any, of the fair market value of the shares subject to the option as of the closing date over the exercise price of the option, provided that the payment may be subject to vesting conditions to the extent the option is not vested as of the date of the closing.
Change in Control. The administrator may provide, in an individual award agreement or in any other written agreement between a participant and us, that the stock award will be subject to additional acceleration of vesting and exercisability in the event of a change in control. In the absence of such a provision, no such acceleration of the stock award will occur.
Amendment and Termination. The 2008 plan will terminate in May 2018. However, our board of directors has the authority to amend, suspend, or terminate our 2008 plan, provided that such action does not affect the existing rights of any participant. As noted above, in connection with this offering, our 2008 plan will be terminated and no further awards will be granted thereunder. All outstanding awards will continue to be governed by their existing terms.
114
2006 Stock Incentive Plan
General Overview. Our board of directors adopted, and our stockholders approved, the 2006 Stock Incentive Plan, or the 2006 plan, which became effective in September 2006. The 2006 plan was most recently amended by our board of directors in December 2012. No further awards have been granted under the 2006 plan following the effectiveness of the 2008 Plan. All outstanding stock awards granted under our 2006 plan continue to be governed by their existing terms and the 2006 plan. As of March 31, 2013, there were outstanding stock awards covering a total of 380,198 shares that were granted under our 2006 plan.
Changes to Capital Structure. In the event that there is a specified type of change in our capital structure, such as a stock split or recapitalization, appropriate adjustments will be made to (1) the number and class of shares available for award and the per participant limit under the 2006 plan, (2) the number and class of shares, vesting schedule and exercise price per share subject to outstanding options granted under the 2006 plan, (3) the repurchase price per share subject to repurchase under the 2006 plan, and (4) the terms of other stock-based awards.
Corporate Transactions. In the event of certain specified significant corporate transactions, outstanding stock awards granted under the 2006 plan will be assumed, continued or substituted for similar stock awards by the surviving or acquiring corporation. With respect to outstanding options, in addition to or in lieu of the assumption, continuation or substitution of such options, the administrator may provide that the options must be exercised within a specified number of days and, if not exercised, will expire at the end of the period, or provide that outstanding options will be terminated in exchange for a cash payment equal to the excess of the fair market value of the shares subject to the option over the exercise price of the option, provided that before terminating any portion of an option that is not vested or exercisable, other than in exchange for a cash payment, the administrator must first accelerate in full the exercisability of the portion that is terminated.
ScanScout, Inc. 2009 Equity Incentive Plan
General Overview. In connection with the acquisition of ScanScout in 2010, we assumed all outstanding options granted under the ScanScout, Inc. 2009 Equity Incentive Plan, or the ScanScout 2009 plan, held by employees and directors of ScanScout. All options not held by employees, consultants or directors of ScanScout were terminated at the effective time of the acquisition. All options granted under the ScanScout 2009 plan remained subject to their terms and continue to be governed by the terms of the ScanScout 2009 plan, but were adjusted, including with respect to both the shares subject to the options and the exercise price of the options, to reflect the issuance of our Series II common stock upon exercise. In addition the holders of assumed options granted under the ScanScout 2009 plan that were vested as of the date of the acquisition were entitled to a cash payment as set forth in the merger agreement. The ScanScout 2009 Plan was most recently amended by our board of directors in December 2012. No further awards have been granted under the ScanScout 2009 plan following the acquisition of ScanScout. As of March 31, 2013, there were outstanding stock awards covering a total of 768,673 shares that were granted under the ScanScout 2009 plan.
Changes to Capital Structure. In the event that there is a specified type of change in our capital structure, such as a stock split or recapitalization, appropriate adjustments will be made to (1) the class and maximum number of shares reserved for issuance under the ScanScout 2009 plan, (2) the class and maximum number of shares that may be issued upon the exercise of incentive stock options, and (3) the class and number of shares and exercise price, strike price, or purchase price, if applicable, of all outstanding stock awards.
Corporate Transactions. In the event of certain specified significant corporate transactions, outstanding stock awards may (1) be assumed, continued or substituted for similar stock awards by the surviving or acquiring corporation, (2) be subject to accelerated vesting, (3) be cancelled to the extent not vested or exercised before the effective time of the transaction, or (4) be terminated in exchange
115
for a cash payment equal to the value of the property the holder of the stock award would have received upon exercise in excess, if any, of the exercise price of the stock award.
Under the ScanScout 2009 plan, a corporate transaction is generally the consummation of (1) a sale or other disposition of all or substantially all of our consolidated assets, (2) a sale or other disposition of at least 50% of our outstanding voting securities, (3) a merger, consolidation or similar transaction following which we are not the surviving corporation, or (4) a merger, consolidation or similar transaction following which we are the surviving corporation but the shares of our common stock outstanding immediately prior to such transaction are converted or exchanged into other property by virtue of the transaction.
Change in Control. The administrator may provide, in an individual stock award agreement or in any other written agreement between a participant and us, that a stock award granted under the ScanScout 2009 plan will be subject to additional acceleration of vesting and exercisability in the event of a change in control. In the absence of such a provision, no such acceleration of the stock award will occur.
ScanScout, Inc. 2006 Stock Plan
General Overview. In connection with the acquisition of ScanScout, Inc. in 2010, we assumed all outstanding options granted under the ScanScout, Inc. 2006 Stock Plan, or the ScanScout 2006 plan, held by employees and directors of ScanScout. All options not held by employees, consultants or directors of ScanScout were terminated at the effective time of the acquisition. All options granted under the ScanScout 2006 plan that we assumed remained subject to their terms and continue to be governed by the terms of the ScanScout 2006 plan, but were adjusted, including with respect to both the shares subject to the options and the exercise price of the options, to reflect the issuance of our Series II common stock upon exercise. In addition the holders of assumed options granted under the ScanScout 2006 plan, whether vested or unvested at the time of the acquisition, were entitled to a cash payment as set forth in the merger agreement. No further awards have been granted under this plan following the acquisition of ScanScout. As of March 31, 2013, there were outstanding stock awards covering a total of 498,210 shares that were granted under the ScanScout 2006 plan.
Changes to Capital Structure. In the event that there is a specified type of change in our capital structure, such as a stock split or recapitalization, appropriate adjustments may be made to (1) the number and class of shares that may be delivered under the plan, and (2) the number, class and exercise price of shares covered by each outstanding option under the ScanScout 2006 plan.
Corporate Transactions. In the event of certain specified significant corporate transactions, outstanding options granted under the ScanScout 2006 plan will be assumed or equivalent options will be substituted by the successor corporation. In the event the options are not assumed or substituted, the optionees will become fully vested in the options and have the right to exercise the options for a period of time determined by the administrator, and, if not exercised, the options will terminate at the end of that period.
401(k) Plan
We maintain a tax-qualified retirement plan that provides eligible U.S. employees with an opportunity to save for retirement on a tax advantaged basis. Eligible employees are able to defer eligible compensation subject to applicable annual Code limits. Currently, we do not make matching contributions or discretionary contributions to the 401(k) plan. Employees' pre-tax contributions are allocated to each participant's individual account and are then invested in selected investment alternatives according to the participants' directions. Employees are immediately and fully vested in their contributions. The 401(k) plan is intended to be qualified under Section 401(a) of the Code with the 401(k) plan's related trust intended to be tax exempt under Section 501(a) of the Code. As a
116
tax-qualified retirement plan, contributions to the 401(k) plan and earnings on those contributions are not taxable to the employees until distributed from the 401(k) plan.
Limitations on Liability and Indemnification Matters
Upon completion of this offering, our certificate of incorporation will contain provisions that limit the liability of our current and former directors for monetary damages to the fullest extent permitted by Delaware law. Delaware law provides that directors of a corporation will not be personally liable for monetary damages for any breach of fiduciary duties as directors, except liability for:
- •
- any breach of the director's duty of loyalty to the corporation or its stockholders;
- •
- any act or omission not in good faith or that involves intentional misconduct or a knowing violation of law;
- •
- unlawful payments of dividends or unlawful stock repurchases or redemptions as provided in Section 174 of the
Delaware General Corporation Law; or
- •
- any transaction from which the director derived an improper personal benefit.
This limitation of liability does not apply to liabilities arising under federal securities laws and does not affect the availability of equitable remedies such as injunctive relief or rescission.
Our certificate of incorporation and our bylaws will provide that we are required to indemnify our directors to the fullest extent permitted by Delaware law. Our bylaws will also provide that, upon satisfaction of certain conditions, we are required to advance expenses incurred by a director in advance of the final disposition of any action or proceeding, and permit us to secure insurance on behalf of any officer, director, employee or other agent for any liability arising out of his or her actions in that capacity regardless of whether we would otherwise be permitted to indemnify him or her under the provisions of Delaware law. Our bylaws will also provide our board of directors with discretion to indemnify our officers and employees when determined appropriate by the board. We have entered and expect to continue to enter into agreements to indemnify our directors, executive officers and other employees as determined by the board of directors. With certain exceptions, these agreements provide for indemnification for related expenses including, among other things, attorneys' fees, judgments, fines and settlement amounts incurred by any of these individuals in any action or proceeding. We believe that these bylaw provisions and indemnification agreements are necessary to attract and retain qualified persons as directors and officers. We also maintain customary directors' and officers' liability insurance.
The limitation of liability and indemnification provisions in our certificate of incorporation and bylaws may discourage stockholders from bringing a lawsuit against our directors for breach of their fiduciary duty. They may also reduce the likelihood of derivative litigation against our directors and officers, even though an action, if successful, might benefit us and other stockholders. Further, a stockholder's investment may be adversely affected to the extent that we pay the costs of settlement and damage awards against directors and officers as required by these indemnification provisions. At present, there is no pending litigation or proceeding involving any of our directors, officers or employees for which indemnification is sought and we are not aware of any threatened litigation that may result in claims for indemnification.
Rule 10b5-1 Sales Plans
Our directors and executive officers may adopt written plans, known as Rule 10b5-1 plans, in which they will contract with a broker to buy or sell shares of our common stock on a periodic basis. Under a Rule 10b5-1 plan, a broker executes trades pursuant to parameters established by the director or executive officer when entering into the plan, without further direction from them. The director or executive officer may amend a Rule 10b5-1 plan in some circumstances and may terminate a plan at any time. Our directors and executive officers also may buy or sell additional shares outside of a Rule 10b5-1 plan when they are not in possession of material nonpublic information subject to compliance with the terms of our insider trading policy. Prior to 180 days after the date of this offering, subject to potential extension or early termination, the sale of any shares under such plan would be subject to the lock-up agreement that the director or executive officer has entered into with the underwriters.
117
CERTAIN RELATIONSHIPS AND RELATED PARTY TRANSACTIONS
The following is a summary of transactions since January 1, 2010 to which we have been a participant in which the amount involved exceeded or will exceed $120,000, and in which any of our then directors, executive officers or holders of more than 5% of any class of our capital stock at the time of such transaction, or any members of their immediate family, had or will have a direct or indirect material interest, other than compensation arrangements which are described under the sections of this prospectus titled "Management—Non-Employee Director Compensation" and "Executive Compensation."
ScanScout Acquisition
In connection with the acquisition of ScanScout, in December 2010, (1) we paid approximately $5.0 million in cash to the former stockholders and optionholders of ScanScout, (2) issued an aggregate of 1,662,122 shares of our Series II common stock, 947,711 shares of our Series 1 preferred stock, 1,821,455 shares of our Series 2 preferred stock, 928,054 shares of our Series 3 preferred stock and 3,092,932 shares of our Series 4 preferred stock to the stockholders of ScanScout in exchange for all of the outstanding shares of capital stock of ScanScout, (3) assumed all of the outstanding options to purchase shares of common stock of ScanScout and exchanged these options for options to purchase an aggregate of 1,623,770 shares of our Series II common stock and (4) issued a warrant to purchase 31,130 shares of our Series 1 preferred stock and a warrant to purchase 8,694 shares of our Series 3 preferred stock in exchange for warrants to purchase ScanScout preferred stock. These shares of stock, options and warrants were valued at the time of the acquisition at an aggregate value of approximately $81.0 million.
In connection with our acquisition of ScanScout, directors, executive officers and holders of 5% of any class of our capital stock immediately following the closing of such transaction received the following:
- •
- entities affiliated with General Catalyst Partners received (1) approximately $0.6 million in cash and
(2) 1,449,770 shares of our Series 2 preferred stock, 347,792 shares of our Series 3 preferred stock and 1,089,024 shares of our Series 4 preferred stock, which shares of
preferred stock were valued at the time of the acquisition at an aggregate value of approximately $23.1 million.
- •
- William Day received (1) approximately $0.4 million in cash and (2) options to acquire 505,247 shares
of our Series II common stock in exchange for all of his options to acquire shares of common stock of ScanScout.
- •
- Waikit Lau received (1) approximately $0.7 million in cash, (2) 735,714 shares of our
Series II common stock, which shares of Series II common stock were valued at the time of the acquisition at an aggregate of approximately $3.1 million and (3) options to
acquire 196,974 shares of our Series II common stock in exchange for all of his options to acquire shares of common stock of ScanScout.
- •
- Steven Lee received (1) approximately $0.7 million in cash, (2) 735,714 shares of our
Series II common stock, which shares of Series II common stock were valued at the time of the acquisition at an aggregate of approximately $3.1 million and (3) options to
acquire 196,974 shares of our Series II common stock in exchange for all of his options to acquire shares of common stock of ScanScout.
- •
- Adam Lichstein received options to acquire 48,831 shares of our Series II common stock in exchange for all of his options to acquire shares of common stock of ScanScout.
118
Repurchases of Our Common Stock
Common Stock
In December 2010, we repurchased an aggregate of 1,541,598 shares of our common stock from certain of our stockholders for $4.395 per share, or an aggregate gross consideration of $6.8 million. The table below reflects the December 2010 common stock repurchases from our directors, executive officers and holders of 5% of any class of our capital stock as of the date of such transaction:
Related Party
|
Shares of Common Stock Repurchased (#) |
Aggregate Consideration Received ($) |
|||||
|---|---|---|---|---|---|---|---|
Jason Glickman(1) |
728,100 | $ | 3,200,000 | ||||
Andrew Reis(2) |
533,333 | 2,344,000 | |||||
Randy Kilgore(3) |
45,506 | 199,999 | |||||
Total |
1,306,939 | $ | 5,743,999 | ||||
- (1)
- Jason Glickman served as a member of our board of directors from November 2005 until May 2013 and is our former President and Chief Executive Officer.
- (2)
- Andrew Reis served as a member of our board of directors from August 2009 to November 2010.
- (3)
- Mr. Kilgore is a former executive officer and is our Senior Vice President and Chief Revenue Officer.
Series II Common Stock
In December 2010, we repurchased an aggregate of 832,812 shares of our Series II common stock from certain of our stockholders for $4.803 per share, or an aggregate gross consideration of approximately $4.0 million. The table below reflects the December 2010 Series II common stock repurchases from our directors, executive officers and holders of 5% of any class of our capital stock as of the date of such transaction:
Related Party
|
Shares of Series II Common Stock Repurchased (#) |
Aggregate Consideration Received ($) |
|||||
|---|---|---|---|---|---|---|---|
Steven Lee(1) |
379,048 | $ | 1,820,571 | ||||
Waikit Lau(2) |
379,048 | 1,820,571 | |||||
Total |
758,096 | $ | 3,641,142 | ||||
- (1)
- Mr. Lee is a Senior Vice President, our Chief Technology Officer and a former member of our board of directors.
- (2)
- Mr. Lau is our Senior Vice President, Corporate Development and a former member of our board of directors.
Sales of Series D Preferred Stock
In April 2010, we sold an aggregate of 5,453,975 shares of our Series D preferred stock at a price of $7.3341 per share for an aggregate price of approximately $40.0 million. The following table
119
summarizes purchases of shares of our Series D preferred stock by our directors, executive officers and holders of more than 5% of any class of our capital stock as of the date of such transaction:
Related Party
|
Shares of Series D Preferred Stock Purchased (#) |
Aggregate Purchase Price ($) |
|||||
|---|---|---|---|---|---|---|---|
Entities affiliated with Draper Fisher Jurvetson(1) |
3,408,732 | $ | 24,999,991 | ||||
Canaan VII L.P.(2) |
859,001 | 6,300,002 | |||||
Entities affiliated with Meritech Capital(3) |
436,318 | 3,200,005 | |||||
Andrew Reis(4) |
9,089 | 66,667 | |||||
Jason Glickman(5) |
2,272 | 16,668 | |||||
Mark Pinney(6) |
2,272 | 16,668 | |||||
Total |
4,717,684 | $ | 34,600,001 | ||||
- (1)
- Consists of 1,603,809 shares purchased by Draper Fisher Jurvetson Fund IX, L.P., 1,576,880 shares purchased by Draper Fisher Jurvetson Growth Fund 2006, L.P., 127,486 shares purchased by Draper Fisher Jurvetson Partners Growth Fund 2006, LLC, 43,461 shares purchased by Draper Fisher Jurvetson Partners IX, LLC and 57,096 shares purchased by Draper Associates, L.P. Randall Glein, a managing director of Draper Fisher Jurvetson Growth Fund, is a member of our board of directors.
- (2)
- Warren Lee, a member of our board of directors, is a member of Canaan Partners VII LLC, the general partner of Canaan VII L.P.
- (3)
- Consists of 428,508 shares purchased by Meritech Capital Partners III, L.P. and 7,810 shares purchased by Meritech Capital Affiliates III, L.P. Michael Gordon, a managing director of Meritech Capital, served as a member of our board of directors from January 2009 until May 2013.
- (4)
- Consists of 2,272 shares purchased by Andrew Reis and 6,817 shares purchased by Donald and Lillian Reis, Mr. Reis's parents. Mr. Reis served as a member of our board of directors from May 2007 to November 2010.
- (5)
- Mr. Glickman served as a member of our board of directors from November 2005 until May 2013.
- (6)
- Mr. Pinney served as our Chief Operating Officer and Treasurer from August 2009 to December 2011.
Sale of Series E Preferred Stock
In December 2010, in connection with our acquisition of ScanScout, we sold an aggregate of 236,112 shares of our Series E preferred stock at a price of $8.005 per share for an aggregate price of approximately $1.9 million. The following table summarizes purchases of shares of our Series E preferred stock by our directors, executive officers and holders of more than 5% of any class of our capital stock as of the date of such transaction:
Related Party
|
Shares of Series E Preferred Stock Purchased (#) |
Aggregate Purchase Price ($) |
|||||
|---|---|---|---|---|---|---|---|
Entities affiliated with General Catalyst Partners(1) |
187,380 | $ | 1,499,997 | ||||
- (1)
- Consists of 182,538 shares purchased by General Catalyst Group IV, L.P. and 4,842 shares purchased by GC Entrepreneurs Fund IV L.P. David Orfao, a managing director of General Catalyst Partners, served as a member of our board of directors from December 2010 until May 2013.
120
Sales of Series F Preferred Stock
In September 2011, we sold an aggregate of 3,965,126 shares of our Series F preferred stock at a price of $9.3314 per share for an aggregate price of approximately $37.0 million. The following table summarizes purchases of shares of our Series F preferred stock by our directors, executive officers and holders of more than 5% of any class of our capital stock as of the date of such transaction:
Related Party
|
Shares of Series F Preferred Stock Purchased (#) |
Aggregate Purchase Price ($) |
|||||
|---|---|---|---|---|---|---|---|
W Capital Partners II, L.P(1) |
2,250,478 | $ | 21,000,004 | ||||
Canaan VII L.P.(2) |
448,786 | 4,187,785 | |||||
Entities affiliated with Meritech Capital(3) |
222,483 | 2,076,076 | |||||
Entities affiliated with Draper Fisher Jurvetson(4) |
210,530 | 1,964,542 | |||||
Entities affiliated with General Catalyst Partners(5) |
189,855 | 1,771,613 | |||||
Total |
3,322,132 | $ | 31,000,020 | ||||
- (1)
- Robert Migliorino, a general partner of W Capital, served as a member of our board of directors from September 2011 until May 2013.
- (2)
- Warren Lee, a member of our board of directors, is a member of Canaan Partners VII LLC, the general partner of Canaan VII L.P.
- (3)
- Consists of 218,500 shares purchased by Meritech Capital Partners III, L.P. and 3,983 shares purchased by Meritech Capital Affiliates III, L.P. Michael Gordon, a managing director of Meritech Capital, served as a member of our board of directors from January 2009 until May 2013.
- (4)
- Consists of 99,054 shares purchased by Draper Fisher Jurvetson Fund IX, L.P., 97,392 shares purchased by Draper Fisher Jurvetson Growth Fund 2006, L.P., 7,874 shares purchased by Draper Fisher Jurvetson Partners Growth Fund 2006, LLC, 2,684 shares purchased by Draper Fisher Jurvetson Partners IX, LLC and 3,526 shares purchased by Draper Associates Riskmasters Fund II, LLC. Randall Glein, a managing director of Draper Fisher Jurvetson Growth Fund, is a member of our board of directors.
- (5)
- Consists of 184,948 shares purchased by General Catalyst Group IV, L.P. and 4,907 shares purchased by GC Entrepreneurs Fund IV L.P. David Orfao, a managing director of General Catalyst, served as a member of our board of directors from December 2010 until May 2013.
Investor Rights Agreement
We have entered into a sixth amended and restated investor rights agreement with our preferred stockholders, including Canaan VII L.P., Masthead Venture Partners Capital, L.P., W Capital Partners II, L.P., entities affiliated with Meritech Capital, entities affiliated with Draper Fisher Jurvetson, entities affiliated with General Catalyst Partners as well as Jason Glickman, Mark Pinney and James Rossman. The sixth amended and restated investor rights agreement, among other things:
- •
- grants these stockholders specified registration rights with respect to shares of our common stock issued or issuable upon
conversion of the shares of preferred stock held by them;
- •
- obligates us to deliver periodic financial statements to some of these stockholders;
and
- •
- grants some of these stockholders a right of first refusal with respect to sales of our shares by us, subject to specified exclusions, which exclusions include the sale of the shares pursuant to this prospectus, to the stockholders who are parties to the sixth amended and restated investor rights agreement.
For more information regarding the registration rights provided in this agreement, please refer to the section of this prospectus titled "Description of Capital Stock—Registration Rights." The provisions of this agreement other than those relating to registration rights will terminate upon completion of this offering.
121
Voting Agreement
We have entered into a sixth amended and restated voting agreement with certain of our stockholders, including Canaan VII L.P., Masthead Venture Partners Capital, L.P., W Capital Partners II, L.P., entities affiliated with Meritech Capital, entities affiliated with Draper Fisher Jurvetson, entities affiliated with General Catalyst Partners as well as William Day, Jason Glickman, Waikit Lau, Steven Lee, Mark Pinney and James Rossman. The sixth amended and restated voting agreement, among other things:
- •
- provides for the voting of shares with respect to the constituency of our board of directors; and
- •
- provides for the voting of shares with respect to specified transactions approved by the requisite supermajority of holders of our outstanding preferred stock.
The sixth amended and restated voting agreement will terminate upon completion of this offering.
Right of First Refusal and Co-Sale Agreement
We have entered into a sixth amended and restated right of first refusal and co-sale agreement with certain of our stockholders, including Canaan VII L.P., Masthead Venture Partners Capital, L.P., W Capital Partners II, L.P., entities affiliated with Meritech Capital, entities affiliated with Draper Fisher Jurvetson, entities affiliated with General Catalyst Partners as well as William Day, Waikit Lau, Steven Lee, Jason Glickman, Mark Pinney and James Rossman. The sixth amended and restated right of first refusal and co-sale agreement, among other things:
- •
- grants us rights of first refusal with respect to proposed transfers of our securities by specified stockholders, of which
we made a limited assignment of such rights of first refusal to W Capital Partners II, LP and its affiliates for up to an aggregate of $10.0 million of our shares of capital stock; and
- •
- grants a secondary rights of first refusal and right of co-sale to some of these stockholders with respect to proposed transfers of our securities by specified stockholders.
The sixth amended and restated right of first refusal and co-sale agreement will terminate upon completion of this offering.
Employment Offer Letters
We have entered into employment offer letters with our executive officers that, among other things, provide for certain severance and change in control benefits. For more information regarding these agreements with our named executive officers, see the section of this prospectus titled "Management—Executive Compensation."
Stock Option Grants to Executive Officers and Directors
We have granted stock options to our directors and executive officers. For more information regarding the stock options granted to our directors and named executive officers see the section of this prospectus titled "Management—Non-Employee Director Compensation" and "Executive Compensation—Outstanding Equity Awards at December 31, 2012."
Relationship with Advertising Agencies
Starcom Mediavest Group, or SMG, utilizes the Tremor Video Network for video ad campaigns for certain of its clients. During 2012 and the quarter ended March 31, 2013, advertisers that SMG represents paid us $18.0 million and $4.2 million, respectively, for video ad campaigns delivered through the Tremor Video Network. Laura Desmond, a member of our board of directors, is the
122
Global Chief Executive Officer of SMG. SMG is wholly owned by Publicis Groupe. Ms. Desmond has recused herself from all negotiations related to SMG and us.
AKQA Inc., or AKQA, utilizes the Tremor Video Network for video ad campaigns for certain of its clients. During 2011 and 2012, advertisers that AKQA represents paid us approximately $0.3 million and $1.1 million, respectively, for video ad campaigns delivered through the Tremor Video Network. James Rossman, a member of our board of directors, was the President and Chief Operating Officer of AKQA from April 2009 to June 2012.
Indemnification Agreements
Our certificate of incorporation will contain provisions limiting the liability of directors, and our bylaws will provide that we will indemnify each of our directors to the fullest extent permitted under Delaware law. Our certificate of incorporation and bylaws will also provide our board of directors with discretion to indemnify our officers and employees when determined appropriate by the board of directors. In addition, we intend to enter into an indemnification agreement with each of our directors and executive officers. For more information regarding these agreements, see "Executive Compensation—Limitations on Liability and Indemnification Matters."
Related Person Transaction Policy
Prior to this offering, we have not had a formal policy regarding approval of transactions with related parties. We have adopted a related person transaction policy that sets forth our procedures for the identification, review, consideration and approval or ratification of related person transactions, which will become effective immediately prior to the completion of this offering. The policy will become effective immediately upon the execution of the underwriting agreement for this offering. For purposes of our policy only, a related person transaction is a transaction, arrangement or relationship, or any series of similar transactions, arrangements or relationships, in which we and any related person are, were or will be participants in which the amount involves exceeds $120,000. Transactions involving compensation for services provided to us as an employee or director are not covered by this policy. A related person is any executive officer, director or beneficial owner of more than 5% of any class of our voting securities, including any of their immediate family members and any entity owned or controlled by such persons.
Under the policy, if a transaction has been identified as a related person transaction, including any transaction that was not a related person transaction when originally consummated or any transaction that was not initially identified as a related person transaction prior to consummation, our management must present information regarding the related person transaction to our audit committee, or, if audit committee approval would be inappropriate, to another independent body of our board of directors, for review, consideration and approval or ratification. The presentation must include a description of, among other things, the material facts, the interests, direct and indirect, of the related persons, the benefits to us of the transaction and whether the transaction is on terms that are comparable to the terms available to or from, as the case may be, an unrelated third party or to or from employees generally. Under the policy, we will collect information that we deem reasonably necessary from each director, executive officer and, to the extent feasible, significant stockholder to enable us to identify any existing or potential related-person transactions and to effectuate the terms of the policy.
In addition, under our Code of Business Conduct and Ethics, our employees and directors have an affirmative responsibility to disclose any transaction or relationship that reasonably could be expected to give rise to a conflict of interest.
123
In considering related person transactions, our audit committee, or other independent body of our board of directors, will take into account the relevant available facts and circumstances including, but not limited to:
- •
- the risks, costs and benefits to us;
- •
- the impact on a director's independence in the event that the related person is a director, immediate family member of a
director or an entity with which a director is affiliated;
- •
- the availability of other sources for comparable services or products;
and
- •
- the terms available to or from, as the case may be, unrelated third parties or to or from employees generally.
The policy requires that, in determining whether to approve, ratify or reject a related person transaction, our audit committee, or other independent body of our board of directors, must consider, in light of known circumstances, whether the transaction is in, or is not inconsistent with, our best interests and those of our stockholders, as our audit committee, or other independent body of our board of directors, determines in the good faith exercise of its discretion.
All of the transactions described above were entered into prior to the adoption of the written policy, but all were approved by our board of directors considering similar factors to those described above.
124
The following table sets forth the beneficial ownership of our common stock as of May 31, 2013, as adjusted to reflect the sale of common stock offered by us in this offering, for:
- •
- each person, or group of affiliated persons, who is known by us to beneficially own more than 5% of our common stock;
- •
- each of our named executive officers;
- •
- each of our directors; and
- •
- all of our executive officers and directors as a group.
The percentage ownership information shown in the table prior to this offering is based upon 41,014,452 shares of common stock outstanding as of May 31, 2013, after giving effect to the conversion of all outstanding shares of Series II common stock and preferred stock into 34,294,672 shares of our common stock (assuming a conversion ratio equal to approximately 1.1664 common shares for each Series F preferred share based on an initial public offering price of $12.00 per share, the midpoint of the price range set forth on the cover page of this prospectus), which will each occur automatically upon the closing of this offering. See the section of this prospectus titled "Offering" for a description of the number of shares issuable upon conversion of our Series F preferred stock depending on the price at which our shares are sold to the public. The percentage ownership information shown in the table after this offering is based upon shares, assuming the sale of shares of our common stock by us in the offering and no exercise of the underwriters' over-allotment option. The percentage ownership information shown in the table after this offering if the underwriters' over-allotment option is exercised in full is based upon 49,639,452 shares, assuming the sale of 1,125,000 shares of our common stock by us pursuant to the underwriters' option.
We have determined beneficial ownership in accordance with the rules of the SEC. These rules generally attribute beneficial ownership of securities to persons who possess sole or shared voting power or investment power with respect to those securities. In addition, the rules include shares of common stock issuable pursuant to the exercise of stock options or warrants that are either immediately exercisable or exercisable on or before July 30, 2013, which is 60 days after May 31, 2013. These shares are deemed to be outstanding and beneficially owned by the person holding those options or warrants for the purpose of computing the percentage ownership of that person, but they are not treated as outstanding for the purpose of computing the percentage ownership of any other person. Unless otherwise indicated, the persons or entities identified in this table have sole voting and investment power with respect to all shares shown as beneficially owned by them, subject to applicable community property laws.
125
Except as otherwise noted below, the address for persons listed in the table is c/o Tremor Video, Inc., 53 West 23rd Street, New York, New York 10010.
| |
Shares Beneficially Owned Prior to this Offering |
Shares Beneficially Owned After this Offering |
Shares Beneficially Owned After this Offering if Underwriters' Option is Exercised in Full |
||||||||||||||||
|---|---|---|---|---|---|---|---|---|---|---|---|---|---|---|---|---|---|---|---|
Name of Beneficial Owner
|
Shares | Percentage | Shares | Percentage | Shares | Percentage | |||||||||||||
5% Stockholders: |
|||||||||||||||||||
Canaan VII L.P.(1) |
7,839,828 | 19.1 | % | 7,839,828 | 16.2 | % | 7,839,828 | 15.8 | % | ||||||||||
W Capital Partners II, L.P.(2) |
4,726,886 | 11.5 | 4,726,886 | 9.7 | 4,726,886 | 9.5 | |||||||||||||
Masthead Venture Partners Capital, L.P.(3) |
4,281,001 | 10.4 | 4,281,001 | 8.8 | 4,281,001 | 8.6 | |||||||||||||
Entities affiliated with Meritech Capital(4) |
3,886,549 | 9.5 | 3,886,549 | 8.0 | 3,886,549 | 7.8 | |||||||||||||
Entities affiliated with Draper Fisher Jurvetson(5) |
3,677,751 | 9.0 | 3,677,751 | 7.6 | 3,677,751 | 7.4 | |||||||||||||
Entities affiliated with General Catalyst Partners(6) |
3,316,568 | 8.1 | 3,316,568 | 6.8 | 3,316,568 | 6.7 | |||||||||||||
Named Executive Officers and Directors: |
|||||||||||||||||||
William Day(7) |
1,182,509 | 2.8 | 1,182,509 | 2.4 | 1,182,509 | 2.3 | |||||||||||||
Lauren Wiener |
— | * | — | * | — | * | |||||||||||||
Adam Lichstein(8) |
154,403 | * | 154,403 | * | 154,403 | * | |||||||||||||
Randy Kilgore(9) |
415,498 | 1.0 | 415,498 | * | 415,498 | * | |||||||||||||
Laura Desmond(10) |
43,750 | * | 43,750 | * | 43,750 | * | |||||||||||||
Randall Glein(5) |
3,677,751 | 9.0 | 3,677,751 | 7.6 | 3,677,751 | 7.4 | |||||||||||||
Rachel Lam(11) |
— | * | — | * | — | * | |||||||||||||
Warren Lee |
— | * | — | * | — | * | |||||||||||||
James Rossman(12) |
237,538 | * | 237,538 | * | 237,538 | * | |||||||||||||
Robert Schechter(13) |
868 | * | 868 | * | 868 | * | |||||||||||||
All current directors and executive officers as a group(14) (12 persons) |
6,588,957 | 15.2 | 6,588,957 | 12.9 | 6,588,957 | 12.6 | |||||||||||||
- *
- Represents
beneficial ownership of less than 1%.
- (1)
- Consists of 7,839,828 shares held by Canaan VII L.P. Canaan Partners VII LLC is the sole general partner of Canaan VII L.P. Canaan VII L.P. is a holder of more than 5% of our voting securities, and Warren Lee, a member of Canaan Partners LLC, is a member of our board of directors. Brenton Ahrens, John Balen, Maha Ibrahim, Deepak Kamra, Gregory Kopchinsky, Seth Rudnick, Guy Russo, Eric Young, Wende Hutton and Stephen Bloch are managers of Canaan Partners VII LLC. These individuals disclaim beneficial ownership with respect to all shares held by Canaan VII L.P. The principal business address of Canaan VII L.P. is 285 Riverside Avenue, Ste. 250, Westport, CT 06889.
- (2)
- Consists of 4,726,886 shares held by W Capital Partners II, L.P. W Capital II, L.P. is a holder of more than 5% of our voting securities, and Robert Migliorino, a general partner of W Capital, served as a member of our board of director until May 2013. The sole general partner of W Capital Partners II, L.P. is WCP GP II, L.P. The sole general partner of WCP GP II, L.P. is WCP GP II, LLC. The managing members of WCP GP II, LLC exercise voting and investment power over securities held by W Capital Partners II, L.P. The managing members of WCP GP II, LLC are Robert Migliorino, David Wachter and Stephen Wertheimer and may be deemed to have shared voting, investment and dispositive power with respect to the shares held by these entities. These individuals disclaim beneficial ownership with respect to such shares except to the extent of their pecuniary interest therein. The principal business address of W Capital Partners is 1 East 52nd Street, Fifth Floor, New York, NY 10022.
- (3)
- Consists of 4,281,001 shares held by Masthead Venture Partners Capital, L.P. Masthead Venture Partners Capital L.P. is a holder of more than 5% of our voting securities. Masthead Fund General Partner, LLC, the general partner of Masthead Venture Partners Capital, L.P., has sole voting and dispositive power with respect to the shares held by Masthead Venture Partners Capital, L.P. The managing members of Masthead Fund General Partner, LLC are Braden Bohrmann, Daniel Flatley, Richard Levandov, Brian Owen, and Stephen Smith and may be deemed to have shared voting, investment and dispositive power with respect to the shares held by this entity. These individuals disclaim beneficial ownership with respect to such shares except to the extent of their pecuniary interest therein. The principal business address of Masthead Venture Partners is 55 Cambridge Parkway Suite 103, Cambridge, MA 02142.
- (4)
- Consists of 3,816,982 shares held by Meritech Capital Partners III L.P. and 69,567 shares held by Meritech Capital Affiliates III L.P. Entities affiliated with Meritech Capital are holders of more than 5% of our voting securities. Meritech Capital Associates III L.L.C., the general partner of Meritech Capital Partners III L.P. and Meritech
126
Capital Affiliates III L.P., has sole voting and dispositive power with respect to the shares held by Meritech Capital Partners III L.P. and Meritech Capital Affiliates III L.P. The managing member of Meritech Capital Associates III L.L.C. is Meritech Management Associates III L.L.C. George Bischof, Michael Gordon, Paul Madera, and Robert Ward, the managing members of Meritech Management Associates III L.L.C., may be deemed to have shared voting, investment and dispositive power with respect to the shares held by these entities. Mr. Gordon served as a member of our board of directors until May 2013. These individuals disclaim beneficial ownership with respect to such shares except to the extent of their pecuniary interest therein. The principal business address of Meritech Capital is 245 Lytton Avenue, Suite 350, Palo Alto, CA 94301.
- (5)
- Consists of 1,701,331 shares held by Draper Fisher Jurvetson Growth Fund 2006, L.P., 137,546 shares held by Draper Fisher Jurvetson Partners Growth Fund 2006, LLC, 1,730,385 shares held by Draper Fisher Jurvetson Fund IX, L.P., 46,889 shares held by Draper Fisher Jurvetson Partners IX, LLC, 57,096 shares held by Draper Associates, L.P. and 4,504 shares held by Draper Associates Riskmasters Fund II, LLC. Entities affiliated with Draper Fisher Jurvetson are holders of more than 5% of our voting securities, and Randall Glein, a managing director of Draper Fisher Jurvetson Growth Fund, is a member of our board of directors. Mark Bailey, Timothy Draper, John Fisher, Jennifer Fonstad, Randall Glein, Stephen Jurvetson, Barry Shuler, Andreas Stavropoulos, Josh Stein and Don Wood are managing directors and/or managing members of these funds and/or of the various general partner entities of these funds that directly hold shares and as such they may be deemed to have shared voting, investment and dispositive power with respect to the shares held by these entities. These individuals disclaim beneficial ownership with respect to such shares except to the extent of their pecuniary interest therein. The principal place of business for Draper Fisher Jurvetson is 2882 Sand Hill Road, Suite 150, Menlo Park, CA 94025.
- (6)
- Consists of 3,230,851 shares held by General Catalyst Group IV, L.P. and 85,717 shares held by GC Entrepreneurs Fund IV, L.P. Entities affiliated with General Catalyst are holders of more than 5% of our voting securities, and David Orfao, a managing director of General Catalyst, served as a member of our board of director until May 2013. General Catalyst Partners IV, L.P. is the sole general partner of each of General Catalyst Group IV, L.P. and GC Entrepreneurs Fund IV, L.P. General Catalyst GP IV, LLC is the sole general partner of General Catalyst Partners IV, L.P. David Fialkow, David Orfao and Joel Cutler are managing directors of General Catalyst GP IV, LLC and may be deemed to have shared voting, investment and dispositive power with respect to the shares held by these entities. These individuals disclaim beneficial ownership with respect to such shares except to the extent of their pecuniary interest therein. The principal business address of General Catalyst is 20 University Road, Suite 450, Cambridge, MA 02138.
- (7)
- Consists of 1,182,509 shares of common stock underlying options that are vested and exercisable within 60 days of May 31, 2013.
- (8)
- Consists of 154,403 shares of common stock underlying options that are vested and exercisable within 60 days of May 31, 2013.
- (9)
- Consists of 415,498 shares of common stock underlying options that are vested and exercisable within 60 days of May 31, 2013.
- (10)
- Consists of 43,750 shares of common stock underlying options that are vested and exercisable within 60 days of May 31, 2013.
- (11)
- Ms. Lam was appointed to our board of directors in May 2013.
- (12)
- Includes 150,157 shares of common stock underlying options that are vested and exercisable within 60 days of May 31, 2013.
- (13)
- Mr. Schechter was appointed to our board of directors in June 2013. Consists of 868 shares of common stock underlying options that are vested and exercisable within 60 days of May 31, 2013.
- (14)
- Consists of the shares listed in footnotes (5), (7), (8), (10), (12) and (13) above. Also includes 131,943 shares of common stock underlying options that are vested and exercisable within 60 days of May 31, 2013 owned by Todd Sloan, a Senior Vice President and our Chief Financial Officer, and 356,665 shares of common stock and 388,032 shares of common stock underlying options that are vested and exercisable within 60 days of May 31, 2013 held by Steven Lee, a Senior Vice President and our Chief Technology Officer.
127
The following description of our capital stock, certain provisions of our certificate of incorporation and bylaws, as each will be in effect upon the completion of this offering, and certain provisions of Delaware law are summaries. You should also refer to the certificate of incorporation and the bylaws, which are filed as exhibits to the registration statement of which this prospectus is part. We refer in this section to our certificate of incorporation and bylaws that we intend to adopt in connection with this offering as our certificate of incorporation and bylaws, respectively.
General
Upon the completion of this offering, our certificate of incorporation will authorize us to issue up to 250,000,000 shares of common stock, $0.0001 par value per share, and 10,000,000 shares of preferred stock, $0.0001 par value per share, all of which shares of preferred stock will be undesignated. Our board of directors may establish the rights and preferences of the preferred stock from time to time. As of March 31, 2013, after giving effect to the automatic conversion of all outstanding Series II common stock and preferred stock into shares of our common stock in connection with the completion of the offering, there would have been 40,998,103 shares of common stock issued and outstanding, held of record by 205 stockholders.
The number of shares of our common stock to be issued upon the automatic conversion of all outstanding shares of our Series F preferred stock depends in part on the anticipated initial public offering price of our common stock. The terms of our Series F preferred stock provide that the ratio at which each share of these series of preferred stock automatically convert into shares of our common stock in connection with this offering will increase if the anticipated initial public offering price is below $13.997 per share, which would result in additional shares of our common stock being issued upon conversion of our Series F preferred stock immediately prior to the closing of this offering. Based upon the anticipated initial public offering price of $12.00 per share, the midpoint of the price range set forth on the cover page of this prospectus, the outstanding shares of our Series F preferred stock will convert into an aggregate of 4,624,988 shares of our common stock immediately prior to the closing of this offering.
Common Stock
Voting Rights
Each holder of our common stock is entitled to one vote for each share on all matters submitted to a vote of the stockholders, including the election of directors. Under our certificate of incorporation and bylaws, our stockholders will not have cumulative voting rights. Because of this, the holders of a majority of the shares of common stock entitled to vote in any election of directors can elect all of the directors standing for election, if they should so choose.
Dividends
Subject to preferences that may be applicable to any then-outstanding preferred stock, holders of common stock are entitled to receive ratably those dividends, if any, as may be declared from time to time by the board of directors out of legally available funds.
Liquidation
In the event of our liquidation, dissolution or winding up, holders of common stock will be entitled to share ratably in the net assets legally available for distribution to stockholders after the payment of all of our debts and other liabilities and the satisfaction of any liquidation preference granted to the holders of any then-outstanding shares of preferred stock.
128
Rights and Preferences
Holders of common stock have no preemptive, conversion or subscription rights and there are no redemption or sinking fund provisions applicable to the common stock. The rights, preferences and privileges of the holders of common stock are subject to, and may be adversely affected by, the rights of the holders of shares of any series of preferred stock that we may designate in the future.
Preferred Stock
All currently outstanding shares of preferred stock will be converted automatically to common stock upon the completion of this offering.
Following the completion of this offering, our board of directors will have the authority, without further action by our stockholders, to issue up to 10,000,000 shares of preferred stock in one or more series, to establish from time to time the number of shares to be included in each such series, to fix the rights, preferences and privileges of the shares of each wholly unissued series and any qualifications, limitations or restrictions thereon, and to increase or decrease the number of shares of any such series, but not below the number of shares of such series then outstanding.
Our board of directors may authorize the issuance of preferred stock with voting or conversion rights that could adversely affect the voting power or other rights of the holders of our common stock. The purpose of authorizing our board of directors to issue preferred stock and determine its rights and preferences is to eliminate delays associated with a stockholder vote on specific issuances. The issuance of preferred stock, while providing flexibility in connection with possible acquisitions and other corporate purposes, could, among other things, have the effect of delaying, deferring or preventing a change in control of us and may adversely affect the market price of our common stock and the voting and other rights of the holders of our common stock. It is not possible to state the actual effect of the issuance of any shares of preferred stock on the rights of holders of common stock until the board of directors determines the specific rights attached to that preferred stock.
We have no present plans to issue any shares of preferred stock.
Options
As of March 31, 2013, options to purchase an aggregate of 7,002,403 shares of common stock were outstanding under all of our equity incentive plans. For additional information regarding the terms of these plans, see the section of this prospectus titled "Executive Compensation—Equity Incentive Plans."
Warrants
As of March 31, 2013, we had the following warrants outstanding, all of which are exercisable immediately prior to the completion of this offering:
- •
- warrants to purchase an aggregate of 35,520 shares of our Series A preferred stock at an exercise price of $1.2669
per share, with an expiration date of June 7, 2017;
- •
- warrants to purchase an aggregate of 33,930 shares of our Series B-1 preferred stock at an exercise
price of $4.8629 per share, with an expiration date of December 7, 2018;
- •
- warrants to purchase an aggregate of 31,659 shares of our Series C preferred stock at an exercise price of $3.7904
per share, with an expiration date of February 8, 2020;
- •
- warrants to purchase an aggregate of 31,130 shares of our Series 1 preferred stock at an exercise price of $2.4575 per share, with an expiration date of June 30, 2017; and
129
- •
- warrants to purchase an aggregate of 8,694 shares of our Series 3 preferred stock at an exercise price of $5.7507 per share, with an expiration date of February 6, 2015.
All the warrants described above, other than the warrants to purchase Series B-1 preferred stock, become exercisable for shares of our common stock on a one-for-one basis upon the closing of this offering. The warrants to purchase Series B-1 preferred stock become exercisable for shares of our common stock on a 1.04719-for-1 share basis upon the closing of this offering. Certain of these warrants have a net exercise provision under which the holder may, in lieu of payment of the exercise price in cash, surrender the applicable warrant and receive a net amount of shares based on the fair market value of our stock at the time of exercise of the applicable warrant after deduction of the aggregate exercise price. The warrants also contain a provision for the adjustment of the exercise price and the number of shares issuable upon the exercise of the applicable warrant in the event of certain stock dividends, stock splits, reorganizations, reclassifications and consolidations.
Registration Rights
After our initial public offering, certain holders of shares of our common stock, including those shares of our common stock that will be issued upon conversion of our preferred stock in connection with this offering, and those shares of our common stock that are issuable pursuant to our outstanding preferred stock warrants, or the warrant shares, will be entitled to certain rights with respect to registration of such shares under the Securities Act. These shares are collectively referred to herein as registrable securities. The holders of these registrable securities possess registration rights pursuant to the terms of sixth amended and restated investor rights agreement, or investor rights agreement, and are described in additional detail below.
The registration rights provisions of our investor rights agreement provide these holders of registrable securities with demand (other than the warrant shares), piggyback and S-3 registration rights as described more fully below.
Demand Registration Rights
At any time beginning upon the expiration of the lock-up period following this offering, as described below under "Shares Eligible for Future Sale—Lock-Up Agreements," the holders of at least 60% of our registrable securities then outstanding (other than the warrant shares) in the aggregate, or a lesser percentage if the anticipated aggregate offering price, net of underwriting discounts, selling commissions, applicable stock transfer taxes and fees and disbursements of counsel, would exceed $20 million, have the right to demand that we file one registration statement. These registration rights are subject to specified conditions and limitations, including the right of the underwriters, if any, to limit the number of shares included in any such registration under specified circumstances. Upon such a request, we will be required to file the registration within 60 days. As of March 31, 2013, an aggregate of 33,247,315 registrable securities are entitled to these demand registration rights.
Piggyback Registration Rights
At any time after the completion of this offering, if we propose to register any of our securities under the Securities Act either for our own account or for the account of other stockholders, the holders of our registrable securities then outstanding will each be entitled to notice of the registration and will be entitled to include their shares of common stock in any such registration statement. These piggyback registration rights are subject to specified conditions and limitations, including the right of the underwriters to limit the number of shares included in any such registration under specified circumstances. As of March 31, 2013, an aggregate of 33,389,849 registrable securities are entitled to these piggyback registration rights.
130
Registration on Form S-3
Holders of at least 20% of our registrable securities then outstanding are entitled to request to have such shares registered by us on a Form S-3 registration statement, provided that we are qualified to file a registration statement on Form S-3, such requested registration has an anticipated aggregate offering size to the public of at least $2 million and we have not already effected two registrations on Form S-3 within the preceding 12-month period. The right to have such shares registered on Form S-3 is further subject to other specified conditions and limitations, including the right of the underwriters to limit the number of shares included in any such registration under specified circumstances. As of March 31, 2013, an aggregate of 33,389,849 registrable securities are entitled to these Form S-3 registration rights.
Expenses of Registration
We will pay all expenses relating to any demand, piggyback or Form S-3 registration, other than underwriting discounts and commissions, subject to specified conditions and limitations.
Termination of Registration Rights
The registration rights granted under the investor rights agreement to any holder of registrable securities will terminate when all of such holder's registrable securities could be sold without restriction or limitation under Rule 144 of the Securities Act.
Anti-Takeover Provisions
Anti-Takeover Statute
We are subject to Section 203 of the Delaware General Corporation Law, which generally prohibits a publicly held Delaware corporation from engaging in any business combination with any interested stockholder for a period of three years after the date that such stockholder became an interested stockholder, with the following exceptions:
- •
- before such date, the board of directors of the corporation approved either the business combination or the transaction
that resulted in the stockholder becoming an interested stockholder;
- •
- upon completion of the transaction that resulted in the stockholder becoming an interested stockholder, the interested
stockholder owned at least 85% of the voting stock of the corporation outstanding at the time the transaction began, excluding for purposes of determining the voting stock outstanding, but not the
outstanding voting stock owned by the interested stockholder, those shares owned (1) by persons who are directors and also officers and (2) employee stock plans in which employee
participants do not have the right to determine confidentially whether shares held subject to the plan will be tendered in a tender or exchange offer; or
- •
- on or after such date, the business combination is approved by the board of directors and authorized at an annual or special meeting of the stockholders, and not by written consent, by the affirmative vote of at least 662/3% of the outstanding voting stock that is not owned by the interested stockholder.
In general, Section 203 defines a "business combination" to include the following:
- •
- any merger or consolidation involving the corporation and the interested stockholder;
- •
- any sale, transfer, pledge or other disposition of 10% or more of the assets of the corporation involving the interested stockholder;
131
- •
- subject to certain exceptions, any transaction that results in the issuance or transfer by the corporation of any stock of
the corporation to the interested stockholder;
- •
- any transaction involving the corporation that has the effect of increasing the proportionate share of the stock or any
class or series of the corporation beneficially owned by the interested stockholder; or
- •
- the receipt by the interested stockholder of the benefit of any loans, advances, guarantees, pledges or other financial benefits by or through the corporation.
In general, Section 203 defines an "interested stockholder" as an entity or person who, together with the person's affiliates and associates, beneficially owns, or within three years prior to the time of determination of interested stockholder status did own, 15% or more of the outstanding voting stock of the corporation.
Anti-Takeover Effects of Certain Provisions of our Certificate of Incorporation and Bylaws to be in Effect Upon the Completion of this Offering
Our certificate of incorporation will provide for our board of directors to be divided into three classes with staggered three-year terms. Only one class of directors will be elected at each annual meeting of our stockholders, with the other classes continuing for the remainder of their respective three-year terms. Because our stockholders do not have cumulative voting rights, stockholders holding a majority of the shares of common stock outstanding will be able to elect all of our directors. Our certificate of incorporation and bylaws will also provide that directors may be removed by the stockholders only for cause upon the vote of 662/3% or more of our outstanding common stock. Furthermore, the authorized number of directors may be changed only by resolution of the board of directors, and vacancies and newly created directorships on the board of directors may, except as otherwise required by law or determined by the board, only be filled by a majority vote of the directors then serving on the board, even though less than a quorum.
Our certificate of incorporation and bylaws will also provide that all stockholder actions must be effected at a duly called meeting of stockholders and will eliminate the right of stockholders to act by written consent without a meeting. Our bylaws will also provide that only our chairman of the board, chief executive officer or the board of directors pursuant to a resolution adopted by a majority of the total number of authorized directors may call a special meeting of stockholders.
Our bylaws will also provide that stockholders seeking to present proposals before our annual meeting of stockholders or to nominate candidates for election as directors at a meeting of stockholders must provide timely advance notice in writing, and, subject to applicable law, will specify requirements as to the form and content of a stockholder's notice.
Our certificate of incorporation and bylaws will provide that the stockholders cannot amend many of the provisions described above except by a vote of 662/3% or more of our outstanding common stock.
The combination of these provisions will make it more difficult for our existing stockholders to replace our board of directors as well as for another party to obtain control of us by replacing our board of directors. Since our board of directors has the power to retain and discharge our officers, these provisions could also make it more difficult for existing stockholders or another party to effect a change in management. In addition, the authorization of undesignated preferred stock makes it possible for our board of directors to issue preferred stock with voting or other rights or preferences that could impede the success of any attempt to change our control.
These provisions are intended to enhance the likelihood of continued stability in the composition of our board of directors and its policies and to discourage coercive takeover practices and inadequate takeover bids. These provisions are also designed to reduce our vulnerability to hostile takeovers and to
132
discourage certain tactics that may be used in proxy fights. However, such provisions could have the effect of discouraging others from making tender offers for our shares and may have the effect of delaying changes in our control or management. As a consequence, these provisions may also inhibit fluctuations in the market price of our stock that could result from actual or rumored takeover attempts. We believe that the benefits of these provisions, including increased protection of our potential ability to negotiate with the proponent of an unfriendly or unsolicited proposal to acquire or restructure our company, outweigh the disadvantages of discouraging takeover proposals, because negotiation of takeover proposals could result in an improvement of their terms.
Choice of Forum
Our certificate of incorporation to be in effect upon the completion of this offering will provide that the Court of Chancery of the State of Delaware will be the exclusive forum for any derivative action or proceeding brought on our behalf; any action asserting a breach of fiduciary duty owed by and of our directors, officers or employees to us or our stockholders; any action asserting a claim against us arising pursuant to the Delaware General Corporation Law, our certificate of incorporation or our bylaws; or any action asserting a claim against us that is governed by the internal affairs doctrine. Several lawsuits have been filed in Delaware challenging the enforceability of similar choice of forum provisions and it is possible that a court determines such provisions are not enforceable.
Transfer Agent and Registrar
The transfer agent and registrar for our common stock is American Stock Transfer & Trust Company, LLC. The transfer agent's address is 6201 15th Avenue, Brooklyn, New York 11219.
Listing
We have applied to apply for listing of our common stock on the NYSE under the trading symbol "TRMR."
133
SHARES ELIGIBLE FOR FUTURE SALE
Prior to this offering, no public market existed for our common stock, and although we expect that our common stock will be approved for listing on the NYSE, we cannot assure investors that there will be an active public market for our common stock following this offering. We cannot predict what effect, if any, sales of our shares in the public market or the availability of shares for sale will have on the market price of our common stock. Future sales of substantial amounts of common stock in the public market, including shares issued upon exercise of outstanding options or warrants, or the perception that such sales may occur, however, could adversely affect the market price of our common stock and also could adversely affect our future ability to raise capital through the sale of our common stock or other equity-related securities at times and prices we believe appropriate.
Upon completion of this offering, based on our shares outstanding as of May 31, 2013 and after giving effect to the conversion of all outstanding shares of our Series II common stock and preferred stock, 48,514,452 shares of our common stock will be outstanding, or 49,639,452 shares of common stock if the underwriters exercise their over-allotment option in full.
All of the shares of common stock sold in this offering will be freely tradable without restrictions or further registration under the Securities Act, except for any shares sold to our "affiliates," as that term is defined under Rule 144 under the Securities Act. The remaining 41,014,452 outstanding shares of common stock held by existing stockholders are "restricted securities," as that term is defined in Rule 144 under the Securities Act. Restricted securities may be sold in the public market only if the offer and sale is registered under the Securities Act or if the offer and sale of those securities qualifies for exemption from registration, including exemptions provided by Rules 144 and 701 promulgated under the Securities Act.
As a result of lockup agreements and market standoff provisions described below and the provisions of Rules 144 and 701, the restricted securities will be available for sale in the public market as follows:
- •
- 7,592,345 shares will be eligible for immediate sale upon the completion of this offering;
and
- •
- approximately 40,922,107 shares will be eligible for sale upon expiration of lock-up agreements and market standoff provisions described below, beginning 180 days after the date of this prospectus, subject in certain circumstances to the volume, manner of sale and other limitations under Rule 144 and Rule 701.
We may issue shares of our common stock from time to time for a variety of corporate purposes, including in capital-raising activities through future public offerings or private placements, in connection with exercise of stock options and warrants, vesting of restricted stock units and other issuances relating to our employee benefit plans and as consideration for future acquisitions, investments or other purposes. The number of shares of our common stock that we may issue may be significant, depending on the events surrounding such issuances. In some cases, the shares we issue may be freely tradable without restriction or further registration under the Securities Act; in other cases, we may grant registration rights covering the shares issued in connection with these issuances, in which case the holders of the common stock will have the right, under certain circumstances, to cause us to register any resale of such shares to the public.
Rule 144
In general, persons who have beneficially owned restricted shares of our common stock for at least six months, and any affiliate of the company who owns either restricted shares of our common stock, are entitled to sell their securities without registration with the SEC under an exemption from registration provided by Rule 144 under the Securities Act.
134
Non-Affiliates
Any person who is not deemed to have been one of our affiliates at the time of, or at any time during the three months preceding, a sale may sell an unlimited number of restricted securities under Rule 144 if:
- •
- the restricted securities have been held for at least six months, including the holding period of any prior owner other
than one of our affiliates;
- •
- we have been subject to the Exchange Act periodic reporting requirements for at least 90 days before the sale; and
- •
- we are current in our Exchange Act reporting at the time of sale.
Any person who is not deemed to have been an affiliate of ours at the time of, or at any time during the three months preceding, a sale and has held the restricted securities for at least one year, including the holding period of any prior owner other than one of our affiliates, will be entitled to sell an unlimited number of restricted securities without regard to the length of time we have been subject to Exchange Act periodic reporting or whether we are current in our Exchange Act reporting.
Affiliates
Persons seeking to sell restricted securities who are our affiliates at the time of, or any time during the three months preceding, a sale, would be subject to the restrictions described above. They are also subject to additional restrictions, by which such person would be required to comply with the manner of sale and notice provisions of Rule 144 and would be entitled to sell within any three-month period only that number of securities that does not exceed the greater of either of the following:
- •
- 1% of the number of shares of our common stock then outstanding, which will equal approximately 485,144 shares immediately
after the completion of this offering based on the number of shares outstanding as of May 31, 2013; or
- •
- the average weekly trading volume of our common stock on the NYSE during the four calendar weeks preceding the filing of a notice on Form 144 with respect to the sale.
Rule 701
In general, under Rule 701 a person who purchased shares of our common stock pursuant to a written compensatory plan or contract and who is not deemed to have been one of our affiliates during the immediately preceding 90 days may sell these shares in reliance upon Rule 144, but without being required to comply with the notice, manner of sale or public information requirements or volume limitation provisions of Rule 144. Rule 701 also permits affiliates to sell their Rule 701 shares under Rule 144 without complying with the holding period requirements of Rule 144. All holders of Rule 701 shares, however, are required to wait until 90 days after the date of this prospectus before selling such shares pursuant to Rule 701. As of May 31, 2013, 1,345,771 shares of our outstanding common stock had been issued in reliance on Rule 701 as a result of exercises of stock options and issuance of restricted stock. However, substantially all Rule 701 shares are subject to lock-up agreements as described below and in the section of this prospectus titled "Underwriting" and will become eligible for sale upon the expiration of the restrictions set forth in those agreements.
Form S-8 Registration Statements
As of May 31, 2013, options to purchase an aggregate 7,194,204 of our common stock were outstanding. As soon as practicable after the completion of this offering, we intend to file with the SEC one or more registration statements on Form S-8 under the Securities Act to register the shares of our common stock that are issuable pursuant to our equity incentive plans. See the section of this
135
prospectus titled "Executive Compensation—Equity Incentive Plans" for a description of our equity incentive plans. These registration statements will become effective immediately upon filing. Shares covered by these registration statements will then be eligible for sale in the public markets, subject to vesting restrictions, any applicable lock-up agreements described below and Rule 144 limitations applicable to affiliates.
Lock-Up Agreements
In connection with this offering, we, our directors and officers, and substantially all of the holders of equity securities outstanding immediately prior to this offering have agreed, subject to certain exceptions, not to offer, sell, or transfer any common stock or securities convertible into or exchangeable for our common stock for 180 days after the date of this prospectus without the prior written consent of Credit Suisse Securities (USA) LLC and Jefferies LLC on behalf of the underwriters.
The agreements do not contain any pre-established conditions to the waiver by Credit Suisse Securities (USA) LLC and Jefferies LLC on behalf of the underwriters of any terms of the lock-up agreements. Any determination to release shares subject to the lock-up agreements would be based on a number of factors at the time of determination, including but not necessarily limited to the market price of the common stock, the liquidity of the trading market for the common stock, general market conditions, the number of shares proposed to be sold, contractual obligations to release certain shares subject to the lock-up agreements in the event any such shares are released, subject to certain specific limitations and thresholds, and the timing, purpose and terms of the proposed sale.
In addition to the restrictions contained in the lock-up agreements described above, we have entered into agreements with certain of our security holders, including our investors rights agreement and our standard forms of option agreements under our equity incentive plans, that contain market stand-off provisions imposing restrictions on the ability of such security holders to offer, sell or transfer our equity securities for a period of 180 days following the date of this prospectus.
Registration Rights
Upon the completion of this offering, the holders of 33,247,315 shares of our common stock issuable upon the conversion of our preferred stock (assuming a conversion ratio equal to approximately 1.1664 common shares for each Series F preferred share based on an initial public offering price of $12.00 per share, the midpoint of the price range set forth on the cover page of this prospectus) and 142,534 shares of our common stock issuable upon the exercise of outstanding warrants, or their transferees, will be entitled to specified rights with respect to the registration of the offer and sale of their shares under the Securities Act. Registration of the offer and sale of these shares under the Securities Act would result in the shares becoming freely tradable without restriction under the Securities Act immediately upon the effectiveness of the registration. See the section of this prospectus titled "Description of Capital Stock—Registration Rights" for additional information.
136
MATERIAL U.S. FEDERAL INCOME TAX CONSIDERATIONS
The following is a general discussion of the material U.S. federal income tax consequences of the acquisition, ownership and disposition of our common stock by "Non-U.S. Holders" (as defined below). This discussion is a summary for general information purposes only and does not consider all aspects of federal income taxation that may be relevant to particular Non-U.S. Holders in light of their individual circumstances or to certain types of Non-U.S. Holders subject to special tax rules, including partnerships or other pass-through entities for U.S. federal income tax purposes, banks, financial institutions or other financial services entities, broker-dealers, insurance companies, tax-exempt organizations, regulated investment companies, real estate investment trusts, controlled foreign corporations, passive foreign investment companies, corporations that accumulate earnings to avoid U.S. federal income tax, persons who use or are required to use mark-to-market accounting, persons that hold our shares as part of a "straddle," a "hedge" or a "conversion transaction," certain former citizens or permanent residents of the United States, investors in pass-through entities, or persons subject to the alternative minimum tax. In addition, this summary does not address, except to the extent discussed below, the effects of any applicable gift or estate tax, and this summary does not address the potential application of Medicare contribution tax or any tax considerations that may apply to Non-U.S. Holders of our common stock under state, local or non-U.S. tax laws and any other U.S. federal tax laws.
This summary is based on the Internal Revenue Code of 1986, as amended, or the Code, and applicable Treasury Regulations, rulings, administrative pronouncements and decisions as of the date of this registration statement, all of which are subject to change or differing interpretations at any time with possible retroactive effect. We have not sought, and will not seek, any ruling from the Internal Revenue Service, or the IRS, with respect to the tax consequences discussed herein, and there can be no assurance that the IRS will not take a position contrary to the tax consequences discussed below or that any position taken by the IRS would not be sustained. This discussion assumes that a Non-U.S. Holder will hold our common stock as a capital asset within the meaning of the Code (generally, property held for investment). For purposes of this discussion, the term "Non-U.S. Holder" means a beneficial owner of our shares that is not a partnership (or entity or arrangement treated as a partnership for U.S. federal income tax purposes) and is not:
- •
- an individual who is a citizen or resident of the United States;
- •
- a corporation created or organized in the United States or under the laws of the United States or of any state thereof or
the District of Columbia;
- •
- an estate, the income of which is subject to U.S. federal income tax regardless of its source; or
- •
- a trust if (1) a U.S. court can exercise primary supervision over the trust's administration and one or more U.S. persons have the authority to control all of the trust's substantial decisions or (2) the trust has a valid election in effect under applicable U.S. Treasury Regulations to be treated as a U.S. person.
If a partnership (or entity or arrangement treated as a partnership for U.S. federal income tax purposes) is a beneficial owner of our common stock, the tax treatment of a partner in the partnership will generally depend upon the status of the partner and the activities of the partnership. If you are a partner of a partnership holding our shares, you should consult your tax advisor regarding the tax consequences of the purchase, ownership, and disposition of our common stock.
PROSPECTIVE INVESTORS SHOULD CONSULT THEIR TAX ADVISORS REGARDING THE PARTICULAR U.S. FEDERAL INCOME TAX CONSEQUENCES TO THEM OF ACQUIRING, OWNING AND DISPOSING OF OUR COMMON STOCK, AS WELL AS ANY TAX CONSEQUENCES ARISING UNDER ANY STATE, LOCAL OR FOREIGN TAX LAWS AND ANY OTHER U.S. FEDERAL TAX LAWS.
137
Distributions on Our Common Stock
In general, distributions, if any, paid to a Non-U.S. Holder (to the extent paid out of our current or accumulated earnings and profits, as determined under U.S. federal income tax principles) will constitute dividends and be subject to U.S. withholding tax at a rate equal to 30% of the gross amount of the dividend, or a lower rate prescribed by an applicable income tax treaty, unless the dividends are effectively connected with a trade or business carried on by the Non-U.S. Holder within the United States. Any distribution not constituting a dividend (because such distribution exceeds our current and accumulated earnings and profits) will be treated first as reducing the Non-U.S. Holder's basis in its shares of common stock, but not below zero, and to the extent it exceeds the Non-U.S. Holder's basis, as capital gain (see "Sale or Other Taxable Disposition of Common Stock" below).
A Non-U.S. Holder who claims the benefit of an applicable income tax treaty generally will be required to satisfy certain certification and other requirements prior to the distribution date. Non-U.S. Holders must generally provide the withholding agent with a properly executed IRS Form W-8BEN or other appropriate version of IRS Form W-8 claiming an exemption from or reduction in withholding under an applicable income tax treaty. If tax is withheld in an amount in excess of the amount applicable under an income tax treaty, a refund of the excess amount may generally be obtained by timely filing an appropriate claim for refund with the IRS. Non-U.S. Holders should consult their tax advisors regarding their entitlement to benefits under an applicable income tax treaty.
Dividends that are effectively connected with a Non-U.S. Holder's conduct of a U.S. trade or business (and, if required by an applicable income tax treaty, attributable to a U.S. permanent establishment of the Non-U.S. Holder) generally will not be subject to U.S. withholding tax if the Non-U.S. Holder files the required forms, including IRS Form W-8ECI or other appropriate version of IRS Form W-8, with the payor of the dividend, but instead generally will be subject to U.S. federal income tax on a net income basis at the regular graduated rates in the same manner as if the Non-U.S. Holder were a resident of the United States. A corporate Non-U.S. Holder that receives effectively connected dividends may be subject to an additional branch profits tax at a rate of 30%, or a lower rate prescribed by an applicable income tax treaty, on its "effectively connected earnings and profits" for the taxable year, as adjusted for certain items.
Gain on Sale, Exchange or Other Disposition of Our Common Stock
In general, a non-U.S. holder will not be subject to any U.S. federal income tax or withholding tax on any gain realized upon such holder's sale, exchange or other disposition of shares of our common stock unless:
- (1)
- the
gain is effectively connected with a trade or business carried on by the Non-U.S. Holder within the United States (and, if required by an
applicable income tax treaty, attributable to a U.S. permanent establishment of the Non-U.S. Holder);
- (2)
- the
Non-U.S. Holder is an individual who holds shares of common stock as a capital asset and is present in the United States for 183 days
or more in the taxable year of disposition and certain other conditions are met; or
- (3)
- we are or have been a "United States real property holding corporation" for U.S. federal income tax purposes at any time during the shorter of the five-year period ending on the date of disposition or the period that the Non-U.S. Holder held the common stock, and, in the case where shares of our common stock are regularly traded on an established securities market, the Non-U.S. Holder owns, or is treated as owning, more than five percent of our common stock at any time during the foregoing period.
Net gain realized by a Non-U.S. Holder described in clause (i) above generally will be subject to U.S. federal income tax in the same manner as if the Non-U.S. Holder were a resident of the United
138
States. Any gains of a corporate Non-U.S. Holder described in clause (i) above may also be subject to an additional "branch profits tax" at a 30% rate, or such lower rate as may be specified by an applicable income tax treaty.
Gain realized by an individual Non-U.S. Holder described in clause (ii) above will be subject to a flat 30% tax, which gain may be offset by U.S. source capital losses, even though the individual is not considered a resident of the United States.
For purposes of clause (iii) above, a corporation is a United States real property holding corporation if the fair market value of its United States real property interests equals or exceeds 50% of the sum of the fair market value of its worldwide real property interests plus its other assets used or held for use in a trade or business. We believe that we are not, and we do not anticipate that we will become, a United States real property holding corporation.
U.S. Federal Estate Tax
The estate of a nonresident alien individual is generally subject to U.S. federal estate tax on property having a U.S. situs. Because we are a U.S. corporation, our common stock will be U.S. situs property and therefore will be included in the taxable estate of a nonresident alien decedent, unless an applicable estate tax treaty between the United States and the decedent's country of residence provides otherwise.
Information Reporting and Backup Withholding
Generally, we must report annually to the IRS and to each Non-U.S. Holder the amount of dividends paid, the name and address of the recipient, and the amount, if any, of tax withheld. These information reporting requirements apply even if withholding was not required because the dividends were effectively connected with the Non-U.S. Holder's conduct of a trade or business within the United States or withholding was reduced by an applicable income tax treaty. Under applicable income tax treaties or other agreements, the IRS may make its reports available to the tax authorities in the Non-U.S. Holder's country of residence.
Dividends paid to a Non-U.S. Holder that is not an exempt recipient generally will be subject to backup withholding, currently at a rate of 28%, unless the Non-U.S. Holder certifies to the payor as to its foreign status, which certification may generally be made on IRS Form W-8BEN or other appropriate version of IRS Form W-8.
Proceeds from the sale or other disposition of common stock by a Non-U.S. Holder effected by or through a U.S. office of a broker will generally be subject to information reporting and backup withholding, currently at a rate of 28%, unless the Non-U.S. Holder certifies to the payor under penalties of perjury as to, among other things, its name, address and status as a Non-U.S. Holder or otherwise establishes an exemption. Payment of disposition proceeds effected outside the United States by or through a non-U.S. office of a non-U.S. broker generally will not be subject to information reporting or backup withholding if the payment is not received in the United States. Information reporting, but generally not backup withholding, will apply to such a payment if the broker has certain connections with the United States unless the broker has documentary evidence in its records that the beneficial owner thereof is a Non-U.S. Holder and specified conditions are met or an exemption is otherwise established.
Backup withholding is not an additional tax. Any amount withheld under the backup withholding rules from a payment to a Non-U.S. Holder that results in an overpayment of taxes generally will be refunded, or credited against the holder's U.S. federal income tax liability, if any, provided that the required information is timely furnished to the IRS.
139
Foreign Accounts
A U.S. federal withholding tax of 30% may apply to dividends and the gross proceeds of a disposition of our common stock paid to a "foreign financial institution" (as specially defined under applicable rules) unless such institution enters into an agreement with the U.S. government to withhold on certain payments and to collect and provide to the U.S. tax authorities substantial information regarding certain U.S. account holders of such institution (which includes certain equity holders of such institution, as well as certain account holders that are foreign entities with U.S. owners). This U.S. federal withholding tax of 30% will also apply to payments of dividends and the gross proceeds of a disposition of our common stock paid to a non-financial foreign entity unless such entity either certifies it does not have any substantial U.S. owners or provides the withholding agent with a certification identifying substantial direct and indirect U.S. owners of the entity. The withholding tax described above will not apply if the foreign financial institution or non-financial foreign entity otherwise qualifies for an exemption from the rules. Under certain circumstances, a Non-U.S. Holder might be eligible for refunds or credits of such taxes. Prospective investors are encouraged to consult with their own tax advisors regarding the possible implications of this legislation on their investment in our common stock.
The withholding provisions described above will generally apply to payments of dividends made on or after January 1, 2014 and to payments of gross proceeds from a sale or other disposition of common stock on or after January 1, 2017.
140
Under the terms and subject to the conditions contained in an underwriting agreement dated , 2013, we have agreed to sell to the underwriters named below, for whom Credit Suisse Securities (USA) LLC and Jefferies LLC are acting as representatives, the following respective numbers of shares of common stock:
Underwriter
|
Number of Shares |
|||
|---|---|---|---|---|
Credit Suisse Securities (USA) LLC |
||||
Jefferies LLC |
||||
Canaccord Genuity Inc. |
||||
Oppenheimer & Co. Inc. |
||||
Total |
7,500,000 | |||
The underwriting agreement provides that the underwriters are obligated to purchase all the shares of common stock in the offering if any are purchased, other than those shares covered by the over-allotment option described below. The underwriting agreement also provides that if an underwriter defaults the purchase commitments of non-defaulting underwriters may be increased or the offering may be terminated.
We have granted to the underwriters a 30-day option to purchase on a pro rata basis up to additional shares from us at the initial public offering price less the underwriting discounts and commissions. The option may be exercised only to cover any over-allotments of common stock.
The underwriters propose to offer the shares of common stock initially at the public offering price on the cover page of this prospectus and to selling group members at that price less a selling concession of $ per share. The underwriters and selling group members may allow a discount of $ per share on sales to other broker/dealers. After the initial public offering the representatives may change the public offering price and concession and discount to broker/dealers.
The following table summarizes the compensation and estimated expenses we will pay:
| |
Per Share | Total | |||||||||||
|---|---|---|---|---|---|---|---|---|---|---|---|---|---|
| |
Without Over- allotment |
With Over- allotment |
Without Over- allotment |
With Over- allotment |
|||||||||
Underwriting discounts and commissions paid by us |
$ | $ | $ | $ | |||||||||
Expenses payable by us |
$ | $ | $ | $ | |||||||||
The representatives have informed us that the underwriters do not expect sales to accounts over which the underwriters have discretionary authority to exceed 5% of the shares of common stock being offered.
We have agreed that we will not offer, sell, contract to sell, pledge or otherwise dispose of, directly or indirectly, or file with the Securities and Exchange Commission a registration statement under the Securities Act of 1933, or the Securities Act, relating to, any shares of our common stock or securities convertible into or exchangeable or exercisable for any shares of our common stock, or publicly disclose the intention to make any offer, sale, pledge, disposition or filing, without the prior written consent of the representatives for a period of 180 days after the date of this prospectus, except for (1) issuances pursuant to the conversion or exchange of convertible or exchangeable securities or the exercise of warrants or options, in each case outstanding on the date hereof and described in the prospectus, (2) grants of employee stock options pursuant to the terms of a plan in effect on the date hereof and described in the prospectus, and (3) issuances of up to 5% of our outstanding capital stock immediately following the completion of the offering in connection with acquisitions of businesses, assets or technologies or in connection with strategic partnerships, license arrangements or collaborations; provided that persons to whom such shares are issued agree to be bound by a lock-up agreement substantially similar to that described in the immediately following paragraph.
Our officers, directors and substantially all of our security holders have agreed, subject to certain exceptions, that they will not offer, sell, contract to sell, pledge or otherwise dispose of, directly or
141
indirectly, any shares of our common stock or securities convertible into or exchangeable or exercisable for any shares of our common stock, enter into a transaction that would have the same effect, or enter into any swap, hedge or other arrangement that transfers, in whole or in part, any of the economic consequences of ownership of our common stock, whether any of these transactions are to be settled by delivery of our common stock or other securities, in cash or otherwise, or publicly disclose the intention to make any offer, sale, pledge or disposition, or to enter into any transaction, swap, hedge or other arrangement, or make any demand for or exercise any right with respect to the registration of our common stock, without, in each case, the prior written consent of the representatives for a period of 180 days after the date of this prospectus.
The representatives, on behalf of the underwriters, in their sole discretion, may release the common stock and other securities subject to the lock-up agreements described above in whole or in part at any time with or without notice. At least three business days before the effectiveness of any release or waiver of the restrictions described above in connection with any transfer of shares of common stock by an officer or director, the representatives will notify us of the impending release or waiver of any restriction and we have agreed to announce the impending release or waiver by press release through a major news service at least two business days before the effective date of the release or waiver, except where the release or waiver is effected solely to permit a transfer of common stock that is not for consideration and where the transferee has agreed in writing to be bound by the same terms as the lock-up agreements described above to the extent and for the duration that such terms remain in effect at the time of transfer.
We have agreed to indemnify the underwriters against certain liabilities under the Securities Act, or contribute to payments that the underwriters may be required to make in that respect.
We have applied to list the shares of common stock on the NYSE under the symbol "TRMR."
In connection with the offering the underwriters may engage in stabilizing transactions, over-allotment transactions, syndicate covering transactions, and penalty bids in accordance with Regulation M under the Exchange Act.
- •
- Stabilizing transactions permit bids to purchase the underlying security so long as the stabilizing bids do not exceed a
specified maximum.
- •
- Over-allotment involves sales by the underwriters of shares in excess of the number of shares the underwriters
are obligated to purchase, which creates a syndicate short position. The short position may be either a covered short position or a naked short position. In a covered short position, the number of
shares over-allotted by the underwriters is not greater than the number of shares that they may purchase in the over-allotment option. In a naked short position, the number of
shares involved is greater than the number of shares in the over-allotment option. The underwriters may close out any covered short position by either exercising their
over-allotment option and/or purchasing shares in the open market.
- •
- Syndicate covering transactions involve purchases of the common stock in the open market after the distribution has been
completed in order to cover syndicate short positions. In determining the source of shares to close out the short position, the underwriters will consider, among other things, the price of shares
available for purchase in the open market as compared to the price at which they may purchase shares through the over-allotment option. If the underwriters sell more shares than could be
covered by the over-allotment option, a naked short position, the position can only be closed out by buying shares in the open market. A naked short position is more likely to be created
if the underwriters are concerned that there could be downward pressure on the price of the shares in the open market after pricing that could adversely affect investors who purchase in the
offering.
- •
- Penalty bids permit the representatives to reclaim a selling concession from a syndicate member when the common stock originally sold by the syndicate member is purchased in a stabilizing or syndicate covering transaction to cover syndicate short positions.
These stabilizing transactions, syndicate covering transactions and penalty bids may have the effect of raising or maintaining the market price of our common stock or preventing or retarding a decline in the market price of the common stock. As a result the price of our common stock may be higher than
142
the price that might otherwise exist in the open market. These transactions may be effected on the NYSE or otherwise and, if commenced, may be discontinued at any time.
A prospectus in electronic format will be made available on the web sites maintained by one or more of the underwriters, or selling group members, if any, participating in this offering and one or more of the underwriters participating in this offering may distribute prospectuses electronically.
European Economic Area
In relation to each Member State of the European Economic Area that has implemented the Prospectus Directive, each, a Relevant Member State, each underwriter represents and agrees that with effect from and including the date on which the Prospectus Directive is implemented in that Relevant Member State, or the Relevant Implementation Date, it has not made and will not make an offer of our common stock to the public in that Relevant Member State prior to the publication of a prospectus in relation to our common stock that has been approved by the competent authority in that Relevant Member State or, where appropriate, approved in another Relevant Member State and notified to the competent authority in that Relevant Member State, all in accordance with the Prospectus Directive, except that it may, with effect from and including the Relevant Implementation Date, make an offer of our common stock to the public in that Relevant Member State at any time:
- •
- to any legal entity which is a qualified investor as defined in the Prospectus Directive;
- •
- to fewer than 100 or, if the Relevant Member State has implemented the relevant provision of the PD Amending Directive,
150, natural or legal persons (other than qualified investors as defined in the Prospectus Directive) subject to obtaining the prior consent of the manager for any such offer; or
- •
- in any other circumstances falling within Article 3(2) of the Prospectus Directive, provided that no such offer of our common stock shall require the publication by the Issuer or any underwriter of a prospectus pursuant to Article 3 of the Prospectus Directive.
For the purposes of this provision, the expression an "offer to the public" in relation to any shares of our common stock in any Relevant Member State means the communication in any form and by any means of sufficient information on the terms of the offer and our common stock to be offered so as to enable an investor to decide to purchase or subscribe our common stock, as the same may be varied in that Relevant Member State by any measure implementing the Prospectus Directive in that Member State and the expression Prospectus Directive means Directive 2003/71/EC and (and amendments thereto, including Directive 2010/73/EU, to the extent implemented in each Relevant Member State) includes any relevant implementing measure in each Relevant Member State.
Notice to Investors in the United Kingdom
Each underwriter:
- •
- has only communicated or caused to be communicated and will only communicate or cause to be communicated any invitation or
inducement to engage in investment activity (within the meaning of section 21 of FSMA) in connection with the sale or issue of common stock in circumstances in which section 21 of FSMA
does not apply to such underwriter; and
- •
- has complied with, and will comply with all applicable provisions of FSMA with respect to anything done by it in relation to the shares of common stock in, from or otherwise involving the United Kingdom.
This prospectus is directed solely at persons who (i) are outside the United Kingdom or (ii) have professional experience in matters relating to investments or (iii) are persons falling within Article 49(2)(a) to (d) of The Financial Services and Markets Act (Financial Promotion) Order 2005 (all such persons together being referred to as "relevant persons"). This prospectus must not be acted on or relied on by persons who are not relevant persons. Any investment or investment activity to which this prospectus relates is available only to relevant persons and will be engaged in with relevant persons only.
143
Resale Restrictions
The distribution of the shares of common stock in Canada is being made only on a private placement basis exempt from the requirement that we prepare and file a prospectus with the securities regulatory authorities in each province where trades of the shares of common stock are made. Any resale of the shares of common stock in Canada must be made under applicable securities laws which will vary depending on the relevant jurisdiction, and which may require resales to be made under available statutory exemptions or under a discretionary exemption granted by the applicable Canadian securities regulatory authority. Purchasers are advised to seek legal advice prior to any resale of the shares of common stock.
THE SECURITIES ARE NOT BEING OFFERED AND MAY NOT BE SOLD TO ANY PURCHASER IN A PROVINCE OR TERRITORY OF CANADA OTHER THAN THE PROVINCES OF ONTARIO AND QUEBEC.
Representations of Purchasers
By purchasing the shares of common stock in Canada and accepting a purchase confirmation, a purchaser is representing to us and the dealer from whom the purchase confirmation is received that:
- •
- the purchaser is resident in either the Province of Ontario or Quebec, and is not acquiring the shares of common stock for
the account or benefit of any individual or entity that is resident in any province or territory of Canada other than the Province of Ontario or Quebec,
- •
- the purchaser is entitled under applicable provincial securities laws to purchase the shares of common stock without the
benefit of a prospectus qualified under those securities laws as it is an "accredited investor" as defined under National
Instrument 45-106—Prospectus and Registration Exemptions,
- •
- the purchaser is a "Canadian permitted client" as defined in National
Instrument 31-103—Registration Requirements, Exemptions and Ongoing Registrant Obligations, or as otherwise interpreted
and applied by the Canadian Securities Administrators,
- •
- where required by law, the purchaser is purchasing as principal and not as agent,
- •
- the purchaser has reviewed the text above under "Resale Restrictions,"
and
- •
- the purchaser acknowledges and consents to the provision of specified information concerning the purchase of the shares of common stock to the regulatory authority that by law is entitled to collect the information, including certain personal information. For purchasers in Ontario, questions about such indirect collection of personal information should be directed to Administrative Support Clerk, Ontario Securities Commission, Suite 1903, Box 55, 20 Queen Street West, Toronto, Ontario M5H 3S8 or to (416) 593-3684.
Rights of Action — Ontario Purchasers Only
Under Ontario securities legislation, certain purchasers who purchase a security offered by this prospectus during the period of distribution will have a statutory right of action for damages, or while still the owner of the shares of common stock, for rescission against us in the event that this prospectus contains a misrepresentation without regard to whether the purchaser relied on the misrepresentation. The right of action for damages is exercisable not later than the earlier of 180 days from the date the purchaser first had knowledge of the facts giving rise to the cause of action and three years from the date on which payment is made for the shares of common stock. The right of action for rescission is exercisable not later than 180 days from the date on which payment is made for the shares of common
144
stock. If a purchaser elects to exercise the right of action for rescission, the purchaser will have no right of action for damages against us. In no case will the amount recoverable in any action exceed the price at which the shares of common stock were offered to the purchaser and if the purchaser is shown to have purchased the securities with knowledge of the misrepresentation, we will have no liability. In the case of an action for damages, we will not be liable for all or any portion of the damages that are proven to not represent the depreciation in value of the shares of common stock as a result of the misrepresentation relied upon. These rights are in addition to, and without derogation from, any other rights or remedies available at law to an Ontario purchaser. The foregoing is a summary of the rights available to an Ontario purchaser. Ontario purchasers should refer to the complete text of the relevant statutory provisions.
Enforcement of Legal Rights
All of our directors and officers as well as the experts named herein may be located outside of Canada and, as a result, it may not be possible for Canadian purchasers to effect service of process within Canada upon us or those persons. All or a substantial portion of our assets and the assets of those persons may be located outside of Canada and, as a result, it may not be possible to satisfy a judgment against us or those persons in Canada or to enforce a judgment obtained in Canadian courts against us or those persons outside of Canada.
Taxation and Eligibility for Investment
Canadian purchasers of the shares of common stock should consult their own legal and tax advisors with respect to the tax consequences of an investment in the shares of common stock in their particular circumstances and about the eligibility of the investment by the purchaser under relevant Canadian legislation.
Notice to Clients of Jefferies LLC ("Jefferies")
With respect to Jefferies please note the following for the purposes of the international dealer exemption that is available to broker-dealers registered in a foreign jurisdiction pursuant to section 8.18(2) of NI 31-103:
- 1.
- Jefferies
is not registered as a securities dealer in any province or territory of Canada.
- 2.
- Jefferies'
head office and principal place of business is located in the State of New York, USA.
- 3.
- All
or substantially all of the assets of Jefferies may be situated outside of Canada.
- 4.
- There
may be difficulty enforcing legal rights against Jefferies because of the above.
- 5.
- Jefferies' agents for service of legal proceedings in the provinces of Ontario and Québec are:
Ontario
Cartan Limited
Suite 5300
Toronto Dominion Bank Tower
Toronto ON M5K 1E6
Attn: Andrew Parker
Québec
McCarthy Tétrault LLP
Bureau 2500
1000, rue De La Gauchetière Ouest
Montréal QC H3B 0A2
Attn: Sonia J. Struthers
145
The validity of the shares of common stock being offered by this prospectus will be passed upon for us by Cooley LLP, New York, New York. Wilson Sonsini Goodrich & Rosati, Professional Corporation, New York, New York is representing the underwriters.
The consolidated financial statements of Tremor Video, Inc. at December 31, 2011 and 2012, and for each of the two years in the period ended December 31, 2012, appearing in this prospectus and registration statement have been audited by Ernst & Young LLP, independent registered public accounting firm, as set forth in their report thereon appearing elsewhere herein, and are included in reliance upon such report given on the authority of such firm as experts in accounting and auditing.
CHANGE IN INDEPENDENT REGISTERED PUBLIC ACCOUNTING FIRM
On April 2, 2012, our Board of Directors dismissed PricewaterhouseCoopers LLP as our independent registered public accounting firm and approved the appointment of Ernst & Young LLP as our independent registered public accounting firm commencing with work to be performed in relation to our audit for the year ended December 31, 2011.
PricewaterhouseCoopers LLP's reports on our financial statements for each of the years ended December 31, 2009 and 2010 (not presented herein) did not contain an adverse opinion or disclaimer of opinion and were not qualified or modified as to uncertainty, audit scope or accounting principle.
During the years ended December 31, 2010 and 2011 and the interim period through April 2, 2012, there were no disagreements with PricewaterhouseCoopers LLP on any matter of accounting principles or practices, financial statement disclosure or auditing scope or procedure, which disagreements, if not resolved to the satisfaction of PricewaterhouseCoopers LLP, would have caused them to make reference to such disagreements in their reports on our financial statements for such years. In addition, during the years ended December 31, 2010 and 2011 and the interim period through April 2, 2012, there were no reportable events of the type listed in paragraphs (A) through (D) of Item 304 (a)(1)(v) of Regulation S-K.
We have provided PricewaterhouseCoopers LLP with a copy of the foregoing disclosure and have requested that PricewaterhouseCoopers LLP furnish us with a letter addressed to the SEC stating whether or not PricewaterhouseCoopers LLP agrees with the above statements and, if not, stating the respects in which it does not agree. A copy of the letter from PricewaterhouseCoopers LLP is filed as an exhibit to the registration statement of which this prospectus is a part.
WHERE YOU CAN FIND ADDITIONAL INFORMATION
We have filed with the SEC a registration statement on Form S-1 under the Securities Act, with respect to the shares of common stock being offered by this prospectus, which constitutes a part of the registration statement. This prospectus, which constitutes part of the registration statement, does not contain all of the information in the registration statement and its exhibits. For further information with respect to us and the common stock offered by this prospectus, we refer you to the registration statement and its exhibits. Statements contained in this prospectus as to the contents of any contract or any other document referred to are not necessarily complete, and in each instance, we refer you to the copy of the contract or other document filed as an exhibit to the registration statement. Each of these statements is qualified in all respects by this reference.
You can read our SEC filings, including the registration statement, over the internet at the SEC's website at www.sec.gov. You may also read and copy any document we file with the SEC at its public reference facilities at 100 F Street, N.E., Washington, D.C. 20549. You may also obtain copies of these
146
documents at prescribed rates by writing to the Public Reference Section of the SEC at 100 F Street, N.E., Washington, D.C. 20549. Please call the SEC at 1-800-SEC-0330 for further information on the operation of the public reference facilities.
Upon completion of this offering, we will be subject to the information reporting requirements of the Exchange Act, and we will file reports, proxy statements and other information with the SEC. These reports, proxy statements and other information will be available for inspection and copying at the public reference room and web site of the SEC referred to above. We also maintain a website at www.tremorvideo.com, at which you may access these materials free of charge as soon as reasonably practicable after they are electronically filed with, or furnished to, the SEC. However, the information contained in or accessible through our website is not part of this prospectus or the registration statement of which this prospectus forms a part, and investors should not rely on such information in making a decision to purchase our common stock in this offering.
147
TREMOR VIDEO, INC.
INDEX TO CONSOLIDATED FINANCIAL STATEMENTS
F-1
Report of Independent Registered Public Accounting Firm
The
Board of Directors and Stockholders
Tremor Video, Inc.
We have audited the accompanying consolidated balance sheets of Tremor Video, Inc. (the Company) as of December 31, 2011 and 2012, and the related consolidated statements of operations, comprehensive loss, mandatorily redeemable convertible preferred stock and changes in stockholders' deficit and cash flows for each of the two years in the period ended December 31, 2012. These financial statements are the responsibility of the Company's management. Our responsibility is to express an opinion on these financial statements based on our audits.
We conducted our audits in accordance with the standards of the Public Company Accounting Oversight Board (United States). Those standards require that we plan and perform the audit to obtain reasonable assurance about whether the financial statements are free of material misstatement. We were not engaged to perform an audit of the Company's internal control over financial reporting. Our audits included consideration of internal control over financial reporting as a basis for designing audit procedures that are appropriate in the circumstances, but not for the purpose of expressing an opinion on the effectiveness of the Company's internal control over financial reporting. Accordingly, we express no such opinion. An audit also includes examining, on a test basis, evidence supporting the amounts and disclosures in the financial statements, assessing the accounting principles used and significant estimates made by management, and evaluating the overall financial statement presentation. We believe that our audits provide a reasonable basis for our opinion.
In our opinion, the financial statements referred to above present fairly, in all material respects, the consolidated financial position of Tremor Video, Inc. at December 31, 2011 and 2012, and the consolidated results of its operations and its cash flows for each of the two years in the period ended December 31, 2012, in conformity with U.S. generally accepted accounting principles.
/S/ ERNST & YOUNG LLP |
New York, New York
April 3, 2013, except for Note 17,
as to which the date is June 13, 2013
F-2
Tremor Video, Inc.
Consolidated Balance Sheets
(in thousands, except share and per share data)
| |
December 31, | March 31, | Pro Forma March 31, |
||||||||||
|---|---|---|---|---|---|---|---|---|---|---|---|---|---|
| |
2011 | 2012 | 2013 | 2013 | |||||||||
| |
|
|
(unaudited) |
||||||||||
Assets |
|||||||||||||
Current assets: |
|||||||||||||
Cash and cash equivalents |
$ | 31,714 | $ | 32,533 | $ | 31,533 | $ | 31,533 | |||||
Short-term investments |
8,652 | — | — | — | |||||||||
Restricted cash, short-term |
36 | 21 | 621 | 621 | |||||||||
Accounts receivable, net of allowance for doubtful accounts of $980, $1,050 and $1,075 as of December 31, 2011 and 2012, and March 31, 2013, respectively |
33,839 | 36,011 | 30,363 | 30,363 | |||||||||
Prepaid expenses and other current assets |
739 | 953 | 1,389 | 1,389 | |||||||||
Total current assets |
74,980 | 69,518 | 63,906 | 63,906 | |||||||||
Long-term assets: |
|||||||||||||
Restricted cash, long-term |
1,221 | 1,200 | 600 | 600 | |||||||||
Property and equipment, net of accumulated depreciation of $2,416, $3,077 and $3,359 as of December 31, 2011 and 2012, and March 31, 2013, respectively |
1,943 | 1,995 | 1,850 | 1,850 | |||||||||
Intangible assets, net of accumulated amortization of $5,427, $10,315 and $11,535 as of December 31, 2011 and 2012, and March 31, 2013, respectively |
29,023 | 25,385 | 24,165 | 24,165 | |||||||||
Goodwill |
28,984 | 29,719 | 29,719 | 29,719 | |||||||||
Deferred tax assets, long-term |
1,752 | 1,695 | 1,695 | 1,695 | |||||||||
Other long-term assets |
77 | 211 | 261 | 261 | |||||||||
Total long-term assets |
63,000 | 60,205 | 58,290 | 58,290 | |||||||||
Total assets |
$ | 137,980 | $ | 129,723 | $ | 122,196 | $ | 122,196 | |||||
Liabilities, mandatorily redeemable securities and stockholders' (deficit) equity |
|||||||||||||
Current liabilities: |
|||||||||||||
Accounts payable and accrued expenses |
$ | 16,288 | $ | 21,075 | $ | 17,797 | $ | 17,797 | |||||
Deferred rent and security deposits payable |
461 | 627 | 660 | 660 | |||||||||
Contingent consideration on acquisition |
817 | — | — | — | |||||||||
Deferred revenue |
35 | 210 | 401 | 401 | |||||||||
Deferred tax liabilities, short-term |
1,752 | 1,695 | 1,695 | 1,695 | |||||||||
Amount outstanding under credit facility and accrued interest expenses |
6,026 | 6,019 | 6,019 | 6,019 | |||||||||
Total current liabilities |
25,379 | 29,626 | 26,572 | 26,572 | |||||||||
Warrants for purchase of mandatorily redeemable convertible preferred stock |
1,127 | 1,103 | 1,098 | — | |||||||||
Total liabilities |
26,506 | 30,729 | 27,670 | 26,572 | |||||||||
Commitments and contingent liabilities |
|||||||||||||
Mandatorily redeemable convertible preferred stock |
162,082 | 162,466 | 162,561 | — | |||||||||
Stockholders' (deficit) equity: |
|||||||||||||
Share capital— |
|||||||||||||
Common stock, $0.0001 par value: 50,000,000 shares authorized, 6,166,059, 6,674,905 and 6,703,431 issued and outstanding as of December 31, 2011 and 2012 and March 31, 2013 (unaudited); 250,000,000 shares authorized, 40,998,103 shares issued and outstanding as of March 31, 2013, pro forma (unaudited) |
1 | 1 | 1 | 4 | |||||||||
Series II common stock, $0.0001 par value: 2,333,333 shares authorized, 1,017,182, 1,047,357, and 1,047,357 shares issued and outstanding as of December 31, 2011 and 2012 and March 31, 2013, respectively; no shares authorized, issued and outstanding as of March 31, 2013, pro forma (unaudited) |
— | — | — | — | |||||||||
Additional paid-in capital |
13,921 | 17,752 | 18,442 | 190,250 | |||||||||
Accumulated other comprehensive income |
396 | 345 | 251 | 251 | |||||||||
Accumulated deficit |
(64,926 | ) | (81,570 | ) | (86,729 | ) | (94,881 | ) | |||||
Total stockholders' (deficit) equity |
(50,608 | ) | (63,472 | ) | (68,035 | ) | 95,624 | ||||||
Total liabilities and stockholders' (deficit) equity |
$ | 137,980 | $ | 129,723 | $ | 122,196 | $ | 122,196 | |||||
The accompanying notes are an integral part of these consolidated financial statements.
F-3
Tremor Video, Inc.
Consolidated Statements of Operations
(in thousands, except share and per share data)
| |
Year Ended December 31, | Three Months Ended March 31, |
|||||||||||
|---|---|---|---|---|---|---|---|---|---|---|---|---|---|
| |
2011 | 2012 | 2012 | 2013 | |||||||||
| |
|
|
(unaudited) |
||||||||||
Revenue |
$ | 90,301 | $ | 105,190 | $ | 17,272 | $ | 24,765 | |||||
Cost of revenue |
58,502 | 61,317 | 11,769 | 13,841 | |||||||||
Gross profit |
31,799 | 43,873 | 5,503 | 10,924 | |||||||||
Operating expenses: |
|||||||||||||
Technology and development |
5,900 | 8,144 | 1,651 | 2,697 | |||||||||
Sales and marketing |
28,829 | 35,042 | 8,522 | 8,843 | |||||||||
General and administrative |
10,880 | 10,824 | 2,795 | 2,920 | |||||||||
Depreciation and amortization |
6,088 | 5,992 | 1,478 | 1,502 | |||||||||
Total operating expenses |
51,697 | 60,002 | 14,446 | 15,962 | |||||||||
Loss from operations |
(19,898 | ) | (16,129 | ) | (8,943 | ) | (5,038 | ) | |||||
Interest and other expense: |
|||||||||||||
Interest expense |
(321 | ) | (227 | ) | (75 | ) | (56 | ) | |||||
Other (expense) income |
(583 | ) | (8 | ) | (39 | ) | 5 | ||||||
Total interest and other expense, net |
(904 | ) | (235 | ) | (114 | ) | (51 | ) | |||||
Loss before income taxes |
(20,802 | ) | (16,364 | ) | (9,057 | ) | (5,089 | ) | |||||
Income tax expense |
(223 | ) | (280 | ) | (70 | ) | (70 | ) | |||||
Net loss |
$ | (21,025 | ) | $ | (16,644 | ) | $ | (9,127 | ) | $ | (5,159 | ) | |
Net loss per share: |
|||||||||||||
Basic and diluted |
$ | (3.02 | ) | $ | (2.22 | ) | $ | (1.25 | ) | $ | (0.67 | ) | |
Weighted average number of shares of common stock outstanding: |
|||||||||||||
Basic and diluted |
6,952,952 | 7,499,986 | 7,318,320 | 7,729,218 | |||||||||
Pro forma net loss per share (unaudited): |
|||||||||||||
Basic and diluted |
$ | (0.61 | ) | $ | (0.32 | ) | |||||||
Pro forma weighted average number of shares of common stock outstanding (unaudited): |
|||||||||||||
Basic and diluted |
40,747,301 | 40,976,533 | |||||||||||
The accompanying notes are an integral part of these consolidated financial statements.
F-4
Tremor Video, Inc.
Consolidated Statements of Comprehensive Loss
(in thousands, except share and per share data)
| |
Year Ended December 31, | Three Months Ended March 31, |
|||||||||||
|---|---|---|---|---|---|---|---|---|---|---|---|---|---|
| |
2011 | 2012 | 2012 | 2013 | |||||||||
| |
|
|
(unaudited) |
||||||||||
Net loss |
$ | (21,025 | ) | $ | (16,644 | ) | $ | (9,127 | ) | $ | (5,159 | ) | |
Other comprehensive loss |
|||||||||||||
Change in unrealized (loss) gain during the year on short-term investments available for sale |
(12 | ) | 7 | 7 | — | ||||||||
Foreign currency translation adjustments |
177 | (58 | ) | 59 | (94 | ) | |||||||
Comprehensive loss |
$ | (20,860 | ) | $ | (16,695 | ) | $ | (9,061 | ) | $ | (5,253 | ) | |
The accompanying notes are an integral part of these consolidated financial statements.
F-5
Tremor Video, Inc.
Consolidated Statements of Mandatorily Redeemable Convertible Preferred Stock
and Changes in Stockholders' Deficit
(in thousands, except share
and per share data)
| |
|
|
|
|
|
|
|
|
|
||||||||||||||||||
|---|---|---|---|---|---|---|---|---|---|---|---|---|---|---|---|---|---|---|---|---|---|---|---|---|---|---|---|
| |
Preferred Stock(1)(3) | |
Common Stock(2)(4) | |
Accumulated Other Comprehensive Income |
|
|
||||||||||||||||||||
| |
|
Additional Paid-in Capital |
Accumulated Loss |
Total Stockholders' Deficit |
|||||||||||||||||||||||
| |
Share | Amount | Share | Amount | |||||||||||||||||||||||
Balance as of December 31, 2010 |
28,598,066 | $ | 126,199 | 6,075,557 | $ | 1 | $ | 8,029 | $ | 231 | ($ | 43,832 | ) | ($ | 35,571 | ) | |||||||||||
Issuance of preferred stock, net of issuance expenses $1,321 |
3,965,126 | 35,679 | — | — | — | — | — | — | |||||||||||||||||||
Accretion of issuance costs |
— | 204 | — | — | (204 | ) | — | — | (204 | ) | |||||||||||||||||
Exercise of stock options |
— | — | 451,452 | — | 344 | — | — | 344 | |||||||||||||||||||
Stock-based compensation |
— | — | — | — | 2,883 | — | — | 2,883 | |||||||||||||||||||
Repurchase and retirement of common stock |
— | — | (18,847 | ) | — | (14 | ) | — | (69 | ) | (83 | ) | |||||||||||||||
Common stock issued in the acquisition of ScanScout, Inc. |
— | — | 650 | — | — | — | — | — | |||||||||||||||||||
Common stock issued in the acquisition of Transpera, Inc. |
— | — | 674,429 | — | 2,883 | — | — | 2,883 | |||||||||||||||||||
Net loss |
— | — | — | — | — | — | (21,025 | ) | (21,025 | ) | |||||||||||||||||
Change in unrealized loss on short-term investments |
— | — | — | — | — | (12 | ) | — | (12 | ) | |||||||||||||||||
Foreign currency translation adjustment |
— | — | — | — | — | 177 | — | 177 | |||||||||||||||||||
Balance as of December 31, 2011 |
32,563,192 | 162,082 | 7,183,241 | 1 | 13,921 | 396 | (64,926 | ) | (50,608 | ) | |||||||||||||||||
Accretion of issuance costs |
— | 384 | — | — | (384 | ) | — | — | (384 | ) | |||||||||||||||||
Exercise of stock options |
— | — | 369,890 | — | 433 | — | — | 433 | |||||||||||||||||||
Stock-based compensation |
— | — | — | — | 2,919 | — | — | 2,919 | |||||||||||||||||||
Common stock issued in the acquisition of Transpera, Inc. |
— | — | 169,131 | — | 863 | — | — | 863 | |||||||||||||||||||
Net loss |
— | — | — | — | — | — | (16,644 | ) | (16,644 | ) | |||||||||||||||||
Change in unrealized gain on short-term investments |
— | — | — | — | — | 7 | — | 7 | |||||||||||||||||||
Foreign currency translation adjustment |
— | — | — | — | — | (58 | ) | — | (58 | ) | |||||||||||||||||
Balance as of December 31, 2012 |
32,563,192 | 162,466 | 7,722,262 | 1 | 17,752 | 345 | (81,570 | ) | (63,472 | ) | |||||||||||||||||
Accretion of issuance costs (unaudited) |
— | 95 | — | — | (95 | ) | — | — | (95 | ) | |||||||||||||||||
Exercise of stock options (unaudited) |
— | — | 28,526 | — | 46 | — | — | 46 | |||||||||||||||||||
Stock-based compensation (unaudited) |
— | — | — | — | 739 | — | — | 739 | |||||||||||||||||||
Net loss (unaudited) |
— | — | — | — | — | — | (5,159 | ) | (5,159 | ) | |||||||||||||||||
Foreign currency translation adjustment (unaudited) |
— | — | — | — | — | (94 | ) | — | (94 | ) | |||||||||||||||||
Balance as of March 31, 2013 (unaudited) |
32,563,192 | $ | 162,561 | 7,750,788 | $ | 1 | $ | 18,442 | $ | 251 | $ | (86,729 | ) | $ | (68,035 | ) | |||||||||||
- (1)
- The
Preferred Stock includes several series of Preferred Stock, see note 11.
- (2)
- The
Common Stock includes two series of Common Stock, see note 11.
- (3)
- All
share amounts have been restated to reflect a 1-for-1.5 reverse stock split, see note 17.
- (4)
- All share amounts have been restated to reflect the renaming of the Company's "Series I Common Stock" to "Common Stock" and a 1-for-1.5 reverse stock split, see note 17.
The accompanying notes are an integral part of these consolidated financial statements.
F-6
Tremor Video, Inc.
Consolidated Statements of Cash Flows
(in thousands, except share and per share data)
| |
Year Ended December 31, |
Three Months Ended March 31, |
|||||||||||
|---|---|---|---|---|---|---|---|---|---|---|---|---|---|
| |
2011 | 2012 | 2012 | 2013 | |||||||||
| |
|
|
(unaudited) |
||||||||||
Cash flows from operating activities |
|||||||||||||
Net loss |
$ | (21,025 | ) | $ | (16,644 | ) | $ | (9,127 | ) | $ | (5,159 | ) | |
Adjustments required to reconcile net loss to net cash (used in) provided by operating activities: |
|||||||||||||
Depreciation and amortization of property and equipment |
956 | 1,104 | 246 | 282 | |||||||||
Amortization of intangibles |
5,132 | 4,888 | 1,232 | 1,220 | |||||||||
Amortization of deferred financing costs |
2 | — | — | — | |||||||||
Amortization of original issuance discount |
9 | — | — | — | |||||||||
Bad debt expense |
(29 | ) | 70 | (2 | ) | 25 | |||||||
Mark-to-market expense |
373 | 22 | 40 | (5 | ) | ||||||||
Stock-based compensation expense |
2,883 | 2,919 | 800 | 739 | |||||||||
Change in unrealized (loss) gain on short-term investments |
(12 | ) | 7 | 7 | — | ||||||||
Net changes in operating assets and liabilities: |
|||||||||||||
(Increase) decrease in accounts receivable |
(4,430 | ) | (2,242 | ) | 12,691 | 5,623 | |||||||
(Increase) decrease in prepaid expenses and other current assets and other long-term assets |
(17 | ) | (355 | ) | 63 | (486 | ) | ||||||
(Decrease) increase in accounts payable and accrued expenses |
(3,135 | ) | 4,787 | (2,214 | ) | (3,278 | ) | ||||||
Increase in deferred rent and security deposits payable |
461 | 166 | 32 | 33 | |||||||||
Increase (decrease) in deferred revenue |
35 | 175 | (28 | ) | 191 | ||||||||
Net cash (used in) provided by operating activities |
(18,797 | ) | (5,103 | ) | 3,740 | (815 | ) | ||||||
Cash flows from investing activities |
|||||||||||||
Purchase of property and equipment |
(733 | ) | (1,156 | ) | (159 | ) | (137 | ) | |||||
Maturities of short-term investments |
11,791 | 8,652 | 5,403 | — | |||||||||
Purchases of short-term investments |
(12,267 | ) | — | — | — | ||||||||
Change in restricted cash |
— | 36 | — | — | |||||||||
Purchase of domain name |
— | (50 | ) | — | — | ||||||||
Acquisition of InPlay |
— | (1,950 | ) | (1,600 | ) | — | |||||||
Acquisition of Transpera, Inc., net of cash acquired |
12 | 15 | 15 | — | |||||||||
Net cash (used in) provided by investing activities |
(1,197 | ) | 5,547 | 3,659 | (137 | ) | |||||||
Cash flows from financing activities |
|||||||||||||
Issuance of preferred stock, net of issuance expenses $1,321 |
35,679 | — | — | — | |||||||||
Repurchase and retirement of common stock |
(83 | ) | — | — | — | ||||||||
Proceeds from the exercise of stock options |
344 | 433 | 44 | 46 | |||||||||
Net cash provided by financing activities |
35,940 | 433 | 44 | 46 | |||||||||
Increase (decrease) in cash and cash equivalents |
15,946 | 877 | 7,443 | (906 | ) | ||||||||
Effect of exchange rate changes in cash and cash equivalents |
177 | (58 | ) | 59 | (94 | ) | |||||||
Cash and cash equivalents at beginning of year |
15,591 | 31,714 | 31,714 | 32,533 | |||||||||
Cash and cash equivalents at end of year |
$ | 31,714 | $ | 32,533 | $ | 39,216 | $ | 31,533 | |||||
Supplemental disclosure of cash flow activities |
|||||||||||||
Cash paid for income taxes |
$ | 310 | $ | 249 | $ | 101 | $ | 159 | |||||
Cash paid for interest |
$ | 323 | $ | 234 | $ | 76 | $ | 56 | |||||
Supplemental disclosure of non-cash investing activities |
|||||||||||||
Common stock issued in the acquisition of Transpera, Inc. |
$ | 2,883 | $ | 863 | $ | 863 | $ | — | |||||
The accompanying notes are an integral part of these consolidated financial statements.
F-7
Tremor Video, Inc.
Notes to Consolidated Financial Statements
(in thousands, except share and per share
data)
Year Ended December 31, 2011 and 2012 and
Three Months Ended March 31, 2012 and 2013 (unaudited)
1. Organization and Description of Business
Tremor Video, Inc. (the Company) was originally organized as Tremor Media, LLC in November 2005 and converted into a corporation named "Tremor Media, Inc." under the laws of the State of Delaware in September 2006. The Company changed its name to Tremor Video, Inc. in June 2011. The Company is a provider of technology-driven video advertising solutions enabling brand advertisers to engage consumers across multiple internet-connected devices, including computers, smartphones, tablets and connected TVs. Through its Tremor Video Network, the Company offers advertisers access to premium and often exclusive streaming video inventory and advanced real-time optimization capabilities at scale across multiple internet-connected devices in brand safe environments. In addition, through its VideoHub for Advertisers (VHA) solution, the Company provides advanced video analytic capabilities for advertisers to measure, verify and evaluate the performance of their video ad campaigns across multiple channels, both within and outside of its Tremor Video Network.
On December 8, 2010, the Company acquired ScanScout, Inc. (ScanScout) an online video advertising network and the developer of the Company's video analysis and optimization technology, which is referred to as VideoHub. On February 11, 2011, the Company acquired all of the outstanding stock of Transpera, Inc. (Transpera), a technology platform that enables video advertising formats to be served on mobile devices, such as phones and tablets. On January 17, 2012, the Company acquired the assets for the InPlay video management platform (InPlay) from Tube Mogul, Inc., which enables publishers of online video content to manage and analyze the performance of advertisements displayed within their inventory of video content.
The Company is headquartered in the State of New York.
2. Summary of Significant Accounting Policies
Accounting Principles
The Company's financial statements are prepared in accordance with generally accepted accounting principles in the United States of America (US GAAP).
Basis of Consolidation
The consolidated financial statements include the accounts of Tremor Video, Inc. and its wholly-owned subsidiaries, Tremor Video Canada, Inc., Tremor Video GmbH (and its wholly-owned subsidiary Tremor Video Ltd. (UK Company)), Transpera and ScanScout (and its wholly-owned subsidiary Tremor Video Pte. Ltd.), which were incorporated or acquired on July 2, 2008, July 22, 2008, May 7, 2008, February 11, 2011 and December 8, 2010, respectively. The operating results of Transpera have been included in the consolidated financial statements since the acquisition date of February 11, 2011. All significant inter-company transactions and balances have been eliminated in consolidation.
During November 2012, the Company ceased operations of Tremor Video GmbH. The consolidated operating results include Tremor Video GmbH operations through the date operations ceased.
F-8
Tremor Video, Inc.
Notes to Consolidated Financial Statements (Continued)
(in thousands, except share and per share data)
2. Summary of Significant Accounting Policies (Continued)
Use of Estimates
The preparation of the consolidated financial statements in conformity with US GAAP requires management to make estimates, judgments and assumptions. The Company's management believes that the estimates, judgments and assumptions used are reasonable based upon information available at the time they are made. These estimates, judgments and assumptions can affect the reported amounts of assets and liabilities and disclosure of contingent assets and liabilities at the dates of the financial statements, and the reported amounts of revenue and expenses during the reporting period. Actual results could differ from those estimates. On an ongoing basis, the Company's management evaluates estimates, including those related to fair values and useful lives of intangible assets, fair values of stock-based awards, income taxes, and contingent liabilities. Such estimates are based on historical experience and on various other assumptions that are believed to be reasonable, the results of which form the basis for making judgments about the carrying values of assets and liabilities.
Unaudited Interim Financial Information
The accompanying interim consolidated balance sheet as of March 31, 2013, and the related consolidated statements of operations, comprehensive loss, mandatorily redeemable convertible preferred stock and changes in stockholders' deficit, cash flows and the notes to consolidated financial statements for the three months ended March 31, 2012 and 2013 are unaudited. These unaudited consolidated financial statements have been prepared on the same basis as the audited financial statements. The unaudited consolidated financial statements includes, in the opinion of management, all adjustments, consisting only of normal recurring adjustments that are necessary for a fair presentation of the Company's financial position at March 31, 2013, results of operations and cash flows for the three months ended March 31, 2012 and 2013. The consolidated results of operations of any interim period are not necessarily indicative of the results of operations to be expected for the full year due to seasonal and other factors.
Unaudited Pro Forma Presentation
The Company has filed a Registration Statement on Form S-1 with the United States Securities and Exchange Commission (the SEC) for the proposed initial public offering of shares of its common stock (the IPO), assuming an IPO price of $12.00 per share. If consummated, all of the mandatorily redeemable convertible preferred stock outstanding will automatically convert into 33,247,315 shares of common stock based on the shares of mandatorily redeemable convertible preferred stock outstanding as of March 31, 2013. In addition, the outstanding warrants to purchase mandatorily redeemable convertible preferred stock will automatically convert into warrants to purchase common stock and the preferred stock warrant liability of $1,098 as of March 31, 2013 will be reclassified to additional paid-in capital. Unaudited pro forma stockholders' equity, to adjust the assumed conversion of the mandatorily redeemable convertible preferred stock and the reclassification of the warrants outstanding, is set forth on the unaudited March 31, 2013 pro forma balance sheet.
The unaudited pro forma net loss per share for the year ended December 31, 2012 and interim period ended March 31, 2013 assumes (i) the conversion of all outstanding shares of mandatorily redeemable convertible preferred stock into an aggregate of 33,247,315 shares of common stock upon the completion of the Company's initial public offering as of January 1, 2012 and January 1, 2013, respectively and (ii) the conversion of the warrants to common stock warrants as of January 1, 2012 and January 1, 2013. The amounts recorded to reflect the deemed dividend on the Series F preferred
F-9
Tremor Video, Inc.
Notes to Consolidated Financial Statements (Continued)
(in thousands, except share and per share data)
2. Summary of Significant Accounting Policies (Continued)
stock and to adjust the warrants to fair value have been added back to net loss to arrive at pro forma net loss.
The Company believes that the unaudited pro forma balance sheet and unaudited pro forma net loss per share provides material information to investors, as the conversion of the Company's mandatorily redeemable convertible preferred stock to common stock and the conversion of the warrants to common stock warrants is expected to occur upon the closing of a qualified initial public offering, and therefore the disclosure of pro forma stockholders' equity and pro forma net loss per share provides measures of equity and net loss per share that are comparable to what will be reported by the Company as a public company.
Cash and Cash Equivalents
The Company considers cash deposits and all highly liquid investments with a maturity of three months or less to be cash equivalents. The fair value of the Company's cash and cash equivalents approximates their cost plus accrued interest because of the short-term nature of the instruments. The Company's cash deposits are held at multiple high-credit-quality financial institutions. The Company's cash deposits at these institutions often exceeded federally insured limits.
Short-Term Investments
The Company accounts for short-term investments in accordance with Accounting Standards Codification (ASC) 320, "Investments—Debt and Equity Securities." Management determines the appropriate classification of its investments in debt securities at the time of purchase and re-evaluates such determinations at each balance sheet date.
The Company classifies its short-term investments in marketable securities as available-for-sale at the time of purchase and re-evaluates such classifications at each balance sheet date. All short-term investments are carried at fair value. Unrealized gains and losses associated with available-for-sale securities are recorded as a component of accumulated other comprehensive income within equity. Realized gains and losses, if any, are recorded in the consolidated statements of operations. If the Company intends to sell or if it is more likely than not that it will be required to sell an impaired security prior to recovery of its cost basis, then the full amount of impairment will be charged to earnings.
At December 31, 2011, short-term investments represented investments in U.S. Government and agency securities, high quality corporate bonds and commercial paper with maturity dates in excess of 90 days but less than one year. All the Company's short-term investments were held at a single high-credit-quality financial institution and exceeded federally insured limits.
As of December 31, 2012 and March 31, 2013, the Company did not hold any short-term investments.
Fair Value of Financial Instruments
The Company utilizes fair value measurements when required. The carrying amounts of cash and cash equivalents, accounts receivable, restricted cash, other current assets, other long-term assets, accounts payable and accrued expenses, security deposits payable and outstanding balances on the Company's credit facility and related accrued interest expense approximate fair value as of
F-10
Tremor Video, Inc.
Notes to Consolidated Financial Statements (Continued)
(in thousands, except share and per share data)
2. Summary of Significant Accounting Policies (Continued)
December 31, 2011 and 2012, and as of March 31, 2013, due to the short-term nature of those instruments and for the outstanding balances on the credit facility, the interest rates the Company believes it could obtain for borrowings with similar terms. See Note 3 for a discussion of the determination of fair value for the reported amounts of its short-term investments, warrants for the purchase of mandatorily redeemable convertible preferred stock and contingent consideration on acquisition.
Restricted Cash
As of December 31, 2011 and 2012, and March 31, 2013, the Company had total restricted cash in the amounts of $1,257, $1,221 and $1,221, respectively. As of December 31, 2012 and March 31, 2013, the restricted cash used to collateralize standby letters of credit outstanding for an office space in New York, New York and Boston, Massachusetts were $1,200, of which $600 matures in May 2013 with the remaining $600 maturing at various dates through 2021, and $21, which matures in May 2013, respectively.
Accounts Receivable, Net
The Company carries its accounts receivable at net realizable value. On a periodic basis, management evaluates its accounts receivable and determines whether to provide an allowance or if any accounts should be written down and charged to expense as a bad debt. The evaluation is based on a past history of collections, current credit conditions, the length of time the account is past due and a past history of write-downs. A receivable is considered past due if the Company has not received payments based on agreed-upon terms. The Company generally does not require any security or collateral to support its receivables.
Property and Equipment, Net
Property and equipment are stated at cost, less accumulated depreciation. Depreciation on property and equipment is calculated using the straight-line method over the following estimated useful lives:
| Furniture and fixtures | 7 years | |
| Computer hardware | 3 years | |
| Office equipment | 3 years | |
| Computer software | 3 years |
Leasehold improvements are amortized over the shorter of the remaining life of the lease or the life of the asset. The cost of additions, and expenditures that extend the useful lives of existing assets, are capitalized, while repairs and maintenance costs are charged to operations as incurred.
Impairment of Long-Lived Assets
Property and equipment subject to amortization are reviewed for impairment in accordance with ASC 360, "Accounting for the Impairment or Disposal of Long-Lived Assets," whenever events or changes in circumstances indicate that the carrying amount of an asset may not be recoverable. Recoverability of assets to be held and used is measured by a comparison of the carrying amount of an asset to the future undiscounted cash flows expected to be generated by the assets. If such assets are
F-11
Tremor Video, Inc.
Notes to Consolidated Financial Statements (Continued)
(in thousands, except share and per share data)
2. Summary of Significant Accounting Policies (Continued)
considered to be impaired, the impairment to be recognized is measured by the amount by which the carrying amount of the assets exceeds the fair value of the assets. For the years ended December 31, 2011 and 2012, and for the three months ended March 31, 2012 and 2013, no impairment losses have been identified.
Goodwill and Intangible Assets, Net
Primarily all of the Company's goodwill and intangible assets originated with the acquisition of ScanScout, Transpera and the acquired assets of InPlay (See notes 5 and 6). In connection with the Scanscout acquisition, the Company recorded goodwill totaling $27,998 and intangible assets totaling $31,900. In connection with the Transpera acquisition, the Company recorded goodwill totaling $971 and intangible assets totaling $2,550. In connection with the acquired assets of InPlay, the Company recorded goodwill totaling $750 and intangible assets totaling $1,200. On August 7, 2012 the Company purchased a domain name from a third party for $50, the Company determined that this intangible asset had an indefinite life. Goodwill represents the excess of the purchase price in a business combination over the fair value of net tangible and intangible assets acquired. Goodwill is not amortized, but rather is subject to an impairment test.
The Company assesses goodwill for impairment, using a qualitative process, annually as of October 1, or more frequently if an event occurs or circumstances change that would more likely than not reduce the fair value of a reporting unit below its carrying value. The Company operates as one operating segment and as a singular reporting unit for goodwill impairment testing purposes. The Company adopted Accounting Standards Update (ASU) 2011-08, "Testing Goodwill for Impairment," which gives companies the option to qualitatively assess whether it is more likely than not that the fair value of a reporting unit is less than its carrying value. If it is not more likely than not that the fair value of the reporting unit is less than its carrying value, no further assessment of that reporting unit's goodwill is necessary.
If it is more likely than not that the fair value of the reporting unit is less than its carrying value, then the goodwill must be tested using a two-step process based on prior accounting guidance, and if the carrying value of a reporting unit's goodwill exceeds its implied fair value, an impairment loss equal to the excess is recorded.
In performing its qualitative assessment, the Company considered a number of factors, including macroeconomic conditions, the market for its industry, any developments with respect to its operating costs, the financial performance of its reporting unit, any changes to management or key personnel, and any changes to its intangible assets and their respective values. The Company concluded that there were no negative developments with respect to these factors that indicated that any goodwill is at risk of impairment.
For the years ended December 31, 2011 and 2012, no impairment losses have been identified, and no reporting unit was at risk of impairment, including under the first-step of the two-step impairment determination process.
F-12
Tremor Video, Inc.
Notes to Consolidated Financial Statements (Continued)
(in thousands, except share and per share data)
2. Summary of Significant Accounting Policies (Continued)
Intangible assets that are not considered to have an indefinite useful life are amortized over their estimated useful lives on a straight-line method as follows:
| Technology | 5 to 7 years | |
| Customer relationships | 5 to 10 years | |
| Trademarks and trade names | 5 to 7 years | |
| Non-competition agreements | 1 year |
Intangible assets are reviewed for impairment whenever events or changes in circumstances such as, but not limited to, significant declines in revenue, earnings or cash flows or material adverse changes in the business climate indicate that the carrying amount of an asset may be impaired. There were no indicators of impairment to intangible assets for the years ended December 31, 2011 and 2012, and for the three months ended March 31, 2012 and 2013.
Revenue Recognition
The Company generates revenue primarily from the delivery of in-stream video advertisements for brand advertisers and agencies through the Tremor Video Network. The Company also generates revenue from selling licenses to advertisers, agencies and publishers. Revenue is recognized when the related services are delivered based on the specific terms of the contract, which are commonly based on the number of impressions delivered or by the actions of the viewers. The Company recognizes revenue when four basic criteria are met: (1) persuasive evidence exists of an arrangement with the client reflecting the terms and conditions under which the services will be provided; (2) services have been provided or delivery has occurred; (3) the fee is fixed or determinable; and (4) collection is reasonably assured. Collectability is assessed based on a number of factors, including the creditworthiness of a client and transaction history. Amounts billed or collected in excess of revenue recognized are included as deferred revenue.
The Company recognizes revenue from the delivery of video ads in the period in which the video ads are delivered. Specifically, revenue is recognized for video ad delivery through the Tremor Video Network upon the delivery of each impression served for cost per impression ad campaign (CPM), engagement by the consumer with a video ad campaign (CPE) or the completion of a video ad by the consumer ad campaign (CPVC).
In the normal course of business, the Company acts as an intermediary in executing transactions with third parties. The determination of whether revenue should be reported on a gross or net basis is based on an assessment of whether the Company is acting as the principal or an agent in the Company's transactions. In determining whether the Company acts as the principal or an agent, the Company follows the accounting guidance for principal-agent considerations. The determination of whether the Company is acting as a principal or an agent in a transaction involves judgment and is based on an evaluation of the terms of each arrangement. While none of the factors individually are considered presumptive or determinative, because the Company is the primary obligor and is responsible for (1) identifying and contracting with third-party advertisers, (2) establishing the selling prices of the video ads sold, (3) performing all billing and collection activities, including retaining credit risk, and (4) bearing sole responsibility for fulfillment of the advertising, the Company acts as the principal in these arrangements and therefore reports revenue earned and costs incurred related to these transactions on a gross basis.
F-13
Tremor Video, Inc.
Notes to Consolidated Financial Statements (Continued)
(in thousands, except share and per share data)
2. Summary of Significant Accounting Policies (Continued)
The license fees for VHA and the Company's publisher solutions are based on the number of impressions being analyzed through these solutions. The Company recognizes revenue with respect to these solutions on a CPM basis based on the number of impressions being analyzed in a given month. Typically, the Company's license terms are for one year periods. In limited cases, the Company charges a minimum monthly fee.
Deferred revenue arises as a result of differences between the timing of revenue recognition and receipt of cash from the Company's customers. As of December 31, 2011 and 2012, and as of March 31, 2013, there were $35, $210 and $401, respectively, of services for which cash payments were received in advance of the Company's performance of the service under the arrangement and recorded as deferred revenue in the accompanying consolidated balance sheets.
Cost of Revenue
Cost of revenue primarily represents the video advertising inventory costs under the Company's publisher contracts, third party hosting fees and third party serving fees incurred to deliver the video ads run through the Tremor Video Network. Cost of revenue also includes costs of licenses from third party data providers utilized in the Company's VHA solution. Substantially all of the Company's cost of revenue is attributable to video advertising inventory costs under its publisher contracts. Cost of revenue is recognized on a publisher-by-publisher basis at the same time that the associated advertising revenue is recognized. Substantially all of the Company's exclusive publisher contracts contain minimum percentage fill rates on qualified video ad requests, which effectively means that the Company must purchase this inventory even if the Company lacks a video advertising campaign to deliver to these video ad impressions. The Company recognizes the difference between the contractually required fill rate and the number of video ads actually delivered on the publisher's website, if any, as a cost of revenue as of the end of each applicable monthly period. Historically, the impact of the difference between the contractually required fill rate and the number of ads delivered has not been material. Costs owed to publishers but not yet paid are recorded in the consolidated balance sheets as accounts payable and accrued expenses.
Basic and Diluted Loss per Common Share
Basic loss per common share is computed by dividing the net loss applicable to common stockholders for the period by the weighted average number of shares of common stock outstanding during the same period. Diluted loss per common share is computed by dividing the net loss applicable to common stockholders for the period by the weighted average number of shares of common stock and common stock equivalents outstanding.
The total weighted average number of common stock related to the outstanding options, warrants and mandatorily redeemable convertible preferred stock, which were excluded from the calculations of diluted net loss common stock, because these securities are anti-dilutive, was 39,431,181 and 39,584,044 for the years ended December 31, 2011 and 2012, respectively, and 39,474,621 and 39,706,528 for the three months ended March 31, 2012 and 2013, respectively.
Stock-Based Compensation
The Company accounts for stock-based compensation under ASC 718, "Compensation—Stock Compensation," which requires the measurement and recognition of compensation expense based on
F-14
Tremor Video, Inc.
Notes to Consolidated Financial Statements (Continued)
(in thousands, except share and per share data)
2. Summary of Significant Accounting Policies (Continued)
estimated fair values for all share-based payment awards made to employees, other service providers and non-employees.
ASC 718 requires companies to estimate the fair value of equity-based payment awards on the date of grant using an option-pricing model. The value of the portion of the award that is ultimately expected to vest is recognized as an expense over the requisite service periods in the Company's consolidated statements of operations.
The Company recognizes compensation expenses for the value of its awards, which have graded vesting based on service conditions, using the straight-line method, over the requisite service period of each of the awards, net of estimated forfeitures.
Calculating the fair value of the stock-based options requires the input of subjective assumptions, including the expected term of the stock-based awards and stock price volatility. The Company estimates the expected life of stock options granted based on the simplified method, which the Company believes, is representative of the actual characteristics of the awards. The Company estimates the volatility of the common stock on the date of grant based on the historic volatility of comparable companies in its industry. The Company selected the risk-free interest rate based on yields from United States Treasury zero-coupon issues with a term consistent with the expected life of the awards in effect at the time of grant. Estimated forfeitures are based on actual historical pre-vesting forfeitures. The Company has never declared or paid any cash dividends and has no plan to do so. Consequently, it used an expected dividend yield of zero.
In the event of modification of the conditions on which stock-based compensation was granted, an additional expense is recognized for any modification that increases the total fair value of the share-based payment arrangement or is otherwise beneficial to the employee/other service provider at the modification date.
Technology and Development
Technology and development costs primarily consist of salaries, incentive compensation, stock-based compensation and other personnel-related costs for development, network operations and engineering personnel. Additional expenses in this category include costs related to development, quality assurance and testing of new technology, maintenance and enhancement of the Company's existing technology and infrastructure as well as consulting, travel and other related overhead. The Company engages third-party consulting firms for various technology and development efforts, such as documentation, quality assurance, and support. Due to the rapid development and changes in the Company's business and underlying technology to date, the Company has expensed development costs in the same period that those costs were incurred.
Sales and Marketing
Sales and marketing expenses primarily consist of salaries, incentive compensation, stock-based compensation and other personnel-related costs for marketing and creative employees and the advertiser focused, publisher focused and licensing solution focused sales and sales support employees. Additional expenses in this category include marketing programs, consulting, travel and other related overhead. These costs are expensed when incurred and are included in sales and marketing expenses. Advertising costs, which are comprised of print and internet advertising, were $1,358 and $1,372 for the
F-15
Tremor Video, Inc.
Notes to Consolidated Financial Statements (Continued)
(in thousands, except share and per share data)
2. Summary of Significant Accounting Policies (Continued)
years ended December 31, 2011 and 2012, respectively, and $556 and $581 for the three months ended March 31, 2012 and 2013, respectively.
Income Taxes
The Company accounts for income taxes under the asset and liability method. The Company recognizes deferred tax assets and liabilities for the future tax consequences attributable to differences between the financial statement carrying amounts of existing assets and liabilities and their respective tax bases, as well as for operating loss and tax credit carry-forwards. The Company measures deferred tax assets and liabilities using enacted tax rates expected to apply to taxable income in the years in which the Company expects to recover or settle those temporary differences.
The Company recognizes the effect of a change in tax rates on deferred tax assets and liabilities in the results of operations in the period that includes the enactment date. The Company reduces the measurement of a deferred tax asset, if necessary, by a valuation allowance if it is more likely than not that the Company will not realize some or all of the deferred tax asset. As a result of the Company's historical operating performance and the cumulative net losses incurred to date, the Company does not have sufficient objective evidence to support the recovery of the net deferred tax assets. Accordingly, the Company has established a valuation allowance against net deferred tax assets for financial reporting purposes because the Company believes it is not more likely than not that these deferred tax assets will be realized.
The Company accounts for uncertain tax positions by recognizing the financial statement effects of a tax position only when, based upon technical merits, it is "more-likely-than-not" that the position will be sustained upon examination. Potential interest and penalties associated with unrecognized tax positions are recognized in income tax expense.
Concentrations of Credit Risk
Financial instruments that subject the Company to significant concentrations of credit risk consist primarily of cash and cash equivalents and accounts receivable. All of the Company's cash and cash equivalents are held at financial institutions that management believes to be of high credit quality. The Company's cash and cash equivalent accounts exceed federally insured limits at times. The Company has not experienced any losses on cash and cash equivalents to date. To manage accounts receivable risk, the Company evaluates the creditworthiness of its customers and maintains an allowance for doubtful accounts.
During the years ended December 31, 2011 and 2012, and for the three months ended March 31, 2012 and 2013, there were no advertisers that accounted for more than 10% of revenue or greater than 10% of outstanding receivables at year-end.
Comprehensive Loss
Comprehensive loss consists of unrealized gains and losses on available-for-sale securities, net of tax and currency translation. Total comprehensive loss and its components are presented in the accompanying consolidated statements of comprehensive loss.
F-16
Tremor Video, Inc.
Notes to Consolidated Financial Statements (Continued)
(in thousands, except share and per share data)
2. Summary of Significant Accounting Policies (Continued)
Foreign Currency Translation
The functional currency of the Company's international subsidiaries is accounted for in their local currency. The Company translates the financial statements of these subsidiaries to U.S. dollars using period-end rates of exchange for assets and liabilities, and average rates of exchange for revenue, costs, and expenses. Translation gains and losses are recorded in accumulated other comprehensive income as a component of stockholders' deficit. For the years ended December 31, 2011 and 2012, a cumulative translation adjustment of $177 and $(58), respectively, and $59 and $(94) for the three months ended March 31, 2012 and 2013, respectively, were recorded as a component of comprehensive loss in the consolidated financial statements. Realized and unrealized transaction gains and losses are included in the consolidated statements of operations in the period in which they occur, except on inter-company balances considered to be long-term. Transaction gains and losses on inter-company balances which are considered to be long-term are recorded in accumulated other comprehensive income. During 2012, the Company considered their inter-company balances to be long-term in nature. Net (loss) gain resulting from transactions denominated in foreign currencies was accounted for in the Company's consolidated statements of operations and totaled $(256) and $28 for the years ended December 31, 2011 and 2012, respectively, and $(5) and $0 for the three months ended March 31, 2012 and 2013, respectively.
F-17
Tremor Video, Inc.
Notes to Consolidated Financial Statements (Continued)
(in thousands, except share and per share data)
2. Summary of Significant Accounting Policies (Continued)
Business Combinations
In business combinations, the Company determines the acquisition purchase price as the sum of the consideration provided. The underlying principles require that the Company recognize separately from goodwill the assets acquired and the liabilities assumed, generally at their acquisition date fair values. Goodwill as of the acquisition date is measured as the excess of consideration transferred and the net of the acquisition date fair values of the assets acquired and the liabilities assumed. While the Company uses its best estimates and assumptions as a part of the purchase price allocation process to accurately value assets acquired and liabilities assumed at the acquisition date, the Company's estimates are inherently uncertain and subject to refinement. As a result, during the measurement period, which may be up to one year from the acquisition date, the Company may record adjustments to the assets acquired and liabilities assumed with the corresponding offset to goodwill. Upon the conclusion of the measurement period or final determination of the values of assets acquired or liabilities assumed, whichever comes first, any subsequent adjustments are recorded in the consolidated statements of operations. The direct transaction costs associated with the business combination are expensed as incurred.
When the Company issues stock-based awards to an acquired company's selling stockholders, the Company evaluates whether the awards are contingent consideration or compensation for post-business combination services. The Company's evaluation includes, among other things, whether the vesting of the stock-based awards is contingent on the continued employment of the selling stockholder beyond the acquisition date. If continued employment is required for vesting, the awards are treated as compensation for post-acquisition services and recognized as future compensation expense over the required service period.
3. Fair Value Measurements
Fair value is defined as the exchange price that would be received for an asset or paid to transfer a liability (an exit price) in the principal or most advantageous market for the asset or liability in an orderly transaction between market participants on the measurement date. The Company uses a three-tier fair value hierarchy to classify and disclose all assets and liabilities measured at fair value on a recurring basis, as well as assets and liabilities measured at fair value on a non-recurring basis, in periods subsequent to their initial measurement. The hierarchy requires the Company to use observable inputs when available, and to minimize the use of unobservable inputs when determining fair value. If a financial instrument uses inputs that fall in different levels of the hierarchy, the instrument will be categorized based upon the lowest level of input that is significant to the fair value calculation. The three-tiers are defined as follows:
- •
- Level 1. Observable inputs based on unadjusted quoted prices in active markets
for identical assets or liabilities;
- •
- Level 2. Inputs, other than quoted prices in active markets, that are
observable either directly or indirectly; and
- •
- Level 3. Unobservable inputs for which there is little or no market data requiring the Company to develop its own assumptions.
F-18
Tremor Video, Inc.
Notes to Consolidated Financial Statements (Continued)
(in thousands, except share and per share data)
3. Fair Value Measurements (Continued)
Assets and Liabilities Measured at Fair Value on a Recurring Basis
The Company evaluates its financial assets and liabilities subject to fair value measurements on a recurring basis to determine the appropriate level to classify them for each reporting period. This determination requires significant judgments to be made. The following tables summarize the conclusions reached as of December 31, 2011 and 2012, and as of March 31, 2013:
| |
Balance at December 31, 2011 |
Level 1 | Level 2 | Level 3 | |||||||||
|---|---|---|---|---|---|---|---|---|---|---|---|---|---|
Assets |
|||||||||||||
Short-term investment(1) |
$ | 8,652 | $ | 8,652 | $ | — | $ | — | |||||
|
$ | 8,652 | $ | 8,652 | $ | — | $ | — | |||||
Liabilities |
|||||||||||||
Warrants for purchase of mandatorily redeemable convertible preferred stock(2) |
$ | 1,127 | $ | — | $ | — | $ | 1,127 | |||||
Contingent consideration on acquisition(3) |
817 | — | — | 817 | |||||||||
|
$ | 1,944 | $ | — | $ | — | $ | 1,944 | |||||
| |
Balance at December 31, 2012 |
Level 1 | Level 2 | Level 3 | |||||||||
|---|---|---|---|---|---|---|---|---|---|---|---|---|---|
Liabilities |
|||||||||||||
Warrants for purchase of mandatorily redeemable convertible preferred stock(2) |
$ | 1,103 | $ | — | $ | — | $ | 1,103 | |||||
|
$ | 1,103 | $ | — | $ | — | $ | 1,103 | |||||
| |
Balance at March 31, 2013 |
Level 1 | Level 2 | Level 3 | |||||||||
|---|---|---|---|---|---|---|---|---|---|---|---|---|---|
| |
(unaudited) |
||||||||||||
Liabilities |
|||||||||||||
Warrants for purchase of mandatorily redeemable convertible preferred stock(2) |
$ | 1,098 | $ | — | $ | — | $ | 1,098 | |||||
|
$ | 1,098 | $ | — | $ | — | $ | 1,098 | |||||
- (1)
- As of December 31, 2011, all of the Company's short-term investments were held in U.S. Government and agency securities, high quality corporate bonds and commercial paper which were measured at fair value using Level 1 inputs. As of December 31, 2012 and March 31, 2013, the Company did not hold any short-term investments.
- (2)
- The Company used an option pricing model to determine the fair value of the warrants for purchase of mandatorily redeemable convertible preferred stock. Significant inputs included an estimate of the fair value of the Company's preferred stock, the remaining contractual life of the warrant, a risk-free rate of interest, and an estimate of the Company's stock volatility using the volatilities of guideline peer companies.
- (3)
- On February 11, 2011, the Company acquired all of the outstanding equity of Transpera. The purchase price included contingent consideration of up to 169,131 shares of common stock payable in one year based on certain
F-19
Tremor Video, Inc.
Notes to Consolidated Financial Statements (Continued)
(in thousands, except share and per share data)
3. Fair Value Measurements (Continued)
performance
criteria. The Company used a valuation model based on future expectations combined with management judgment. In the absence of a public trading market, the Company exercised judgment and
considered numerous objective and subjective factors to determine the fair value of the Company's common stock.
Assets Measured at Fair Value on a Recurring Basis Using Significant Unobservable Inputs (Level 3)
The following tables presents the changes in the Company's Level 3 instruments measured at fair value on a recurring basis for the years ended December 31, 2011 and 2012, and for the three months ended March 31, 2012 and 2013:
| |
Warrants for purchase of Mandatorily Redeemable Convertible Preferred Stock |
||||||
|---|---|---|---|---|---|---|---|
| |
2011 | 2012 | |||||
Beginning balance at January 1, |
$ | 848 | $ | 1,127 | |||
Mark-to-market expense (income) |
279 | (24 | ) | ||||
Ending balance at December 31, |
$ | 1,127 | $ | 1,103 | |||
| |
Contingent Consideration on Acquisition |
||||||
|---|---|---|---|---|---|---|---|
| |
2011 | 2012 | |||||
Beginning balance at January 1, |
$ | — | $ | 817 | |||
Contingent consideration on acquisition |
723 | — | |||||
Mark-to-market expenses |
94 | 46 | |||||
Settlement of contingent consideration |
— | (863 | ) | ||||
Ending balance at December 31, |
$ | 817 | $ | — | |||
| |
Warrants for purchase of Mandatorily Redeemable Convertible Preferred Stock |
||||||
|---|---|---|---|---|---|---|---|
| |
2012 | 2013 | |||||
| |
(unaudited) |
||||||
Beginning balance at January 1, |
$ | 1,127 | $ | 1,103 | |||
Mark-to-market income |
(6 | ) | (5 | ) | |||
Ending balance at March 31, |
$ | 1,121 | $ | 1,098 | |||
F-20
Tremor Video, Inc.
Notes to Consolidated Financial Statements (Continued)
(in thousands, except share and per share data)
4. Property and Equipment, Net
| |
December 31, | March 31, | ||||||||
|---|---|---|---|---|---|---|---|---|---|---|
| |
2011 | 2012 | 2013 | |||||||
| |
|
|
(unaudited) |
|||||||
Cost: |
||||||||||
Furniture and fixtures |
$ | 670 | $ | 765 | $ | 767 | ||||
Computer hardware |
2,210 | 2,885 | 2,985 | |||||||
Office equipment |
69 | 28 | 30 | |||||||
Computer software |
417 | 545 | 554 | |||||||
Leasehold improvements |
993 | 849 | 873 | |||||||
|
4,359 | 5,072 | 5,209 | |||||||
Accumulated depreciation |
(2,416 |
) |
(3,077 |
) |
(3,359 |
) |
||||
Property and equipment, net |
$ | 1,943 | $ | 1,995 | $ | 1,850 | ||||
The depreciation expense related to property and equipment was $956 and $1,104 for the years ended December 31, 2011 and 2012, respectively, and $246 and $282 for the three months ended March 31, 2012 and 2013, respectively.
For the three months ended March 31, 2012 and for the year ended December 31, 2012, the Company recorded a reduction of $229 and $443, respectively, to the cost and accumulated depreciation of fully depreciated equipment and leasehold improvements no longer in use.
5. Acquisitions
Transpera, Inc.
On February 11, 2011, the Company acquired all of the outstanding equity of Transpera for $3,295 of the Company's common stock. Transpera owns and operates a technology platform that enables video advertising formats to be served on mobile devices, tablets and connected TVs.
The purchase price included contingent consideration of up to 169,131 shares payable in one year based on certain performance criteria. The fair value of this consideration was determined to be $723 as of the acquisition date and was marked to market at fair value quarterly in other expenses. On February 11, 2012, the Company issued 169,131 shares, which were valued at $863, upon satisfaction of the performance criteria. The initial fair value was recorded as part of the purchase price while subsequent changes to fair value were reflected as other expenses.
The following table summarizes the estimated fair values of the assets acquired and liabilities assumed at the acquisition date. The fair values presented are based on a preliminary valuation and are subject to adjustment during a measurement period of up to one year from the acquisition date. The measurement period provides the Company with the ability to adjust the fair values of acquired assets
F-21
Tremor Video, Inc.
Notes to Consolidated Financial Statements (Continued)
(in thousands, except share and per share data)
5. Acquisitions (Continued)
and assumed liabilities for new information that is obtained about circumstances that existed as of the acquisition date.
Total purchase price |
$ | 3,295 | ||
Fair value of assets acquired and liabilities assumed: |
||||
Tangible assets acquired |
||||
Cash |
12 | |||
Accounts receivable |
723 | |||
Other current assets |
73 | |||
Total tangible assets acquired |
808 | |||
Identified intangible assets acquired: |
2,550 |
|||
Current liabilities |
(1,034 | ) | ||
Total assets acquired in excess of liabilities assumed |
2,324 |
|||
Goodwill |
986 | |||
Adjustment of Transpera goodwill |
(15 | ) | ||
Total purchase price |
$ | 3,295 | ||
In addition to the purchase price of $3,295, the Company issued an additional $300 of common stock on the acquisition date to satisfy certain pre-acquisition liabilities of Transpera.
InPlay
On January 17, 2012, the Company purchased TubeMogul's InPlay Analytics Product (InPlay). InPlay is a market leading publisher analytics suite for online video, and powers analytics for web properties that publish video content. Consideration consisted of $1,950 in cash.
The following table summarizes the estimated fair values of the assets acquired at the acquisition date. The fair values presented are based on a preliminary valuation and are subject to adjustment during a measurement period of up to one year from the acquisition date. The measurement period provides the Company with the ability to adjust the fair values of acquired assets for new information that is obtained about circumstances that existed as of the acquisition date.
Technology |
$ | 900 | ||
Customer relationships |
200 | |||
Trademarks and trade names |
100 | |||
Goodwill |
750 | |||
|
$ | 1,950 | ||
F-22
Tremor Video, Inc.
Notes to Consolidated Financial Statements (Continued)
(in thousands, except share and per share data)
6. Goodwill and Intangible Assets, Net
The changes in the carrying amount of goodwill for the years ended December 31, 2011 and 2012 were as follows:
Balance as of January 1, 2011 |
$ | 28,060 | ||
Adjustment of ScanScout goodwill |
(62 | ) | ||
Goodwill—Transpera |
986 | |||
Balance as of December 31, 2011 |
28,984 | |||
Adjustment of Transpera goodwill |
(15 | ) | ||
Goodwill—InPlay |
750 | |||
Balance as of December 31, 2012 and March 31, 2013 (unaudited) |
$ | 29,719 | ||
There were no changes in the carrying amount of goodwill for the three months ended March 31, 2013.
Information regarding the Company's acquisition related intangible assets, net is as follows:
As of December 31, 2011:
| |
Gross Carrying Amount |
Accumulated Amortization |
Net Carrying Amount |
|||||||
|---|---|---|---|---|---|---|---|---|---|---|
Technology |
$ | 23,600 | $ | (3,621 | ) | $ | 19,979 | |||
Customer relationships |
8,700 | (990 | ) | 7,710 | ||||||
Trademarks and trade names |
1,550 | (239 | ) | 1,311 | ||||||
Non-competition agreements |
600 | (577 | ) | 23 | ||||||
|
$ | 34,450 | $ | (5,427 | ) | $ | 29,023 | |||
As of December 31, 2012:
| |
Gross Carrying Amount |
Accumulated Amortization |
Net Carrying Amount |
|||||||
|---|---|---|---|---|---|---|---|---|---|---|
Technology |
$ | 24,500 | $ | (7,239 | ) | $ | 17,261 | |||
Customer relationships |
8,900 | (1,988 | ) | 6,912 | ||||||
Trademarks and trade names |
1,650 | (488 | ) | 1,162 | ||||||
Non-competition agreements |
600 | (600 | ) | — | ||||||
Domain name(1) |
50 | — | 50 | |||||||
|
$ | 35,700 | $ | (10,315 | ) | $ | 25,385 | |||
F-23
Tremor Video, Inc.
Notes to Consolidated Financial Statements (Continued)
(in thousands, except share and per share data)
6. Goodwill and Intangible Assets, Net (Continued)
As of March 31, 2013 (unaudited):
| |
Gross Carrying Amount |
Accumulated Amortization |
Net Carrying Amount |
|||||||
|---|---|---|---|---|---|---|---|---|---|---|
Technology |
$ | 24,500 | $ | (8,146 | ) | $ | 16,354 | |||
Customer relationships |
8,900 | (2,238 | ) | 6,662 | ||||||
Trademarks and trade names |
1,650 | (551 | ) | 1,099 | ||||||
Non-competition agreements |
600 | (600 | ) | — | ||||||
Domain name(1) |
50 | — | 50 | |||||||
|
$ | 35,700 | $ | (11,535 | ) | $ | 24,165 | |||
- (1)
- This intangible asset is considered to have an indefinite useful life.
Amortization expense amounted to $5,132 and $4,888 for the years ended December 31, 2011, and 2012, respectively, and $1,232 and $1,220 for the three months ended March 31, 2012 and 2013, respectively.
The estimated future amortization expense of intangible assets that are considered to have a definite life as of March 31, 2013 for the next five years and thereafter are as follows:
2013 |
$ | 3,656 | ||
2014 |
4,876 | |||
2015 |
4,876 | |||
2016 |
4,460 | |||
2017 |
3,957 | |||
2018 and thereafter |
2,290 | |||
|
$ | 24,115 | ||
7. Accounts Payable and Accrued Expenses
Accounts payable and accrued expenses consisted of:
| |
As of December 31, |
As of March 31, |
||||||||
|---|---|---|---|---|---|---|---|---|---|---|
| |
2011 | 2012 | 2013 | |||||||
| |
|
|
(unaudited) |
|||||||
Trade accounts payable |
$ | 12,134 | $ | 15,191 | $ | 11,615 | ||||
Accrued cost of sales |
824 | 1,058 | 1,112 | |||||||
Accrued compensation, benefits and payroll taxes |
1,912 | 3,627 | 2,550 | |||||||
Income taxes payable |
68 | 36 | 226 | |||||||
Other accrued expenses |
1,350 | 1,163 | 2,294 | |||||||
|
$ | 16,288 | $ | 21,075 | $ | 17,797 | ||||
F-24
Tremor Video, Inc.
Notes to Consolidated Financial Statements (Continued)
(in thousands, except share and per share data)
8. Credit Facility and Accrued Interest Expense
On February 7, 2010, the Company amended its then existing loan and security agreement with Silicon Valley Bank (SVB). As amended, the loan and security agreement provided for a $7,000 revolving working capital credit facility. The credit facility includes customary conditions to borrowing, covenants and events of default. The credit facility also contains a financial covenant requiring that the ratio of current assets to current liabilities (excluding deferred revenue) be at least 1.25 to 1. As collateral for its obligations under the credit facility, the Company granted a first priority security interest to SVB in all assets of the Company other than intellectual property. The Company has agreed not to pledge its intellectual property as collateral without SVB's prior written consent.
In February 2011, the credit facility was amended to, among other things, revise the interest rate to be equal to SVB's prime rate plus 1.0% and provide for a fee of 0.20% for any unused portion of the revolving credit facility. Such fee is payable quarterly but no fee is charged for a particular quarter if the average principal amount of borrowings during such quarter is more than $10,000.
On December 31, 2011, the Company expanded the borrowing capacity under the credit facility to the lesser of $25,000 and a borrowing base equal to 80% of eligible accounts receivable.
On March 8, 2012, the credit facility was amended to, among other things, revise the interest rate to SVB's prime rate plus 0.5% and provide for a termination date of December 30, 2014. The Company had $6,000 aggregate principal amount of borrowings outstanding under the facility and was in compliance with all covenants as of December 31, 2012 and March 31, 2013.
9. Warrants for Mandatorily Redeemable Convertible Preferred Stock
In connection with the Company's entry into, and various amendments of, its loan and credit facility agreements in 2007, 2008 and 2010 (See note 8), warrants for mandatorily redeemable convertible preferred stock were issued to SVB. In addition, with the acquisition of ScanScout in 2010, the Company exchanged ScanScout's pre-acquisition preferred stock warrants into warrants for the new series of mandatorily redeemable convertible preferred stock that was issued as part of the acquisition.
The warrants are exercisable at any time prior to expiration. Freestanding warrants and other similar instruments on shares that are redeemable (either put-able or mandatorily redeemable) are accounted for as liabilities, regardless of the timing of the redemption feature or price, even though the underlying shares may be classified as equity.
The following table summarizes the Company's outstanding warrants for mandatorily redeemable convertible preferred stock as of December 31, 2011 and 2012 and as of March 31, 2013:
| |
|
|
|
|
Fair Value as of | |||||||||||||||
|---|---|---|---|---|---|---|---|---|---|---|---|---|---|---|---|---|---|---|---|---|
| |
|
|
|
|
December 31, | March 31, | ||||||||||||||
| |
|
|
Exercise Price |
Warrants Outstanding |
||||||||||||||||
| |
Grant Date | Expiration Date | 2011 | 2012 | 2013 | |||||||||||||||
| |
|
|
|
|
|
|
(unaudited) |
|||||||||||||
Series A |
June 7, 2007 | June 7, 2017 | $ | 1.27 | 35,520 | $ | 302 | $ | 299 | $ | 298 | |||||||||
Series B-1 |
December 8, 2008 | December 7, 2018 | $ | 4.86 | 33,930 | 255 | 246 | 244 | ||||||||||||
Series C |
February 8, 2010 | February 8, 2020 | $ | 3.79 | 31,659 | 252 | 245 | 244 | ||||||||||||
Series 1 |
December 8, 2010 | June 30, 2017 | $ | 2.46 | 31,130 | 258 | 256 | 255 | ||||||||||||
Series 3 |
December 8, 2010 | February 6, 2015 | $ | 5.75 | 8,694 | 60 | 57 | 57 | ||||||||||||
|
140,933 | $ | 1,127 | $ | 1,103 | $ | 1,098 | |||||||||||||
Mark-to-market (expense) income related to the fair value measurement of the warrants were $(279) and $24 for the years ended December 31, 2011 and 2012, respectively, and $(6) and $(5) for the three months ended March 31, 2012 and 2013, respectively.
F-25
Tremor Video, Inc.
Notes to Consolidated Financial Statements (Continued)
(in thousands, except share and per share data)
10. Commitments and Contingencies
Operating Commitments
The Company leases office space under non-cancellable operating lease agreements that expire at various dates. In addition, the Company utilizes co-location services for its servers and other computer hardware. These services are multi-year, non-cancellable agreements that are similar in form to a lease on office space. The Company also contracted for other marketing services under various non-cancellable agreements that expire at various dates through 2013.
Future minimum payment commitments required under the Company's non-cancellable office leases, co-location agreements and marketing services as of December 31, 2012 are as follows:
2013 |
$ | 1,896 | ||
2014 |
1,717 | |||
2015 |
1,345 | |||
2016 |
1,225 | |||
2017 |
1,108 | |||
2018 and thereafter |
3,253 | |||
|
$ | 10,544 | ||
Total rent expenses for the years ended December 31, 2011 and 2012 amounted to $1,308 and $1,397, respectively, and $337 and $355 for the three months ended March 31, 2012 and 2013, respectively.
Letters of Credit
At December 31, 2011 and 2012 and March 31, 2013, the Company had outstanding letters of credit of $1,257, $1,221 and $1,221, respectively, related to two office spaces in New York, New York and Boston, Massachusetts.
Legal Contingencies
During the normal course of the business, the Company is occasionally involved with various claims and litigation. Reserves are established in connection with such matters when a loss is probable and the amount of such loss can be reasonably estimated. At December 31, 2011 and 2012, and March 31, 2013, no material reserves were recorded. No reserves are established for losses which are only reasonably possible. The determination of probability and the estimation of the actual amount of any such loss are inherently unpredictable, and it is therefore possible that the eventual outcome of such claims and litigation could exceed the estimated reserves, if any. Based upon the Company's experience, current information and applicable law, it does not believe it is reasonably possible that any proceedings or possible related claims will have a material effect on its financial statements.
F-26
Tremor Video, Inc.
Notes to Consolidated Financial Statements (Continued)
(in thousands, except share and per share data)
11. Common Stock, Mandatorily Redeemable Convertible Preferred Stock and Stockholders' Deficit
Common Stock
As of each December 31, 2011 and 2012, and March 31, 2013, the Company has two classes of $0.0001 par value common stock as follows:
| |
|
Outstanding as of December 31, |
Outstanding as of March 31, |
||||||||||
|---|---|---|---|---|---|---|---|---|---|---|---|---|---|
| |
Authorized as of December 31, 2011 and 2012 |
||||||||||||
Series
|
2011 | 2012 | 2013 | ||||||||||
| |
|
|
|
(unaudited) |
|||||||||
Series I |
50,000,000 | 6,166,059 | 6,674,905 | 6,703,431 | |||||||||
Series II |
2,333,333 | 1,017,182 | 1,047,357 | 1,047,357 | |||||||||
|
52,333,333 | 7,183,241 | 7,722,262 | 7,750,788 | |||||||||
The Series I and II classes of common stock are identical in all significant respects. Each share is entitled to one vote and both classes of shares are subordinate to the preferred stock in the payment of dividends and liquidation preferences. The Series II common stock will automatically convert into Series I common stock upon the closing of a qualified initial public offering, which results in at least $50 million of net proceeds to the Company and in which the enterprise value of the Company prior to such offering is at least $450 million (see note 17).
Mandatorily Redeemable Convertible Preferred Stock
As of each December 31, 2011 and 2012, and March 31, 2013, the authorized capital stock of the Company consists of 32,742,929 shares of preferred stock, $0.0001 par value per share.
Mandatorily redeemable convertible preferred stock (preferred stock) consists of the following as of December 31, 2012, and March 31, 2013:
Series
|
Issued | Authorized | Issued and Outstanding |
Original Issue Price |
Liquidation Preference |
Carrying Value as of December 31, 2012 |
Carrying Value as of March 31, 2013 |
||||||||||||||
|---|---|---|---|---|---|---|---|---|---|---|---|---|---|---|---|---|---|---|---|---|---|
| |
|
|
|
|
|
|
(unaudited) |
||||||||||||||
Series A |
September 2006 | 6,861,975 | 6,826,451 | $ | 1.2669 | $ | 8,648 | $ | 8,402 | $ | 8,419 | ||||||||||
Series B |
December 2007 | 3,500,732 | 3,500,729 | $ | 3.1422 | $ | 11,000 | $ | 10,949 | $ | 10,952 | ||||||||||
Series B-1 |
May 2008 | 548,032 | 514,102 | $ | 4.8629 | $ | 2,500 | $ | 2,479 | $ | 2,480 | ||||||||||
Series C |
February and August 2009 | 5,308,216 | 5,276,554 | $ | 3.7904 | $ | 20,000 | $ | 19,932 | $ | 19,936 | ||||||||||
Series D |
April 2010 | 5,453,975 | 5,453,970 | $ | 7.3341 | $ | 40,000 | $ | 39,931 | $ | 39,936 | ||||||||||
Series E |
December 2010 | 238,000 | 236,108 | $ | 8.0051 | $ | 1,890 | $ | 1,890 | $ | 1,890 | ||||||||||
Series 1 |
December 2010 | 979,333 | 947,711 | $ | 2.4575 | $ | 2,329 | $ | 5,217 | $ | 5,217 | ||||||||||
Series 2 |
December 2010 | 1,822,000 | 1,821,455 | $ | 4.1387 | $ | 7,538 | $ | 12,404 | $ | 12,404 | ||||||||||
Series 3 |
December 2010 | 937,333 | 928,054 | $ | 5.7507 | $ | 5,337 | $ | 7,517 | $ | 7,517 | ||||||||||
Series 4 |
December 2010 | 3,093,333 | 3,092,932 | $ | 2.7548 | $ | 8,520 | $ | 17,722 | $ | 17,723 | ||||||||||
Series F |
September 2011 | 4,000,000 | 3,965,126 | $ | 9.3314 | $ | 37,000 | $ | 36,023 | $ | 36,087 | ||||||||||
|
32,742,929 | 32,563,192 | $ | 162,466 | $ | 162,561 | |||||||||||||||
On September 6, 2011, the Company sold 3,965,126 shares of Series F redeemable convertible preferred stock at a price of $9.3314 per share for aggregate proceeds of $37 million. The Company incurred $1,321 in costs associated with the sale of the preferred stock.
F-27
Tremor Video, Inc.
Notes to Consolidated Financial Statements (Continued)
(in thousands, except share and per share data)
11. Common Stock, Mandatorily Redeemable Convertible Preferred Stock and Stockholders' Deficit (Continued)
Dividends
The holders of preferred stock are entitled to receive, when and if declared by the Board of Directors out of funds legally available, dividends at the following annual rates:
Series
|
Dividend Rate | |||
|---|---|---|---|---|
Series A |
$ | 0.10140 | ||
Series B |
$ | 0.25140 | ||
Series B-1 |
$ | 0.38910 | ||
Series C |
$ | 0.30330 | ||
Series D |
$ | 0.58680 | ||
Series E |
$ | 0.64035 | ||
Series 1 |
$ | 0.19665 | ||
Series 2 |
$ | 0.33105 | ||
Series 3 |
$ | 0.46005 | ||
Series 4 |
$ | 0.22035 | ||
Series F |
$ | 0.74655 | ||
No dividends or other distributions will be made with respect to common stock until all declared dividends on the preferred stock have been paid. No dividends have been declared or paid by the Company through the date of this report.
Conversion
The preferred stock is convertible into common stock at the option of the holder. Except for the Series B-1 preferred stock, all preferred stock converts on a one for one basis. The Series B-1 preferred stock converts to Series I common stock on a 1:1.04719 basis (see note 17). The preferred stock will be automatically converted into common stock upon a qualified initial public offering.
Liquidation Preferences
The preferred stockholders have liquidation preferences over common stockholders based on the series of preferred stock held. In the event of liquidation, dissolution, or winding up of the Company, each holder of preferred shares is entitled to be paid out of available assets on a pro-rata basis based on the liquidation preference of each series plus all declared but unpaid dividends. After the preferential amounts have been distributed by the Company, the holders of preferred stock then participate with the common stockholders in the distribution of remaining available assets.
Voting
Each holder of a share of outstanding preferred stock shall be entitled to the number of votes equal to the number of shares of common stock into which the shares of convertible preferred stock so held could be converted.
F-28
Tremor Video, Inc.
Notes to Consolidated Financial Statements (Continued)
(in thousands, except share and per share data)
11. Common Stock, Mandatorily Redeemable Convertible Preferred Stock and Stockholders' Deficit (Continued)
Ratchet provision
The number of shares to be issued upon the automatic conversion of all outstanding shares of Series F preferred stock depends in part on the anticipated initial public offering price of the Company's common stock. The terms of the Series F preferred stock provide that the ratio at which each share of such series automatically convert into shares of common stock will increase if a qualified initial public offering price is below $13.997 per share, which would result in additional shares of common stock being issued upon conversion of the Company's Series F preferred stock immediately prior to the closing of the qualified initial public offering.
Common Stock Repurchases
Shares formally retired are deducted from the accounts that were previously increased when the shares were sold or exercised, namely common stock for par value and additional paid-in-capital for the excess over par value. If additional paid-in-capital has been exhausted, the excess over par value is added to the Company's accumulated deficit.
During the year ended December 31, 2011, the Company repurchased 18,847 shares of commons stock from stockholders of the Company as follows (see note 17):
- •
- In April 2011, the Company repurchased and retired 11,250 shares of Series I common stock for $48.
- •
- In June 2011, the Company repurchased and retired 6,337 shares of Series I common stock for $27.
- •
- In September 2011, the Company repurchased and retired 1,260 shares of Series II common stock for $8.
The Company did not make any share repurchases during the year ended December 31, 2012 and for the three months ended March 31, 2013.
12. Stock-Based Compensation
The Company included stock-based compensation expense related to all of the Company's stock-based awards in various operating expense categories for the years ended December 31, 2011 and 2012, and for the three months ended March 31, 2012 and 2013 as follows:
| |
Year Ended December 31 | Three Months Ended March 31, |
|||||||||||
|---|---|---|---|---|---|---|---|---|---|---|---|---|---|
| |
2011 | 2012 | 2012 | 2013 | |||||||||
| |
|
|
(unaudited) |
||||||||||
Technology and development |
$ | 507 | $ | 422 | $ | 115 | $ | 115 | |||||
Sales and marketing |
670 | 1,020 | 292 | 279 | |||||||||
General and administrative |
1,706 | 1,477 | 393 | 345 | |||||||||
|
$ | 2,883 | $ | 2,919 | $ | 800 | $ | 739 | |||||
F-29
Tremor Video, Inc.
Notes to Consolidated Financial Statements (Continued)
(in thousands, except share and per share data)
12. Stock-Based Compensation (Continued)
Stock-Based Incentive Plans
The Company has option awards outstanding under four stock-based incentive plans as of December 31, 2012 and March 31, 2013, including two plans that were assumed as part of the acquisition of ScanScout. Generally, when an option is exercised, new common shares are issued by the Company under all plans.
ScanScout Stock Incentive Plans
ScanScout's 2006 Stock Incentive Plan (the 2006 SSI Plan) was adopted by ScanScout's Board of Directors and became effective in April, 2006. In August 2009, ScanScout's 2009 Stock Incentive Plan (the 2009 SSI Plan) was adopted by ScanScout's Board of Directors. At the acquisition date there were total options outstanding for the purchase of 3,325,268 common shares of ScanScout under the plans. As part of the acquisition, those awards were converted into options for the purchase of 1,623,771 shares of the Company's Series II common stock in accordance with the merger agreement. As of each December 31, 2012 and March 31, 2013, there were 1,266,883 options outstanding under these assumed plans. The Company does not intend to issue any additional shares under these plans.
2006 and 2008 Stock Incentive Plans
The Company's 2006 Stock Incentive Plan (the 2006 Plan) was adopted by the Board of Directors and became effective in September, 2006. The Company's 2008 Stock Incentive Plan (the 2008 Plan) was adopted by the Board of Directors and became effective in May, 2008. As of December 31, 2012, there were outstanding options to purchase 393,531 and 5,219,505 shares and 0 and 590,961 shares available for issuance under the 2006 and 2008 plans, respectively. As of March 31, 2013, there were outstanding options to purchase 380,198 and 5,355,322 shares and 0 and 439,950 shares available for issuance under the 2006 and 2008 plans, respectively.
Plan Provisions Under the 2008 Plan
Subsequent to the acquisition of ScanScout, the Board of Directors decided that the 2008 plan would be the only plan that will issue stock-based awards on a going forward basis. The 2008 plan provides for the awards of incentive stock options, non-qualified stock options, restricted stock and other stock-based awards; however, only common stock options have been issued to date under the plan. The 2008 plan states that awards may be granted to such non-employee directors, officers, employees and consultants as the Board of Directors shall in its discretion select. Only employees of the Company are eligible to receive grants of incentive stock options. Options are generally granted at the fair market value of the Company's common stock on the date of grant. Option grants generally vest over periods up to four years, with the first 25% of the grant vesting after one year, and monthly vesting thereafter. Grants generally have total terms not to exceed 10 years.
F-30
Tremor Video, Inc.
Notes to Consolidated Financial Statements (Continued)
(in thousands, except share and per share data)
12. Stock-Based Compensation (Continued)
Options Outstanding
The following table presents summary information of option awards outstanding and exercisable under all plans as of December 31, 2012:
Range of Exercise prices
|
Outstanding | Remaining Life (In Years) |
Exercise Price |
Exercisable | Remaining Life (In Years) |
Exercise Price |
|||||||||||||
|---|---|---|---|---|---|---|---|---|---|---|---|---|---|---|---|---|---|---|---|
$0.20 to $0.53 |
431,064 | 4.59 | $ | 0.26 | 431,064 | 4.59 | $ | 0.26 | |||||||||||
$0.63 to $0.84 |
594,642 | 5.51 | $ | 0.81 | 594,642 | 5.51 | $ | 0.81 | |||||||||||
$1.11 to $1.43 |
1,042,445 | 7.54 | $ | 1.19 | 880,109 | 7.54 | $ | 1.19 | |||||||||||
$1.49 to $2.66 |
477,944 | 7.83 | $ | 1.79 | 437,711 | 7.86 | $ | 1.70 | |||||||||||
$4.28 to $5.60 |
4,333,824 | 8.58 | $ | 4.62 | 1,551,916 | 8.23 | $ | 4.38 | |||||||||||
|
6,879,919 | 7.86 | $ | 3.30 | 3,895,442 | 7.21 | $ | 2.36 | |||||||||||
The following table presents a summary of the Company's stock option activity under all plans and related information, without regard for estimated forfeitures, for the year ended December 31, 2012 and three months ended March 31, 2013:
| |
Exercisable | Weighted average exercise price |
Non-vested | Weighted average exercise price |
Outstanding | Weighted average exercise price |
|||||||||||||
|---|---|---|---|---|---|---|---|---|---|---|---|---|---|---|---|---|---|---|---|
Options outstanding as of December 31, 2011 |
2,851,888 | $ | 1.58 | 3,875,168 | $ | 4.02 | 6,727,056 | $ | 2.99 | ||||||||||
Options granted |
— | $ | — | 1,117,698 | $ | 5.34 | 1,117,698 | $ | 5.34 | ||||||||||
Options forfeited |
(114,786 | ) | $ | 1.98 | (480,159 | ) | $ | 3.83 | (594,945 | ) | $ | 3.47 | |||||||
Options exercised |
(369,890 | ) | $ | 1.19 | — | $ | — | (369,890 | ) | $ | 1.19 | ||||||||
Options vested |
1,528,230 | $ | 3.56 | (1,528,230 | ) | $ | 3.56 | — | $ | — | |||||||||
Options outstanding as of December 31, 2012 |
3,895,442 | $ | 2.36 | 2,984,477 | $ | 4.55 | 6,879,919 | $ | 3.30 | ||||||||||
Options granted (unaudited) |
— | $ | — | 266,666 | $ | 5.90 | 266,666 | $ | 5.90 | ||||||||||
Options forfeited (unaudited) |
(28,798 | ) | $ | 4.55 | (86,858 | ) | $ | 4.83 | (115,656 | ) | $ | 4.76 | |||||||
Options exercised (unaudited) |
(28,526 | ) | $ | 1.58 | — | $ | — | (28,526 | ) | $ | 1.58 | ||||||||
Options vested (unaudited) |
316,867 | $ | 3.83 | (316,867 | ) | $ | 3.83 | — | $ | — | |||||||||
Options outstanding as of March 31, 2013 (unaudited) |
4,154,985 | $ | 2.46 | 2,847,418 | $ | 4.74 | 7,002,403 | $ | 3.39 | ||||||||||
The weighted average grant date fair values of option awards granted during the years ended December 31, 2011 and 2012 was $2.46 and $2.34, respectively, and $2.66 for the three months ended March 31, 2013. As previously discussed, option awards are generally granted at the fair market value of the Company's common stock on the date of grant, generally vest over periods up to four years, have a one year cliff, and have terms not to exceed 10 years. The total intrinsic values of options exercised during the years ended December 31, 2011 and 2012 was $1,573 and $1,507, respectively, and $123 for the three months ended March 31, 2013. Cash received from options exercised for the years ended December 31, 2011 and 2012 was $344 and $433, respectively, and $46 for the three months ended March 31, 2013.
The total fair value of shares that vested during the years ended December 31, 2011 and 2012 was $439 and $2,855, respectively, and $636 for the three months ended March 31, 2013. There was $5,742 and $5,628 of total unrecognized compensation cost related to non-vested share based compensation
F-31
Tremor Video, Inc.
Notes to Consolidated Financial Statements (Continued)
(in thousands, except share and per share data)
12. Stock-Based Compensation (Continued)
arrangements granted under the Company's equity incentive plans as of December 31, 2012 and March 31, 2013, respectively. This cost, as of each of December 31, 2012 and March 31, 2013, is expected to be recognized over a weighted-average period of 2.60 years. The fair value for options and share awards granted under the stock option plan was estimated at the date of grant using the Black-Scholes option pricing model and the following assumptions for grants during the years ended December 31, 2011 and 2012, and for the three months ended March 31, 2013:
| |
Year Ended December 31, | Three Months Ended March 31, |
||||
|---|---|---|---|---|---|---|
| |
2011 | 2012 | 2013 | |||
| |
|
|
(unaudited) |
|||
Volatility |
54%–56% | 56%–57% | 47% | |||
Risk-free interest rate |
1.36%–2.87% | 0.60%–1.17% | 1.01%–1.03% | |||
Expected life (in years) |
6.77 | 5.12–6.09 | 5.97–6.07 | |||
Dividend yield |
0% | 0% | 0% | |||
13. Income Taxes
The Company's provision for income taxes consists of current state and local taxes with total consideration of $223 and $280 for the years ended 2011 and 2012, respectively. The primary difference between the applicable statutory rate and the effective tax rate is the increase in the Company's valuation allowance against its net operating losses.
Deferred income taxes reflect the net tax effect on temporary differences between the carrying amounts of assets and liabilities for financial reporting purposes and the amounts used for income tax purposes. Deferred tax assets and liabilities consist of the following as of December 31, 2011 and 2012:
| |
December 31 | ||||||
|---|---|---|---|---|---|---|---|
| |
2011 | 2012 | |||||
Deferred tax assets |
|||||||
Net operating losses and tax credits |
$ | 33,587 | $ | 36,168 | |||
Depreciation and amortization |
271 | 220 | |||||
Stock-based compensation |
685 | 1,228 | |||||
Capitalization of research and development and start-up costs |
1,233 | 1,191 | |||||
Bad debt reserves |
413 | 425 | |||||
Deferred rent |
190 | 253 | |||||
Deferred revenue |
— | 86 | |||||
Unrealized gain |
258 | 107 | |||||
Total deferred tax assets |
36,637 | 39,678 | |||||
Deferred tax liabilities |
|||||||
Depreciation and amortization |
(20 | ) | (17 | ) | |||
Intangible assets |
(12,339 | ) | (9,983 | ) | |||
Other |
(7 | ) | (7 | ) | |||
Total deferred tax liabilities |
(12,366 | ) | (10,007 | ) | |||
F-32
Tremor Video, Inc.
Notes to Consolidated Financial Statements (Continued)
(in thousands, except share and per share data)
13. Income Taxes (Continued)
| |
December 31 | ||||||
|---|---|---|---|---|---|---|---|
| |
2011 | 2012 | |||||
Deferred tax assets, net |
24,271 | 29,671 | |||||
Valuation allowance |
(24,271 | ) | (29,671 | ) | |||
Deferred tax liability, net of valuation allowance |
$ | — | $ | — | |||
The Company has evaluated the need for a valuation allowance on a jurisdiction by jurisdiction basis. The Company has considered all available evidence, both positive and negative, and based upon the weight of the available evidence, a valuation allowance has been recorded against the net deferred tax assets since the Company cannot be assured that, more likely than not, such amounts will be realized. The Company's valuation allowance has been allocated on the balance sheet between current and noncurrent deferred tax assets based on a pro-rata basis. As such, as of December 31, 2011, the Company's net noncurrent deferred tax assets and current deferred tax liabilities were $1,752 and $1,752, respectively. At December 31, 2012, the Company's net noncurrent deferred tax assets and current deferred tax liabilities were $1,695 and $1,695, respectively.
As of December 31, 2012, the Company has federal and state net operating loss carry-forwards of approximately $81,149, and UK and German net operating loss carry-forwards of $3,554 and $6,709, respectively, which are available to reduce future taxable income in those jurisdictions. The federal net operating loss will expire in years 2026 through 2031. The majority of this amount represents acquired tax loss carry-forwards of Transpera and ScanScout, which are subject to limitation on future utilization under Section 382 of the Internal Revenue Code of 1986. Section 382 imposes limitations on the availability of a company's net operating losses after a more than 50 percentage point ownership change occurs. It is estimated that the effect of Section 382 will generally limit the amount of the net operating loss carry-forwards of Transpera and ScanScout that are available to offset future taxable income to approximately $160 and $2,220 annually. The overall determination of the annual loss limitation is subject to interpretation, and, therefore, the annual loss limitation could be subject to change.
Included in the U.S. federal and state net operating loss carry-forwards, but not included in the table above are approximately $1,740 of net operating losses from excess tax deductions attributable to equity compensation. The tax benefit of the excess tax deduction attributable to equity compensation will be recorded to additional-paid-in-capital when it reduces federal income taxes payable.
There were no tax positions for which it is reasonably possible that the total amount of unrecognized tax benefits will significantly increase or decrease within the years ended December 31, 2011 and 2012. As of December 31, 2011 and 2012, the primary tax jurisdictions in which the Company is subject to tax were the U.S. federal and states (primarily New York), the UK, Germany, Canada and Singapore. Since the Company is in a loss carry-forward position, the Company is generally subject to US federal and state income tax examinations by tax authorities for all years for which a loss carry-forward is available. The Company's open tax years extend back to 2005. In the event that the Company concludes that it is subject to interest or penalties arising from uncertain tax positions, the Company will record interest and penalties as a component of other income and expense. No amounts of interest or penalties were recognized in the consolidated financial statements for the years ended December 31, 2011 and 2012.
F-33
Tremor Video, Inc.
Notes to Consolidated Financial Statements (Continued)
(in thousands, except share and per share data)
14. Net Loss per Common Stock
Diluted loss per common share is the same as basic loss per common share for all periods presented because the effects of potentially dilutive items were anti-dilutive given the Company's net loss. The following securities have been excluded from the calculation of weighted average common shares outstanding because the effect is anti-dilutive:
| |
Year Ended December 31, | Three Months Ended March 31, |
|||||||||||
|---|---|---|---|---|---|---|---|---|---|---|---|---|---|
| |
2011 | 2012 | 2012 | 2013 | |||||||||
| |
|
|
(unaudited) |
||||||||||
Mandatorily redeemable convertible preferred stock |
32,563,192 | 32,563,192 | 32,563,192 | 32,563,192 | |||||||||
Stock options |
6,727,056 | 6,879,919 | 6,770,496 | 7,002,403 | |||||||||
Warrants for mandatorily redeemable convertible preferred stock |
140,933 | 140,933 | 140,933 | 140,933 | |||||||||
|
39,431,181 | 39,584,044 | 39,474,621 | 39,706,528 | |||||||||
Computation of basic and diluted net loss per share is as follows:
| |
Year Ended December 31, | Three Months Ended March 31, |
|||||||||||
|---|---|---|---|---|---|---|---|---|---|---|---|---|---|
| |
2011 | 2012 | 2012 | 2013 | |||||||||
| |
|
|
(unaudited) |
||||||||||
Numerator: |
|||||||||||||
Numerator for basic and diluted loss per share |
$ | (21,025 | ) | $ | (16,644 | ) | $ | (9,127 | ) | $ | (5,159 | ) | |
Denominator: |
|||||||||||||
Weighted average common shares outstanding for basic and diluted loss per share |
6,952,952 | 7,499,986 | 7,318,320 | 7,729,218 | |||||||||
Basic and diluted loss per share |
$ | (3.02 | ) | $ | (2.22 | ) | $ | (1.25 | ) | $ | (0.67 | ) | |
Pro Forma Net Loss Per Common Stock (Unaudited)
The numerator and denominator used in computing pro forma net loss per share for the year ended December 31, 2012 and for the three months ended March 31, 2013 have been adjusted assuming the automatic conversion of all outstanding shares of mandatorily redeemable convertible preferred stock into shares of common stock, which includes 659,862 shares issued upon the conversion of the Series F preferred stock as a result of an assumed IPO price of $12.00 per share from the ratchet provision (see note 11) on the first day of each respective period and the reclassification of the
F-34
Tremor Video, Inc.
Notes to Consolidated Financial Statements (Continued)
(in thousands, except share and per share data)
14. Net Loss per Common Stock (Continued)
outstanding warrants for purchase of mandatorily redeemable convertible preferred stock to additional paid-in capital as of the first day of each respective period.
| |
Year Ended December 31, 2012 |
Three Months Ended March 31, 2013 |
|||||
|---|---|---|---|---|---|---|---|
Numerator (in thousands): |
|||||||
Historical net loss attributable to common shareholders |
$ | (16,644 | ) | $ | (5,159 | ) | |
Plus: mark-to-market expense |
(229 | ) | (234 | ) | |||
Plus: deemed dividend on Series F Preferred Stock |
(7,918 | ) | (7,918 | ) | |||
Pro forma numerator for basic and diluted loss per share |
$ | (24,791 | ) | $ | (13,311 | ) | |
Denominator: |
|||||||
Historical denominator for basic and diluted net loss per share-weighted average shares |
7,499,986 | 7,729,218 | |||||
Plus: conversion of mandatorily redeemable convertible preferred stock to common stock |
33,247,315 | 33,247,315 | |||||
Pro forma denominator for basic and diluted loss per share |
40,747,301 | 40,976,533 | |||||
Pro forma basic and diluted loss per share |
$ | (0.61 | ) | $ | (0.32 | ) | |
15. Segment and Geographic Information
Operating segments are defined as components of an enterprise about which separate financial information is available that is evaluated regularly by the chief operating decision maker, in deciding how to allocate resources and assess performance. The Company's chief operating decision maker is its Chief Executive Officer (CEO). The CEO reviews financial information presented on a consolidated basis for purposes of allocating resources and evaluating financial performance. As such, the Company has concluded that its operations constitute one operating and reportable segment.
Substantially all assets were held in the United States at December 31, 2011 and 2012, and at March 31, 2013. The following table summarizes revenue generated through sales personnel employed
F-35
Tremor Video, Inc.
Notes to Consolidated Financial Statements (Continued)
(in thousands, except share and per share data)
15. Segment and Geographic Information (Continued)
by the Company's U.S. and non-U.S. subsidiaries for the years ended December 31, 2011 and 2012, and for the three months ended March 31, 2012 and 2013:
| |
Year Ended December 31, | Three Months Ended March 31, |
|||||||||||
|---|---|---|---|---|---|---|---|---|---|---|---|---|---|
| |
2011 | 2012 | 2012 | 2013 | |||||||||
| |
|
|
(unaudited) |
||||||||||
Revenue: |
|||||||||||||
Domestic |
$ | 86,278 | $ | 100,811 | $ | 16,189 | $ | 23,919 | |||||
International |
4,023 | 4,379 | 1,083 | 846 | |||||||||
|
$ | 90,301 | $ | 105,190 | $ | 17,272 | $ | 24,765 | |||||
16. Employee Benefit Plan
The Company maintains a defined contribution retirement plan (the Plan) available to eligible employees under Section 401(k) of the U.S. Internal Revenue Code. Employees may elect to defer a percentage of their annual compensation up to amounts prescribed by law. The Company has not made matching contributions to the Plan for the years ended December 31, 2011 and 2012, and for the three months ended March 31, 2012 and 2013.
17. Subsequent Events
On June 13, 2013, the Company's board of directors and stockholders approved an amendment to the Company's amended and restated certificate of incorporation effecting a 1-for-1.5 reverse stock split of the Company's issued and outstanding shares of common stock and the renaming of the Series I common stock to common stock. The par value of the common stock was not adjusted as a result of the reverse stock split. All issued and outstanding common stock and per share amounts contained in the Company's consolidated financial statements have been retroactively adjusted to reflect this reverse stock split and the renaming of the "Series I Common Stock" to "Common Stock" for all periods presented. The reverse stock split was effected on June 13, 2013.
With respect to the retroactive adjustment to reflect the Company's reverse stock split and the renaming of the "Series I Common Stock" to "Common Stock", the Company has evaluated subsequent events through June 13, 2013, the date the audited financial statements were re-issued.
F-36
PART II
INFORMATION NOT REQUIRED IN PROSPECTUS
Item 13. Other Expenses of Issuance and Distribution.
The following table sets forth all costs and expenses, other than underwriting discounts and commissions, in connection with the sale of the common stock being registered. All amounts shown are estimates except for the SEC registration fee and the Financial Industry Regulatory Authority, or FINRA, filing fee.
| |
Amount to be Paid |
|||
|---|---|---|---|---|
SEC registration fee |
$ | 15,300 | ||
FINRA filing fee |
17,319 | |||
Stock exchange initial listing fee |
271,000 | |||
Blue sky fees and expenses |
10,000 | |||
Printing and engraving |
200,000 | |||
Legal fees and expenses |
1,200,000 | |||
Accounting fees and expenses |
800,000 | |||
Transfer agent and registrar fees |
20,000 | |||
Miscellaneous fees and expenses |
283,000 | |||
Total |
$ | 2,816,619 | ||
Item 14. Indemnification of Directors and Officers.
We are incorporated under the laws of the State of Delaware. Section 102 of the Delaware General Corporation Law permits a corporation to eliminate the personal liability of directors of a corporation to the corporation or its stockholders for monetary damages for a breach of fiduciary duty as a director, except where the director breached his or her duty of loyalty, failed to act in good faith, engaged in intentional misconduct or knowingly violated a law, authorized the payment of a dividend or approved a stock repurchase in violation of Delaware corporate law or obtained an improper personal benefit.
Section 145 of the Delaware General Corporation Law provides that a corporation has the power to indemnify a director, officer, employee or agent of the corporation and certain other persons serving at the request of the corporation in related capacities against expenses (including attorneys' fees), judgments, fines and amounts paid in settlements actually and reasonably incurred by the person in connection with an action, suit or proceeding to which he is or is threatened to be made a party by reason of such position, if such person acted in good faith and in a manner he reasonably believed to be in or not opposed to the best interests of the corporation, and, in any criminal action or proceeding, had no reasonable cause to believe his or her conduct was unlawful, except that, in the case of actions brought by or in the right of the corporation, no indemnification shall be made with respect to any claim, issue or matter as to which such person shall have been adjudged to be liable to the corporation unless and only to the extent that the Court of Chancery or other adjudicating court determines that, despite the adjudication of liability but in view of all of the circumstances of the case, such person is fairly and reasonably entitled to indemnity for such expenses which the Court of Chancery or such other court shall deem proper.
As permitted by the Delaware General Corporation Law, our certificate of incorporation and bylaws provide that: (i) we are required to indemnify our directors to the fullest extent permitted by the Delaware General Corporation Law; (ii) we may, in our discretion, indemnify our officers, employees and agents as set forth in the Delaware General Corporation Law; (iii) we are required, upon satisfaction of certain conditions, to advance all expenses incurred by our directors in connection
II-1
with certain legal proceedings; (iv) the rights conferred in the bylaws are not exclusive; and (v) we are authorized to enter into indemnification agreements with our directors, officers, employees and agents.
We have entered into agreements with our directors that require us to indemnify them against expenses, judgments, fines, settlements and other amounts that any such person becomes legally obligated to pay (including with respect to a derivative action) in connection with any proceeding, whether actual or threatened, to which such person may be made a party by reason of the fact that such person is or was a director or officer of us or any of our affiliates, provided such person acted in good faith and in a manner such person reasonably believed to be in, or not opposed to, our best interests. The indemnification agreements also set forth certain procedures that will apply in the event of a claim for indemnification thereunder. At present, no litigation or proceeding is pending that involves any of our directors or officers regarding which indemnification is sought, nor are we aware of any threatened litigation that may result in claims for indemnification.
We maintain a directors' and officers' liability insurance policy. The policy insures directors and officers against unindemnified losses arising from certain wrongful acts in their capacities as directors and officers and reimburses us for those losses for which we have lawfully indemnified the directors and officers. The policy contains various exclusions.
In addition, the underwriting agreement filed as Exhibit 1.1 to this Registration Statement provides for indemnification by the underwriters of us and our officers and directors for certain liabilities arising under the Securities Act, or otherwise. Our sixth amended and restated investors' rights agreement with certain investors also provides for cross-indemnification in connection with the registration of our common stock on behalf of such investors.
Item 15. Recent Sales of Unregistered Securities.
The following list sets forth information regarding all unregistered securities issued by us since January 1, 2010 through the date of the prospectus that is a part of this registration statement.
Issuances of Preferred Stock
In April 2010, we issued an aggregate of 5,453,970 shares of our Series D preferred stock to 16 accredited investors at a per share price of $7.3341, for aggregate consideration of approximately $40.0 million, in reliance on Rule 506 of Regulation D.
In December 2010, we acquired ScanScout, Inc, or ScanScout. In connection with such acquisition, we issued shares of our capital stock to holders of outstanding preferred stock of ScanScout in exchange shares of ScanScout preferred stock as follows: (1) 947,711 shares of our Series 1 preferred stock to 38 accredited investors, (2) 1,821,455 shares of our Series 2 preferred stock to 30 accredited investors, (3) 928,054 shares of our Series 3 preferred stock to 12 accredited investors, and (4) 3,092,932 shares of our Series 4 preferred stock to 9 accredited investors, in each case, in reliance upon Rule 506 of Regulation D.
In December 2010, in connection with our acquisition of ScanScout, we sold an aggregate of 236,108 shares of our Series E preferred stock to 9 accredited investors at a per share price of $8.0051, for aggregate consideration of approximately $1.9 million, in reliance upon Rule 506 of Regulation D.
In September 2011, we issued an aggregate of 3,965,126 shares of our Series F preferred stock to 15 accredited investors at a per share price of $9.3314, for aggregate consideration of approximately $37.0 million, in reliance on Rule 506 of Regulation D.
II-2
Issuances of Common Stock and Options to Purchase Common Stock
From January 1, 2010 through the date of this prospectus, we have granted under our 2008 plan options to purchase an aggregate of 6,548,344 shares of our common stock to employees, consultants and directors, having exercise prices ranging from $1.43 to $8.15 per share and have granted one restricted stock award for 4,232 shares of our common stock to a consultant for $0.255 per share. Of these, options to purchase an aggregate of 1,453,025 shares have been cancelled without being exercised. During the period from January 1, 2010 through the date of this prospectus, (1) an aggregate of 1,122,462 shares of our common stock were issued upon the exercise of stock options under the 2006 plan and 2008 plan, at exercise prices between $0.195 and $5.01 per share, for aggregate proceeds of approximately $978,676 and (2) an aggregate of 219,329 shares of our Series II common stock were issued upon the exercise of stock options under the ScanScout 2009 plan and ScanScout 2006 plan, at exercise prices between $0.26 and $1.49 per share, with aggregate proceeds of approximately $175,032.
The offers, sales and issuances of the securities described in the preceding paragraph were exempt from registration under Rule 701 promulgated under the Securities Act in that the transactions were by an issuer not involving any public offering or under Section 4(2) of the Securities Act or under compensatory benefit plans and contracts relating to compensation as provided under Rule 701. The recipients of such securities were our employees, directors or consultants and received the securities under our equity incentive plans. Appropriate legends were affixed to the securities issued in these transactions.
In connection with our acquisition of ScanScout in December 2010, we issued 1,662,122 shares of our Series II common stock to 13 holders of, and in exchange for, outstanding shares of ScanScout in reliance on Rule 506 of Regulation D.
In connection with our acquisition of Transpera in February 2011, we issued 845,657 shares of our common stock to 12 holders of, and in exchange for, outstanding shares of Transpera in reliance on Rule 506 of Regulation D.
Issuances of Warrants
In connection with the acquisition of ScanScout in December 2010, we exchanged ScanScout warrants for ScanScout preferred stock for warrants to purchase our preferred stock. The following warrants were issued in connection with such exchange: (1) a warrant to acquire 31,130 shares of our Series 1 preferred stock at a per share exercise price of $2.46 issued to one investor; and (2) a warrant to acquire 8,694 shares of our Series 3 preferred stock at a per share exercise price of $5.75 per share issued to one investor. These warrants were issued in reliance on Rule 506 of Regulation D.
In February 2010, we issued a warrant to acquire 31,659 shares of our Series C preferred stock at a per share exercise price of $3.795 per share to an investor in connection with a debt financing. This warrant was issued in reliance on Rule 506 of Regulation D.
The recipients of the securities in these transactions represented their intentions to acquire the securities for investment only and not with a view to or for sale in connection with any distribution thereof, and appropriate legends were placed upon the stock certificates issued in these transactions. All recipients had adequate access, through their relationships with us, to information about us. The sales of these securities were made without any general solicitation or advertising.
II-3
Item 16. Exhibits and Financial Statement Schedules.
(a) Exhibits
| Exhibit Number |
Description of Document | ||
|---|---|---|---|
| 1.1 | Form of Underwriting Agreement. | ||
| 3.1 | Amended and Restated Certificate of Incorporation, as amended to date and as currently in effect. | ||
| 3.2 | Form of Amended and Restated Certificate of Incorporation to be effective upon completion of this offering. | ||
| 3.3 | Bylaws, as amended to date and as currently in effect. | ||
| 3.4 | Form of Amended and Restated Bylaws to be effective upon completion of this offering. | ||
| 4.1 | Specimen stock certificate evidencing shares of common stock. | ||
| 4.2* | Warrant to Purchase Series 1 Preferred Stock issued by ScanScout, Inc. to Venture Lending & Leasing IV, LLC, dated December 7, 2006. | ||
| 4.3* | Warrant to Purchase Series 3 Preferred Stock issued by ScanScout, Inc. to Comerica Bank, dated February 6, 2008. | ||
| 4.4* | Warrant to purchase shares of Series A Preferred Stock issued by Registrant to Silicon Valley Bank, dated June 7, 2007. | ||
| 4.5* | Warrant to purchase shares of Series B-1 Preferred Stock issued by Registrant to Silicon Valley Bank, dated December 8, 2008. | ||
| 4.6* | Warrant to purchase shares of Series C Preferred Stock issued by Registrant to Silicon Valley Bank, dated February 8, 2010. | ||
| 5.1 | Opinion of Cooley LLP as to legality. | ||
| 10.1* | Sixth Amended and Restated Investors' Rights Agreement by and among the Registrant and certain of its stockholders, dated as of September 6, 2011. | ||
| 10.2* | Loan and Security Agreement by and between the Registrant and Silicon Valley Bank, dated as of June 7, 2007 (as modified by each of the First Loan Modification Agreement dated December 8, 2008, the Second Loan Modification Agreement dated as of December 7, 2009, the Third Loan Modification Agreement dated as of February 7, 2010, the Fourth Loan Modification Agreement dated as of February 7, 2011 and the Fifth Loan Modification Agreement dated as of December 30, 2011). | ||
| 10.3* | Agreement of Lease by and between the Registrant and Twenty-Three R.P. Associates, dated as of July 26, 2010 (as modified by the First Amendment to Lease dated November 1, 2010). | ||
| 10.4+* | Tremor Media, Inc. 2006 Stock Incentive Plan, as amended. | ||
| 10.5+* | Form of Stock Option Agreement under Tremor Media, Inc. 2006 Stock Incentive Plan. | ||
| 10.6+* | Tremor Media, Inc. 2008 Stock Plan, as amended. | ||
| 10.7+* | Form of Stock Option Agreement under Tremor Media, Inc. 2008 Stock Plan. | ||
| 10.8+* | ScanScout, Inc. 2006 Stock Plan. | ||
| 10.9+* | Form of Stock Option Agreement under ScanScout, Inc. 2006 Stock Plan. | ||
| 10.10+* | ScanScout, Inc. 2009 Equity Incentive Plan. | ||
| 10.11+* | Form of Stock Option Agreement under ScanScout, Inc. 2009 Equity Incentive Plan. | ||
| 10.12+ | Form of 2013 Equity Incentive Plan. | ||
| 10.13+ | Form of Incentive Stock Option Agreement under 2013 Equity Incentive Plan. | ||
| 10.14+ | Form of Nonqualified Stock Option Agreement under 2013 Equity Incentive Plan. | ||
| 10.15+ | Form of Restricted Stock Unit Award Agreement under 2013 Equity Incentive Plan. | ||
| 10.16+ | Form of Restricted Stock Unit Grant Notice under 2013 Equity Incentive Plan. | ||
| 10.17+ | Non-Employee Director Compensation Plan to be in effect upon the completion of this offering. | ||
| 10.18+* | Form of Indemnification Agreement by and between Registrant and each of its directors and executive officers. | ||
| 10.19+* | Employment Offer Letter by and between the Company and William Day, dated December 9, 2010. | ||
| 10.20+* | Employment Offer Letter by and between the Company and Todd Sloan, dated November 14, 2011. | ||
II-4
| Exhibit Number |
Description of Document | ||
|---|---|---|---|
| 10.21+* | Employment Offer Letter by and between the Company and Steven Lee, dated December 9, 2010. | ||
| 10.22+* | Employment Offer Letter by and between the Company and Adam Lichstein, dated December 8, 2010. | ||
| 10.23+* | Employment Offer Letter by and between the Company and Lauren Wiener, dated September 25, 2012. | ||
| 10.24+* | Employment Offer Letter by and between the Company and Randy Kilgore, dated September 6, 2006. | ||
| 16.1* | Letter from PricewaterhouseCoopers LLP to the Securities and Exchange Commission dated April 2, 2013. | ||
| 21.1* | Subsidiaries of the Registrant. | ||
| 23.1 | Consent of Ernst & Young LLP, independent registered public accounting firm. | ||
| 23.2 | Consent of Cooley LLP (included in Exhibit 5.1). | ||
| 24.1* | Power of Attorney. Reference is made to the signature page hereto. | ||
- +
- Indicates management contract or compensatory plan.
- *
- Previously filed.
The undersigned Registrant hereby undertakes to provide to the underwriters at the closing specified in the underwriting agreement, certificates in such denominations and registered in such names as required by the underwriters to permit prompt delivery to each purchaser.
Insofar as indemnification for liabilities arising under the Securities Act may be permitted to directors, officers and controlling persons of the registrant pursuant to the foregoing provisions, or otherwise, the registrant has been advised that in the opinion of the Securities and Exchange Commission such indemnification is against public policy as expressed in the Securities Act and is, therefore, unenforceable. In the event that a claim for indemnification against such liabilities (other than the payment by the registrant of expenses incurred or paid by a director, officer or controlling person of the registrant in the successful defense of any action, suit or proceeding) is asserted by such director, officer or controlling person in connection with the securities being registered, the registrant will, unless in the opinion of its counsel the matter has been settled by controlling precedent, submit to a court of appropriate jurisdiction the question whether such indemnification by it is against public policy as expressed in the Securities Act and will be governed by the final adjudication of such issue.
The undersigned registrant hereby undertakes that:
- (1)
- For
purposes of determining any liability under the Securities Act, the information omitted from the form of prospectus filed as part of this Registration
Statement in reliance upon Rule 430A and contained in a form of prospectus filed by the registrant pursuant to Rule 424(b)(1) or (4) or 497(h) under the Securities Act shall be
deemed to be part of this Registration Statement as of the time it was declared effective.
- (2)
- For the purpose of determining any liability under the Securities Act, each post-effective amendment that contains a form of prospectus shall be deemed to be a new registration statement relating to the securities offered therein, and the offering of such securities at that time shall be deemed to be the initial bona fide offering thereof.
II-5
Pursuant to the requirements of the Securities Act, the Registrant has duly caused this Registration Statement to be signed on its behalf by the undersigned, thereunto duly authorized, in the City of New York, State of New York, on the 14th day of June 2013.
| TREMOR VIDEO, INC. | ||||
By: |
/s/ WILLIAM DAY William Day President and Chief Executive Officer |
|||
KNOW ALL BY THESE PRESENTS, that each person whose signature appears below hereby constitutes and appoints William Day, Todd Sloan and Adam Lichstein, and each of them, his true and lawful agent, proxy and attorney-in-fact, with full power of substitution and resubstitution, for him and in his name, place and stead, in any and all capacities, to (i) act on, sign and file with the Securities and Exchange Commission any and all amendments (including post-effective amendments) to this registration statement together with all schedules and exhibits thereto and any subsequent registration statement filed pursuant to Rule 462(b) under the Securities Act of 1933, as amended, together with all schedules and exhibits thereto, (ii) act on, sign and file such certificates, instruments, agreements and other documents as may be necessary or appropriate in connection therewith, (iii) act on and file any supplement to any prospectus included in this registration statement or any such amendment or any subsequent registration statement filed pursuant to Rule 462(b) under the Securities Act of 1933, as amended, and (iv) take any and all actions which may be necessary or appropriate to be done, as fully for all intents and purposes as he might or could do in person, hereby approving, ratifying and confirming all that such agent, proxy and attorney-in-fact or any of his substitutes may lawfully do or cause to be done by virtue thereof.
Pursuant to the requirements of the Securities Act, this Registration Statement has been signed by the following persons in the capacities and on the dates indicated.
Signature
|
Title
|
Date
|
||||
|---|---|---|---|---|---|---|
| /s/ WILLIAM DAY William Day |
President, Chief Executive Officer and Director (Principal Executive Officer) |
June 14, 2013 | ||||
/s/ TODD SLOAN Todd Sloan |
Senior Vice President, Chief Financial Officer and Treasurer (Principal Accounting and Financial Officer) |
June 14, 2013 |
||||
* Laura Desmond |
Director |
June 14, 2013 |
||||
* Randall Glein |
Director |
June 14, 2013 |
||||
II-6
Signature
|
Title
|
Date
|
||||
|---|---|---|---|---|---|---|
| /s/ RACHEL LAM Rachel Lam |
Director | June 14, 2013 | ||||
* Warren Lee |
Director |
June 14, 2013 |
||||
* James Rossman |
Director |
June 14, 2013 |
||||
/s/ ROBERT SCHECHTER Robert Schechter |
Director |
June 14, 2013 |
||||
*By: |
/s/ WILLIAM DAY William Day Attorney-in-fact |
|||||
II-7
Exhibit Number |
Description of Document | ||
|---|---|---|---|
| 1.1 | Form of Underwriting Agreement. | ||
| 3.1 | Amended and Restated Certificate of Incorporation, as amended to date and as currently in effect. | ||
| 3.2 | Form of Amended and Restated Certificate of Incorporation to be effective upon completion of this offering. | ||
| 3.3 | Bylaws, as amended to date and as currently in effect. | ||
| 3.4 | Form of Amended and Restated Bylaws to be effective upon completion of this offering. | ||
| 4.1 | Specimen stock certificate evidencing shares of common stock. | ||
| 4.2* | Warrant to Purchase Series 1 Preferred Stock issued by ScanScout, Inc. to Venture Lending & Leasing IV, LLC, dated December 7, 2006. | ||
| 4.3* | Warrant to Purchase Series 3 Preferred Stock issued by ScanScout, Inc. to Comerica Bank, dated February 6, 2008. | ||
| 4.4* | Warrant to purchase shares of Series A Preferred Stock issued by Registrant to Silicon Valley Bank, dated June 7, 2007. | ||
| 4.5* | Warrant to purchase shares of Series B-1 Preferred Stock issued by Registrant to Silicon Valley Bank, dated December 8, 2008. | ||
| 4.6* | Warrant to purchase shares of Series C Preferred Stock issued by Registrant to Silicon Valley Bank, dated February 8, 2010. | ||
| 5.1 | Opinion of Cooley LLP as to legality. | ||
| 10.1* | Sixth Amended and Restated Investors' Rights Agreement by and among the Registrant and certain of its stockholders, dated as of September 6, 2011. | ||
| 10.2* | Loan and Security Agreement by and between the Registrant and Silicon Valley Bank, dated as of June 7, 2007 (as modified by each of the First Loan Modification Agreement dated December 8, 2008, the Second Loan Modification Agreement dated as of December 7, 2009, the Third Loan Modification Agreement dated as of February 7, 2010, the Fourth Loan Modification Agreement dated as of February 7, 2011 and the Fifth Loan Modification Agreement dated as of December 30, 2011). | ||
| 10.3* | Agreement of Lease by and between the Registrant and Twenty-Three R.P. Associates, dated as of July 26, 2010 (as modified by the First Amendment to Lease dated November 1, 2010). | ||
| 10.4+* | Tremor Media, Inc. 2006 Stock Incentive Plan, as amended. | ||
| 10.5+* | Form of Stock Option Agreement under Tremor Media, Inc. 2006 Stock Incentive Plan. | ||
| 10.6+* | Tremor Media, Inc. 2008 Stock Plan, as amended. | ||
| 10.7+* | Form of Stock Option Agreement under Tremor Media, Inc. 2008 Stock Plan. | ||
| 10.8+* | ScanScout, Inc. 2006 Stock Plan. | ||
| 10.9+* | Form of Stock Option Agreement under ScanScout, Inc. 2006 Stock Plan. | ||
| 10.10+* | ScanScout, Inc. 2009 Equity Incentive Plan. | ||
| 10.11+* | Form of Stock Option Agreement under ScanScout, Inc. 2009 Equity Incentive Plan. | ||
| 10.12+ | Form of 2013 Equity Incentive Plan. | ||
| 10.13+ | Form of Incentive Stock Option Agreement under 2013 Equity Incentive Plan. | ||
| 10.14+ | Form of Nonqualified Stock Option Agreement under 2013 Equity Incentive Plan. | ||
| 10.15+ | Form of Restricted Stock Unit Award Agreement under 2013 Equity Incentive Plan. | ||
| 10.16+ | Form of Restricted Stock Unit Grant Notice under 2013 Equity Incentive Plan. | ||
| 10.17+ | Non-Employee Director Compensation Plan to be in effect upon the completion of this offering. | ||
| 10.18+* | Form of Indemnification Agreement by and between Registrant and each of its directors and executive officers. | ||
| 10.19+* | Employment Offer Letter by and between the Company and William Day, dated December 9, 2010. | ||
| 10.20+* | Employment Offer Letter by and between the Company and Todd Sloan, dated November 14, 2011. | ||
| 10.21+* | Employment Offer Letter by and between the Company and Steven Lee, dated December 9, 2010. | ||
II-8
Exhibit Number |
Description of Document | ||
|---|---|---|---|
| 10.22+* | Employment Offer Letter by and between the Company and Adam Lichstein, dated December 8, 2010. | ||
| 10.23+* | Employment Offer Letter by and between the Company and Lauren Wiener, dated September 25, 2012. | ||
| 10.24+* | Employment Offer Letter by and between the Company and Randy Kilgore, dated September 6, 2006. | ||
| 16.1* | Letter from PricewaterhouseCoopers LLP to the Securities and Exchange Commission dated April 2, 2013. | ||
| 21.1* | Subsidiaries of the Registrant. | ||
| 23.1 | Consent of Ernst & Young LLP, independent registered public accounting firm. | ||
| 23.2 | Consent of Cooley LLP (included in Exhibit 5.1). | ||
| 24.1* | Power of Attorney. Reference is made to the signature page hereto. | ||
- +
- Indicates management contract or compensatory plan.
- *
- Previously filed.
II-9