Attached files
| file | filename |
|---|---|
| 8-K - FORM 8-K - DITECH HOLDING Corp | d552864d8k.htm |
 Morgan Stanley Financials Conference
June 12, 2013
0
Exhibit 99.1 |
 Forward-Looking Statements and Non-GAAP
Financial Measures
1
This document contains forward-looking statements, including forward-looking statements within
the meaning of the Private Securities Litigation Reform Act of 1995. Such forward-looking
statements include, but are not limited to, statements concerning Walter Investment's plans, beliefs, objectives, expectations and
intentions and other statements that are not historical or current facts. Forward-looking statements
are based on Walter Investment's current expectations and involve risks and uncertainties that
could cause actual results to differ materially from those expressed or implied in such forward-looking statements. In addition,
these statements are based on a number of assumptions that are subject to change. Accordingly,
actual results may be materially higher or lower than those projected. The inclusion of such
projections herein should not be regarded as a representation by Walter Investment that the projections will prove to be correct.
This document speaks only as of this date. Walter Investment disclaims any duty to update the
information herein except as otherwise required by law. Factors that could cause Walter Investment's results to differ materially from current expectations or
affect the Company’s ability to achieve anticipated core earnings and EBITDA include, but
are not limited to: •
Regulatory changes and changes in delinquency and default rates that could adversely affect the costs of
our businesses such that they are higher than expected; •
Prepayment speeds, delinquency and default rates of the portfolios we service; •
Our inability to achieve anticipated incentive fees, which are subject to certain factors beyond the
Company’s control and which are difficult to estimate with any degree of certainty in
advance; •
The achievement of anticipated volumes and margins from the origination of both forward and
reverse mortgages, which can be affected by multiple factors, many of which are beyond our
control; •
Assumptions with regard to the HARP eligible population of the portfolios we service, customer
take up rates, our recapture rates, the origination margins for HARP refinancing and anticipated
changes to the HARP program which may increase competition;
•
Assumptions with regard to contributions from originations are also subject to the integration of the
ResCap origination and capital markets platforms, and the organizational structure, capital
requirements and performance of the business after the acquisition;
•
The closing of various business and asset acquisitions on schedule, and the addition of new business in
2013; •
The timely and efficient transfer of assets acquired to the Company’s platforms and the efficient
integration of the acquired businesses, including achievement of synergies related thereto; •
The accuracy of our expectations regarding the value of, and contributions from, acquired MSRs, related
intangibles and other assets, including the accuracy of our assumptions as to the performance of
the assets we acquire, which are subject to and affected by many factors, some of which are beyond our control,
and could differ materially from our estimates; •
Errors in our financial models or changes in assumptions could result in our estimates and expectations
being materially inaccurate which may adversely affect our earnings; •
The effects of competition on our existing and potential future business; •
Our ability to service our existing or future indebtedness; •
Other factors that may affect the Company’s earnings or costs; and •
Other factors relating to our business in general as detailed in Walter Investment's 2012 Annual Report
on Form 10-K and other periodic reports filed with the U.S. Securities and Exchange
Commission. To
supplement Walter Investment’s consolidated financial statements prepared in accordance with GAAP and to better reflect period-over-period comparisons,
Walter Investment uses non-GAAP financial measures of performance, financial position, or cash flows
that either exclude or include amounts that are not normally excluded or included in the most
directly comparable measure, calculated and presented in accordance with GAAP. Non-GAAP financial measures do not replace
and are not superior to the presentation of GAAP financial results, but are provided to (i) measure the
Company’s financial performance excluding depreciation and amortization costs, corporate and
MSR facility interest expense, transaction and merger integration-related costs, certain other non-cash adjustments, the net
impact of the consolidated Non-Residual Trust VIEs and certain other items including, but not
limited to pro-forma synergies, (ii) provide investors a means of evaluating our core
operating performance and (iii) improve overall understanding of Walter Investment’s current financial performance and its prospects for the
future.
Specifically, Walter Investment believes the non-GAAP financial results provide useful
information to both management and investors regarding certain additional financial and business
trends relating to financial condition, operating results and cash flows. In addition, management uses these measures for reviewing financial
results and evaluating financial performance and cash flows. The non-GAAP adjustments for all
periods presented are based upon information and assumptions available as of the date of this
presentation. Reconciliations can be found in the Appendix to this presentation. |
 WAC
- Continued Strong Performance & Execution
2
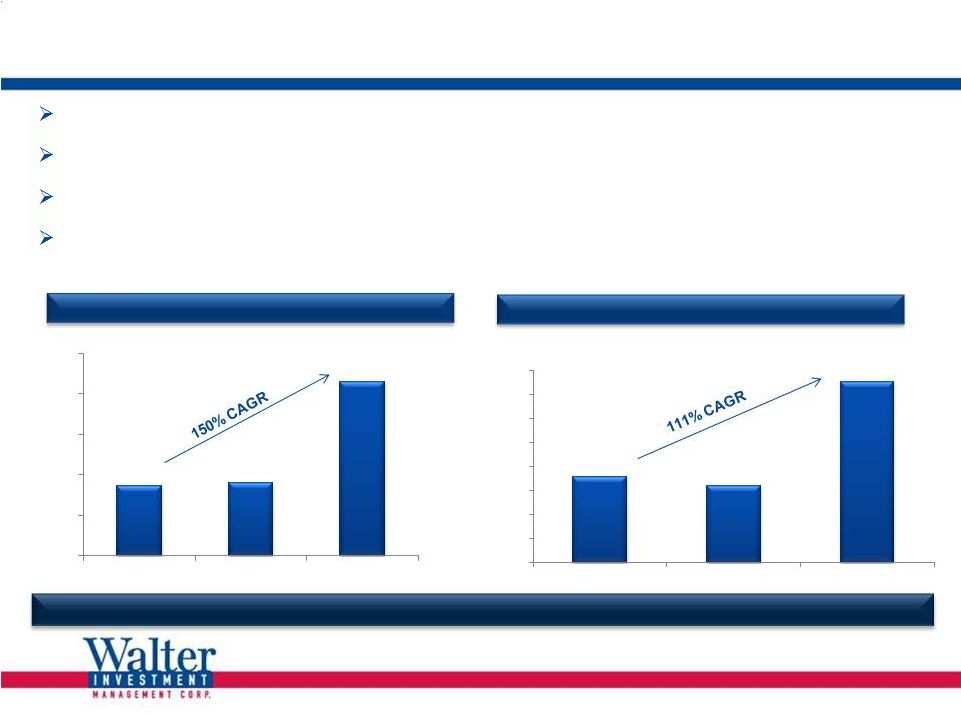
Significant
Growth
in
UPB
Serviced
Core EPS
(1)
Includes both forward and reverse servicing portfolios
$86
$90
$215
$-
$50
$100
$150
$200
$250
Q1 2012
Q4 2012
Q1 2013
$0.71
$0.64
$1.50
$-
$0.20
$0.40
$0.60
$0.80
$1.00
$1.20
$1.40
$1.60
Q1 2012
Q4 2012
Q1 2013
(1)
Walter continues to execute against its strategic plan with strong momentum and record results.
Record Q1 financial results = $140 MN AEBITDA, $27.7 MN GAAP Net Income, $1.50 Core EPS Bank of
America and ResCap MSRs now fully boarded and contributing strongly to earnings
ResCap Originations platform acquired January 31 has ramped quickly in volumes and profits Reverse
Mortgage and other ancillary businesses are making solid contributions in our diversified
mortgage services business model
|
 Sector Fundamentals Continue to Strongly Favor WAC
2013
2018
2017
2016
2015
2014
and Beyond
2010
2015
2014
2013
2012
2011
2016
3
Over $1 trillion of servicing still expected to transfer over the next several years
for all the reasons previously cited
•
•
Regulatory and compliance issues are still critical success factors
•
Barriers to entry are significant
Current servicing pipeline* of over $300 billion remains strong
Fundamental financial and operational performance is great
•
Highly profitable, value-added servicing model
•
FNMA Four Star servicer rating
•
HARP opportunity, valuable originations platform, and other diverse fee-based
ancillary businesses
Other sector and company-specific developments are also strong positives for
WAC •
HARP and HAMP extensions
•
ResCap MSR added to FNMA incentive program
•
Capital availability increasing while cost decreases; near term execution on
external capital vehicle expected
*
“Pipeline” refers to opportunities or potential opportunities in the market for products
within our strategic profile that we have identified as targets to add to our servicing portfolio through either
the acquisition of MSR or sub-servicing contracts. In each case we have contacted the seller
or its representative to register our interest, or are currently engaged in discussions or negotiations
directly with the seller or its representative. The status of “pipeline opportunities” varies
from early stage contact through exclusive negotiations. There can be no guarantee that any of the
opportunities in our pipeline will result in purchases or contracts added by the Company.
Market Disruption Phase
2007 -
2013
Aggregation Phase
2010 -
2016
Transition Phase
2013 and Beyond
Depositories
are committed to outsourcing “non-core” customers and activities
|
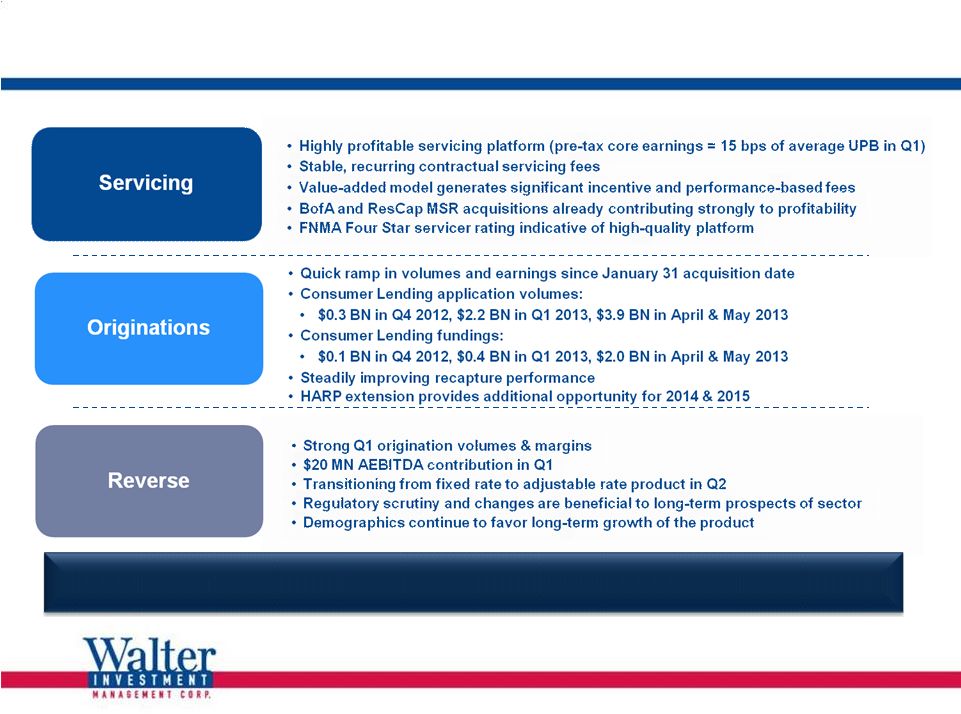 Continued Strong Performance of Core Businesses
4
Positioned well to continue capitalizing on the robust opportunities across the
specialty mortgage sector |
 WAC
Trading at a Significant Discount to Peers Despite Track Record, Performance
and Positioning 5
2013E & 2014E P/E Multiples
(1)
Walter is well positioned to take advantage of the market opportunity and deliver
significant value to shareholders
Demonstrated ability to find value as the sector evolves
Large BofA and ResCap MSR transfers completed; pipeline remains solid
Originations ramp is strong and profitable
Upward interest rate movements factored into guidance
Upside in recapture rates
Reverse and Ancillary businesses performing well; diversified fee-based revenue
streams Servicing segment performance is strong and growing
(1)
Multiples for 2013 and 2014 EPS are composite estimates obtained from First Call as of 6/10/2013. The Company has not and does not confirm or endorse the estimates
reflected herein.
(2)
Peer group consists of OCN, NSM and PHH.
|
 Focus
on Sustainable, Profitable Growth 6
WAC is highly focused on delivering significant returns to shareholders
Solid Financial
Fundamentals
Cyclical and Secular
Industry Shift
Strong Pipeline
Differentiated
Operating Model
•
Strong Q1 2013 results
•
Strong margins across business lines
•
Significant leverage to results in 2013 and 2014 on acquired business
•
Wave of transfers to specialty servicers still occurring
•
Regulatory, capital, operational, and compliance issues all remain catalysts for
servicing transfers
•
Secular shift continues, driving sustainability and
growth •
Robust active pipeline of $300 billion
•
Establishing new client relationships
•
Platform delivers value-added benefits to credit owners
•
Ancillary businesses (ARM, Insurance) deliver additional value and drive increased
revenue •
Addition of Reverse Mortgage and Originations businesses further diversify
revenue streams •
High level of compliance drives preferred partner status
|
 Appendix |
 Reconciliation of GAAP Income Before Income
Taxes to Non-GAAP Core Earnings
($ in millions, except per share amounts)
8
For the Three Months Ended
For the Three Months Ended
For the Three Months Ended
Core Earnings
March 31, 2012
December 31, 2012
March 31, 2013
Income/(loss) before income taxes
8.3
$
(55.1)
$
46.5
$
Add back:
Step-up depreciation and amortization
10.1
10.9
12.9
Step-up amortization of sub-servicing contracts
10.1
9.5
8.1
Non-cash fair value adjustments
-
2.6
3.5
Non-cash interest expense
1.1
4.2
3.0
Share-based compensation expense
4.7
3.0
2.7
Transaction and integration costs
1.4
9.2
16.3
Net impact of Non-Residual Trusts
(3.0)
3.3
(0.5)
Losses on extinguishment of debt
-
48.6
-
Other
0.5
0.1
0.1
Pre-tax core earnings
33.2
$
36.3
$
92.6
$
After-tax core earnings
20.6
$
22.5
$
56.5
$
Shares Outstanding
29.0
34.9
37.6
Core EPS
0.71
$
0.64
$
1.50
$
Please refer to the introductory slides of this presentation, as well as additional disclosures in our
March 31, 2013 Form 10-Q and other filings with the SEC, for important information
regarding Forward-Looking Statements and the use of Non-GAAP Financial Measures.
|