Attached files
| file | filename |
|---|---|
| 8-K - CURRENT REPORT - American Realty Capital Trust IV, Inc. | v347303_8-k.htm |

American Realty Capital Trust IV The Next Stage in the Evolution of our Net Lease Strategy June 2013

2 ARCT IV considers funds from operations (“FFO”) and AFFO, which is FFO as adjusted to exclude acquisition - related fees and expenses, amortization of above - market lease assets and liabilities, amortization of deferred financing costs, straight - line ren t, non - cash mark - to - market adjustments, amortization of restricted stock, non - cash compensation and gains and losses, useful indicators of the performance of a real estate investment trust (“REIT”). Because FFO calculations exclude such factors as depreciation and amortization of real estate assets and gains or losses from sales of operating real estate assets (which can vary among owner s o f identical assets in similar conditions based on historical cost accounting and useful - life estimates), they facilitate compariso ns of operating performance between periods and between other REITs in our peer group. Accounting for real estate assets in accord anc e with generally accepted accounting principles (“GAAP”) implicitly assumes that the value of real estate assets diminishes predictably over time. Since real estate values have historically risen or fallen with market conditions, many industry inves tor s and analysts have considered the presentation of operating results for real estate companies that use historical cost accounting to be insufficient by themselves. FFO and AFFO are not in accordance with, or a substitute for, measures prepared in accordance with GAAP, and may be different from non - GAAP measures used by other companies. In addition, FFO and AFFO are not based on any comprehensive set of accounting rules or principles. Non - GAAP measures, such as FFO and AFFO, have limitations in that they do not reflect all of the amounts associated with ARCT IV 's results of operations that would be reflected in measures determined in accordance with GAAP. These measures should only be used to evaluate ARCT IV's performance in conjunction with corresponding GAAP measures. Additionally, ARCT IV believes that AFFO, by excluding acquisition - related fees and expenses, amortization of above - market lease assets and liabilities, amortization of deferred financing costs, straight - line rent, non - cash mark - to - market adjustments, amort ization of restricted stock, non - cash compensation and gains and losses, provides information consistent with management's analysis of t he operating performance of the properties. By providing AFFO, ARCT IV believes it is presenting useful information that assists investors and analysts to better assess the sustainability of our operating performance. Further, ARCT IV believes AFFO is us efu l in comparing the sustainability of our operating performance with the sustainability of the operating performance of other real est ate companies, including exchange - traded and non - traded REITs. As a result, ARCT IV believes that the use of FFO and AFFO, together with the required GAAP presentations, provide a more complete understanding of our performance relative to our peers and a more informed and appropriate basis on which to make decisions involving operating, financing, and investing activities. Funds from Operations and Adjusted Funds from Operations
3 Forward - Looking Statements Information set forth herein (including information included or incorporated by reference herein) contains “forward - looking statements” (as defined in Section 21 E of the Securities Exchange Act of 1934 , as amended), which reflect ARCT IV 's expectations regarding future events . The forward - looking statements involve a number of risks, uncertainties and other factors that could cause actual results to differ materially from those contained in the forward - looking statements . Such forward - looking statements include, but are not limited to, ARCT IV’s plans, market and other expectations, objectives, intentions, as well as any expectations or projections with respect to ARCT IV, including regarding future dividends and market valuations, and estimates of growth, including funds from operations and adjusted funds from operations, and other statements that are not historical facts . The following additional factors, among others, could cause actual results to differ from those set forth in the forward - looking statements : market volatility, unexpected costs or unexpected liabilities that may arise from the transaction ; the inability to retain key personnel ; continuation or deterioration of current market conditions ; whether or not ARCT IV common stock will be included in REIT and public exchange indices ; uncertainty regarding the level of demand for ARCT IV common stock that inclusion in such indices would generate ; future regulatory or legislative actions that could adversely affect ARCT IV ; and the business plans of the tenants of ARCT IV . Additional factors that may affect future results are contained in ARCT IV 's filings with the SEC, which are available at the SEC's website at www . sec . gov . ARCT IV disclaims any obligation to update and revise statements contained in these materials based on new information or otherwise .

4 Raise Capital Invest Capital Harvest Value It’s All About the Execution
5 ARCT IV’s Investment Objectives ▪ Preservation of Capital – Seeks to preserve and protect capital by investing in what we believe are well - located properties occupied by primarily investment grade and creditworthy tenants (1) ▪ Growth – Seeks to provide for potential appreciation through contractual rent growth ▪ Cash Distributions – Seeks to create durable investor cash flows through regular monthly distributions (2) ARCT IV (1) “Investment grade” is a determination made by major credit rating agencies, and “creditworthy” tenants are as determined by ARCT IV. (2) Distributions are not guaranteed. We may not be able to pay or maintain distributions and they are subject to change at a ny time. Until we generate operating cash flows sufficient to pay distributions, we may pay distributions from the net proceeds of our offering, from our borrowings, or from other sources. Payment of fees to our advisor as well as the payment of operating expenses will reduce cash available for distributions. For the three months ended March 31, 2013, distributions paid to common stockholders totaled $5.8 million. Approximately 55% of such distributions were funded from proceeds from our offering, and approximately 45% of such distributions were reinvested pursuant to our distribution reinvestment plan. ARCT IV ARCT IV

6 Investment Considerations - 986 property GE Capital Portfolio » Established, performing triple net lease portfolio » Long - term leases (weighted average remaining lease duration 10.6 years) » Superior locations with strong sales performance » Dominant brands, proven concepts, experienced operators » Acquired at a cap rate north of 7%

7 ARCT IV’s Legal Counsel and Board of Directors External Counsel Proskauer Rose LLP Maryland Counsel Venable LLP Independent Directors William G. Stanley (Lead) Abby M. Wenzel Elizabeth K. Tuppeny

8 William G . Stanley William G . Stanley is the founder and managing member of Stanley Laman Securities, LLC, a FINRA member broker - dealer, since 2004 , and the founder and president of The Stanley - Laman Group, Ltd (SLG), a registered investment advisor for high net worth clients since 1997 . Mr . Stanley serves on the Advisory Board of Highland Capital’s, High Cap Group . SLG represents some of the wealthiest families in the world and has recently expanded its planning practice to international client matters which are managed using proprietary trading and security selection techniques along with a global economic research . Mr . Stanley has earned designations as a Chartered Financial Consultant, Chartered Life Underwriter, and received his Masters Degree in Financial Services from the American College in 1997 . Mr . Stanley served as an auditor for General Electric Capital from 1977 to 1979 and as a registered representative for Capital Analysts, Inc . of Radnor, Pennsylvania, a national investment advisory firm that specialized in sophisticated planning for high net worth individuals from 1979 to 1991 . • ARCT IV Lead Independent Director • On the Board of ARCT in ARCT - Realty Income (NASDAQ : O) merger in January 2013 ARCT IV’s Independent Directors Abby M . Wenzel • Was appointed as an independent director of our company in March 2012 • She has represented commercial banks, investment banks, insurance companies, and other financial institutions, as well as the equity, in connection with permanent, bridge, and construction loans, as well as senior preferred equity investments, interim financings and mezzanine financings. • Ms. Wenzel currently serves as a trustee on the board of Community Service Society, a 160 - year - old institution with a primary focus on identifying and supporting public policy innovations to support the working poor in New York City to realize social, economic, and political opportunities. Elizabeth K . Tuppeny • Was appointed as an independent director of our company in May 2012 • Has been the chief executive officer and founder of Domus , Inc., a full - service marketing communications agency since 1993. • Has 30 years of experience in the branding and advertising industries, with a focus on Fortune 50 companies • Has served on the boards of directors and advisory committees for the Arthur Ashe Foundation, Avenue of the Arts, Drexel Medical School, Philadelphia Hospitality Cabinet, Pennsylvania Commission for Women, Penn Relays, and the Police Athletic League.

9 Process » ARCT IV Management identified and assessed the opportunity to acquire 986 property GE Capital portfolio » The ARCT IV Investment Committee considered the merits of the contemplated transaction and outlined the opportunity in a presentation to the ARCT IV Board » The ARCT IV Board met over a several day period with its external advisors, including Proskauer Rose LLP and Venable LLP, to consider the opportunity » Executive Session – independent directors, Proskauer and Venable LLP » Review period » Discussion and Approval
10 Process Primary Considerations – Consistency with Investment Objectives 1) The benefits to ARCT IV of a well - conceived, diversified, established portfolio of performing properties and operators with an overall strong rental growth profile which would bring the concentration of top 10 tenants considerably lower than it is today. • Main and Main locations • All single - tenant • Portfolio diversification by tenant, industry and geography • Reduction in Top 10 tenant concentration from 83% down to 40% • Strong brands including Wendy’s, Applebee’s, Burger King, Pizza Hut and KFC • Represents 3% of all U.S Wendy’s locations 2) Risk of reducing the overall investment grade % of portfolio was outweighed by the merits of the transaction Conclusion After thoughtful and extensive d iscussions involving Proskauer and Venable, t he Board determined that it was within their discretion to approve this transaction. Management is currently engaged in a 21 day due diligence where all properties will be reviewed.

11 Comparison of ARCT, ARCT III and ARCT IV No. of Properties 658 Total Square Feet 16.5 million Occupancy 100% Avg. Remaining Lease Term 13.0 years % Investment Grade (1) 75% No. of Tenants 37 No. of Industries 17 States 44 Net Debt/Enterprise Value 22.0% Enterprise Value $2.3 billion Average Acquisition Cap Rate 7.86% 2013 Annualized Rents $154.2 million No. of Properties 485 Total Square Feet 15.6 Million Occupancy 100% Avg. Remaining Lease Term 13.4 Years % Investment Grade (1) 71.2% No. of Tenants 61 States 45 + Puerto Rico Est. Market Capitalization $2.8 Billion 2012 Annualized Rents $178 Million No. of Properties 1,326 Total Square Feet 15 million Occupancy 100% Avg. Remaining Lease Term 12 years % Investment Grade (1)(2) 33% No. of Tenants 300 No. of Industries 16 States 48 Net Debt/Enterprise Value 26% Enterprise Value $2.36 billion Average Acquisition Cap Rate 7.73% 2013 Annualized Rents $181 million (1) Includes investment grade tenants affiliated with investment grade entities as determined by a major rating agency. For purpo ses of this presentation, we have attributed the ratings of the affiliated parent company. (2) Includes Moody’s Analytics Market Implied Ratings, which translates prices from credit and equity markets into standard Moody ’s ratings language. ARCT portfolio as of merger with Realty Income (O), ARCT III portfolio as merger with American Realty Capital Properties ARCT IV pro forma portfolio as of June 7, 2013 .
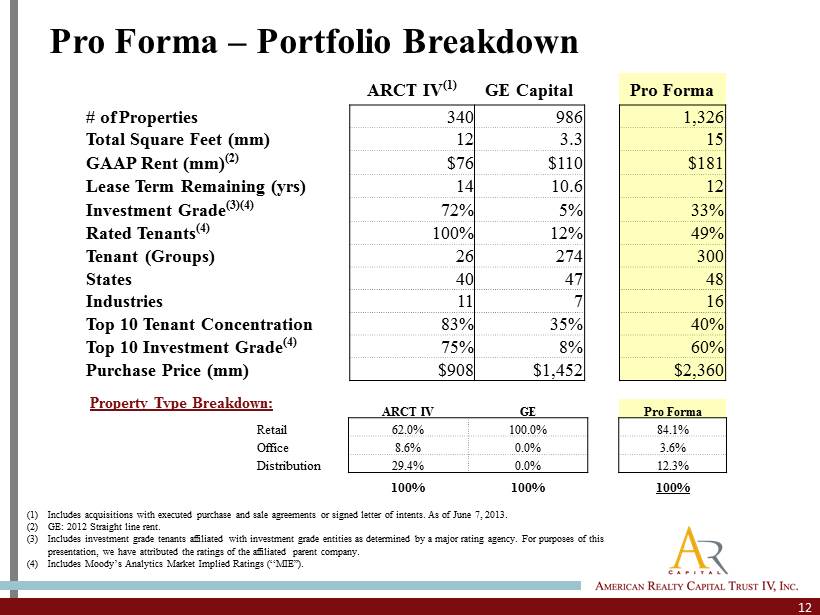
12 Pro Forma – Portfolio Breakdown (1) Includes acquisitions with executed purchase and sale agreements or signed letter of intents. As of June 7, 2013. (2) GE: 2012 Straight line rent. (3) Includes investment grade tenants affiliated with investment grade entities as determined by a major rating agency. For purpo ses of this presentation, we have attributed the ratings of the affiliated parent company. (4) Includes Moody’s Analytics Market Implied Ratings (“MIE”). ARCT IV (1) GE Capital Pro Forma # of Properties 340 986 1,326 Total Square Feet (mm) 12 3.3 15 GAAP Rent (mm) (2) $ 76 $110 $ 181 Lease Term Remaining (yrs) 14 10.6 12 Investment Grade (3 )(4) 72% 5% 33% Rated Tenants (4) 100% 12% 49% Tenant (Groups) 26 274 300 States 40 47 48 Industries 11 7 16 Top 10 Tenant Concentration 83% 35% 40% Top 10 Investment Grade (4) 75% 8% 60% Purchase Price (mm) $908 $1,452 $2,360 ARCT IV GE Pro Forma Retail 62.0% 100.0% 84.1% Office 8.6% 0.0% 3.6% Distribution 29.4% 0.0% 12.3% 100% 100% 100% Property Type Breakdown:

13 Pro Forma – Top 10 Tenants Breakdown ARCT IV (1) GE Capital Tenant % Rating / MIR Tenant % Rating / MIR Dollar General 15.1% BBB - Wendab Associates 7.3% NR SunTrust 13.2% BBB+ Apple American Group, LLC 6.8% NR BI - LO (Winn - Dixie) 11.4% B / B3 Neighborhood Restaurant Partners Florida, LLC 4.7% NR Rolls Royce 8.6% NR / Aa2 Bridgeman Foods 3.0% NR FedEx 7.3% BBB Burger King 2.8% B + / Baa2 Family Dollar 6.4% BBB - Fourjay 2.7% NR Citizens 5.9% B2 / Ba3 Arby's Restaurant Group, Inc. 2.5% NR / Ba3 Rubbermaid 5.2% A Golden Corral 2.2% NR Talbots 5.0% BBB - Goldco 1.8% NR Fresenius 4.2% NR / B2 Bartlett Management 1.4% NR 82.5% 64.9% / 75.3% 35.2% 0.0% / 8.0% Pro Forma Tenant % Rating / MIR Dollar General 6.3% BBB - SunTrust 5.5% BBB+ BI - LO (Winn - Dixie) 4.8% B / B3 Wendab Associates 4.3% NR Apple American Group, LLC 3.9% NR Rolls Royce 3.6% NR / Aa2 FedEx 3.3% BBB Neighborhood Restaurant Partners Florida, LLC 2.7% NR Family Dollar 2.7% BBB - Citizens 2.5% A 39.5% 51.2% / 60.3% Note: Includes investment grade tenants affiliated with investment grade entities as determined by a major rating agency. For purposes of this presentation, we have attributed the ratings of the affiliated parent company. (1) Includes acquisitions with executed purchase and sale agreements or signed letter of intents. As of June 7, 2013.
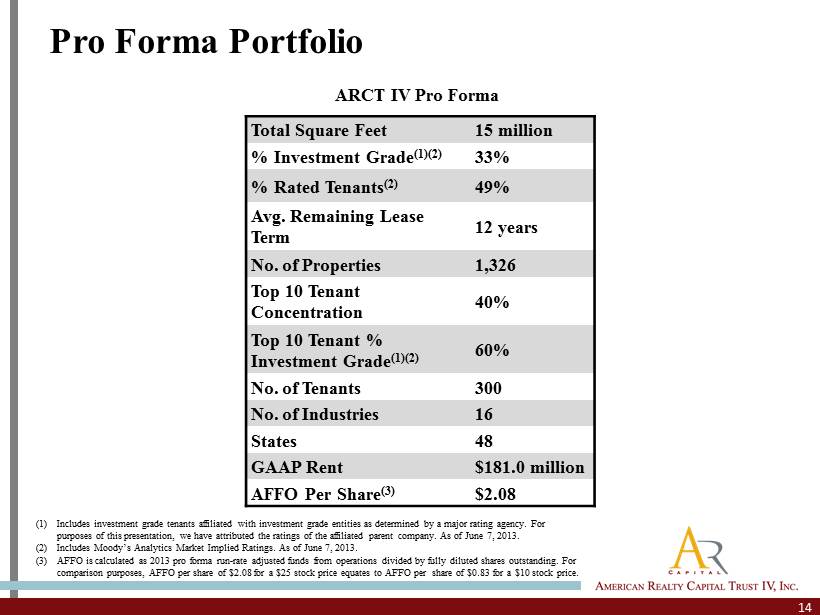
14 Pro Forma Portfolio Total Square Feet 15 million % Investment Grade (1)(2) 33% % Rated Tenants (2) 49% Avg. Remaining Lease Term 12 years No. of Properties 1,326 Top 10 Tenant Concentration 40% Top 10 Tenant % Investment Grade (1)(2) 60% No. of Tenants 300 No. of Industries 16 States 48 GAAP Rent $181.0 million AFFO Per Share (3) $2.08 ARCT IV Pro Forma (1) Includes investment grade tenants affiliated with investment grade entities as determined by a major rating agency. For purposes of this presentation, we have attributed the ratings of the affiliated parent company. As of June 7, 2013. (2) Includes Moody’s Analytics Market Implied Ratings. As of June 7, 2013. (3) AFFO is calculated as 2013 pro forma run - rate adjusted funds from operations divided by fully diluted shares outstanding. For comparison purposes, AFFO per share of $2.08 for a $25 stock price equates to AFFO per share of $0.83 for a $10 stock price.

$76 $181 $0 $20 $40 $60 $80 $100 $120 $140 $160 $180 $200 ARCT IV Current ARCT IV Pro Forma 11 16 0 2 4 6 8 10 12 14 16 18 ARCT IV Current ARCT IV Pro Forma 26 300 0 50 100 150 200 250 300 350 ARCT IV Current ARCT IV Pro Forma 15 Note: ARCT IV Current includes acquisitions with executed purchase and sale agreements or signed letter of intents. As of June 7, 2013. Portfolio Comparison 340 1,326 0 200 400 600 800 1000 1200 1400 ARCT IV Current ARCT IV Pro Forma No. of Properties 2013 GAAP Rent No. of Tenants No. of Industries

16 Dollar General 6.32% 6.32% BBB - SunTrust 5.50% 11.82% BBB+ BI - LO (Winn - Dixie) 4.77% 16.59% B / B3 Wendab Associates 4.26% 20.85% NR Apple American Group, LLC 3.93% 24.78% NR Rolls Royce 3.59% 28.37% NR / Aa2 FedEx 3.26% 31.63% BBB Neighborhood Restaurant Partners Florida, LLC 2.74% 34.37% NR Family Dollar 2.67% 37.04% BBB - Citizens 2.48% 39.52% A Rubbermaid 2.16% 41.68% BBB - Talbots 2.09% 43.77% NR / B2 Fresenius 1.75% 45.51% BB+ / Aa2 Bridgeman Foods 1.73% 47.24% NR Mattress Firm 1.65% 48.89% B2 / Ba3 Burger King 1.60% 50.50% B + / Baa2 Fourjay 1.56% 52.06% NR Arby's Restaurant Group, Inc. 1.45% 53.51% NR / Ba3 Golden Corral 1.30% 54.81% NR Goldco 1.06% 55.87% NR Bartlett Management 1.01% 56.89% NR Fired Up 0.84% 57.73% NR Tractor Supply 0.82% 58.54% NR / A2 Krystal 0.78% 59.32% NR / Ba3 NPC International Holdings, Inc. 0.76% 60.08% B Tenant % of GAAP Rent Cum. Credit Rating H & K Partners 0.73% 60.81% NR Stout & Company 0.72% 61.54% NR Strategic Restaurants Acquisition Company 0.70% 62.24% NR CVS 0.69% 62.92% BBB+ Heartland 0.68% 63.61% NR Grandys 0.67% 64.28% NR Interfoods of America 0.63% 64.91% NR Primary Aim, LLC 0.61% 65.51% NR Stripes 0.60% 66.12% NR / Ba2 Churpeyes , Inc. 0.60% 66.72% NR Mountain Range Restaurants 0.58% 67.30% NR RMH Franchise Holdings, Inc. 0.57% 67.87% NR Richmond LLC 0.55% 68.42% NR Tumbleweed 0.55% 68.97% NR Ozark Restaurants, Inc. 0.55% 69.52% NR Palmetto Restaurant 0.54% 70.06% NR Americas Pizza 0.54% 70.59% NR K - MAC Holdings Corp 0.54% 71.13% NR Tacala 0.53% 71.65% NR Shelton Restaurant Group, LLC 0.53% 72.18% NR Square Treasure Foods, Inc. 0.51% 72.68% NR Lowe's 0.49% 73.17% A - DineEquity Inc. 0.48% 73.65% B / Ba2 Shamrock Company (Master) 0.45% 74.10% NR CK E Restaurants (Master) 0.45% 74.56% B - / B2 74.56% 21.2% / 28.8% Tenant % of GAAP Rent Cum. Credit Rating Top 50 Tenants Represent 75% of the Portfolio Pro Forma – Top 50 Tenants As of June 7, 2013.
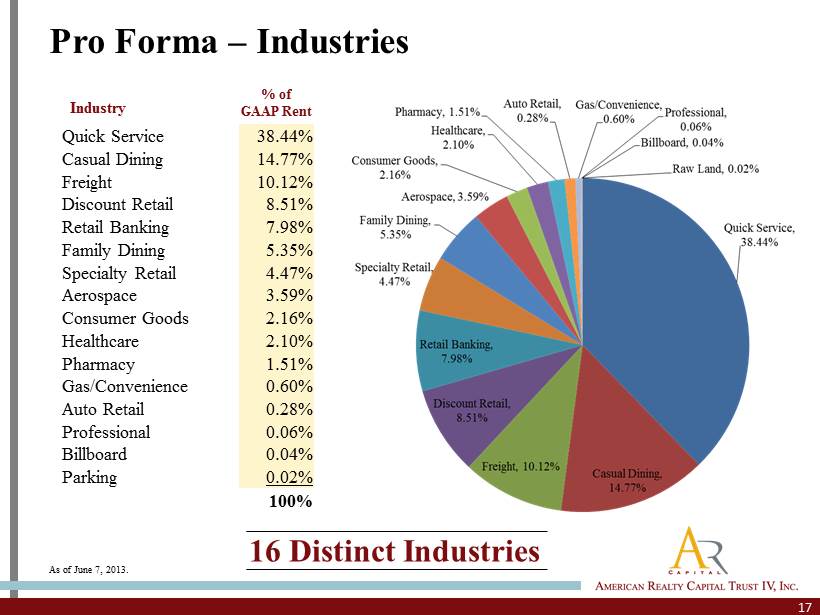
17 Pro Forma – Industries Quick Service 38.44 % Casual Dining 14.77 % Freight 10.12% Discount Retail 8.51% Retail Banking 7.98% Family Dining 5.35% Specialty Retail 4.47% Aerospace 3.59% Consumer Goods 2.16% Healthcare 2.10% Pharmacy 1.51% Gas/Convenience 0.60% Auto Retail 0.28% Professional 0.06% Billboard 0.04% Parking 0.02% 100% 16 Distinct Industries Industry % of GAAP Rent As of June 7, 2013.

18 Pro Forma Lease Maturity 2.0% 2.8% 3.3% 2.9% 2.5% 0.0% 2.0% 4.0% 6.0% 8.0% 10.0% 12.0% 14.0% 16.0% 18.0% 20.0% 2013 2014 2015 2016 2017 Pro Forma Lease Maturities - Next 5 Years Only 13.5% of Leases Mature in the Next 5 Years As of June 7, 2013.
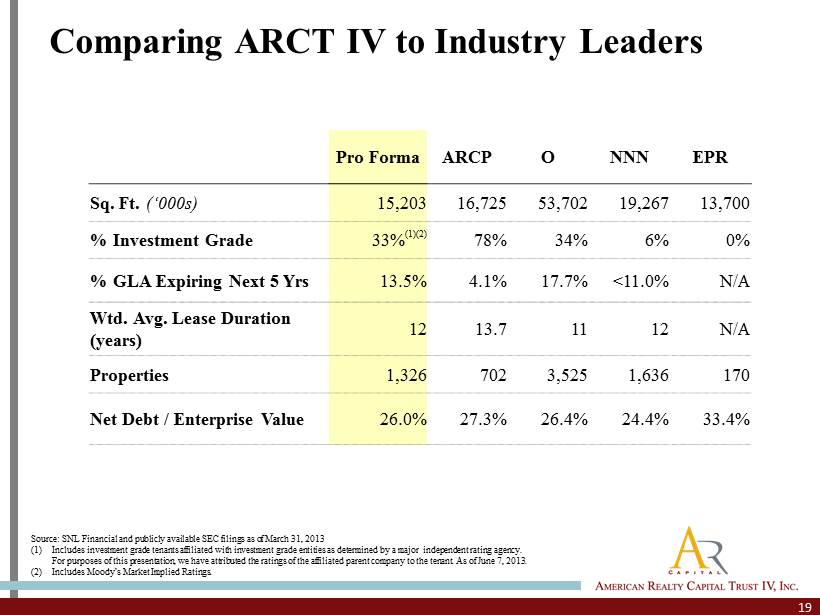
19 Comparing ARCT IV to Industry Leaders Pro Forma ARCP O NNN EPR Sq. Ft. (‘000s ) 15,203 16,725 53,702 19,267 13,700 % Investment Grade 33% (1)(2) 78% 34% 6% 0% % GLA Expiring Next 5 Yrs 13.5% 4.1% 17.7% <11.0% N/A Wtd . Avg. Lease Duration (years) 12 13.7 11 12 N/A Properties 1,326 702 3,525 1,636 170 Net Debt / Enterprise Value 26.0% 27.3% 26.4% 24.4% 33.4% Source: SNL Financial and publicly available SEC filings as of March 31, 2013 (1) Includes investment grade tenants affiliated with investment grade entities as determined by a major independent rating agen cy. For purposes of this presentation, we have attributed the ratings of the affiliated parent company to the tenant. As of June 7, 2013. (2) Includes Moody’s Market Implied Ratings.

20 Portfolio All in Purchase Price GAAP Cap GAAP NOI Duration Advance Auto $1,677,326 7.25% $118,254 15.0 Arby's $1,105,542 7.80% $84,000 11.6 BI/LO (Winn - Dixie) $101,303,790 8.12% $8,102,941 20.0 BSFS $2,960,011 7.87% $228,296 10.8 Citizens $51,725,088 8.39% $4,214,286 10.3 CVS $12,328,759 7.73% $934,044 12.8 DaVita $5,359,518 8.64% $450,004 12.8 Dollar General $50,461,502 7.71% $3,765,115 14.8 Family Dollar $8,182,103 8.71% $691,190 10.0 FedEx $14,892,165 7.79% $1,135,726 10.9 Krystal $14,504,361 8.68% $1,217,275 16.5 Lowe's $12,640,451 6.65% $825,000 12.8 Mattress Firm $26,382,955 8.78% $2,265,086 12.2 Rolls - Royce $81,171,714 7.70% $6,093,234 9.8 Rubbermaid $35,442,640 7.35% $2,563,798 10.0 Stripes $12,240,000 8.55% $1,026,000 16.9 SunTrust $112,530,101 8.01% $8,777,483 12.3 Talbots $37,428,944 9.65% $3,544,256 20.0 Tire Warehouse $1,640,521 8.23% $131,882 12.4 Tractor Supply $5,610,000 7.75% $426,250 11.7 Total $589,587,491 8.09% $46,594,119 13.9 Under Agreement All in Purchase Price GAAP Cap GAAP NOI Duration Academy Sports $22,748,867 7.73% $1,722,970 19.8 Arby's $1,684,027 8.02% $132,362 17.0 CVS $3,373,516 7.13% $235,650 18.8 DaVita $1,879,350 8.39% $154,500 15.0 Dollar General $93,424,697 7.60% $6,965,473 14.8 Family Dollar $46,130,437 8.52% $3,851,696 10.0 FedEx $59,032,310 7.61% $4,405,864 13.8 Fresenius $37,372,694 8.10% $2,967,233 10.3 Krystal $1,173,132 8.68% $99,871 16.5 Kum & Go $3,366,000 7.66% $252,776 20.0 Mattress Firm $6,421,980 8.52% $536,728 11.4 Rite Aid $7,174,700 9.27% $652,045 13.3 Rubbermaid $16,005,632 7.04% $1,104,296 12.0 SunTrust $7,295,554 8.01% $573,007 12.3 Walgreens $10,937,955 6.86% $736,000 16.7 GE Franchise Finance $1,487,825,392 7.57% $109,929,853 10.6 Total $1,805,846,243 7.62% $134,320,324 11.1 Portfolio & Under Agreement: $2,395,433,733 7.73% $ 180,914,443 11.9 ARCT IV Tenant Composition w/ GE Capital Acquisition As of June 7, 2013.

21 Investment Opportunity This diversified unencumbered portfolio represents a highly attractive investment opportunity in one of the most desirable real estate investment asset classes . The restaurant portfolio provides long - term, stable cash flows that are diversified across restaurant brands, tenants and MSAs . Portfolio Highlights Investment Highlights x National portfolio of restaurant assets, diversified by tenant and brand mix x Absolute triple net leases x Stable, cash flow stream x 100% occupancy x Professionally assembled and seasoned portfolio x Scale and scope that would take years to replicate by aggregation x Healthy rent to sales metrics x Strong contractual base rent escalators and percentage rent growth State # Props # of Properties 986 Total Square Feet (in millions) 3.3 Net Operating Income (in millions) $100 Weighted Avg. Committed Lease Term 10.6 Years # of Tenant Relationships 274 # of Brands 117 Top 10 Brands % of NOI 73% # of States 47 Top 10 States % of NOI 60.6% GE Capital Portfolio As of June 7, 2013.

22 National Portfolio MI 31 FL 86 DE MD 6 KY 16 ME 1 NY 36 PA 13 VT 0 NH 2 MA 5 RI 1 CT 4 VA 30 WV 19 OH 78 IN 36 IL 44 NC 25 TN 33 SC 38 AL 41 MS 14 WI 49 NJ 3 GA 59 NM 13 TX 127 OK 12 KS 6 NE 6 SD 1 ND 1 MT 1 WY 1 CO 11 UT 2 ID 6 AZ 21 NV 0 WA 6 CA 13 OR 7 AR 35 LA 25 MO 17 IA 6 MN 5 D.C. 1 AK 1 Property Type NOI Make - up (By NOI) Base Rent 92% Percentage Rent 8% $8mm $92mm Quick Service 64% Casual Dining 26% Family Dining 9% Retail & Other 1% $63.5mm 746 Props $1.4mm 19 Props $9.2mm 71 Props $25.5mm 151 Props GE Capital Portfolio As of June 7, 2013.

$1 $3 $5 $6 $5 $4 $3 $3 $4 $3 $2 $1 $2 $6 $16 $21 $9 $1 $5 $0 $5 $10 $15 $20 $25 MTM 2013 2014 2015 2016 2017 2018 2019 2020 2021 2022 2023 2024 2025 2026 2027 2028 2029 2030 23 State # Props Lease Expirations ($ NOI in millions) Tenant Health - Rent / Sales for Properties that Report Sales Weighted Average Committed Lease Term: 10.6 Years Note: Detail is shown only for properties with available 2012 sales data. Quick Service Casual Dining Family Dining GE Capital Portfolio As of June 7, 2013.

24 Top 10 Brands Rank Brand # of PropertiesSquare Feet NOI % of Total 1 Wendy's 212 633,666 22,206,753 22.3% 2 Applebee's 64 328,679 13,985,073 14.0% 3 Burger King 117 399,786 11,192,238 11.2% 4 Pizza Hut 112 291,991 5,774,788 5.8% 5 KFC 52 143,532 5,066,351 5.1% 6 Golden Corral 22 205,603 4,326,710 4.3% 7 Arby's 40 116,855 2,950,582 3.0% 8 Taco Bell 30 68,967 2,800,830 2.8% 9 Popeyes 32 69,694 2,597,056 2.6% 10 Johnny Carino's 8 53,265 1,858,252 1.9% Total Top 10 Brands 689 2,312,038 72,758,632 73.0% GE Capital Portfolio As of June 7, 2013.