Attached files
| file | filename |
|---|---|
| 8-K - 8-K - OneBeacon Insurance Group, Ltd. | a8-kcoverinvestordaypresen.htm |
Investor Meeting June 7, 2013
© 2013 OneBeacon Insurance Group 2 Safe Harbor Statement Forward-Looking Statements This presentation contains, and management may make, certain statements that are not historical facts but that are forward- looking statements within the meaning of Section 27A of the Securities Act of 1933 and Section 21E of the Securities Exchange Act of 1934. All statements, other than statements of historical facts, included or referenced in this presentation which address activities, events or developments which OneBeacon expects, estimates or anticipates will or may occur in the future are forward-looking statements. Please see our discussion at page 77 of our most recent report on Form 10-K for a more detailed discussion of the types of expressions that may identify forward-looking statements. Such statements are subject to risks and uncertainties, many of which are difficult to predict and generally beyond our control, that could cause actual results to differ materially from those expressed in, or implied or projected by, the forward-looking information and statements. In connection with the “safe harbor” provisions of the Private Securities Litigation Reform Act of 1995, we provide the following cautionary remarks regarding important risks and uncertainties which, among others, could cause our actual results to differ materially from our expectations, including those reflected in our forward-looking statements. These risks and uncertainties include, but are not limited to: (i) the risks associated with Item 1A of the Company’s most recent report on Form 10-K; (ii) recorded loss and loss adjustment expense reserves subsequently proving to have been inadequate; (iii) claims arising from catastrophic events, such as hurricanes, windstorms, earthquakes, floods or terrorist attacks; (iv) the continued availability and cost of reinsurance; (v) competitive forces, including the conduct of other property and casualty insurers and agents; (vi) changes in domestic or foreign laws or regulations, or their interpretation, applicable to us, our competitors, our agents or our customers; (vii) the continued availability of capital and financing; (viii) general economic, market or business conditions; (x) an economic downturn or other economic conditions adversely affecting our financial position; (xi) business opportunities (or lack thereof) that may be presented to us and pursued; (xii) actions taken by rating agencies from time to time, such as financial strength or credit rating downgrades or placing ratings on negative watch; and (xiii) other factors, most of which are beyond our control. Consequently, all of the forward-looking statements made in this presentation are qualified by these cautionary remarks, and the results or developments that we anticipate may not be realized or, even if substantially realized, there is no assurance that they will have the expected consequences to, or effects on, us or our business or operations. Our forward-looking statements speak only as of the date of this presentation and we assume no obligation to update publicly any such forward-looking statements, whether as a result of new information, future events or otherwise. Non-GAAP Financial Measures Within this presentation, we use certain non-GAAP financial measures which are identified with a “NGM” designation. Please see the appendix at the end of the presentation for an explanation of such non-GAAP financial measures and a reconciliation of the measure to the most closely comparable GAAP financial measure. An electronic copy of this presentation can be found at our website: www.onebeacon.com

© 2013 OneBeacon Insurance Group 3 Introduction Highlights Overview of Business Investments, Loss Reserves, Capital Management Our View Going Forward Q&A Today’s Agenda
Operating Principles – What we care about most Underwriting comes first Maintain a disciplined balance sheet Invest for total return Think like owners © 2013 OneBeacon Insurance Group 4
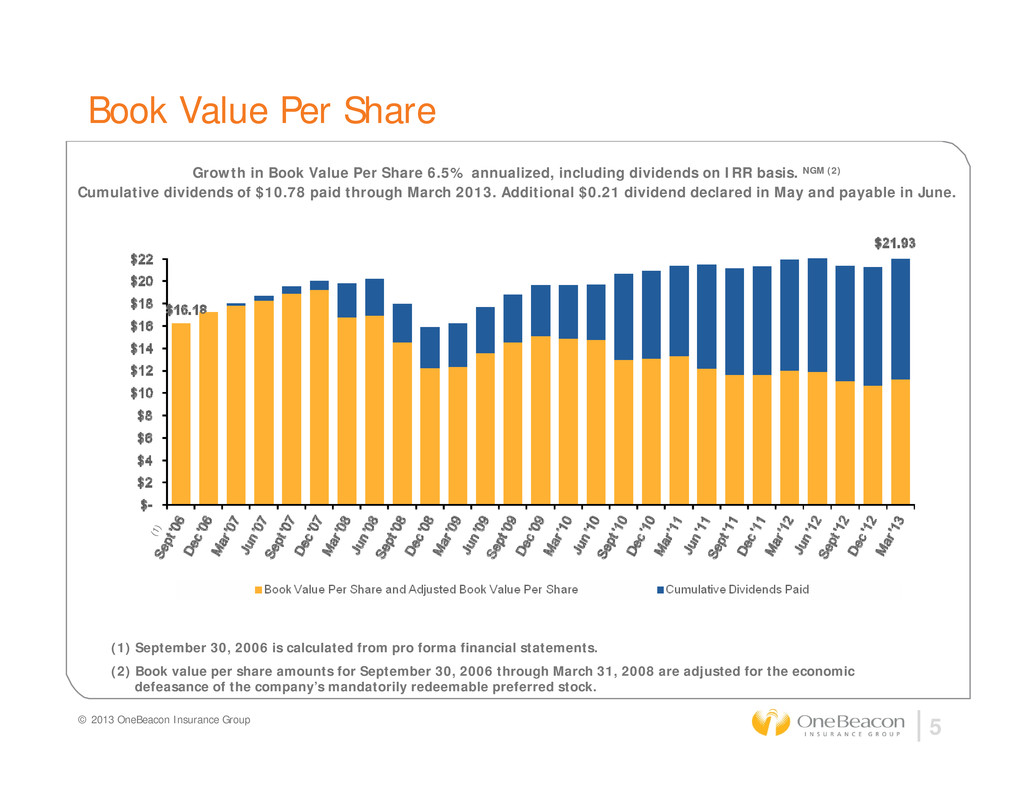
© 2013 OneBeacon Insurance Group 5 Book Value Per Share Growth in Book Value Per Share 6.5% annualized, including dividends on IRR basis. NGM (2) Cumulative dividends of $10.78 paid through March 2013. Additional $0.21 dividend declared in May and payable in June. (1) September 30, 2006 is calculated from pro forma financial statements. (2) Book value per share amounts for September 30, 2006 through March 31, 2008 are adjusted for the economic defeasance of the company’s mandatorily redeemable preferred stock. (1 )
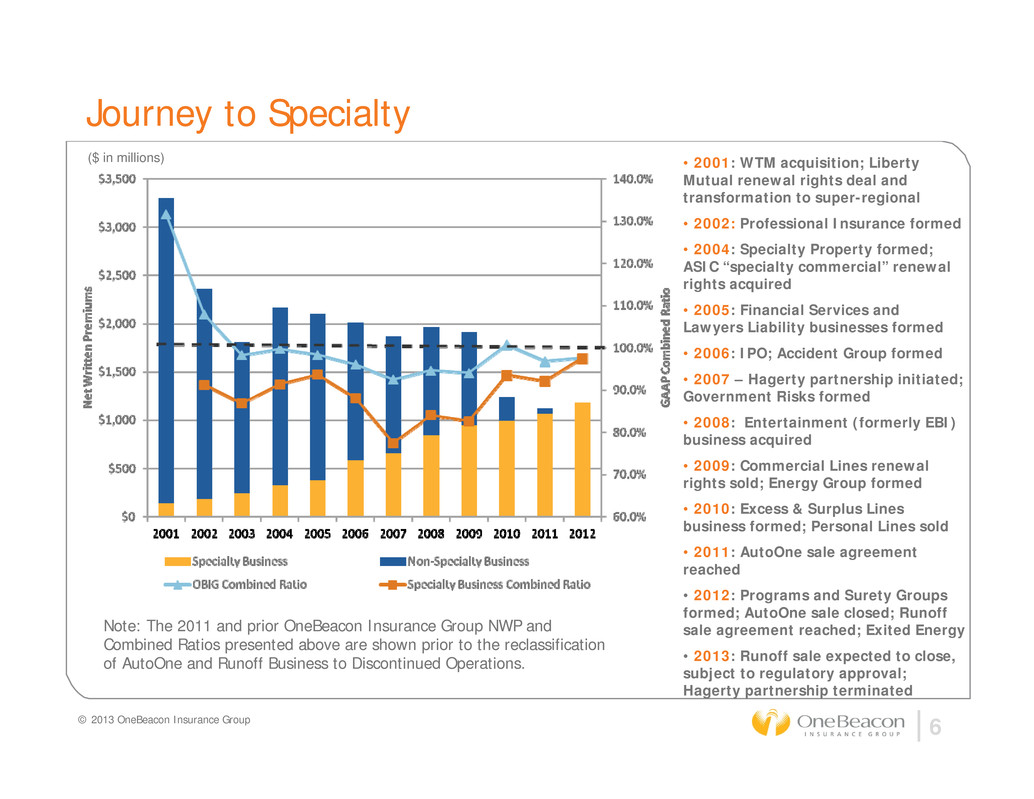
© 2013 OneBeacon Insurance Group 6 Journey to Specialty ($ in millions) • 2001: WTM acquisition; Liberty Mutual renewal rights deal and transformation to super-regional • 2002: Professional Insurance formed • 2004: Specialty Property formed; ASIC “specialty commercial” renewal rights acquired • 2005: Financial Services and Lawyers Liability businesses formed • 2006: IPO; Accident Group formed • 2007 – Hagerty partnership initiated; Government Risks formed • 2008: Entertainment (formerly EBI) business acquired • 2009: Commercial Lines renewal rights sold; Energy Group formed • 2010: Excess & Surplus Lines business formed; Personal Lines sold • 2011: AutoOne sale agreement reached • 2012: Programs and Surety Groups formed; AutoOne sale closed; Runoff sale agreement reached; Exited Energy • 2013: Runoff sale expected to close, subject to regulatory approval; Hagerty partnership terminated Note: The 2011 and prior OneBeacon Insurance Group NWP and Combined Ratios presented above are shown prior to the reclassification of AutoOne and Runoff Business to Discontinued Operations.
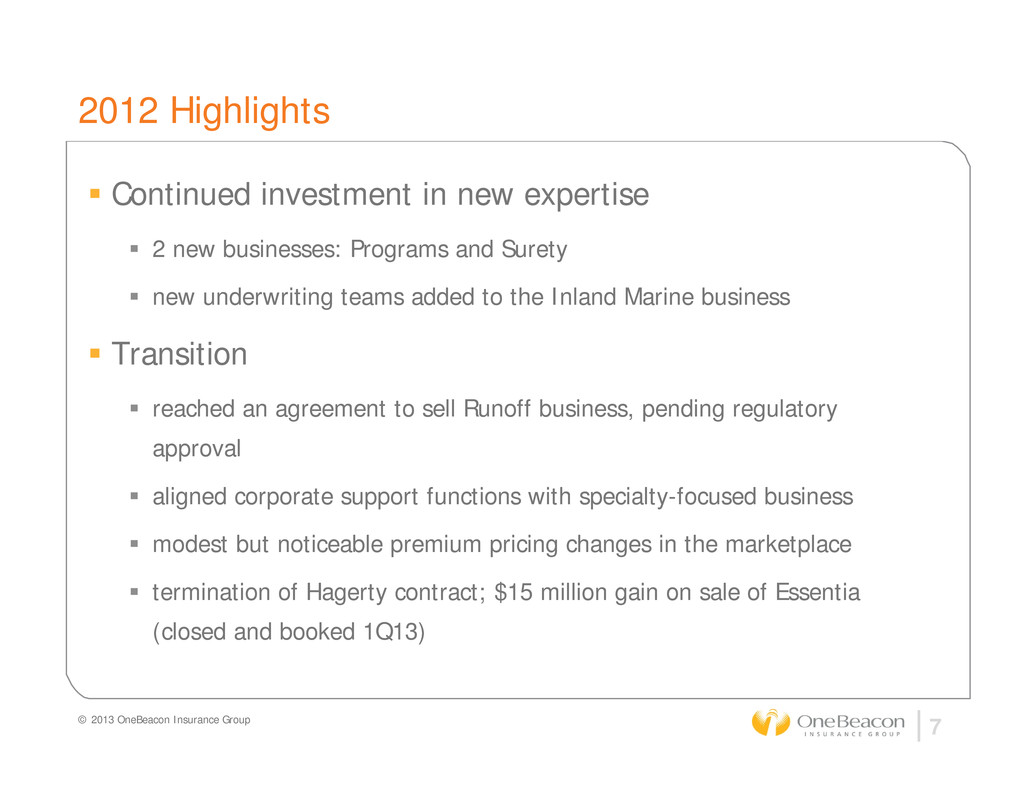
© 2013 OneBeacon Insurance Group 7 2012 Highlights Continued investment in new expertise 2 new businesses: Programs and Surety new underwriting teams added to the Inland Marine business Transition reached an agreement to sell Runoff business, pending regulatory approval aligned corporate support functions with specialty-focused business modest but noticeable premium pricing changes in the marketplace termination of Hagerty contract; $15 million gain on sale of Essentia (closed and booked 1Q13)
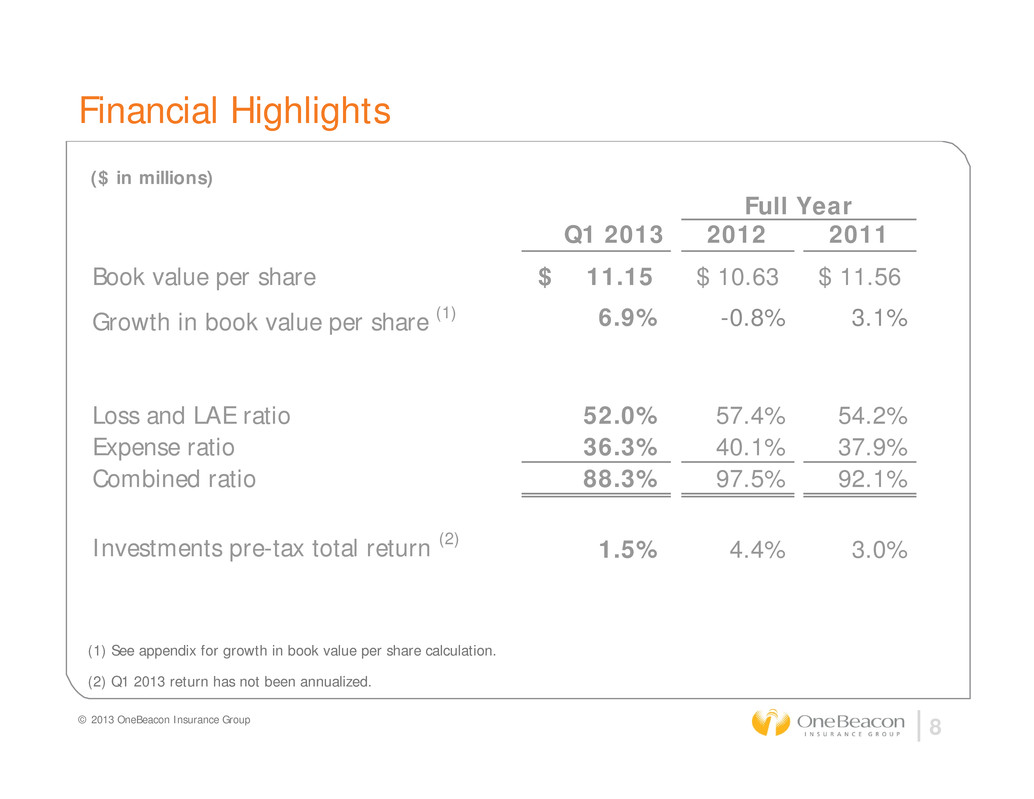
© 2013 OneBeacon Insurance Group 8 Financial Highlights (1) See appendix for growth in book value per share calculation. (2) Q1 2013 return has not been annualized. ($ in millions) Full Year Q1 2013 2012 2011 Book value per share 11.15$ 10.63$ 11.56$ Growth in book value per share (1) 6.9% -0.8% 3.1% Loss and LAE ratio 52.0% 57.4% 54.2% Expense ratio 36.3% 40.1% 37.9% Combined ratio 88.3% 97.5% 92.1% Investments pre-tax total return (2) 1.5% 4.4% 3.0%
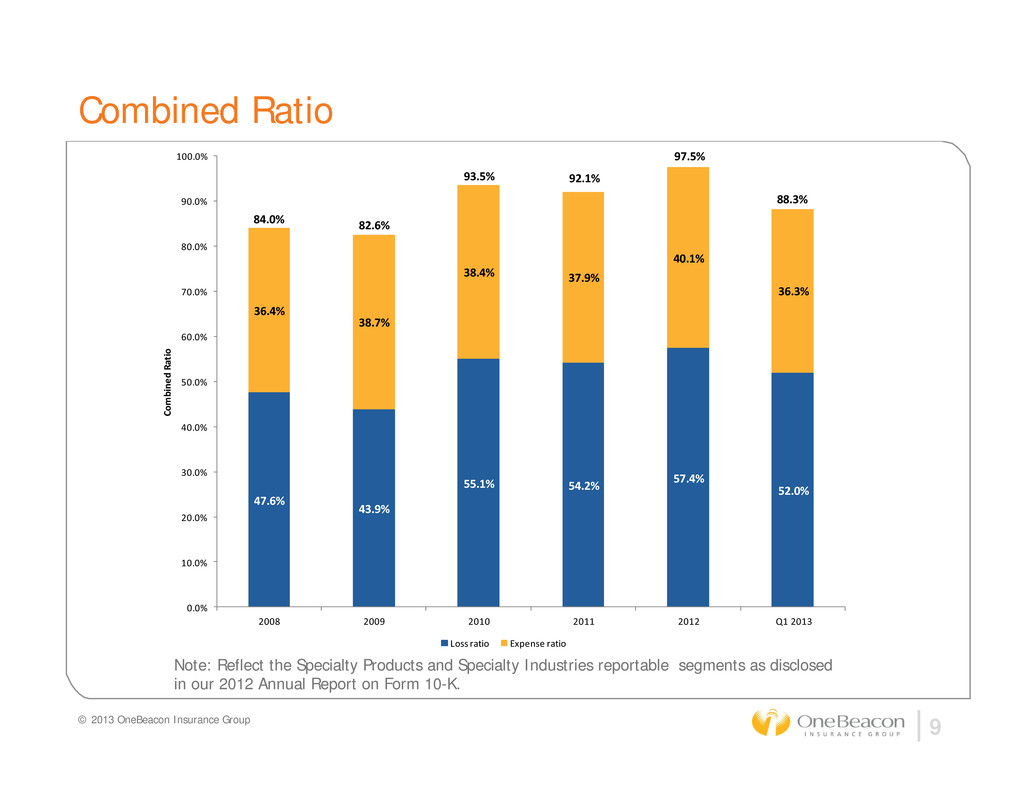
Combined Ratio © 2013 OneBeacon Insurance Group 9 Note: Reflect the Specialty Products and Specialty Industries reportable segments as disclosed in our 2012 Annual Report on Form 10-K. 47.6% 43.9% 55.1% 54.2% 57.4% 52.0% 36.4% 38.7% 38.4% 37.9% 40.1% 36.3% 0.0% 10.0% 20.0% 30.0% 40.0% 50.0% 60.0% 70.0% 80.0% 90.0% 100.0% 2008 2009 2010 2011 2012 Q1 2013 C o m b i n e d R a t i o Loss ratio Expense ratio 84.0% 82.6% 88.3% 97.5% 92.1%93.5%
© 2013 OneBeacon Insurance Group 10 Our Businesses Dennis Crosby and Paul Romano Executive Vice Presidents – Insurance Operations
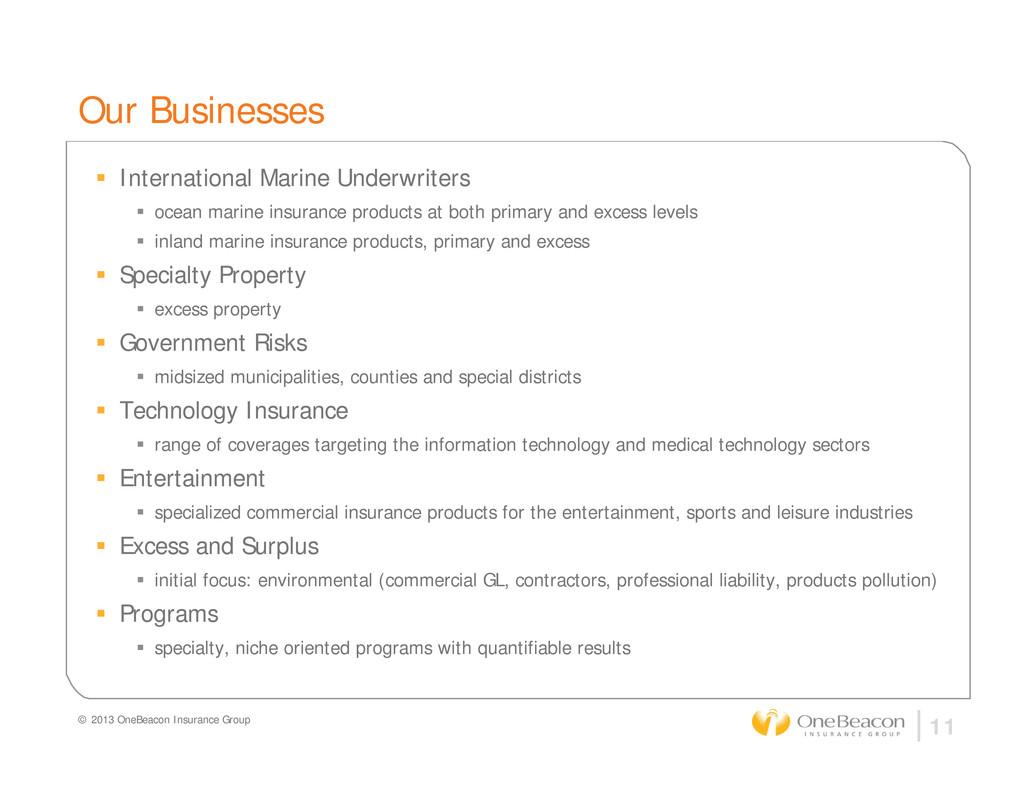
Our Businesses © 2013 OneBeacon Insurance Group 11 International Marine Underwriters ocean marine insurance products at both primary and excess levels inland marine insurance products, primary and excess Specialty Property excess property Government Risks midsized municipalities, counties and special districts Technology Insurance range of coverages targeting the information technology and medical technology sectors Entertainment specialized commercial insurance products for the entertainment, sports and leisure industries Excess and Surplus initial focus: environmental (commercial GL, contractors, professional liability, products pollution) Programs specialty, niche oriented programs with quantifiable results
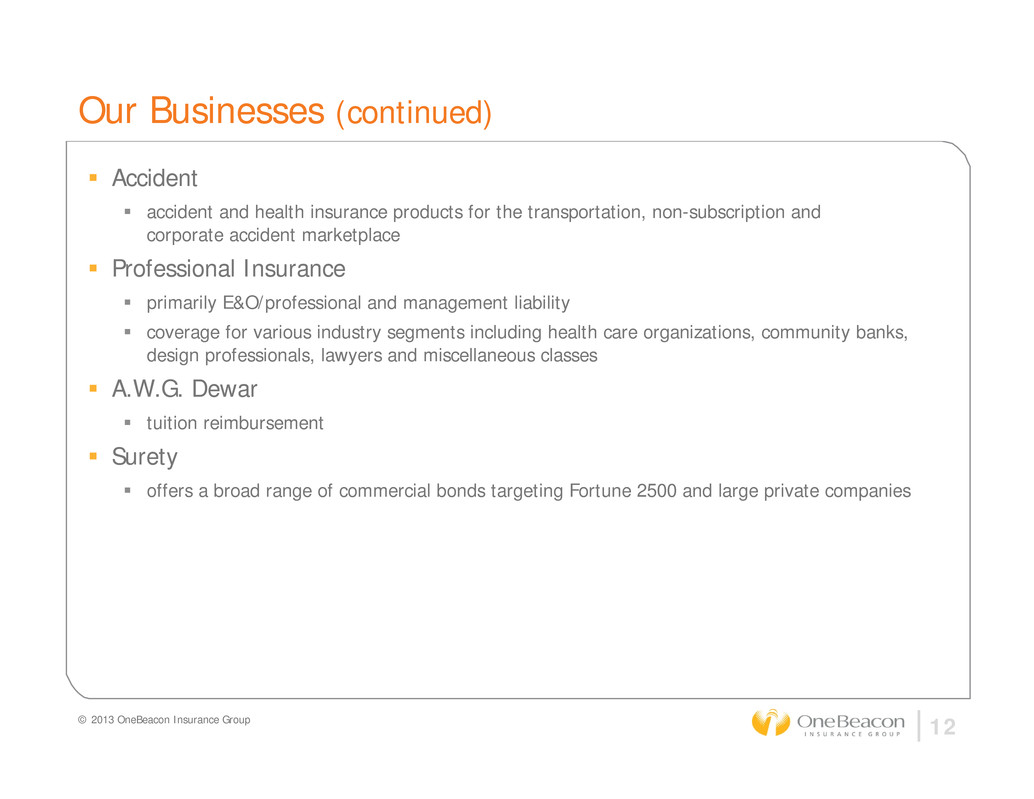
Our Businesses (continued) Accident accident and health insurance products for the transportation, non-subscription and corporate accident marketplace Professional Insurance primarily E&O/professional and management liability coverage for various industry segments including health care organizations, community banks, design professionals, lawyers and miscellaneous classes A.W.G. Dewar tuition reimbursement Surety offers a broad range of commercial bonds targeting Fortune 2500 and large private companies © 2013 OneBeacon Insurance Group 12
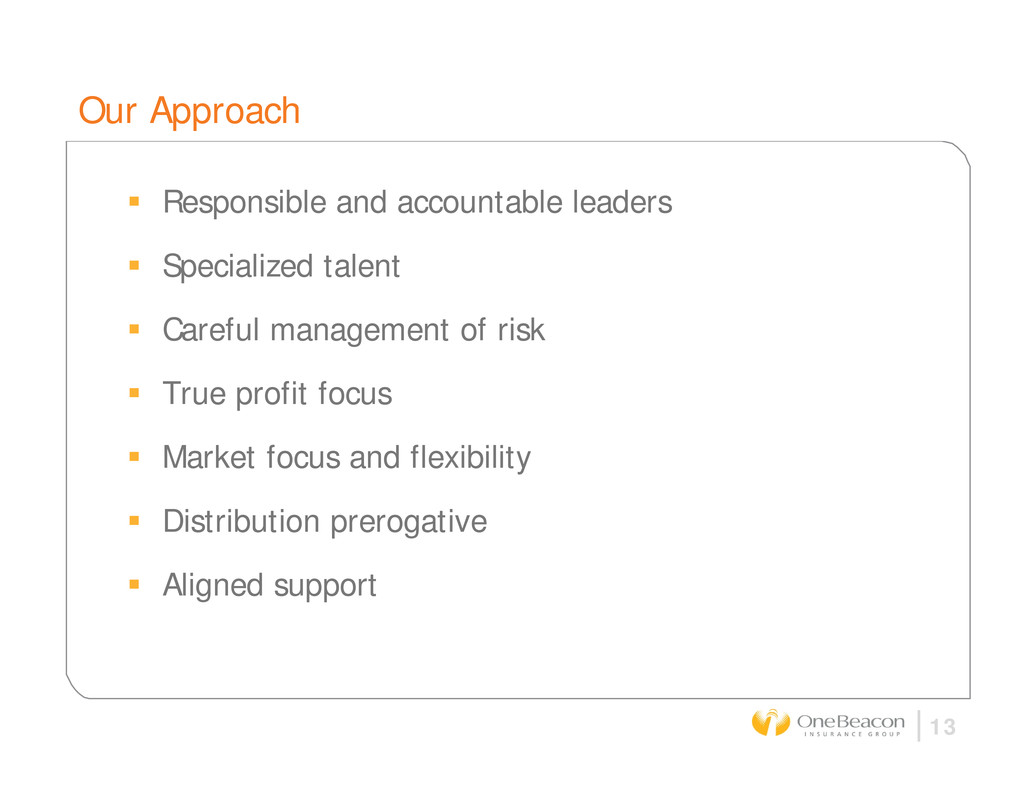
Our Approach Responsible and accountable leaders Specialized talent Careful management of risk True profit focus Market focus and flexibility Distribution prerogative Aligned support 13
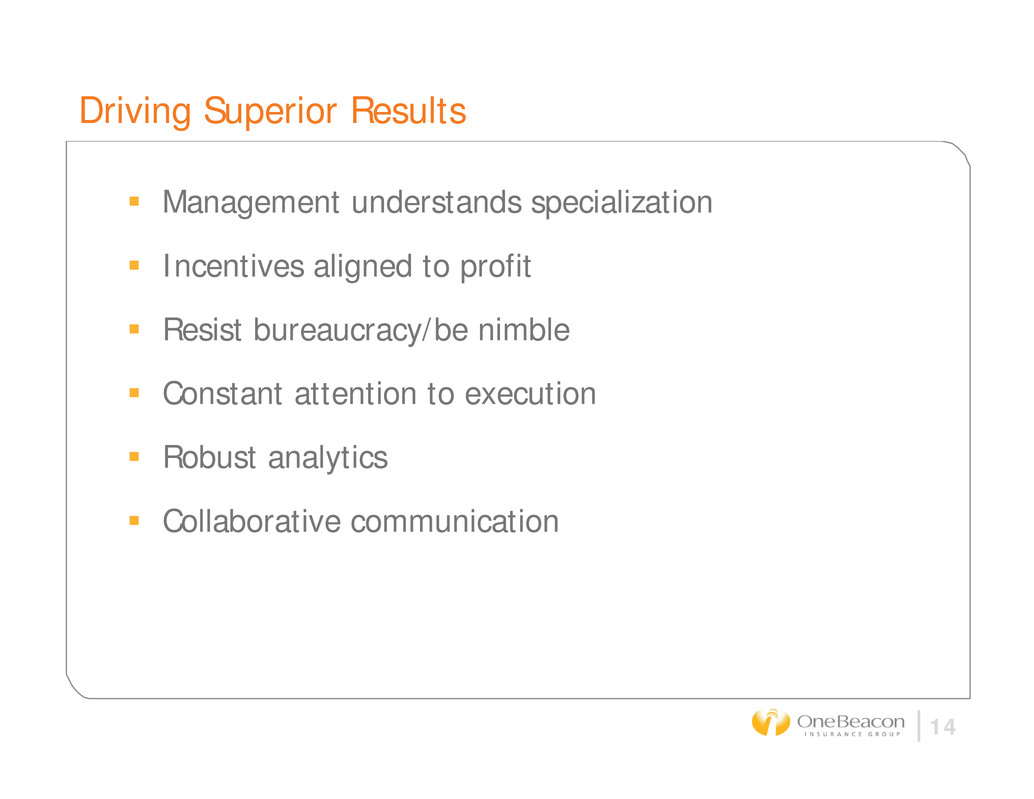
Driving Superior Results Management understands specialization Incentives aligned to profit Resist bureaucracy/be nimble Constant attention to execution Robust analytics Collaborative communication 14
© 2013 OneBeacon Insurance Group 15 Investments, Loss Reserves, Capital Management Paul McDonough Senior Vice President & Chief Financial Officer
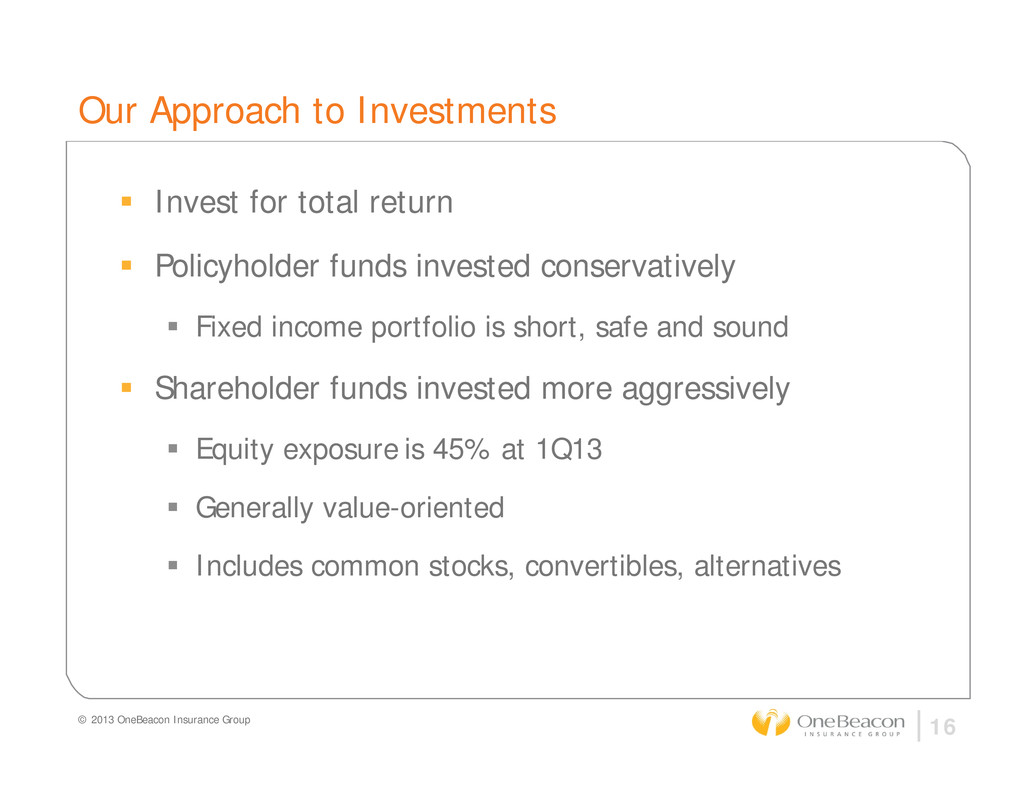
Our Approach to Investments Invest for total return Policyholder funds invested conservatively Fixed income portfolio is short, safe and sound Shareholder funds invested more aggressively Equity exposure is 45% at 1Q13 Generally value-oriented Includes common stocks, convertibles, alternatives © 2013 OneBeacon Insurance Group 16
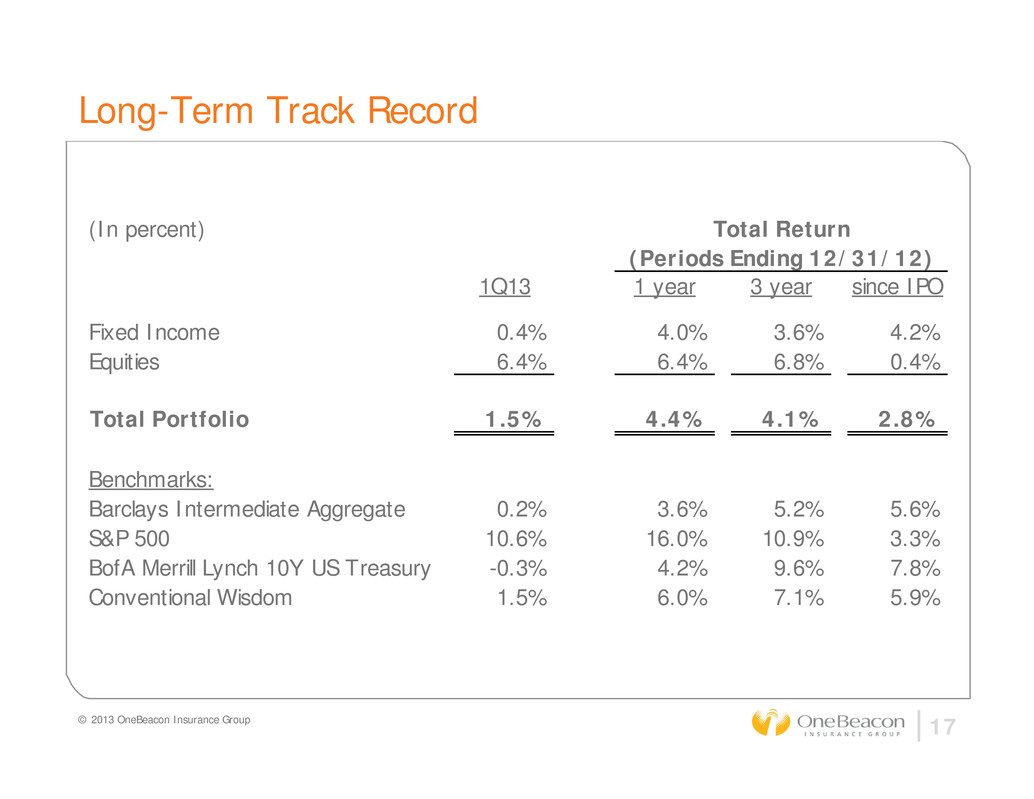
© 2013 OneBeacon Insurance Group 17 Long-Term Track Record (In percent) 1Q13 1 year 3 year since IPO Fixed Income 0.4% 4.0% 3.6% 4.2% Equities 6.4% 6.4% 6.8% 0.4% Total Portfolio 1.5% 4.4% 4.1% 2.8% Benchmarks: Barclays Intermediate Aggregate 0.2% 3.6% 5.2% 5.6% S&P 500 10.6% 16.0% 10.9% 3.3% BofA Merrill Lynch 10Y US Treasury -0.3% 4.2% 9.6% 7.8% Conventional Wisdom 1.5% 6.0% 7.1% 5.9% Total Return (Periods Ending 12/31/12)
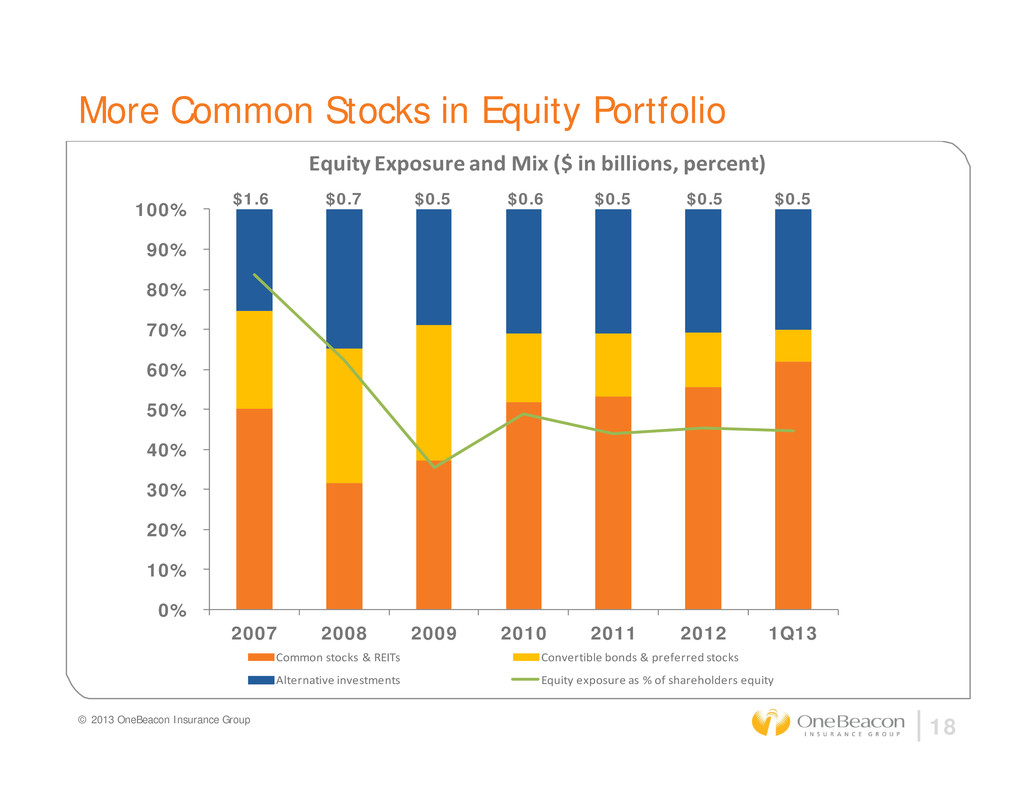
© 2013 OneBeacon Insurance Group 18 More Common Stocks in Equity Portfolio 0% 10% 20% 30% 40% 50% 60% 70% 80% 90% 100% 2007 2008 2009 2010 2011 2012 1Q13 Equity Exposure and Mix ($ in billions, percent) Common stocks & REITs Convertible bonds & preferred stocks Alternative investments Equity exposure as % of shareholders equity $1.6 $0.7 $0.5 $0.6 $0.5 $0.5 $0.5
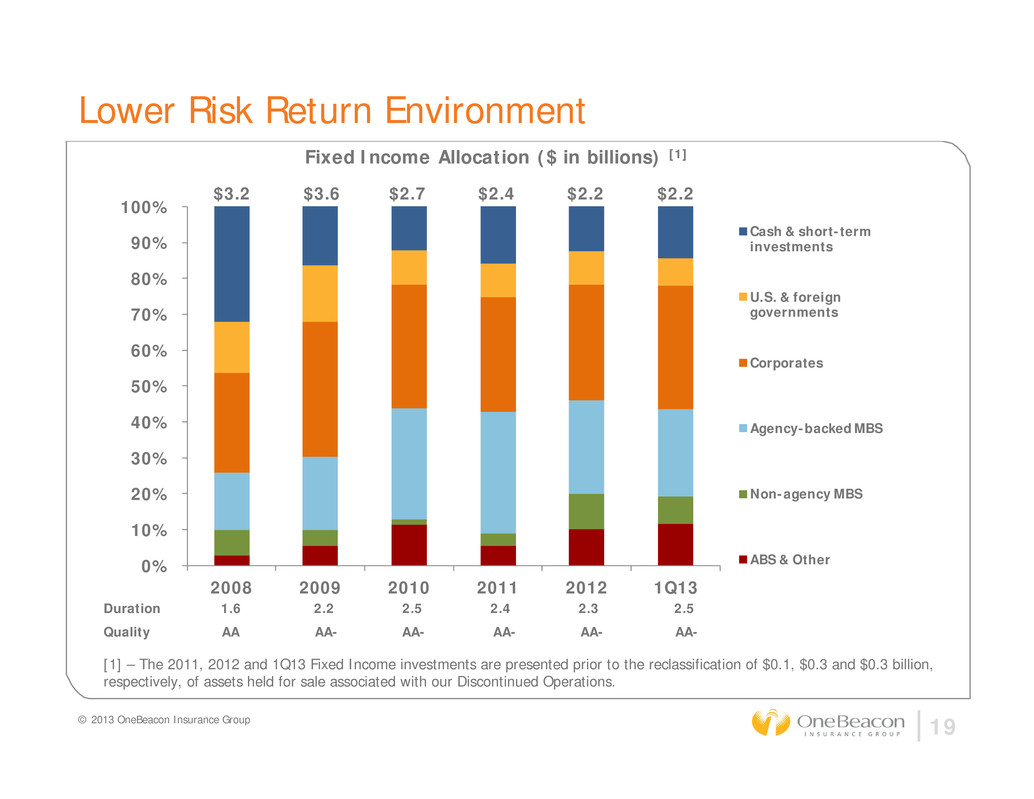
© 2013 OneBeacon Insurance Group 19 Lower Risk Return Environment Duration 1.6 2.2 2.5 2.4 2.3 2.5 Quality AA AA- AA- AA- AA- AA- [1] – The 2011, 2012 and 1Q13 Fixed Income investments are presented prior to the reclassification of $0.1, $0.3 and $0.3 billion, respectively, of assets held for sale associated with our Discontinued Operations. 0% 10% 20% 30% 40% 50% 60% 70% 80% 90% 100% 2008 2009 2010 2011 2012 1Q13 Fixed Income Allocation ($ in billions) [1] Cash & short-term investments U.S. & foreign governments Corporates Agency-backed MBS Non-agency MBS ABS & Other $3.2 $3.6 $2.7 $2.4 $2.2 $2.2
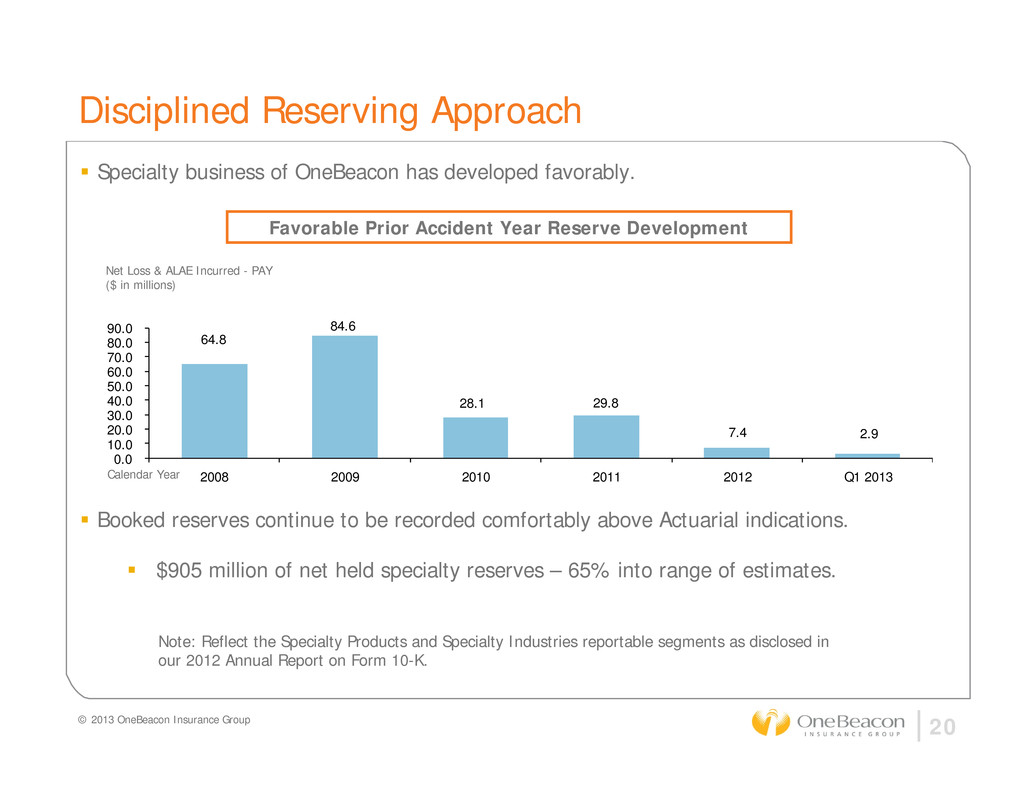
© 2013 OneBeacon Insurance Group 20 Disciplined Reserving Approach Specialty business of OneBeacon has developed favorably. Favorable Prior Accident Year Reserve Development Booked reserves continue to be recorded comfortably above Actuarial indications. $905 million of net held specialty reserves – 65% into range of estimates. Net Loss & ALAE Incurred - PAY ($ in millions) Calendar Year 64.8 84.6 28.1 29.8 7.4 2.9 0.0 10.0 20.0 30.0 40.0 50.0 60.0 70.0 80.0 90.0 2008 2009 2010 2011 2012 Q1 2013 Note: Reflect the Specialty Products and Specialty Industries reportable segments as disclosed in our 2012 Annual Report on Form 10-K.
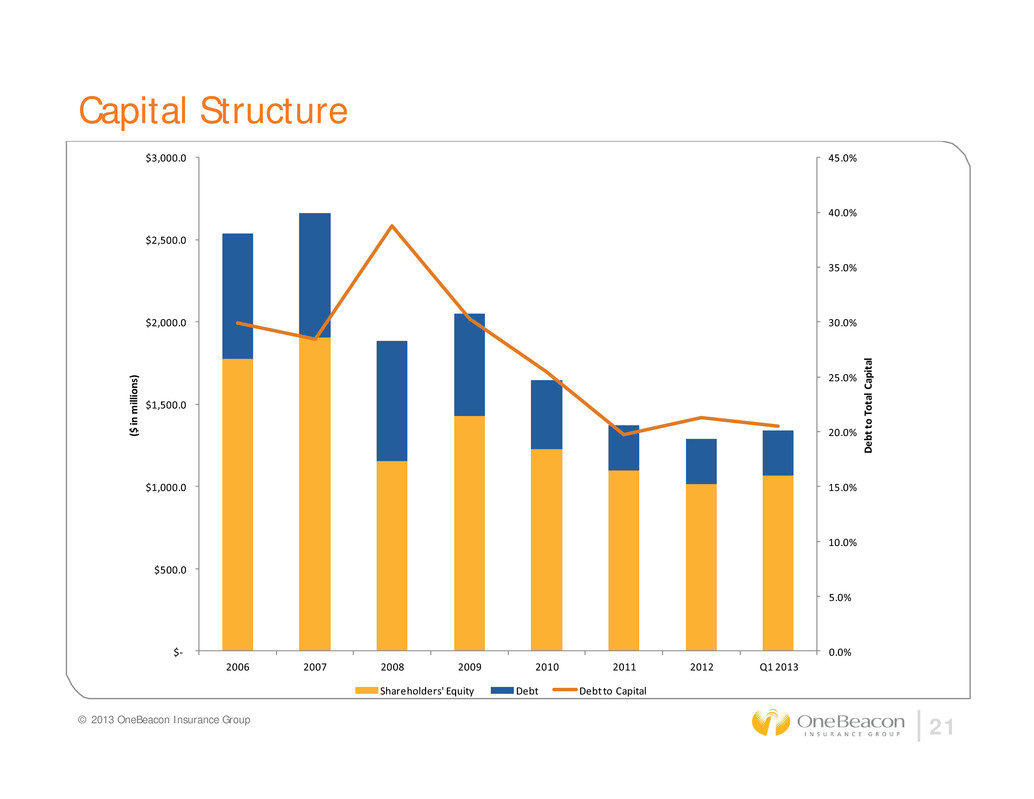
© 2013 OneBeacon Insurance Group 21 Capital Structure 0.0% 5.0% 10.0% 15.0% 20.0% 25.0% 30.0% 35.0% 40.0% 45.0% $‐ $500.0 $1,000.0 $1,500.0 $2,000.0 $2,500.0 $3,000.0 2006 2007 2008 2009 2010 2011 2012 Q1 2013 D e b t t o T o t a l C a p i t a l ( $ i n m i l l i o n s ) Shareholders' Equity Debt Debt to Capital
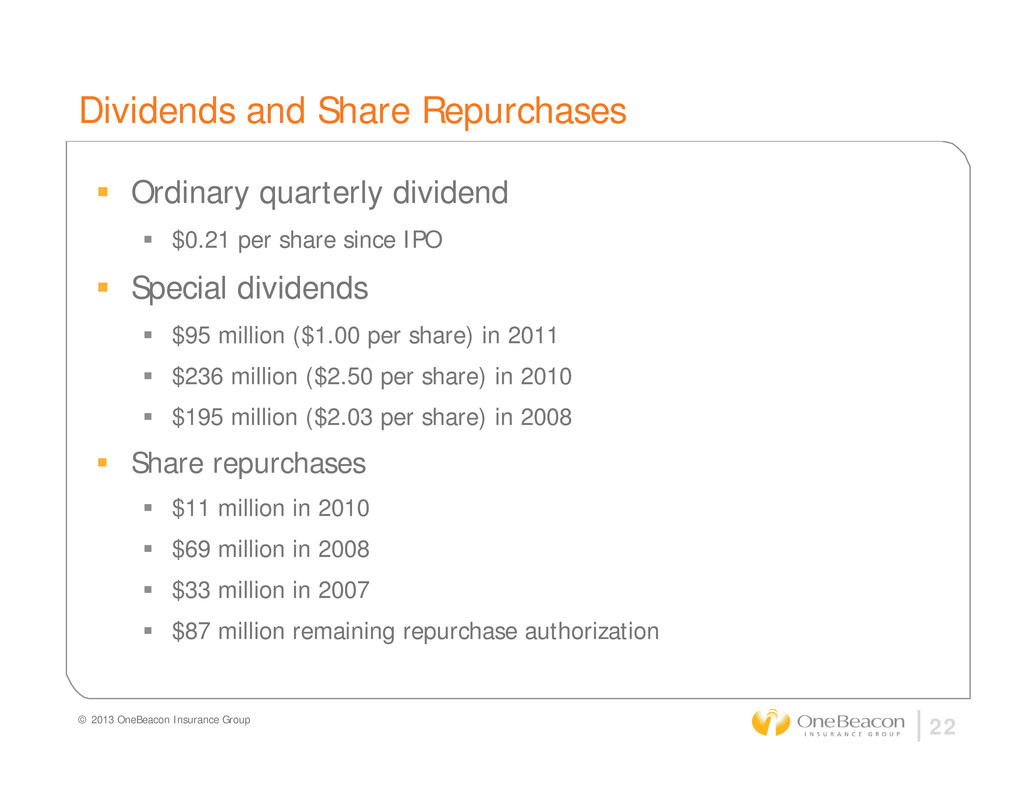
© 2013 OneBeacon Insurance Group 22 Dividends and Share Repurchases Ordinary quarterly dividend $0.21 per share since IPO Special dividends $95 million ($1.00 per share) in 2011 $236 million ($2.50 per share) in 2010 $195 million ($2.03 per share) in 2008 Share repurchases $11 million in 2010 $69 million in 2008 $33 million in 2007 $87 million remaining repurchase authorization
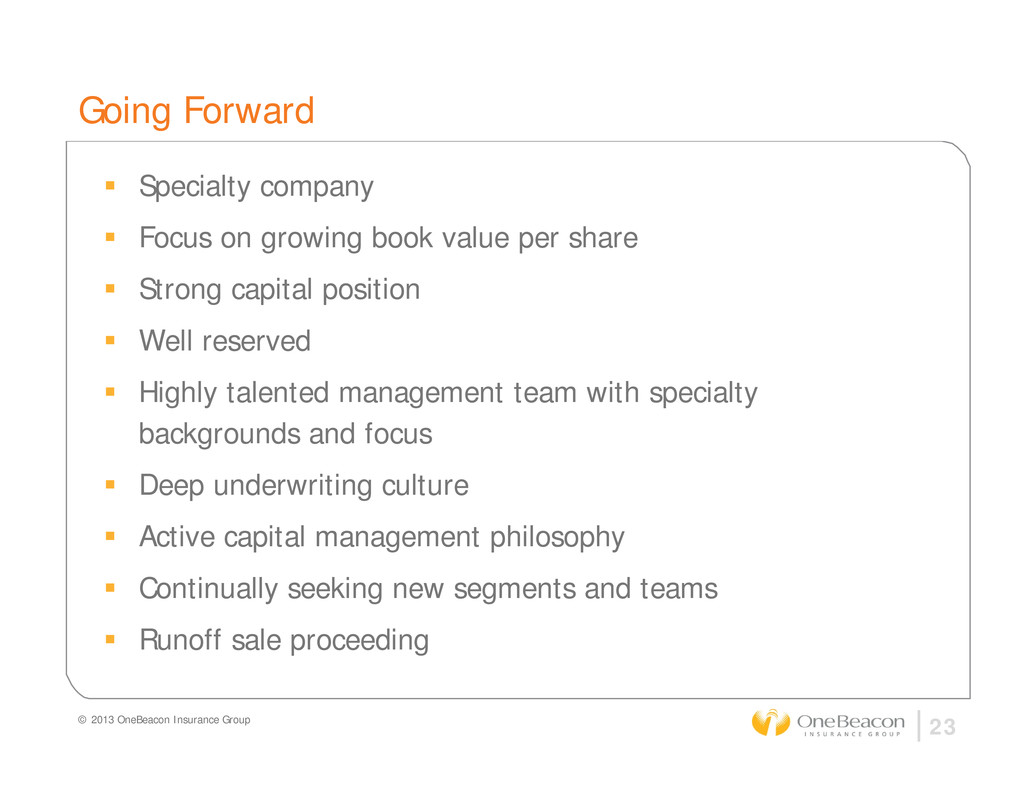
© 2013 OneBeacon Insurance Group 23 Going Forward Specialty company Focus on growing book value per share Strong capital position Well reserved Highly talented management team with specialty backgrounds and focus Deep underwriting culture Active capital management philosophy Continually seeking new segments and teams Runoff sale proceeding
Investor Meeting June 7, 2013
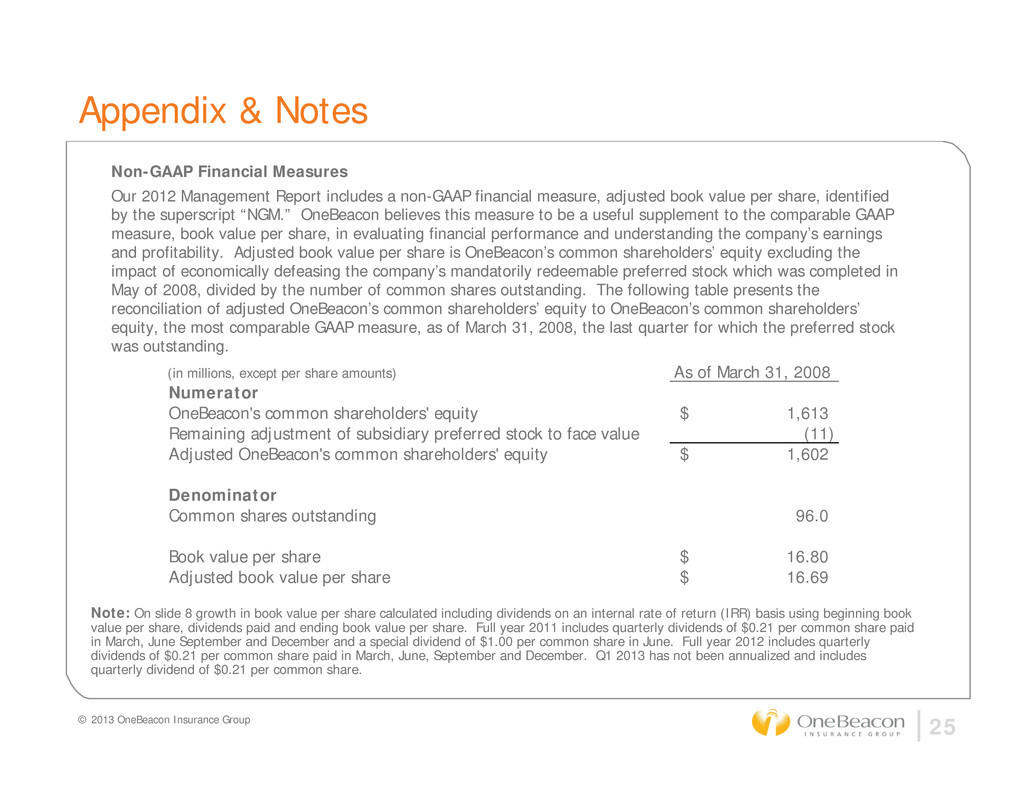
© 2013 OneBeacon Insurance Group 25 Appendix & Notes Non-GAAP Financial Measures Our 2012 Management Report includes a non-GAAP financial measure, adjusted book value per share, identified by the superscript “NGM.” OneBeacon believes this measure to be a useful supplement to the comparable GAAP measure, book value per share, in evaluating financial performance and understanding the company’s earnings and profitability. Adjusted book value per share is OneBeacon’s common shareholders’ equity excluding the impact of economically defeasing the company’s mandatorily redeemable preferred stock which was completed in May of 2008, divided by the number of common shares outstanding. The following table presents the reconciliation of adjusted OneBeacon’s common shareholders’ equity to OneBeacon’s common shareholders’ equity, the most comparable GAAP measure, as of March 31, 2008, the last quarter for which the preferred stock was outstanding. (in millions, except per share amounts) As of March 31, 2008 Numerator OneBeacon's common shareholders' equity 1,613$ Remaining adjustment of subsidiary preferred stock to face value (11) Adjusted OneBeacon's common shareholders' equity 1,602$ Denominator Common shares outstanding 96.0 Book value per share 16.80$ Adjusted book value per share 16.69$ Note: On slide 8 growth in book value per share calculated including dividends on an internal rate of return (IRR) basis using beginning book value per share, dividends paid and ending book value per share. Full year 2011 includes quarterly dividends of $0.21 per common share paid in March, June September and December and a special dividend of $1.00 per common share in June. Full year 2012 includes quarterly dividends of $0.21 per common share paid in March, June, September and December. Q1 2013 has not been annualized and includes quarterly dividend of $0.21 per common share.
