Attached files
| file | filename |
|---|---|
| EX-32.1 - EX-32.1 - OneBeacon Insurance Group, Ltd. | a2201814zex-32_1.htm |
| EX-21.1 - EX-21.1 - OneBeacon Insurance Group, Ltd. | a2201814zex-21_1.htm |
| EX-12.1 - EX-12.1 - OneBeacon Insurance Group, Ltd. | a2201814zex-12_1.htm |
| EX-23.1 - EX-23.1 - OneBeacon Insurance Group, Ltd. | a2201814zex-23_1.htm |
| EX-31.1 - EX-31.1 - OneBeacon Insurance Group, Ltd. | a2201814zex-31_1.htm |
| EX-31.2 - EX-31.2 - OneBeacon Insurance Group, Ltd. | a2201814zex-31_2.htm |
| EX-32.2 - EX-32.2 - OneBeacon Insurance Group, Ltd. | a2201814zex-32_2.htm |
| EX-10.4.3 - EX-10.4.3 - OneBeacon Insurance Group, Ltd. | a2201814zex-10_43.htm |
| EX-10.2.5 - EX-10.2.5 - OneBeacon Insurance Group, Ltd. | a2201814zex-10_25.htm |
Use these links to rapidly review the document
TABLE OF CONTENTS
ONEBEACON INSURANCE GROUP, LTD. INDEX TO CONSOLIDATED FINANCIAL STATEMENTS
UNITED STATES
SECURITIES AND EXCHANGE COMMISSION
Washington, D.C. 20549
FORM 10-K
ý |
ANNUAL REPORT PURSUANT TO SECTION 13 OR 15(d) OF THE SECURITIES EXCHANGE ACT OF 1934 |
|
For the fiscal year ended December 31, 2010 |
||
OR |
||
o |
TRANSITION REPORT PURSUANT TO SECTION 13 OR 15(d) OF THE SECURITIES EXCHANGE ACT OF 1934 |
|
For the transition period from to |
||
Commission file number 1-33128
ONEBEACON INSURANCE GROUP, LTD.
(Exact name of Registrant as specified in its charter)
| Bermuda (State or other jurisdiction of incorporation or organization) |
98-0503315 (I.R.S. Employer Identification No.) |
|
601 Carlson Parkway Minnetonka, Minnesota (Address of principal executive offices) |
55305 (Zip Code) |
Registrant's telephone number, including area code: (952) 852-2431
Securities registered pursuant to Section 12(b) of the Act:
| Title of each class | Name of each exchange on which registered | |
|---|---|---|
| Class A Common Shares, par value $0.01 per share | New York Stock Exchange |
Securities registered pursuant to Section 12(g) of the Act: None
Indicate by check mark if the Registrant is a well-known seasoned issuer, as defined in Rule 405 of the Act. Yes o No ý
Indicate by check mark if the Registrant is not required to file reports pursuant to Section 13 or Section 15(d) of the Exchange Act. Yes o No ý
Indicate by check mark whether the Registrant (1) has filed all reports required to be filed by Section 13 or 15(d) of the Exchange Act during the preceding 12 months (or for such shorter period that the Registrant was required to file such reports), and (2) has been subject to such filing requirements for the past 90 days. Yes ý No o
Indicate by check mark whether the Registrant has submitted electronically and posted on its corporate Web site, if any, every Interactive Data File required to be submitted and posted pursuant to Rule 405 of Regulation S-T (§232.405 of this chapter) during the preceding 12 months (or for such shorter period that the Registrant was required to submit and post such files). Yes o No o
Indicate by check mark if disclosure of delinquent filers pursuant to Item 405 of Regulation S-K is not contained herein, and will not be contained, to the best of the Registrant's knowledge, in definitive proxy or information statements incorporated by reference in Part III of this Form 10-K or any amendment to this Form 10-K. ý
Indicate by check mark whether the Registrant is a large accelerated filer, an accelerated filer, a non-accelerated filer, or a smaller reporting company. See the definitions of "large accelerated filer," "accelerated filer" and "smaller reporting company" in Rule 12b-2 of the Exchange Act.
| Large accelerated filer o | Accelerated filer ý | Non-accelerated filer o (Do not check if a smaller reporting company) |
Smaller reporting company o |
Indicate by check mark whether the Registrant is a shell company (as defined in Rule 12b-2 of the Exchange Act). Yes o No ý
The aggregate market value of voting shares (based on the closing price of Class A common shares listed on the New York Stock Exchange and the consideration received for those shares not listed on a national or regional exchange) held by non-affiliates of the Registrant as of June 30, 2010, was $321,355,378.
As of February 24, 2011, 22,661,739 Class A common shares, par value $0.01 per share, and 71,754,738 Class B common shares, par value $0.01 per share, were outstanding.
DOCUMENTS INCORPORATED BY REFERENCE
Portions of the Registrant's Definitive Proxy Statement to be filed with the Securities and Exchange Commission ("SEC") pursuant to Regulation 14A under the Securities Exchange Act of 1934, as amended (the "Exchange Act"), relating to the Registrant's Annual General Meeting of Members scheduled to be held May 25, 2011 are incorporated by reference into Part III of this Form 10-K. With the exception of the portions of the Proxy Statement specifically incorporated herein by reference, the Proxy Statement is not deemed to be filed as part of this Form 10-K.
OneBeacon Insurance Group, Ltd. (the Company or the Registrant), an exempted Bermuda limited liability company, through its subsidiaries (collectively, OneBeacon, we, us, or our) is a property and casualty insurance writer that offers a wide range of specialty insurance products and services through independent agencies, regional and national brokers, wholesalers and managing general agencies. As a specialty company, we are guided by a focus on certain products and/or customer or industry groups where we believe our targeted approach and expertise deliver a competitive advantage. We believe specialization will result in superior returns as compared to a more "generalist" underwriting approach and that our knowledge regarding our targeted industries, classes and risk characteristics provides us with a competitive edge for our terms and conditions on individual accounts. Our products cover or include: professional liability, marine, collector cars and boats, property and inland marine, excess property, accident and health, technology, public entities, energy, entertainment, sports and leisure, tuition reimbursement and excess and surplus lines.
Our reportable segments are Specialty Insurance Operations, Other Insurance Operations and Investing, Financing and Corporate Operations. The Specialty Insurance Operations segment is comprised of twelve underwriting units that are aggregated into three major underwriting units for financial reporting: MGA Business, Specialty Industries and Specialty Products, representing an aggregation of our specialty businesses based on those that are distributed through managing general agencies (MGAs), those that are targeted to specific industries and those that offer targeted products. Our Other Insurance Operations segment includes AutoOne Insurance (AutoOne), a division that offers products and services to assigned risk markets. Other Insurance Operations also includes the results of the non-specialty commercial lines business and the traditional personal lines business, both described below, other run-off business and certain purchase accounting adjustments relating to the OneBeacon Acquisition. Investing, Financing and Corporate Operations includes the investing and financing activities for OneBeacon on a consolidated basis, and certain other activities conducted through our top holding company, OneBeacon Insurance Group, Ltd., and our intermediate subsidiaries.
OneBeacon was acquired by White Mountains Insurance Group, Ltd. (White Mountains) from Aviva plc (Aviva, formerly CGNU) in 2001 (the OneBeacon Acquisition). White Mountains is a holding company whose businesses provide property and casualty insurance, reinsurance and certain other products. During the fourth quarter of 2006, White Mountains sold 27.6 million or 27.6% of our common shares in an initial public offering. Prior to the initial public offering, OneBeacon was a wholly-owned subsidiary of White Mountains. As of December 31, 2010, White Mountains owned 76.0% of our common shares.
Our headquarters are located at 14 Wesley Street, 5th Floor, Hamilton HM 11, Bermuda. Our U.S. corporate headquarters are located at 601 Carlson Parkway, Minnetonka, Minnesota 55305 and our registered office is located at Clarendon House, 2 Church Street, Hamilton HM 11, Bermuda.
Our principal operating subsidiaries are rated "A" (Excellent, the third highest of fifteen financial strength ratings) by A.M. Best Company, Inc. (A.M. Best), "A-" (Strong, the seventh highest of twenty-one financial strength ratings) by Standard & Poor's Rating Service (Standard & Poor's), "A2" (Good, the sixth highest of twenty-one financial strength ratings) by Moody's Investors Service, Inc. (Moody's) and "A" (Strong, the sixth highest of twenty-one financial strength ratings) by Fitch, Inc. (Fitch).
1
In the year ended December 31, 2010, our net written premiums totaled $1.2 billion and we had total assets of approximately $6.2 billion and total OneBeacon's common shareholders' equity of $1.2 billion at December 31, 2010.
Significant Transactions
Historically, we have offered a range of specialty, commercial and personal products and services, however, in the wake of recent transactions we are now focused exclusively on specialty business. In addition, the transactions freed up significant capital, increased our financial flexibility and substantially reduced our catastrophe exposure.
Commercial lines. On December 3, 2009, we sold the renewal rights to our non-specialty commercial lines business to The Hanover Insurance Group (The Hanover). The transaction included small commercial accounts and the non-specialty portion of the middle-market business, beginning with January 1, 2010 effective dates (the Commercial Lines Transaction).
Personal lines. On July 1, 2010, we completed the sale of our traditional personal lines business to Tower Group, Inc. (Tower) (the Personal Lines Transaction). The Personal Lines Transaction included two insurance companies through which the majority of the traditional personal lines business was written on a direct basis, two attorneys-in-fact managing the reciprocal insurance exchanges (reciprocals) that wrote the traditional personal lines business in New York and New Jersey, the surplus notes issued by the New York and New Jersey reciprocals and the remaining renewal rights to certain other traditional personal lines insurance policies. In addition, the Personal Lines Transaction included the execution of reinsurance agreements with certain subsidiaries of the Company pursuant to which we cede, on a 100% quota share basis, traditional personal lines business not directly written by companies included in the sale and assume, on a 100% quota share basis, non-traditional personal lines business written directly by York Insurance Company of Maine (York), one of the insurance companies sold.
To better align our operating and reporting structure with our business profile as a result of the transactions, we revised our segment structure into Specialty Insurance Operations, Other Insurance Operations and Investing, Financing and Corporate Operations, as described above. As part of the resegmentation, agency results for business written on our paper and in which we have an ownership interest have been reclassified within underwriting results. Prior periods have been reclassified to conform to the current presentation. Previously, we reported and managed our business through an Insurance Operations segment and an Other Operations segment. Within the Insurance Operations segment, we reported and managed our specialty lines businesses within a specialty lines underwriting unit and our traditional personal lines businesses and AutoOne within a personal lines underwriting unit, nearly all of which was subject to the Personal Lines Transaction. The Insurance Operations segment also included run-off business, which consisted primarily of non-specialty commercial lines business and other run-off business. Certain other activities conducted through the Company and our intermediate subsidiaries were included in our Other Operations segment. Investing and Financing activities were included within the Insurance Operations segment if they were owned or owed by insurance company legal entities or within the Other Operations segment if they were owned or owed by holding company legal entities. Prior periods have been reclassified to conform to the current presentation.
Our Operating Principles
We strive to operate within the spirit of four operating principles. These are:
Underwriting Comes First. An insurance enterprise must respect the fundamentals of insurance. There must be a realistic expectation of underwriting profit on all business written, and demonstrated
2
fulfillment of that expectation over time, with focused attention to the loss ratio and to all the professional insurance disciplines of pricing, underwriting and claims management.
Maintain a Disciplined Balance Sheet. The first concern here is that insurance liabilities must always be fully recognized. Loss reserves and expense reserves must be solid before any other aspect of the business can be solid. Pricing, marketing and underwriting all depend on informed judgment of ultimate loss costs and that can be managed effectively only with a disciplined balance sheet.
Invest for Total Return. Historical insurance accounting tends to hide unrealized gains and losses in the investment portfolio and over-reward reported investment income (interest and dividends). Regardless of the accounting, we must invest for the best growth in after tax value over time. In addition to investing our bond portfolios for total after tax return, that will also mean prudent investment in a balanced portfolio consistent with leverage and insurance risk considerations.
Think Like Owners. Thinking like owners has a value all its own. There are stakeholders in a business enterprise and doing good work requires more than this quarter's profit. But thinking like an owner embraces all that without losing the touchstone of a capitalist enterprise.
Property and Casualty Insurance Overview
Generally, property and casualty insurance companies write insurance policies in exchange for premiums paid by their customers (the insured). An insurance policy is a contract between the insurance company and the insured where the insurance company agrees to pay for losses suffered by the insured that are covered under the contract. Such contracts often are subject to subsequent legal interpretation by courts, legislative action and arbitration. Property insurance generally covers the financial consequences of accidental losses to the insured's property, such as a business' building, inventory and equipment or personal property. Casualty insurance (often referred to as liability insurance) generally covers the financial consequences of a legal liability of an individual or an organization resulting from negligent acts and omissions causing bodily injury and/or property damage to a third party. Claims on property coverage generally are reported and settled in a relatively short period of time, whereas those on casualty coverage can take years, even decades, to settle.
We derive substantially all of our revenues from earned premiums, investment income and net realized and unrealized gains and losses on investment securities. Earned premiums represent premiums received from insureds, which are recognized as revenue over the period of time that insurance coverage is provided (i.e., ratably over the life of the policy). A significant period of time normally elapses between the receipt of insurance premiums and the payment of insurance claims. During this time, we invest the premiums, earn investment income and generate net realized and unrealized gains and losses on investment securities.
Insurance companies incur a significant amount of their total expenses from policyholder losses, which are commonly referred to as claims. In settling policyholder losses, various loss adjustment expenses (LAE) are incurred such as insurance adjusters' fees and litigation expenses. In addition, insurance companies incur policy acquisition expenses, such as commissions paid to agents and premium taxes, and other expenses related to the underwriting process, including their employees' compensation and benefits. The key measure of relative underwriting performance for an insurance company is the combined ratio. An insurance company's combined ratio under accounting principles generally accepted in the United States (GAAP) is calculated by adding the ratio of incurred loss and LAE to earned premiums (the loss and LAE ratio) and the ratio of policy acquisition and other underwriting expenses to earned premiums (the expense ratio). A combined ratio under 100% indicates that an insurance company is generating an underwriting profit. However, when considering investment income and investment gains or losses, insurance companies operating at a combined ratio of greater than 100% can be profitable.
3
Specialty Insurance Operations
Our Specialty Insurance Operations is a collection of niche businesses that focus on solving the unique needs of particular customer or industry groups on a national scale. We provide distinct products and offer tailored coverages and services, managed by seasoned teams of market specialists. Some of these businesses maintain stand-alone operations and distribution channels targeting their specific customer groups. The majority of these businesses are focused on smaller property-casualty insurance segments where particular expertise and relationships with similarly focused distribution partners have resulted historically in strong operating results. These businesses maintain their competitive advantage through a deep knowledge of their respective customers and markets. We have added, and expect to continue to add, new businesses both organically and through acquisition, guided by our focus on profitable growth while prudently managing underwriting risk.
Our Specialty Insurance Operations segment is comprised of twelve underwriting units that are aggregated into three major underwriting units for financial reporting: MGA Business, Specialty Industries and Specialty Products.
MGA Business
Our MGA Business underwriting unit includes:
- •
- Collector Cars and Boats: Through our exclusive
partnership with the Hagerty Insurance Agency (Hagerty), we offer tailored coverages for collectible vehicles and wooden boats, automotive museums and restoration shops. Notable features include
agreed value for the insured vehicle or boat, flexible usage, and overseas shipping/foreign touring coverage—all supported by in-house claims expertise. Our relationship with
Hagerty has an initial term of five years and will be up for renewal in the second quarter of 2013.
- •
- A.W.G. Dewar (Dewar): Dewar has been a leading provider
of tuition reimbursement insurance since 1930. Dewar's product protects both schools and parents from the financial consequences of a student's withdrawal or dismissal from school. We have an
ownership interest of approximately 80% in the Dewar agency.
- •
- OneBeacon Entertainment (OBE): OBE provides specialized commercial insurance products, including professional liability coverages, for the entertainment, sports and leisure industries. OBE encompasses Entertainment Brokers International Insurance Services (EBI), which we acquired in July 2008 and continues to operate as a managing agency offering additional specialized coverages through a network of independent agents and brokers.
Specialty Industries
Our Specialty Industries underwriting unit includes:
- •
- International Marine Underwriters (IMU): IMU traces its
roots to the early 1900s. This group offers a full range of ocean marine insurance products including, but not limited to, commercial hull and marine liabilities at both the primary and excess levels;
ocean and air cargo with coverage extensions such as inland transit, warehousing, and processing; yachts; and several marine "package" products with comprehensive property, auto and liability
coverage.
- •
- OneBeacon Technology Insurance (OBTI): OBTI offers worldwide insurance solutions for the technology sector. Our InfoTech coverages feature professional liability, data privacy, products liability, and property and business income targeting the software, hardware manufacturing, telecommunications service industries and solar energy. Our MedTech offerings include products and general liability as well as human clinical trials, property and business income well suited for
4
- •
- Specialty Accident and Health (A&H): A&H offers accident
and health insurance principally through four segments: Commercial (midsized organizations to Fortune 1000 companies); Transportation (trucking and courier); Programs (associations and other affinity
groups); and Services (bundled and unbundled). A&H's products include accidental death and dismemberment, occupational accident, non-truckers liability, vehicle physical damage and other
accident and health coverages. A&H also manages OneBeacon Services, which provides employers and affinity groups with access to a suite of services including a discounted prescription drug program,
identity theft resolution services and travel assistance services.
- •
- OneBeacon Government Risks (OBGR): OBGR provides
protection for midsized municipalities and counties, special districts including water and sanitation, non-rail transit authorities and other publicly funded agencies. Coverages include
property, casualty and professional liability comprised of law enforcement, public officials and employment practices liability offered on a fully insured, deductible, self-insured
retention or assumed reinsurance basis.
- •
- OneBeacon Energy Group (OBEG): OBEG focuses on mid-market upstream and midstream conventional energy business, alternative and renewable energy producers, alternative fuel producers and related service and manufacturing enterprises. The business offers a full array of property, inland marine and casualty insurance, including property damage, boiler and machinery breakdown, general liability, auto liability and umbrella liability. OBEG continues to develop and expand product offerings to serve customers' needs. OBEG does not offer offshore energy products.
manufacturers of diagnostic and therapeutic medical devices, veterinary products and biologic devices. Our team fields an expert staff in both Risk Control and Technology Claims handling.
Specialty Products
Our Specialty Products underwriting unit includes:
- •
- OneBeacon Professional Insurance (OBPI): OBPI specializes
in professional liability solutions for targeted industries including hospitals, long-term care facilities, medical facilities, physician groups, media organizations, lawyers, real estate
professionals, design professionals, financial services and technology providers. Additionally, OBPI provides employment practices liability insurance, management liability and tailored products for
complex organizations including health care provider excess insurance and HMO reinsurance. General liability, property and workers' compensation coverages are also available for financial
institutions. OBPI's policies are primarily issued on a "claims made" basis, which generally covers claims that are made against an insured during the time period when a liability policy is in effect.
- •
- OneBeacon Property and Inland Marine (PIM): PIM provides
monoline property and inland marine products. The business' property focus is on the real estate, health care, education, aviation, and municipality sectors for property coverages, while inland marine
targets the construction, transportation and fine arts segments. PIM delivers creative and tailored solutions that fit our customers' unique needs through broad coverage forms, specialized risk
control and claims-handling capabilities.
- •
- OneBeacon Specialty Property (OBSP): OBSP provides excess
property and inland marine coverages that augment primary policies or self-insured retentions. Target classes of business include apartments and condominiums, commercial real estate,
small-to-medium manufacturing, retail/wholesale, education and public entities. OBSP products are provided primarily through surplus lines wholesalers.
- •
- OneBeacon Excess and Surplus (OBES): Our newest business, OBES was established in July 2010 both to support our current businesses and to write selectively in the excess and surplus
5
market. OBES includes OneBeacon Environmental which offers specialized environmental insurance products designed to address a broad range of exposures faced by businesses. Capabilities include commercial general liability, contractors environmental liability, professional liability, environmental premises liability, products pollution liability and follow-form excess.
For the years ended December 31, 2010, 2009 and 2008, our Specialty Insurance Operations net written premiums by underwriting unit were as follows:
| |
Year ended December 31, | |||||||||
|---|---|---|---|---|---|---|---|---|---|---|
| |
2010 | 2009 | 2008 | |||||||
| |
($ in millions) |
|||||||||
MGA Business(1) |
$ | 269.2 | $ | 256.7 | $ | 181.4 | ||||
Specialty Industries |
317.6 | 292.3 | 279.7 | |||||||
Specialty Products |
401.2 | 397.2 | 375.8 | |||||||
Total Specialty Insurance Operations |
$ | 988.0 | $ | 946.2 | $ | 836.9 | ||||
- (1)
- Collector cars and boats began writing premiums in the second quarter of 2008. EBI was acquired in the third quarter of 2008.
Geographic Concentration
Substantially all of our net written premiums are derived from business produced in the United States. Business from Specialty Insurance Operations was produced in the following states:
| |
Year ended December 31, | ||||||||||
|---|---|---|---|---|---|---|---|---|---|---|---|
| |
2010 | 2009 | 2008 | ||||||||
California |
13.4 | % | 12.8 | % | 12.1 | % | |||||
New York |
8.8 | 9.0 | 9.2 | ||||||||
Texas |
6.7 | 7.0 | 6.5 | ||||||||
Florida |
5.6 | 5.5 | 5.7 | ||||||||
Massachusetts |
5.0 | 5.5 | 5.2 | ||||||||
New Jersey |
3.8 | 4.3 | 4.4 | ||||||||
Other(1) |
56.7 | 55.9 | 56.9 | ||||||||
Total |
100.0 | % | 100.0 | % | 100.0 | % | |||||
- (1)
- No individual state was greater than 4% of net written premiums, except as noted above.
Our Other Insurance Operations includes AutoOne, the division that offers products and services to the assigned risk market. AutoOne is a market leader in "assigned risk" business in New York. Assigned risk plans provide automobile insurance for individuals unable to secure coverage in the voluntary market. Insurance carriers are obliged to accept future assignments from state assigned risk pools as a condition of maintaining a license to write automobile business in the state. However, carriers may satisfy their assigned risk obligation by buying out of their assignments through an agreement with an approved Assigned Risk Servicing Company or limit their assignments through the purchase and transfer of "credits" (for example, take-out, territorial and youthful driver credits). AutoOne offers services known as Limited Assignment Distribution (LAD) and Commercial Limited Assignment Distribution (CLAD), and credit programs to insurance carriers. AutoOne provides 28 LAD and CLAD programs in 21 states and the District of Columbia where assigned risk obligations may be assumed by a servicing carrier under a negotiated fee arrangement.
6
Our Other Insurance Operations also includes run-off business, which consists primarily of non-specialty commercial lines business included in the Commercial Lines Transaction, as well as national accounts, certain specialty programs and regional agency business transferred to Liberty Mutual Insurance Group (Liberty Mutual) effective November 1, 2001. Additionally, our Other Insurance Operations includes the traditional personal lines business sold as part of the Personal Lines Transaction and certain purchase accounting adjustments relating to the OneBeacon Acquisition.
On December 3, 2009, we sold the renewal rights to our non-specialty commercial lines business to The Hanover. The Commercial Lines Transaction included small commercial accounts and the non-specialty portion of the middle-market business, beginning with January 1, 2010 effective dates. We continue to manage claims from our non-specialty commercial lines policies written prior to the Commercial Lines Transaction. Through June 30, 2010, we also managed claims from business fronted by OneBeacon and reinsured to The Hanover. We continue to provide claims system access and first notice of loss service to The Hanover. The Hanover reimburses us for our expenses incurred to provide the claims administration services.
On July 1, 2010, we completed the sale of our traditional personal lines business to Tower. In addition, the Personal Lines Transaction included the execution of reinsurance agreements with certain subsidiaries of the Company pursuant to which we cede, on a 100% quota share basis, traditional personal lines business not directly written by companies included in the sale and assume, on a 100% quota share basis, non-traditional personal lines business written directly by York. The non-traditional personal lines business assumed back from Tower is reported within Specialty Insurance Operations. We also entered into a Transition Services Agreement (TSA), pursuant to which we provide certain services to Tower during the three-year term of the TSA. Tower reimburses us for all of our expenses incurred to provide these services. Reimbursement for these services is netted against the expense incurred.
Beginning in 2001, national accounts and certain specialty programs were discontinued. On November 1, 2001, we transferred our regional agency business, agents and operations in 42 states and the District of Columbia to Liberty Mutual pursuant to a renewal rights agreement (the Liberty Agreement). We continue to manage claims from the discontinued national accounts and specialty programs business as well as the claims related to the business that was subject to the Liberty Agreement (legacy run-off).
For the years ended December 31, 2010, 2009 and 2008, our net written premiums from Other Insurance Operations were as follows:
| |
Year ended December 31, | |||||||||
|---|---|---|---|---|---|---|---|---|---|---|
| |
2010 | 2009 | 2008 | |||||||
| |
($ in millions) |
|||||||||
Other Insurance Operations |
$ | 248.3 | $ | 960.5 | $ | 1,126.2 | ||||
7
Geographic Concentration
Substantially all of our net written premiums are derived from business produced in the United States. Business from Other Insurance Operations was produced in the following states:
| |
Year ended December 31, | ||||||||||
|---|---|---|---|---|---|---|---|---|---|---|---|
| |
2010 | 2009 | 2008 | ||||||||
New York |
45.8 | % | 28.3 | % | 29.9 | % | |||||
Massachusetts |
17.6 | 19.3 | 20.8 | ||||||||
New Jersey |
17.4 | 10.5 | 10.4 | ||||||||
Connecticut |
10.8 | 8.7 | 8.3 | ||||||||
Maine |
5.9 | 7.8 | 8.4 | ||||||||
California |
1.1 | 9.5 | 7.2 | ||||||||
Other(1) |
1.4 | 15.9 | 15.0 | ||||||||
Total |
100.0 | % | 100.0 | % | 100.0 | % | |||||
- (1)
- No individual state was greater than 3% of net written premiums.
Marketing and Distribution
We offer our products through a network of independent agents, regional and national brokers and wholesalers. Overall, we have approximately 2,900 distribution relationships across the country. In recent years, we have expanded our distribution channels to include select MGAs, either through acquisitions or exclusive relationships. These MGAs focus on a particular customer group with tailored products and services, and related expertise.
We protect the integrity of our franchise value by selectively appointing distribution partners that demonstrate business, industry knowledge and geographic profiles that align with our target markets and specialized capabilities. We believe in the added value provided by independent distribution partners as they conduct more complete assessments of their clients' needs, which result in more appropriate coverages and prudent risk management. We also believe that agencies and brokers will continue to be a significant force in overall industry premium production.
Underwriting and Pricing
We believe there must be a realistic expectation of attaining an underwriting profit on all the business we write, as well as a demonstrated fulfillment of that expectation over time. Consistent with our "underwriting comes first" operating principle, adequate pricing is a critical component for achieving an underwriting profit. We underwrite our book with a disciplined approach towards pricing our insurance products and are willing to forgo a business opportunity if we believe it is not priced appropriately to the exposure.
We actively monitor pricing activity and measure usage of tiers, credits, debits and limits. In addition, we regularly update base rates to achieve targeted returns on capital and attempt to shift writings away from lines and classes where pricing is inadequate. To the extent changes in premium rates, policy forms or other matters are subject to regulatory approval (see "Regulatory Matters—General" and "Risk Factors—Regulation may restrict our ability to operate"), we proactively monitor our pending regulatory filings to facilitate, to the extent possible, their prompt processing and approval. Lastly, we expend considerable effort to measure and verify exposures and insured values.
8
Competition
Property and casualty insurance is highly competitive. Our businesses each compete against a different subset of companies. In general terms, we compete to varying degrees in one or more of our businesses with most of the large multi-line insurance companies, such as ACE Limited, Chartis Insurance, Chubb Group of Insurance Companies, CNA Insurance, Liberty Mutual Insurance Group, Travelers Insurance Group Holdings Inc. and Zurich Financial Services Ltd. We also compete with most of the specialty companies, such as Allied World Assurance Company, HCC Insurance Holdings, Inc., Ironshore Inc., Markel Corporation, RLI Corp. and W.R. Berkley Corporation. Lastly, we compete in certain of our businesses with various local and regional insurance companies.
The more significant competitive factors for most insurance products we offer are price, product terms and conditions, agency and broker relationships, and claims service. Our underwriting principles and dedication to independent distribution partners are unlikely to make us the low-cost provider in most markets. While it is often difficult for insurance companies to differentiate their products, we believe that providing superior specialty products to satisfy well-defined market needs and relying on agents and brokers who value our targeted expertise, superior claims service, and disciplined underwriting, we establish our competitive advantage. The continued existence of carriers operating with lower cost structures places ongoing pressure on our pricing and terms and conditions, which may impact our ability to compete.
Claims Management
Effective claims management is a critical factor in achieving satisfactory underwriting results. We maintain an experienced staff of appraisers, medical specialists, managers and field adjusters strategically located throughout our operating territories. We also maintain a special investigative unit designed to detect insurance fraud and abuse and support efforts by regulatory bodies and trade associations to curtail fraud.
Following the Commercial Lines Transaction and the Personal Lines Transaction, claims operations are now organized into ongoing claims and run-off claims, with specific claims resources supporting the respective operations. This approach allows us to better identify and manage claims handling costs. In addition, a shared claims service unit manages costs related to all claims staff and vendors. We have adopted a total claims cost management approach that gives equal importance to controlling claims handling expenses, legal expenses and claims payments, enabling us to lower the sum of the three. This approach requires the utilization of a considerable number of conventional metrics to monitor the effectiveness of various programs implemented to lower total loss costs. We utilize the metrics to guard against implementation of expense containment programs that will cost us more than we expect to save.
Our claims department utilizes a claims workstation to record reserves, payments and adjuster activity and, with support from expert tools, assists each claim handler in identifying recovery potential, estimating property damage, evaluating claims and identifying fraud. Our commitment and performance in fighting insurance fraud has reduced claim costs and aided law enforcement investigations.
In connection with the OneBeacon Acquisition, Aviva caused us to purchase a reinsurance contract with National Indemnity Company (NICO) to help protect against potential asbestos and environmental (A&E) claims relating to the pre-acquisition period prior to 2001 (the NICO Cover). See "Business—Catastrophe Management and Reinsurance Protection." NICO has retained a third-party administrator (TPA), Resolute New England (Resolute) to manage the claims processing for A&E claims reinsured under the NICO Cover. Our claims department personnel are consulted by NICO and Resolute on major claims. As with all TPAs, claims department personnel continually monitor Resolute to ensure its controls, processes and settlements are appropriate. See "Management's Discussion and Analysis of Financial Condition and Results of Operations—Critical Accounting Estimates—Asbestos and Environmental Reserves."
9
Catastrophe Management and Reinsurance Protection
In the normal course of our business, we purchase reinsurance from high-quality, highly rated, third-party reinsurers in order to minimize loss from large losses or catastrophic events.
The timing and size of catastrophe losses are unpredictable and the level of losses experienced in any year could be material to our operating results and financial position. Examples of catastrophes include losses caused by earthquakes, wildfires, hurricanes and other types of storms and terrorist acts. The extent of losses caused by catastrophes is a function of the amount and type of insured exposure in the area affected by the event as well as the severity of the event. We use models (primarily AIR Version 12) to estimate the probability of the occurrence of a catastrophic event as well as potential losses under various scenarios. We use this model output in conjunction with other data to manage our exposure to catastrophe losses through individual risk selection and by limiting our concentration of insurance written in catastrophe-prone areas such as coastal regions. In addition, we impose wind deductibles on existing coastal windstorm exposures.
We seek to further reduce our potential loss from catastrophe exposures through the purchase of catastrophe reinsurance. Effective July 1, 2010, we renewed our property catastrophe reinsurance program through June 30, 2011. The program provides coverage for our property business as well as certain acts of terrorism. Under the program, the first $80.0 million of losses resulting from any single catastrophe are retained and the next $195.0 million of losses resulting from the catastrophe are reinsured, although we retain a co-participation (20% of losses in excess of $80.0 million up to $100.0 million and 8% of losses in excess of $100.0 million up to $140.0 million). Any loss above $275.0 million would be retained in full. In the event of a catastrophe, our property catastrophe reinsurance program is reinstated for the remainder of the original contract term by paying a reinstatement premium that is based on the percentage of coverage reinstated and the original property catastrophe coverage premium. We anticipate that the $275.0 million limit is sufficient to cover Northeast windstorm losses with a 0.4%-0.5% probability of occurrence (1-in-250-year event to 1-in-200-year event). This $275.0 million limit was reduced from the $850.0 million limit that our previous catastrophe reinsurance program provided. This reduction was in response to the greatly lower Northeast windstorm exposure as a result of the Commercial Lines Transaction and the Personal Lines Transaction.
Our property catastrophe reinsurance program does not cover property losses resulting from nuclear events or biological, chemical or radiological terrorist attacks or losses resulting from acts of terrorism as defined under the Terrorism Risk Insurance Act of 2002 (the Terrorism Act), as amended, committed by an individual or individuals acting on behalf of any foreign person or foreign interest. See "Business—Terrorism."
We also purchase property-per-risk reinsurance coverage to reduce large loss volatility. The property-per-risk reinsurance program reinsures losses in excess of $10 million up to $100 million. Individual risk facultative reinsurance may be purchased above $100 million where we deem it appropriate. The property-per-risk treaty also provides one limit of reinsurance protection for losses in excess of $10 million up to $100 million on an individual risk basis for terrorism losses. However, nuclear, biological, chemical and radiological terrorist attacks are not covered.
We also maintain a casualty reinsurance program that provides protection for individual policies involving workers compensation, general liability, automobile liability, professional liability or umbrella liability in excess of $5 million up to $21 million ($20 million for healthcare professional liability). Liability clash losses involving more than one insured are covered by a dedicated treaty up to $40 million in excess of a $10 million retention.
In addition, we have reinsurance contracts with two reinsurance companies rated "A++" (Superior, the highest of fifteen financial strength ratings) by A.M. Best and "AA+" (Very Strong, the
10
second highest of twenty-one financial strength ratings) by Standard & Poor's. One is the reinsurance cover with NICO which entitles us to recover up to $2.5 billion in ultimate loss and LAE incurred related primarily to A&E claims arising from business written prior to 1992 for asbestos claims and 1987 for environmental claims and certain other exposures. As of December 31, 2010, we have ceded estimated incurred losses of approximately $2.2 billion to the NICO Cover. Net losses paid totaled $1.4 billion as of December 31, 2010, with $182.1 million paid in 2010. The other contract is a reinsurance cover with General Reinsurance Corporation (GRC) for up to $570 million of additional losses on all claims arising from accident years 2000 and prior (the GRC Cover). Through December 31, 2010, we had ceded estimated incurred losses of $550 million to the GRC Cover. Pursuant to the GRC Cover, we are not entitled to recover losses to the full contract limit if such losses are reimbursed by GRC more quickly than anticipated at the time the contract was signed. We intend to seek reimbursement from GRC only for claims which result in payment patterns similar to those supporting our recoverables recorded pursuant to the GRC Cover. The economic cost of not submitting certain other eligible claims to GRC is primarily the investment spread between the rate credited by GRC and the rate achieved by us on our own investments. This cost, if any, is expected to be nominal. During the year ended December 31, 2010, we collected $61.3 million under the GRC Cover.
Reinsurance contracts do not relieve us of our obligations. Therefore, collectibility of balances due from reinsurers is critical to our financial strength. See Note 4—"Reinsurance" of the accompanying consolidated financial statements.
Terrorism
Since the terrorist attacks of September 11, 2001, we have sought to mitigate the risk associated with any future terrorist attacks by limiting the aggregate insured value of policies in geographic areas with exposure to losses from terrorist attacks. This is accomplished by either limiting the total insured values exposed, or, where applicable, through the use of terrorism exclusions.
In December 2007, the U.S. government extended the Terrorism Act for seven more years until December 31, 2014. The Terrorism Act, originally enacted in 2002, established a federal "back-stop" for commercial property and casualty losses, including workers compensation, resulting from acts of terrorism by or on behalf of any foreign person or foreign interest. As extended, the law now also covers domestic acts of terrorism. The law limits the industry's aggregate liability by requiring the federal government to share 85% of certified losses once a company meets a specific retention or deductible as determined by its prior year's direct written premiums and limits the aggregate liability to be paid by the government and industry without further action by Congress at $100 billion. In exchange for this "back-stop," primary insurers are required to make coverage available to commercial insureds for losses from acts of terrorism as specified in the Terrorism Act. The following types of coverage are excluded from the program: commercial automobile, burglary and theft, surety, farmowners multi-peril and all professional liability coverage except directors and officers coverage.
We estimate our individual retention level for commercial policies subject to the Terrorism Act to be approximately $135 million in 2011. Our retention is based on the previous year's (2010) direct earned premium for subject lines of business and has dropped approximately 25% over 2010 due to the Commercial Lines Transaction. The federal government will pay 85% of covered terrorism losses that exceed our or the industry's retention levels in 2011, up to a total of $100 billion.
Our current property and casualty catastrophe reinsurance programs provide coverage for both "certified" and "non-certified" events as defined under the Terrorism Act provided such losses are not the result of a nuclear, biological, chemical or radiological terrorist attack, or for "certified" acts committed by an individual or individuals acting on behalf of any foreign person or foreign interest. See "Business—Catastrophe Management and Reinsurance Protection."
11
We closely monitor and manage our concentration of risk by geographic area. Our guideline is to control our exposures so that our total maximum expected loss from a likely terrorism event within any half-mile radius in a metropolitan area or around a target risk will not exceed $200 million, or $300 million in all other areas. Reports monitoring our terrorism exposures are generated quarterly, and the exposure of potential new business located in areas of existing concentration or that individually present significant exposure is evaluated during the underwriting process. As a result, we believe that we have taken appropriate actions to limit our exposure to losses from terrorist attacks and will continue to monitor our terrorism exposure in the future. Nonetheless, risks insured by us, including those covered by the Terrorism Act, remain exposed to terrorist attacks and the possibility remains that losses resulting from future terrorist attacks could prove to be material.
Loss and LAE Reserves
We establish loss and LAE reserves that are estimates of amounts needed to pay claims and related expenses in the future for insured events that have already occurred. The process of estimating reserves involves a considerable degree of judgment by management and, as of any given date, is inherently uncertain. See "Management's Discussion and Analysis of Financial Condition and Results of Operations—Critical Accounting Estimates."
The following tables summarize our loss and LAE reserve activities for the years ended December 31, 2010, 2009 and 2008:
Year ended December 31, 2010
|
Specialty Insurance Operations |
Other Insurance Operations(2) |
Consolidated | |||||||
|---|---|---|---|---|---|---|---|---|---|---|
| |
($ in millions) |
|||||||||
Gross beginning balance |
$ | 704.7 | $ | 3,230.1 | $ | 3,934.8 | ||||
Less beginning reinsurance recoverable on unpaid losses |
(46.4 | ) | (2,146.5 | ) | (2,192.9 | ) | ||||
Net loss and LAE reserves |
658.3 | 1,083.6 | 1,741.9 | |||||||
Loss and LAE incurred relating to: |
||||||||||
Current year losses |
567.6 | 413.7 | 981.3 | |||||||
Prior year losses |
(28.0 | ) | (23.1 | ) | (51.1 | ) | ||||
Total incurred loss and LAE |
539.6 | 390.6 | 930.2 | |||||||
Loss and LAE paid relating to(1): |
||||||||||
Current year losses |
(201.1 | ) | (215.6 | ) | (416.7 | ) | ||||
Prior year losses |
(215.4 | ) | (406.7 | ) | (622.1 | ) | ||||
Total loss and LAE payments |
(416.5 | ) | (622.3 | ) | (1,038.8 | ) | ||||
Net loss and LAE reserves |
781.4 | 851.9 | 1,633.3 | |||||||
Net loss and LAE reserves sold as part of the Personal Lines Transaction |
— | (231.0 | ) | (231.0 | ) | |||||
Net ending balance |
781.4 | 620.9 | 1,402.3 | |||||||
Plus ending reinsurance recoverable on unpaid losses |
60.1 | 1,833.1 | 1,893.2 | |||||||
Gross ending balance |
$ | 841.5 | $ | 2,454.0 | $ | 3,295.5 | ||||
- (1)
- Loss and LAE paid for the year ended December 31, 2010 includes $78.2 million of traditional personal lines loss reserves not directly written by York or Massachusetts Homeland Insurance Company ($2.5 million relating to current year losses and $75.7 million relating to prior year losses) ceded to Tower pursuant to the Personal Lines Transaction which closed in July 2010.
12
Year ended December 31, 2009
|
Specialty Insurance Operations |
Other Insurance Operations(2) |
Consolidated | |||||||
|---|---|---|---|---|---|---|---|---|---|---|
| |
($ in millions) |
|||||||||
Gross beginning balance |
$ | 629.9 | $ | 3,664.1 | $ | 4,294.0 | ||||
Less beginning reinsurance recoverable on unpaid losses |
(52.4 | ) | (2,450.9 | ) | (2,503.3 | ) | ||||
Net loss and LAE reserves |
577.5 | 1,213.2 | 1,790.7 | |||||||
Loss and LAE incurred relating to: |
||||||||||
Current year losses |
487.6 | 717.7 | 1,205.3 | |||||||
Prior year losses |
(84.6 | ) | 1.2 | (83.4 | ) | |||||
Total incurred loss and LAE |
403.0 | 718.9 | 1,121.9 | |||||||
Accretion of fair value adjustment to net loss and LAE reserves |
— | 5.4 | 5.4 | |||||||
Loss and LAE paid relating to: |
||||||||||
Current year losses |
(169.8 | ) | (329.5 | ) | (499.3 | ) | ||||
Prior year losses |
(152.4 | ) | (524.4 | ) | (676.8 | ) | ||||
Total loss and LAE payments |
(322.2 | ) | (853.9 | ) | (1,176.1 | ) | ||||
Net ending balance |
685.3 | 1,083.6 | 1,741.9 | |||||||
Plus ending reinsurance recoverable on unpaid losses |
46.4 | 2,146.5 | 2,192.9 | |||||||
Gross ending balance |
$ | 704.7 | $ | 3,230.1 | $ | 3,934.8 | ||||
Year ended December 31, 2008
|
Specialty Insurance Operations |
Other Insurance Operations(2) |
Consolidated | |||||||
|---|---|---|---|---|---|---|---|---|---|---|
| |
($ in millions) |
|||||||||
Gross beginning balance |
$ | 490.9 | $ | 3,989.4 | $ | 4,480.3 | ||||
Less beginning reinsurance recoverable on unpaid losses |
(34.9 | ) | (2,594.6 | ) | (2,629.5 | ) | ||||
Net loss and LAE reserves |
456.0 | 1,394.8 | 1,850.8 | |||||||
Loss and LAE incurred relating to: |
||||||||||
Current year losses |
412.5 | 775.7 | 1,188.2 | |||||||
Prior year losses |
(64.8 | ) | 2.8 | (62.0 | ) | |||||
Total incurred loss and LAE |
347.7 | 778.5 | 1,126.2 | |||||||
Accretion of fair value adjustment to net loss and LAE reserves |
— | 12.0 | 12.0 | |||||||
Loss and LAE paid relating to: |
||||||||||
Current year losses |
(125.9 | ) | (369.2 | ) | (495.1 | ) | ||||
Prior year losses |
(100.3 | ) | (602.9 | ) | (703.2 | ) | ||||
Total loss and LAE payments |
(226.2 | ) | (972.1 | ) | (1,198.3 | ) | ||||
Net ending balance |
577.5 | 1,213.2 | 1,790.7 | |||||||
Plus ending reinsurance recoverable on unpaid losses |
52.4 | 2,450.9 | 2,503.3 | |||||||
Gross ending balance |
$ | 629.9 | $ | 3,664.1 | $ | 4,294.0 | ||||
- (2)
- In connection with purchase accounting for the OneBeacon Acquisition, we were required to adjust to fair value our loss and LAE reserves and the related reinsurance recoverables by $646.9 million and $346.9 million, respectively, on our acquired balance sheet as of June 1, 2001. This net reduction to loss and LAE reserves of $300.0 million is being accreted through an income statement charge ratably with and over the period the claims are settled. Balances of these
13
purchase accounting adjustments to loss and LAE reserves and related reinsurance recoverables were as follows:
| |
Gross Loss and LAE Reserve Balance |
Reinsurance Recoverables on Unpaid Losses |
Net Loss and LAE Reserve Balance |
|||||||
|---|---|---|---|---|---|---|---|---|---|---|
| |
($ in millions) |
|||||||||
January 1, 2008 |
$ | (238.5 | ) | $ | (221.1 | ) | $ | (17.4 | ) | |
December 31, 2008 |
(210.5 | ) | (205.1 | ) | (5.4 | ) | ||||
December 31, 2009 |
(190.5 | ) | (190.5 | ) | — | |||||
December 31, 2010 |
(176.5 | ) | (176.5 | ) | — | |||||
The following information presents (1) our reserve development over the preceding 10 years and (2) a reconciliation of reserves in accordance with accounting principles and practices prescribed or permitted by insurance authorities (statutory basis) to such reserves determined in accordance with GAAP, each as prescribed by Securities Act Industry Guide No. 6.
Section I of the 10-year table shows the estimated liability that was recorded at the end of each of the indicated years for all current and prior accident year unpaid loss and LAE. The liability represents the estimated amount of loss and LAE for claims that were unpaid at the balance sheet date, including incurred but not reported, or IBNR, reserves. In accordance with GAAP, the liability for unpaid loss and LAE is recorded in the balance sheet gross of the effects of reinsurance with an estimate of reinsurance recoverables arising from reinsurance contracts reported separately as an asset. The net balance represents the estimated amount of unpaid loss and LAE outstanding as of the balance sheet date, reduced by estimates of amounts recoverable under reinsurance contracts.
Section II shows the cumulative amount of net loss and LAE paid relating to recorded liabilities as of the end of each succeeding year. Section III shows the re-estimated amount of the previously recorded net liability as of the end of each succeeding year. Estimates of the liability for unpaid loss and LAE are increased or decreased as payments are made and more information regarding individual claims and trends, such as overall frequency (the average number of claims submitted per policy during a given period of time) and severity (the average value of claims submitted per policy during a given period of time) patterns, becomes known. Section IV shows the cumulative net (deficiency)/redundancy representing the aggregate change in the liability from original balance sheet dates and the re-estimated liability through December 31, 2010. Section V shows the re-estimated gross liability and re-estimated reinsurance recoverables through December 31, 2010. Section VI shows the cumulative gross
14
(deficiency)/redundancy representing the aggregate change in the liability from original balance sheet dates and the re-estimated liability through December 31, 2010.
| |
Loss and LAE(1)(2) Year ended December 31, |
|||||||||||||||||||||||||||||||||
|---|---|---|---|---|---|---|---|---|---|---|---|---|---|---|---|---|---|---|---|---|---|---|---|---|---|---|---|---|---|---|---|---|---|---|
| |
2000 | 2001 | 2002 | 2003 | 2004 | 2005 | 2006 | 2007 | 2008 | 2009 | 2010 | |||||||||||||||||||||||
| |
($ in millions) |
|||||||||||||||||||||||||||||||||
I. Liability for unpaid loss and LAE: |
||||||||||||||||||||||||||||||||||
Gross balance |
$ | 6,875.4 | $ | 8,320.2 | $ | 7,507.0 | $ | 6,109.0 | $ | 5,328.2 | $ | 5,713.4 | $ | 5,108.2 | $ | 4,718.8 | $ | 4,504.5 | $ | 4,125.3 | $ | 3,472.0 | ||||||||||||
Less reinsurance recoverable on unpaid loss and LAE |
(1,252.1 | ) | (3,591.5 | ) | (3,534.4 | ) | (2,954.8 | ) | (2,670.9 | ) | (3,382.0 | ) | (3,079.7 | ) | (2,850.6 | ) | (2,708.4 | ) | (2,383.4 | ) | (2,069.7 | ) | ||||||||||||
Net balance |
$ | 5,623.3 | $ | 4,728.7 | $ | 3,972.6 | $ | 3,154.2 | $ | 2,657.3 | $ | 2,331.4 | $ | 2,028.5 | $ | 1,868.2 | $ | 1,796.1 | $ | 1,741.9 | $ | 1,402.3 | ||||||||||||
II. Cumulative amount of net liability paid through: |
||||||||||||||||||||||||||||||||||
1 year later |
1,965.3 | 1,851.6 | 1,610.2 | 1,421.1 | 1,146.7 | 1,004.6 | 772.0 | 700.9 | 681.2 | 795.6 | ||||||||||||||||||||||||
2 years later |
3,153.0 | 3,039.5 | 2,764.2 | 2,274.5 | 1,833.5 | 1,547.8 | 1,227.3 | 1,114.5 | 1,113.9 | |||||||||||||||||||||||||
3 years later |
3,984.7 | 3,963.6 | 3,489.6 | 2,809.9 | 2,264.2 | 1,897.6 | 1,540.0 | 1,376.8 | ||||||||||||||||||||||||||
4 years later |
4,596.8 | 4,529.5 | 3,941.0 | 3,135.9 | 2,536.1 | 2,131.1 | 1,697.9 | |||||||||||||||||||||||||||
5 years later |
4,957.3 | 4,876.0 | 4,209.3 | 3,347.5 | 2,713.6 | 2,238.2 | ||||||||||||||||||||||||||||
6 years later |
5,194.4 | 5,092.4 | 4,385.4 | 3,487.6 | 2,798.7 | |||||||||||||||||||||||||||||
7 years later |
5,351.0 | 5,233.9 | 4,508.5 | 3,515.7 | ||||||||||||||||||||||||||||||
8 years later |
5,461.4 | 5,343.1 | 4,520.1 | |||||||||||||||||||||||||||||||
9 years later |
5,549.5 | 5,408.0 | ||||||||||||||||||||||||||||||||
10 years later |
5,569.7 | |||||||||||||||||||||||||||||||||
III. Net liability re-estimated as of: |
||||||||||||||||||||||||||||||||||
1 year later |
4,730.8 | 4,781.3 | 4,110.3 | 3,253.4 | 2,763.2 | 2,354.3 | 1,980.2 | 1,806.2 | 1,712.7 | 1,690.8 | ||||||||||||||||||||||||
2 years later |
4,824.2 | 5,059.4 | 4,227.0 | 3,380.4 | 2,765.5 | 2,387.2 | 1,932.5 | 1,724.2 | 1,642.8 | |||||||||||||||||||||||||
3 years later |
5,294.3 | 5,143.8 | 4,344.8 | 3,396.2 | 2,852.7 | 2,350.7 | 1,873.4 | 1,675.2 | ||||||||||||||||||||||||||
4 years later |
5,336.0 | 5,222.8 | 4,365.1 | 3,520.4 | 2,835.1 | 2,316.0 | 1,825.4 | |||||||||||||||||||||||||||
5 years later |
5,383.6 | 5,244.3 | 4,497.0 | 3,521.5 | 2,839.4 | 2,304.6 | ||||||||||||||||||||||||||||
6 years later |
5,385.8 | 5,372.8 | 4,501.3 | 3,520.5 | 2,831.9 | |||||||||||||||||||||||||||||
7 years later |
5,490.1 | 5,372.9 | 4,513.4 | 3,526.2 | ||||||||||||||||||||||||||||||
8 years later |
5,492.0 | 5,386.1 | 4,521.0 | |||||||||||||||||||||||||||||||
9 years later |
5,506.8 | 5,392.9 | ||||||||||||||||||||||||||||||||
10 years later |
5,511.3 | |||||||||||||||||||||||||||||||||
IV. Cumulative net (deficiency)/redundancy(3) |
$ | 112.0 | $ | (664.2 | ) | $ | (548.4 | ) | $ | (372.0 | ) | $ | (174.6 | ) | $ | 26.8 | $ | 203.1 | $ | 193.0 | $ | 153.3 | $ | 51.1 | ||||||||||
Percent (deficient)/redundant |
2.0 | % | (14.0 | )% | (13.8 | )% | (11.8 | )% | (6.6 | )% | 1.1 | % | 10.0 | % | 10.3 | % | 8.5 | % | 2.9 | % | ||||||||||||||
V. Reconciliation of net liability re-estimated as of the end of the latest re-estimation period (see III above): |
||||||||||||||||||||||||||||||||||
Gross unpaid loss and LAE latest re-estimate |
$ | 9,695.1 | $ | 10,012.8 | $ | 9,086.5 | $ | 7,406.3 | $ | 6,339.2 | $ | 5,699.1 | $ | 4,881.8 | $ | 4,503.5 | $ | 4,335.9 | $ | 4,069.1 | ||||||||||||||
Reinsurance recoverable latest re-estimate |
(4,183.8 | ) | (4,619.9 | ) | (4,565.5 | ) | (3,880.1 | ) | (3,507.3 | ) | (3,394.5 | ) | (3,056.4 | ) | (2,828.3 | ) | (2,693.1 | ) | $ | (2,378.3 | ) | |||||||||||||
Net unpaid loss and LAE latest re-estimate |
$ | 5,511.3 | $ | 5,392.9 | $ | 4,521.0 | $ | 3,526.2 | $ | 2,831.9 | $ | 2,304.6 | $ | 1,825.4 | $ | 1,675.2 | $ | 1,642.8 | $ | 1,690.8 | ||||||||||||||
VI. Cumulative Gross (deficiency)/redundancy |
$ | (2,819.7 | ) | $ | (1,692.6 | ) | $ | (1,579.5 | ) | $ | (1,297.3 | ) | $ | (1,011.0 | ) | $ | 14.3 | $ | 226.4 | $ | 215.3 | $ | 168.6 | $ | 56.2 | |||||||||
Percent (deficient)/ redundant |
(41.0 | )% | (20.3 | )% | (21.0 | )% | (21.2 | )% | (19.0 | )% | 0.3 | % | 4.4 | % | 4.6 | % | 3.7 | % | 1.4 | % | ||||||||||||||
- (1)
- This
table reflects the effects of the NICO Cover and the GRC Cover as if they had been in effect for all periods presented.
- (2)
- The
10-year table is reflective of activity related to our loss and LAE reserves from Specialty Insurance Operations and Other Insurance
Operations and does not include the purchase accounting adjustments for the OneBeacon Acquisition or the effect of any reserve activity from the affiliate quota share agreements. Affiliate quota
shares refer to two quota share reinsurance agreements we entered into with subsidiaries of White Mountains primarily for White Mountains' capital management purposes. These agreements were commuted
in the fourth quarter of 2006 in connection with our initial public offering.
- (3)
- Our December 31, 2009 net liability for unpaid loss and LAE for Specialty Insurance Operations and Other Insurance Operations re-estimated as of one year later resulted in a net redundancy of $51.1 million.
The cumulative net redundancy/(deficiency) in the table above reflects reinsurance recoverables recorded under the NICO Cover and the GRC Cover. These covers apply to losses incurred in 2000 and prior years. As a result, they have the effect of significantly increasing our reinsurance recoverables in 2001 and reducing our net reserve deficiency for years prior to 2001 by the amount of the gross reserves ceded at the time these covers were purchased. See "Management's Discussion and Analysis of Financial Condition and Results of Operations—Critical Accounting Estimates."
15
In 2005, we increased our best estimate of gross losses related to the NICO contract by $841 million ($353 million net of other third-party reinsurance) as a result of a study of our A&E exposures. This had the effect of increasing the gross reserve deficiency for calendar years 2004 and prior. During 2008, we completed a new study of our A&E exposures. This did not result in a significant change to our best estimate of gross losses related to the NICO contract. As a result of the study, we increased our best estimate of incurred losses ceded to NICO, net of underlying reinsurance, by $83.4 million. See "Management's Discussion and Analysis of Financial Condition and Results of Operations—Critical Accounting Estimates."
The following table reconciles loss and LAE reserves for Specialty Insurance Operations and Other Insurance Operations, excluding the impact of purchase accounting adjustments, determined on a statutory basis to loss and LAE reserves determined in accordance with GAAP at December 31, as follows:
| |
December 31, | |||||||||
|---|---|---|---|---|---|---|---|---|---|---|
| |
2010 | 2009 | 2008 | |||||||
| |
($ in millions) |
|||||||||
Statutory reserves |
$ | 2,681.7 | $ | 3,285.4 | $ | 3,465.0 | ||||
Reinsurance recoverable on unpaid losses(1) |
813.1 | 866.9 | 1,073.9 | |||||||
Other(2) |
(22.8 | ) | (27.0 | ) | (34.4 | ) | ||||
GAAP reserves |
$ | 3,472.0 | $ | 4,125.3 | $ | 4,504.5 | ||||
- (1)
- Represents
adjustments made to add back reinsurance recoverables on unpaid losses included with the presentation of reserves under GAAP.
- (2)
- Represents long-term workers compensation loss and LAE reserve discount in excess of statutorily defined discount.
Investing, Financing and Corporate Operations
Investing, Financing and Corporate Operations primarily consists of investing and financing activities, as well as other assets and liabilities, and general and administrative expenses incurred at the holding company level.
Investing
Overview
Invested assets are not allocated to Specialty Insurance Operations or Other Insurance Operations since we do not manage our assets by segment. Invested assets, net investment income and net realized and unrealized investment gains (losses) related to our Specialty Insurance Operations and Other Insurance segments are included in the Investing, Financing and Corporate Operations segment since these assets are available for payment of losses and expenses for all segments.
Our long-term investment philosophy has historically been to maximize our after tax risk-adjusted return while taking prudent levels of risk and maintaining a diversified portfolio. Under this approach, each dollar of after-tax investment income and realized and unrealized gains and losses is valued equally. In response to significant declines in market levels, heightened market volatility and a lack of market liquidity, we shifted our focus from total return to capital preservation in 2008 and 2009. In particular, we significantly reduced the size of our equity portfolio and managed our fixed income portfolio to avoid realizing losses. During 2010 as overall financial markets and our investment results continued to stabilize, we gradually shifted back from a focus on capital preservation to our traditional total return investment philosophy.
16
Our investment portfolios are managed under agreements with White Mountains Advisors LLC (WM Advisors), a registered investment advisor that is owned by White Mountains, and Prospector Partners, LLC (Prospector), a registered investment advisor. See Note 16—"Related Party Disclosures" of the accompanying consolidated financial statements. Our investment portfolio mix as of December 31, 2010 consisted in large part of high quality, fixed maturity investments and short-term investments, as well as a smaller allocation to equity investments which are comprised of common stock, convertible bonds and other investments such as hedge funds and private equity funds. Our management believes that prudent levels of investments in common equity securities, convertible bonds and other investments within our investment portfolio are likely to enhance long-term after tax total returns without significantly increasing the risk profile of the portfolio.
Fixed Income and Other Investments
WM Advisors manages our fixed income portfolio, which includes both fixed maturity and short-term investments, and our other investments portfolio. WM Advisors' overall fixed maturity investment strategy is to purchase securities that are attractively priced in relation to their investment risks. WM Advisors generally manages the interest rate risk associated with holding fixed maturity investments by actively maintaining the average duration of the portfolio to achieve an adequate after tax total return without subjecting the portfolio to an unreasonable level of interest rate risk.
Common Equity Securities and Convertible Bonds
Prospector manages our common equity securities and convertible bonds portfolios. Prospector's investment strategy is to maximize absolute risk-adjusted return through investments in a variety of equity, equity-related and convertible bond instruments. Prospector invests in relatively concentrated positions in the United States and other developed markets. Prospector's philosophy is to invest for risk-adjusted return using a bottom-up, value investing approach. Preservation of capital is of the utmost importance.
Financing
Debt and the related interest expense on debt also are not allocated to or managed by segment and are included in the Investing, Financing and Corporate Operations segment.
Senior Notes
In May 2003, OneBeacon U.S. Holdings, Inc. (OBH) issued $700.0 million face value of senior unsecured debt (the Senior Notes) through a public offering, at an issue price of 99.7%. The Senior Notes bear an annual interest rate of 5.875%, payable semi-annually in arrears on May 15 and November 15, until maturity on May 15, 2013.
On May 3, 2010, OBH commenced a cash tender offer for up to $200.0 million in aggregate principal amount of the Senior Notes at a price of $1,027.50 per $1,000 principal amount. Holders of Senior Notes who tendered on or before May 14, 2010 received an early tender payment of $30 for every $1,000 principal amount. Under the cash tender offer, OBH accepted and retired $156.4 million aggregate principal amount, of which $155.2 million was tendered by the early tender deadline, for purchase for $165.4 million, which resulted in a $9.6 million loss.
During 2010, OBH repurchased and retired $29.7 million of outstanding Senior Notes for $30.8 million, which resulted in a $1.2 million loss. During 2010, OneBeacon Insurance Company (OBIC) purchased $1.1 million of outstanding Senior Notes for $1.1 million. During 2009, OBH repurchased and retired $10.6 million of outstanding Senior Notes for $8.1 million, which resulted in a $2.5 million gain. During 2009, OBIC purchased $58.3 million of outstanding Senior Notes for $55.0 million, which resulted in a $2.9 million gain. During 2008, OBH repurchased and retired
17
$24.0 million of the outstanding Senior Notes for $22.3 million, which resulted in a $1.6 million gain. As of December 31, 2010, $419.9 million face value of Senior Notes remained outstanding.
White Mountains currently provides an irrevocable and unconditional guarantee as to the payment of principal and interest (the Guarantee) on the Senior Notes. In consideration of this Guarantee, we have agreed to pay White Mountains a specified fee in the amount of 25 basis points per annum on the outstanding principal amount of the Senior Notes. We have further agreed that if White Mountains' voting interest in us ceases to represent more than 50% of all our voting securities, we will redeem, exchange or otherwise modify the Senior Notes in order to fully and permanently eliminate White Mountains' obligations under the Guarantee.
See "Management's Discussion and Analysis of Financial Condition and Results of Operations—Financing".
Other Debt of Operating Subsidiaries
In connection with the acquisition of Atlantic Specialty Insurance Company (ASIC) on March 31, 2004, we issued a $20.0 million ten-year note to the seller (the Atlantic Specialty Note). We were required to repay $2.0 million of principal on the Atlantic Specialty Note each year, commencing in January 2007. The Atlantic Specialty Note accrued interest at a rate of 5.2% except that the outstanding principal amount in excess of $15.0 million accrued interest at a rate of 3.6%. During the three months ended March 31, 2009, we repaid $2.0 million on the Atlantic Specialty Note. During the three months ended March 31, 2010, OneBeacon repaid $14.0 million on the Atlantic Specialty Note, representing the outstanding principal on the note.
Mortgage Note on Real Estate Owned
In connection with our December 2005 purchase of land and an office building in Canton, Massachusetts, we entered into a $40.8 million, 18-year mortgage note which had a variable interest rate based upon the lender's 30-day LIBOR rate. Concurrent with entering into the mortgage note, we also entered into an interest rate swap to hedge our exposure to the variability in the interest rate on the mortgage note. Repayment on the mortgage note commenced in January 2009. During the three months ended March 31, 2009, we repaid $0.2 million of principal in accordance with the terms of the mortgage note. On May 7, 2009, we repaid $40.6 million, representing the outstanding principal on the mortgage note. See "Management's Discussion and Analysis of Financial Condition and Results of Operations".
Mandatorily Redeemable Preferred Stock
As part of the financing for the OneBeacon Acquisition, Berkshire Hathaway Inc. (Berkshire) invested a total of $300.0 million in cash, of which (1) $225.0 million was for the purchase of cumulative non-voting preferred stock of OBH (the Berkshire Preferred Stock), which had a $300.0 million redemption value; and (2) $75.0 million was for the purchase of warrants to acquire 1,724,200 common shares of White Mountains. The Berkshire Preferred Stock was entitled to a dividend of no less than 2.35% per quarter through May 31, 2008. The Berkshire Preferred Stock was redeemed in the second quarter of 2008 for $300.0 million, its redemption value.
In connection with our initial public offering, we created two irrevocable grantor trusts and funded them with assets sufficient to provide for the remaining dividend and redemption payments for the $300.0 million Berkshire Preferred Stock and $20.0 million Zenith Insurance Company Preferred Stock (Zenith Preferred Stock), also part of the financing for the OneBeacon Acquisition. The creation and funding of the trusts did not legally defease the preferred stock nor create any additional rights for the holders of the preferred stock either in the trusts or otherwise, although the assets in the trusts were segregated from our other general assets and were not available for any use other than the payment of
18
the Berkshire Preferred Sock and the Zenith Preferred Stock. Assets held in one of the trusts were used to redeem the Zenith Preferred Stock in June 2007, for $20.0 million, its redemption value, while assets held in the remaining trust were used to redeem the Berkshire Preferred Stock in May 2008, for $300.0 million, its redemption value. See "Management's Discussion and Analysis of Financial Condition and Results of Operations—Economic Defeasance".
Corporate Operations
Corporate Operations consists of the activities of OneBeacon Insurance Group, Ltd. and our intermediate subsidiary holding companies which include OneBeacon U.S. Enterprises Holdings, Inc. (OBEH) and OBH, both U.S.-domiciled companies, as well as various intermediate holding companies domiciled in the United States, Gibraltar, Luxembourg and Bermuda.
General
Our insurance operations are subject to regulation and supervision in each of the jurisdictions where they are domiciled and licensed to conduct business. Generally, state regulatory authorities have broad supervisory and administrative powers over such matters as licenses, standards of solvency, premium rates, policy forms, investments, security deposits, methods of accounting, form and content of the consolidated financial statements, reserves for unpaid loss and LAE, reinsurance, minimum capital and surplus requirements, dividends and other distributions to shareholders, periodic examinations and annual and other report filings. In general, such regulation is for the protection of policyholders rather than shareholders.
State Accreditation and Monitoring
Over the last several years most states have implemented laws that establish standards for current, as well as continued, state accreditation. In addition, the National Association of Insurance Commissioners (NAIC) has adopted risk-based capital (RBC) standards for property and casualty companies, which are designed to determine minimum capital requirements and to raise the level of protection that statutory surplus provides for policyholder obligations. The RBC formula for property and casualty insurance companies measures three major areas of risk facing property and casualty insurers: underwriting, which encompasses the risk of adverse loss developments and inadequate pricing; declines in asset values arising from market and/or credit risk; and off-balance sheet risk arising from adverse experience from non-controlled assets, guarantees for affiliates or other contingent liabilities and excessive premium growth. Under laws adopted by individual states, insurers having less total adjusted capital than that required by the RBC calculation will be subject to varying degrees of regulatory action, depending on the level of capital inadequacy. Our current RBC ratios are satisfactory.
The NAIC has developed a set of financial relationships or tests known as the Insurance Regulatory Information System to assist state regulators in monitoring the financial condition of insurance companies and identifying companies that require special attention or action by insurance regulatory authorities. Insurance companies generally submit data annually to the NAIC, which in turn analyzes the data using prescribed financial data ratios, each with defined "usual ranges." Generally, regulators will begin to investigate or monitor an insurance company if its ratios fall outside the usual ranges for four or more of the ratios. If an insurance company has insufficient capital, regulators may act to reduce the amount of insurance it can issue. We are not aware that any of our insurance companies are currently subject to regulatory investigation based on these ratios.
19
State insurance laws require us to analyze the adequacy of our reserves annually. Our actuaries must submit an opinion that our reserves, when considered in light of the assets we hold with respect to those reserves, make adequate provision for our contractual obligations and related expenses.
Effective January 1, 2010, the NAIC adopted amendments to the Annual Financial Reporting Model Regulation, or the Model Audit Rule (MAR). The amendments to the MAR include provisions very similar to Sarbanes-Oxley requirements for public companies and require certain insurance companies to appoint audit committees to oversee accounting and financial reporting processes as well as the audit of the financial statements of the insurer. Audit committees also are required to appoint independent auditors, among other things. The designated audit committee must receive reports regarding significant deficiencies, material weaknesses and solvency concerns at the insurance company level. Certain insurance companies, including OneBeacon, also will be required to file a management report on internal control over financial reporting annually beginning with the fiscal year ending December 31, 2010.
Many states have laws and regulations that limit an insurer's ability to exit a market. For example, certain states limit a private passenger automobile insurer's ability to cancel or renew policies. Furthermore, certain states prohibit an insurer from withdrawing from one or more lines of insurance business in the state without the state regulator's approval. State regulators may refuse to approve withdrawal plans on the grounds that they could lead to market disruption.
Mandatory Shared Market Mechanisms
As a condition of our license to do business in certain states, we are required to participate in mandatory shared market mechanisms. Each state dictates the types of insurance and the level of coverage that must be provided. The most common type of shared market mechanism in which we are required to participate is an assigned risk plan. Many states operate assigned risk plans. These plans require insurers licensed within the applicable state to accept the applications for insurance policies of customers who are unable to obtain insurance in the voluntary market. The total number of such policies an insurer is required to accept is based on its market share of voluntary business in the state. Underwriting results related to assigned risk plans are typically adverse. Accordingly, we may be required to underwrite policies with a higher risk of loss than we would otherwise accept.
Reinsurance facilities are another type of shared market mechanism. Reinsurance facilities require an insurance company to accept all applications submitted by certain state designated agents. The reinsurance facility then allows the insurer to cede some of its business to the reinsurance facility so that the facility will reimburse the insurer for claims paid on ceded business. Typically, however, reinsurance facilities operate at a deficit, which is funded through assessments against the same insurers.
Guaranty Associations
The insurance laws of many states generally provide that property and casualty insurers doing business in those states belong to a statutory property and casualty guaranty association. The purpose of these guaranty associations is to protect policyholders by requiring that solvent property and casualty insurers pay certain insurance claims of insolvent insurers. These guaranty associations generally pay these claims by assessing solvent insurers proportionately based on the insurer's share of voluntary written premiums in the state. While most guaranty associations provide for recovery of assessments through rate increases, surcharges or premium tax credits, there is no assurance that insurers will ultimately recover these assessments. At December 31, 2010, our aggregate reserve for such assessments totaled $15.9 million.
20
Pricing, Investment and Dividends
Nearly all states have insurance laws requiring property and casualty insurers to file price schedules, policy or coverage forms, and other information with the state's regulatory authority. In most cases, such price schedules and/or policy forms must be approved prior to use. While pricing laws vary from state to state, their objectives are generally to ensure that prices are adequate, not excessive and not discriminatory.
We are subject to state laws and regulations that require investment portfolio diversification and that limit the amount of investment in certain categories. Non-compliance may cause non-conforming investments to be non-admitted in measuring statutory surplus and, in some instances, may require divestiture.
One of the primary sources of cash inflows for us and certain of our intermediary holding companies is dividends received from our operating subsidiaries. Under the insurance laws of the jurisdictions under which our insurance subsidiaries are domiciled, an insurer is restricted with respect to the timing or the amount of dividends it may pay without prior approval by regulatory authorities. During the year ended December 31, 2010, our top tier regulated operating subsidiaries distributed $776.0 million to OneBeacon Insurance Group LLC (OneBeacon LLC). This amount included $71.0 million in ordinary dividends, $535.0 million in extraordinary dividends and $170.0 million representing a return of capital. Our first tier insurance subsidiaries have the ability to pay dividends of approximately $291 million to their parent in 2011 without the prior approval of regulatory authorities.
Holding Company Structure
We are subject to regulation under certain state insurance holding company acts. These regulations contain reporting requirements relating to our capital structure, ownership, financial condition and general business operations. These regulations also contain special reporting and prior approval requirements with respect to certain transactions among affiliates. Since we are an insurance holding company, the domiciliary states of our insurance subsidiaries impose regulatory application and approval requirements on acquisitions of common shares which may be deemed to confer control over those subsidiaries, as that concept is defined under the applicable state laws. Acquisition of as little as 10% of our common shares may be deemed to confer control under the insurance laws of some jurisdictions, and the application process for approval can be extensive and time consuming.
Terrorism
While the federal government does not directly regulate the insurance business, federal legislation and administrative policies affect the insurance industry. The Terrorism Act established a federal "backstop" for commercial property and casualty losses, including workers compensation, resulting from acts of terrorism by or on behalf of any foreign person or foreign interest. As extended in December 2007, the law also covers domestic acts of terrorism. See "Business—Catastrophe Management and Reinsurance Protection" and "—Terrorism". We are actively complying with the requirements of the Terrorism Act in order to ensure our ability to be reimbursed by the federal government for any losses we may incur as a result of future terrorist acts.
Legislation
The insurance industry is highly regulated at the state level. In addition, federal legislation was enacted in July 2010 that includes a limited expansion of the federal government's ability to oversee and regulate the insurance industry. Specifically, the Dodd-Frank Wall Street Reform and Consumer Protection Act (the Dodd-Frank Act) created the Federal Insurance Office (FIO) within the Treasury Department, which is responsible for gathering information and monitoring the insurance industry to identify gaps in the regulation of insurers that could contribute to a systemic crisis in the insurance
21
industry or U.S. financial system. In addition, the FIO can recommend changes to state insurance laws and regulations. We cannot predict whether the FIO will recommend any changes or whether states will adopt any such changes.
Environmental
Both federal and state laws and regulations govern the environmental cleanup of contaminated sites by, or for the account of, potentially responsible parties (PRPs). Superfund and comparable state statutes can impose liability for the entire cost of clean-up upon any responsible party, regardless of fault. The insurance industry in general is involved in extensive litigation regarding coverage issues arising out of the cleanup of such sites by insured PRPs and as a result has disputed many such claims. From time to time, comprehensive Superfund reform proposals are introduced in Congress, but none has yet been enacted. At this time, it remains unclear as to whether Superfund reform legislation will be enacted or that any such legislation will provide for a fair, effective and cost-efficient system for settlement of Superfund related claims. The NICO Cover includes coverage for such exposures at our company, however, there can be no assurance that the coverage provided under the NICO Cover will ultimately prove to be adequate for our incurred environmental losses.
Bermuda Law
We are an exempted company organized under the Companies Act 1981 of Bermuda (Companies Act). As a result, we will need to comply with the provisions of the Companies Act regulating the payment of dividends and making of distributions from contributed surplus. A company is prohibited from declaring or paying a dividend, or making a distribution out of contributed surplus, if there are reasonable grounds for believing that:
- •
- the company is, or would after the payment be, unable to pay its liabilities as they become due; or
- •
- the realizable value of the company's assets would thereby be less than the aggregate of its liabilities and its issued share capital and share premium accounts.
Under our bye-laws, each common share is entitled to dividends if, and when, dividends are declared by our board of directors (the Board), subject to any preferred dividend rights of the holders of any preference shares. Issued share capital is the aggregate par value of the company's issued shares, and the share premium account is the aggregate amount paid for issued shares over and above their par value. Share premium accounts may be reduced in certain limited circumstances. In addition, the Companies Act regulates return of capital, reduction of capital and any purchase or redemption of shares by OneBeacon.
Although we are incorporated in Bermuda, we have been designated as a non-resident of Bermuda for exchange control purposes by the Bermuda Monetary Authority, or the BMA. Pursuant to our non-resident status, we may hold any currency other than Bermuda dollars and convert that currency into any other currency, other than Bermuda dollars, without restriction.
Shares may be offered or sold in Bermuda only in compliance with the provisions of the Investment Business Act 2003 and the Exchange Control Act 1972, and related regulations of Bermuda which regulate the sale of securities in Bermuda. In addition, specific permission is required from the BMA pursuant to the provisions of the Exchange Control Act 1972 and related regulations, for all issuances and transfers of securities of Bermuda companies, other than in cases where the BMA has granted a general permission. The BMA in its policy dated June 1, 2005 provides that where any equity securities, including our common shares, of a Bermuda company are listed on an appointed stock exchange, general permission is given for the issue and subsequent transfer of any securities of a company from and/or to a non-resident, for as long as any equity securities of such company remain so
22
listed. The New York Stock Exchange is deemed to be an appointed stock exchange under Bermuda law. Notwithstanding the above general permission, the BMA has granted us permission to, subject to our common shares being listed on an appointed stock exchange, (a) issue and transfer our shares, up to the amount of our authorized capital from time to time, to persons resident and non-resident of Bermuda for exchange control purposes; (b) issue and transfer our options, warrants, depositary receipts, rights, and other securities; and (c) issue and transfer our loan notes and other debt instruments and options, warrants, receipts, rights over loan notes and other debt instruments to persons resident and non-resident of Bermuda for exchange control purposes.
In accordance with Bermuda law, share certificates are issued only in the names of corporations or individuals. In the case of an applicant acting in a special capacity, for example, as an executor or trustee, certificates may, at the request of the applicant, record the capacity in which the applicant is acting. Notwithstanding the recording of any such special capacity, we are not bound to investigate or incur any responsibility in respect of the proper administration of any such estate or trust. We will take no notice of any trust applicable to any of our common shares whether or not we have notice of such trust.
Under Bermuda law, exempted companies are companies formed for the purpose of conducting business outside Bermuda from a principal place in Bermuda. As exempted companies, we may not, without the express authorization of the Bermuda legislature or under a license granted by the Bermuda Minister of Finance, participate in various specified business transactions, including:
- •
- the acquisition or holding of land in Bermuda, except land held by way of lease or tenancy agreement which is required for
our business and held for a term not exceeding 50 years, or which is used to provide accommodation or recreational facilities for our officers and employees and held with the consent of the
Bermuda Minister of Finance, for a term not exceeding 21 years;
- •
- the taking of mortgages on land in Bermuda in excess of $50,000;
- •
- the acquisition of any bonds or debentures secured by any land in Bermuda, other than certain types of Bermuda government
or public authority securities; or
- •
- subject to some exceptions, the carrying on of business of any kind in Bermuda for which we are not licensed in Bermuda.
Under Bermuda law, non-Bermudians (other than spouses of Bermudians) may not engage in any gainful occupation in Bermuda without an appropriate governmental work permit. Work permits may be granted or extended by the Bermuda government upon showing that, after proper public advertisement in most cases, no Bermudian (or spouse of a Bermudian) is available who meets the minimum standard requirements for the advertised position. The Bermuda government's policy limits the duration of work permits to six years, with certain exemptions for key employees.
Insurance companies are evaluated by various rating agencies in order to measure each company's financial strength. Higher ratings generally indicate financial stability and a stronger ability to pay claims. We believe that strong ratings are an important factor in the marketing of insurance products and services to distribution partners and customers. These financial strength ratings do not refer to our ability to meet non-insurance obligations and are not a recommendation to purchase or discontinue any policy or contract issued by us or to buy, hold, or sell our securities.
23
The following table presents the financial strength ratings assigned to our principal insurance operating subsidiaries as of February 23, 2011.
| |
A.M. Best(1) | Standard & Poor's(2) | Moody's(3) | Fitch(4) | ||||
|---|---|---|---|---|---|---|---|---|
| Rating | "A" (Excellent) | "A-" (Strong) | "A2" (Good) | "A" (Strong) | ||||
| Outlook | Stable | Stable | Negative | Stable |
- (1)
- "A"
is the third highest of fifteen financial strength ratings.
- (2)
- "A-"
is the seventh highest of twenty-one financial strength ratings.
- (3)
- "A2"
is the sixth highest of twenty-one financial strength ratings.
- (4)
- "A" is the sixth highest of twenty-one financial strength ratings.
As of December 31, 2010, we employed approximately 1,500 persons. We believe that we have satisfactory relations with our employees.
We are subject to the informational reporting requirements of the Securities Exchange Act of 1934. In accordance therewith, we file reports, proxy statements and other information with the Securities and Exchange Commission (SEC). These documents are available free of charge at www.onebeacon.com as soon as reasonably practicable after such material is electronically filed with or furnished to the SEC. In addition, our Code of Business Conduct as well as the charters of our Board Committees are available free of charge at www.onebeacon.com.
We will provide to any shareholder, upon request and without charge, copies of these documents (excluding any applicable exhibits unless specifically requested). Written or telephone requests should be directed to Investor Relations, OneBeacon Insurance Group, Ltd., 150 Royall Street, Canton, MA 02021, (877) 248-8765. Additionally, all such documents are physically available at our registered office at Clarendon House, 2 Church Street, Hamilton, HM 11 Bermuda.
24
The information contained in this report may contain "forward-looking statements" within the meaning of Section 27A of the Securities Act of 1933 and Section 21E of the Securities Exchange Act of 1934. See "FORWARD-LOOKING STATEMENTS" (page 103) for specific important factors that could cause actual results to differ materially from those contained in forward-looking statements. The Company's actual future results and trends may differ materially depending on a variety of factors including, but not limited to, the risks and uncertainties discussed below.
Risks Relating to Our Business
Our loss reserves may be inadequate to cover our ultimate liability for losses and as a result our financial results could be adversely affected.
We are required to maintain adequate reserves to cover our estimated ultimate liabilities for loss and LAE. Loss and LAE reserves are typically comprised of (1) case reserves for claims reported and (2) reserves for losses that have occurred but for which claims have not yet been reported, referred to as IBNR reserves, which include a provision for expected future development on case reserves. These reserves are estimates based on actuarial, claims and underwriting assessments of what we believe the settlement and administration of claims will cost based on facts and circumstances then known to us. Because of the uncertainties that surround estimating loss and LAE reserves, we cannot be certain that our reserves are adequate and actual claims and claim expenses paid might exceed our reserves due to the uncertainties that surround estimating loss and LAE reserves. For example, we have a large number of workers compensation permanent disability claims. These claims involve medical payments that will be made far into the future and therefore the impact of medical inflation including increased utilization could have a material adverse impact on the ultimate amount of losses paid.
We had established gross loss and LAE reserves of $3,295.5 million and $3,934.8 million as of December 31, 2010 and 2009, respectively. Approximately $249.3 million of the decline in our gross loss and LAE reserves relates to the Personal Lines Transaction. For the years ended December 31, 2010, 2009 and 2008, we recorded favorable loss reserve development of $51.1 million, $83.4 million and $62.0 million, respectively, net of reinsurance, related to the re-estimation of previously established reserves.
If in the future we determine that our reserves are insufficient to cover our actual loss and LAE, we would have to strengthen our reserves, which could have a material adverse effect on our results of operations and financial condition.
For additional information relating to loss and LAE reserve requirements, see "Regulatory Matters." For further discussion of our loss and LAE reserves, including our A&E reserves, see "Business—Loss and LAE Reserves" and "Management's Discussion and Analysis of Financial Condition and Results of Operations—Critical Accounting Estimates."
Exposure to asbestos or environmental claims could materially adversely affect our results of operations and financial condition.
We have exposure to A&E claims which may be difficult to estimate. To help protect against potential A&E claims relating to the period prior to 2001, we have a reinsurance contract from NICO, rated "A++" (Superior, the highest of fifteen financial strength ratings) by A.M. Best and "AA+" (Very Strong, the second highest of twenty-one financial strength ratings) by Standard & Poor's. We refer to this reinsurance contract as the NICO Cover. Under the NICO Cover we are entitled to recover up to $2.5 billion from NICO for (1) all asbestos claims arising from business written by us in 1992 and prior, (2) all environmental claims arising from business written by us in 1987 and prior, and (3) certain other latent exposures. In September 2008, we completed a study of our A&E exposures.
25
Based on the study, we increased our best estimate of incurred losses ceded to NICO, net of underlying reinsurance, by $83.4 million to $2.2 billion. As of December 31, 2010, we have ceded estimated incurred losses of approximately $2.2 billion to the NICO Cover, leaving remaining protection under the NICO Cover of $320.2 million. Net losses paid totaled $1.4 billion as of December 31, 2010, with $182.1 million paid in 2010. Due to exclusions in policy language and changes in coverages provided, we do not believe that we have significant exposure to asbestos claims arising from business we wrote after 1992 or to environmental claims arising from business we wrote after 1987.
As of December 31, 2010, we had established gross loss and LAE reserves for asbestos claims of $904.0 million. Approximately 99% of these loss and LAE reserves are covered under reinsurance arrangements. Our net loss and LAE reserves for asbestos claims after giving effect to third-party reinsurance other than the NICO Cover were $647.3 million at December 31, 2010. Our net loss and LAE reserves for asbestos claims after giving effect to both third-party reinsurance and the NICO Cover were $6.4 million at December 31, 2010.
As of December 31, 2010, we had established gross loss and LAE reserves for environmental claims of $119.0 million. Approximately 92% of these loss and LAE reserves are covered under reinsurance arrangements. Our net loss and LAE reserves for environmental claims after giving effect to third-party reinsurance other than the NICO Cover were $93.8 million at December 31, 2010. Our net loss and LAE reserves for environmental claims after giving effect to both third-party reinsurance and the NICO Cover were $9.2 million as of December 31, 2010.
Estimating our exposure to A&E claims is subject to a high degree of uncertainty and could exceed the coverage available under our reinsurance arrangements or our net loss and LAE reserves. Policyholders continue to assert new theories of recovery. From time to time, there is proposed state and federal legislation regarding A&E liability, which would also affect our exposure. Although the number of our A&E related claims has been decreasing since 2004, there is no assurance that these or other factors may not impact our liability and increase our claims. If we do not have adequate reinsurance protection and if we have not established adequate loss and LAE reserves to cover future claims, our results of operations and financial condition could be materially adversely affected.
We may not be able to successfully alleviate risk through reinsurance arrangements. Additionally, we may be unable to collect all amounts due from our reinsurers under our existing reinsurance arrangements.
We attempt to limit our risk of loss through reinsurance arrangements. The availability and cost of reinsurance protection is subject to market conditions, which are outside of our control. In addition, the coverage under our reinsurance contracts may be inadequate to cover our future liabilities. As a result, we may not be able to successfully alleviate risk through these arrangements, which could have a material adverse effect on our results of operations and financial condition.
We are not relieved of our obligations to our policyholders by purchasing reinsurance. We may be unable to recover amounts due under our reinsurance arrangements if our reinsurers choose to withhold payment due to a dispute or other factors beyond our control. We are also subject to credit risk with respect to our reinsurance in the event that a reinsurer is unable to pay amounts owed to us as a result of a deterioration in its financial condition. A number of reinsurers experienced such deterioration in the aftermath of the 2001 terrorist attacks and the active 2005 hurricane season. To mitigate this risk, we annually review and periodically monitor our reinsurers' financial condition and require at the time of purchase of reinsurance that each of our reinsurers holds a rating of at least "A-" (Excellent, the fourth highest of fifteen financial strength ratings) by A.M. Best or the equivalent. While we believe that our reinsurers' financial condition is strong, it is possible that one or more of our reinsurers will be significantly adversely affected by future significant loss events, causing them to be unable to pay amounts owed to us.
26
Many of our reinsurers are non-U.S. companies and as such are subject to foreign regulations, including Solvency II which will be effective January 1, 2013 and will regulate insurance firms that operate in the European Union. Solvency II was enacted to reduce the risk that insurers would not be able to pay claims to policyholders as well as promote financial stability through minimum capital and other requirements for the governance, risk management and supervision of insurers. We cannot predict what regulations will be adopted to implement Solvency II nor the impact of such regulation upon our non-U.S. reinsurers, which could affect our ability to obtain reinsurance on terms acceptable to us, or at all.
Unpredictable catastrophic events could adversely affect our results of operations and financial condition.
We write insurance policies that cover catastrophic events. Our policies cover unpredictable natural and other disasters, such as hurricanes, windstorms, earthquakes, floods, fires, explosions and severe winter weather. The frequency of major weather-related catastrophes has increased. Our exposure to catastrophic windstorm is the largest single natural catastrophe risk to our business, although our probable maximum loss, or PML, estimates have decreased significantly during 2010 as a result of the Commercial Lines Transaction and Personal Lines Transaction. In particular, while windstorm damage remains the largest natural catastrophe exposure for us, our PML balance is more evenly distributed across the United States as a result of the Commercial Lines Transaction and Personal Lines Transaction and the resulting shift in our business by geographic region. We continue to have some exposure to windstorm damage in the United States Atlantic Coast (i.e., Massachusetts to Florida) and the United States Gulf Coast region (i.e., Florida to Texas). We also continue to have exposure to a major earthquake in California, although our PML estimates have declined as a result of the Commercial Lines Transaction. In addition, we are exposed to losses from terrorist attacks, such as attacks on the United States on September 11, 2001.
The extent of losses from a catastrophe is a function of both the total amount of insured exposure in the area affected by the event and the severity of the event. Increases in the value and concentrations of insured property, the effects of inflation and changes in cyclical weather patterns may increase the severity of claims from catastrophic events in the future. Claims from catastrophic events could reduce our earnings and cause substantial volatility in our results of operations for any fiscal quarter or year and adversely affect our financial condition. Our ability to write new insurance policies could also be impacted as a result of corresponding reductions in our surplus levels.
We manage our exposure to catastrophic losses by limiting the aggregate insured value of policies in geographic areas with exposure to catastrophic events, by estimating our PML for many different catastrophe scenarios and by buying reinsurance. To manage and analyze aggregate insured values and PML, we use a variety of tools, including catastrophe modeling software packages. Our estimates of PML are dependent on many variables, including assumptions about the demand surge and storm surge, loss adjustment expenses, insurance-to-value and storm intensity in the aftermath of weather-related catastrophes utilized to model the event and the relationship of the actual event to the modeled event. Accordingly, if our assumptions about these variables are incorrect, the losses we might incur from an actual catastrophe could be materially higher than our expectation of losses generated from modeled catastrophe scenarios, and our results of operations and financial condition could be materially adversely affected.
In December 2009, we completed the Commercial Lines Transaction. In July 2010, we completed the Personal Lines Transaction. The Commercial Lines Transaction reduces our exposure to catastrophic events and our PML during 2010 and 2011 as policy terms expire, while the Personal Lines Transaction reduced our exposure immediately upon closing. In particular, at each of December 31, 2010 and 2009, we estimated our 1-in-250 year loss from hurricanes to be approximately $222 million and $750 million, respectively, on a gross basis.
27
Future insurance and reinsurance coverage for terrorist acts is uncertain, and we may in the future have substantial exposure to such acts.
We are unable to predict the extent to which our future insurance contracts will cover terrorist acts. We also are unsure how terrorist acts will be defined in our future contracts. The Terrorism Act, which has been modified and extended through the end of 2014, requires primary commercial insurers to make terrorism coverage available and provides Federal protection for certain losses above both individual company retention and industry retention levels. While we know of no reason that the Terrorism Act will not be extended for an additional period of time, there is no assurance that it will be extended or of the terms of any such extension. The following types of coverage are excluded from the program: commercial automobile, burglary and theft, surety, farmowners, multi-peril and all professional liability coverages except directors and officers coverage. We manage our exposure to losses resulting from acts of terrorism by limiting our concentration of risk by geographic area. We estimate our PML for different scenarios using computer models in conjunction with other data. We also manage our terrorism exposures by purchasing reinsurance. Our current property and casualty catastrophe reinsurance programs provide coverage for us for "non-certified" events as defined under the Terrorism Act, provided such losses are not the result of a nuclear, biological, chemical or radiological terrorist attack. Nonetheless, risks insured by us, including those covered by the Terrorism Act, remain exposed to terrorist attacks and the possibility remains that losses resulting from future terrorist attacks could prove to be material to our results of operations and financial condition.
Our investment portfolio may suffer reduced returns or losses which could adversely affect our results of operations and financial condition. Adverse changes in interest rates, equity markets, debt markets or market volatility could result in significant losses to the fair value of our investment portfolio.
Our investment portfolio consists of fixed maturity securities, convertible bonds, short-term investments, common equity securities and other investments such as hedge funds and private equity funds. We invest to maximize after tax total return over the long term subject to our investment guidelines and various regulatory restrictions; however, investing entails substantial risks. We cannot assure you that we will achieve our investment objectives, and our investment performance may vary substantially over time. Investment returns are an important part of our strategy to grow book value, and fluctuations in the fixed income or equity markets could impair our results of operations and financial condition. Investments generate both income, consisting primarily of interest earned on fixed maturity investments and dividends earned on equity securities, and realized and unrealized investment gains securities.
Both the investment income we generate and the fair market value of our investment portfolio are affected by general economic and market conditions, including fluctuations in interest rates, debt market levels, equity market levels and market volatility. Interest rates are highly sensitive to many factors, including governmental monetary policies, domestic and international economic and political conditions and other factors beyond our control. Although we attempt to manage the risks of changes in interest rates, we may not be able to do so. In particular, a significant increase in interest rates could result in significant losses in the fair value of our investment portfolio, and consequently, could have an adverse effect on our results of operations and financial condition. We are exposed to changes in equity markets. We are also exposed to changes in the volatility levels of various investment markets. The underlying conditions are outside of our control and could adversely affect the value of our investments and our results of operations and financial condition.
We are highly dependent on WM Advisors, which is owned by White Mountains, and Prospector, in connection with the management of our investment portfolio. WM Advisors supervises and directs the fixed income and other investments portion of our investment portfolio, and Prospector supervises and directs the publicly-traded common equity securities and convertible bonds portion of our investment portfolio. A new investment management agreement with WM Advisors was entered into
28
effective October 1, 2010 and remains in full force and effect until terminated by either party upon sixty (60) days' prior written notice. The investment management agreement with Prospector, entered into in November 2006 in connection with our initial public offering, provided for an initial fixed term of three years, which was extended by us for an additional two year term. We entered into a new investment management agreement with Prospector effective March 1, 2011 which replaces the 2006 agreement with substantially the same terms and conditions as the 2006 agreement, including an initial fixed term of three years which may be extended for an additional two year term. If we lose our investment relationship with either of WM Advisors or Prospector, we may not be able to secure an investment advisor or advisors who will produce returns on our investments similar to these produced by WM Advisors and Prospector in the past, or any positive returns at all.
We may not maintain favorable financial strength or creditworthiness ratings, which could adversely affect our ability to conduct business.
Third-party rating agencies assess and rate the financial strength, including claims-paying ability, of insurers and reinsurers. These ratings are based upon criteria established by the rating agencies and are subject to revision at any time at the sole discretion of the agencies. Some of the criteria relate to general economic conditions and other circumstances outside the rated company's control. These financial strength ratings are used by policyholders, agents and brokers as an important means of assessing the suitability of insurers as business counterparties and have become an increasingly important factor in establishing the competitive position of insurance companies. These financial strength ratings do not refer to our ability to meet non-insurance obligations and are not a recommendation to purchase or discontinue any policy or contract issued by us or to buy, hold or sell our securities. General creditworthiness ratings are used by existing or potential investors to assess the likelihood of repayment on a particular debt issue. We believe that strong creditworthiness ratings are important factors that provide better financial flexibility when issuing new debt or restructuring existing debt.
Rating agencies periodically evaluate us to confirm that we continue to meet the criteria of the ratings previously assigned to us. Our current financial strength ratings are "A" (Excellent, third highest of fifteen ratings) by A. M. Best, "A-" (Strong, seventh highest of twenty-one ratings) by Standard & Poor's, "A2" (Good, sixth highest of twenty-one ratings) by Moody's and "A" (Strong, sixth highest of twenty-one ratings) by Fitch. We currently have a "Stable" outlook from A.M. Best, Standard & Poor's and Fitch, and a "Negative" outlook from Moody's. A downgrade, withdrawal or negative watch/outlook of our financial strength ratings could severely limit or prevent our insurance subsidiaries from writing new insurance policies or renewing existing insurance policies, which could have a material adverse effect on our results of operations and financial condition. A downgrade, withdrawal or negative watch/outlook of White Mountains' or our creditworthiness ratings could limit our ability to raise new debt or make new debt more costly and/or have more restrictive conditions.
Our debt and related service obligations could adversely affect our business.
As of December 31, 2010, we had $419.9 million face value of indebtedness. During 2010, we decreased our indebtedness by $201.2 million through the purchase or repurchase of $187.2 million of outstanding Senior Notes, including $156.4 million through a tender offer in May 2010 and the repayment of $14.0 million of other indebtedness. See "Business—Investing, Financing and Other Corporate Operations". Our ability to meet our debt and related service obligations, as well as our ability to pay a dividend on our common shares, will depend on our future performance, which will be affected by financial, business, economic, regulatory and other factors, many of which are beyond our control. In addition, White Mountains is subject to restrictive financial covenants contained in its revolving credit facility that require White Mountains to pay the principal and interest on its debt and maintain specified financial ratios and to satisfy financial condition tests. A breach of these covenants
29
could result in an event of default under White Mountains' revolving credit facility which would allow lenders to declare all amounts owed under the revolving credit facility to be immediately due and payable. A failure to pay principal and interest on White Mountains' revolving credit facility in excess of $25 million could trigger cross acceleration provisions contained in the indenture of our Senior Notes. We cannot be certain that our earnings will be sufficient to allow us to pay the principal and interest on our debt and meet our other obligations, or to repay any accelerated indebtedness as a result of the trigger of the cross acceleration provisions in the indentures of the Senior Notes. If we do not have enough cash, we may be required to refinance all or part of our existing debt, sell assets, borrow more cash or sell equity. We cannot assure you that we will be able to accomplish any of these alternatives on terms acceptable to us, if at all. See the risk factor concerning our Senior Notes, "Management's Discussion and Analysis of Financial Condition and Results of Operations—Financing" and Note 16—"Related Party Disclosures" of the accompanying consolidated financial statements.
We could incur additional indebtedness and issue preferred stock in the future. To the extent new debt, preferred stock and other obligations are added to our and our subsidiaries' current debt levels, the risks described in the previous paragraph would increase.
We are a holding company with no direct operations, and our insurance subsidiaries' ability to pay dividends to us is restricted by law.
As a holding company with no direct operations, we rely on net investment income and dividends and other permitted payments from our subsidiaries to pay our expenses. Our subsidiaries may not be able to generate cash flow sufficient to pay a dividend or distribute funds to us. In addition, under the insurance laws of the jurisdictions in which our insurance subsidiaries are domiciled, an insurer is restricted with respect to the timing or the amount of dividends it may pay without the prior approval of regulatory authorities. Generally, our regulated operating subsidiaries have the ability to pay dividends during any 12-month period without the prior approval of regulatory authorities in an amount set by formula based on the greater of prior year statutory net income or 10% of prior year statutory surplus, subject to the availability of unassigned funds. Our top tier regulated operating subsidiaries have the ability to pay approximately $291 million of dividends during 2011, subject to the availability of unassigned funds. At December 31, 2010, our top tier regulated operating subsidiaries had $0.8 billion of unassigned funds available for dividend distribution. Management believes that our cash balances, cash flows from operations and cash flows from investments are adequate to meet expected cash requirements for the foreseeable future on both a holding company and operating subsidiary level. However, if our insurance subsidiaries cannot pay dividends in future periods, we may have difficulty servicing our debt, paying dividends on our common shares and meeting our holding company expenses. For additional information relating to insurance regulations governing our operations, see "Regulatory Matters."
The property and casualty insurance industry is highly competitive and cyclical, and we may not be able to compete effectively in the future.
The property and casualty insurance industry is highly competitive and has historically been cyclical, experiencing periods of severe price competition and less selective underwriting standards (soft markets) followed by periods of relatively high prices and more selective underwriting standards (hard markets). Our businesses each compete against a different subset of companies. In general terms, we compete to varying degrees in one or more of our businesses with most of the large multi-line insurance companies, such as ACE Limited, Chartis Insurance, Chubb Group of Insurance Companies, CNA Insurance, Liberty Mutual Insurance Group, Travelers Insurance Group Holdings Inc. and Zurich Financial Services Ltd. We also compete with most of the specialty companies, such as Allied World Assurance Company, HCC Insurance Holdings, Inc., Ironshore Inc., Markel Corporation, RLI Corp. and W.R. Berkley Corporation. Lastly, we compete in certain of our businesses with various local and
30
regional insurance companies. Many of our competitors have greater resources than we do and have established long-term and continuing business relationships throughout the insurance industry, which can be a significant competitive advantage for them.
We offer our products through a network of independent agents, regional and national brokers, wholesalers and MGAs. We selectively appoint our distribution partners based upon their knowledge of our target markets, and our specialized capabilities as well as their geographic profiles. We sometimes pay higher commissions and incur higher expenses to align with these distribution partners, however, we believe that they add value to our business with their specialized knowledge. These agents, brokers, MGAs and wholesalers are sometimes able to offer substantial discounts in pricing through their other markets as compared to our insurance products. If our distribution partners experience increased competition from other writers of insurance, we in turn could be adversely affected if they are unable to maintain our competitive position in their respective markets. If we are unable to maintain our competitive position throughout soft and hard market cycles, our results of operations and financial condition may be adversely affected.
The current pricing market is highly competitive and soft, however, we have maintained underwriting and pricing discipline. Any significant decrease in the rates we can charge for property and casualty insurance would adversely affect our results. We expect to continue to experience the effects of this cyclicality which, during down periods, could materially adversely affect our results of operations and financial condition.
We may suffer losses from unfavorable outcomes from litigation and other legal proceedings.
In the ordinary course of business, we are subject to litigation and other legal proceedings as part of the claims process, the outcomes of which are uncertain. We maintain reserves for these legal proceedings as part of our loss and LAE reserves. We also maintain separate reserves for legal proceedings that are not related to the claims process. In the event of an unfavorable outcome in one or more legal matters, our ultimate liability may be in excess of amounts we have currently reserved for and such additional amounts may be material to our results of operations and financial condition. As of December 31, 2010, we had no material pending legal proceedings.
As industry practices and legal, judicial, social and other conditions change, unexpected and unintended issues related to claims and coverage may emerge. These issues may adversely affect our results of operations and financial condition by either extending coverage beyond our underwriting intent or by increasing the number and size of claims. In some instances, these changes may not become apparent until some time after we have issued insurance contracts that are affected by the changes.
Our profitability may be adversely impacted by inflation, legislative actions and judicial decisions.
The effects of inflation could cause claim costs to rise in the future. In addition, legislative actions and judicial decisions continue to broaden liability and policy definitions and to increase the severity of claim payments, such as described above with respect to A&E claims. To the extent inflation and these legislative actions and judicial decisions cause claim costs to increase above reserves established for these claims, we will be required to increase our loss and LAE reserves with a corresponding reduction in our net income in the period in which the deficiency is identified.
Regulation may restrict our ability to operate.
The insurance industry is subject to extensive regulation under U.S. and state laws. Governmental agencies have broad administrative power to regulate many aspects of the insurance business, which include premium rates, marketing practices, advertising, policy forms and capital adequacy. These governmental agencies are concerned primarily with the protection of policyholders rather than
31
shareholders. Insurance laws and regulations impose restrictions on the amount and type of investments, prescribe solvency standards that must be met and maintained and require the maintenance of reserves. Premium rate regulation may make it difficult for us to increase premiums to adequately reflect the cost of providing insurance coverage to our policyholders. In our underwriting, we rely heavily upon information gathered from third parties such as credit report agencies and other data aggregators. The use of this information is also highly regulated and any changes to the current regulatory structure could materially affect how we underwrite and price premiums.
Changes in federal or state laws and regulations may restrict our ability to operate and/or have an adverse effect upon the profitability of our business within a given jurisdiction, and could have an effect on our business, results of operations and financial condition. For example, the Dodd-Frank Act, which was enacted in July 2010, created the FIO within the Treasury Department. The FIO is responsible for gathering information and monitoring the insurance industry to identify gaps in the regulation of insurers that could contribute to a systemic crisis in the insurance industry or U.S. financial system. The FIO also has the authority to recommend changes to state insurance laws and regulations. We cannot predict whether the FIO will recommend any such changes, whether any states will adopt any such changes, or what effect such changes may have on our insurance operations. As another example, it is possible that the NAIC could adopt part or all of Solvency II including minimum capital requirements that could be in excess of our current minimum capital requirements established by state regulations. If the NAIC adopted Solvency II including additional capital requirements, our business and results of operations could be materially impacted.
Mandated market mechanisms may require us to underwrite policies with a higher risk of loss, and assessments and other surcharges for guaranty funds and second-injury funds may reduce our profitability.
We are often required to participate directly or indirectly in mandatory shared market mechanisms as a condition of our licenses to do business in certain states. These markets, which are commonly referred to as "residual" or "involuntary" markets, generally consist of risks considered to be undesirable from a standard or routine underwriting perspective. Underwriting performance related to assigned risk plans, a form of mandated market mechanism, is typically adverse and, as a result, we are required to underwrite some policies with a higher risk of loss than we would normally accept. Our participation in assigned risk plans may result in greater liabilities than we anticipate and could materially adversely affect our results of operations and financial condition.
In addition, virtually all states require insurers licensed to do business in their state to bear a portion of the loss suffered by some insureds as the result of impaired or insolvent insurance companies. These guaranty funds are funded by assessments that are expected to increase in the future as a result of recent insolvencies. Many states also have laws that established second-injury funds to provide compensation to injured employees for aggravation of a prior condition or injury which are funded by either assessments based on paid losses or premium surcharge mechanisms. The effect of these assessments and surcharges or changes in them could reduce our profitability in any given period or limit our ability to grow our business.
We depend on our key personnel to manage our business effectively and they may be difficult to replace.
Our performance substantially depends on the efforts and abilities of our management team and other executive officers and key employees. Furthermore, much of our competitive advantage is based on the expertise, experience and know-how of our key management personnel. We do not have fixed term employment agreements with any of our key employees nor key man life insurance, and the loss of one or more of these key employees could adversely affect our business, results of operations and financial condition. Our success also depends on the ability to hire and retain additional key personnel. Difficulty in hiring or retaining key personnel could adversely affect our results of operation and financial condition.
32
We may not be successful in developing our specialty businesses which could cause us to underestimate reserves, incur additional expenses, and fail to fully realize our investments in these businesses, which could materially affect our business and results of operations.
We have recently entered into new specialty business lines, including energy and excess and surplus lines. We intend to continue to look for appropriate opportunities to diversify our business portfolio by adding new specialty lines of insurance coverage. We also intend to continue to grow our existing specialty business lines. Due to our limited history in new business lines, there could be limited financial information available to us to help us estimate sufficient loss reserves for these lines and to help evaluate whether we will be able to successfully develop these lines or the likely ultimate losses and expenses associated with these lines. Also, we may have less experience than some of our competitors in managing certain of these business lines. We may also incur expenses related to these business lines that may be difficult to manage in addition to our existing expense structure. Accordingly, we may fail to fully realize the benefits and profits from some or all of our new specialty lines businesses relative to the resources that we invest in them. Also, these business lines may fail to perform at the levels we anticipate. Although we have a conservative approach to adding new businesses to our portfolio, including stringent management oversight of, among other areas, underwriting, product and pricing development, and financial performance, there is no assurance that we will be able to realize profitability from some or all of these new specialty businesses, which could materially adversely affect our results of operations and financial condition.
We may need additional capital in the future, which may not be available to us or available to us on favorable terms. Raising additional capital could dilute your ownership in our company and may cause the market price of our common shares to fall.
We may need to raise additional funds through public or private debt or equity financings in order to:
- •
- fund liquidity needs;
- •
- replace capital lost in the event of a catastrophe or adverse reserve development or investment losses;
- •
- repay $419.9 million aggregate principal amount of our Senior Notes;
- •
- satisfy letter of credit or guarantee bond requirements that may be imposed by our clients or by regulators;
- •
- acquire new businesses or invest in existing businesses;
- •
- expand our business into new regions and countries; or
- •
- otherwise respond to competitive pressures.
Any additional capital raised through the sale of equity will dilute your ownership percentage in our company and may decrease the market price of our common shares. Furthermore, the securities may have rights, preferences and privileges that are senior or otherwise superior to those of our common shares. Any additional financing we may need may not be available on terms favorable to us, or at all.
We may be unable to adequately maintain our systems and safeguard the security of our data which may adversely impact our ability to operate our business and cause reputational harm and financial loss.
Our business and operations rely on secure and efficient processing, storage and transmission of customer and company data, including personally identifiable information such as a name together with a social security number, bank account number, driver's license number, passport number or birthday
33
(PII). Our ability to effectively operate our business depends upon our ability and the ability of certain third parties including vendors and business partners to access our computer systems to perform necessary business functions such as providing quotes and product pricing, billing and processing premiums, administering claims, and reporting our financial results. Our business and operations also depend upon our ability to safeguard PII and other confidential and proprietary information belonging to us, our employees, our policyholders and our business partners as well as Tower's policyholders as a result of the TSA entered into in connection with the Personal Lines Transaction. Our systems may be vulnerable to unauthorized access and hackers, computer viruses, and other scenarios in which our data may be vulnerable to a breach. Specifically, we could be exposed to data breach risk from lost or stolen laptops, other portable media or misdirected mailings containing PII.
Data incidents could result in reputational harm to us, which could affect our business and results of operations. Nearly every state has enacted data breach laws and regulations that require, among other things, notification to affected persons and state regulatory agencies of a data breach that involves PII. Some U.S. state and federal laws also require us to implement measures to safeguard PII. For example, new Massachusetts regulations require our employees to encrypt information stored on laptops and other portable devices and transmitted through electronic media, and take reasonable steps to verify that our third-party vendors utilize security procedures to protect PII.
We have taken a number of steps to mitigate our risk. We have formed a Data Privacy Committee and appointed a Chief Information Security Officer. We have implemented policies, procedures, training and education of employees, as well as technology solutions to safeguard our information. Although we have taken measures to safeguard our information and that of policyholders and other third parties, and we continually monitor the security of our systems and information, we could be exposed to data loss. As a result, our ability to conduct our business may be affected, and impact our results of operations, financial condition and reputation.
Risks Relating to Our Relationship with White Mountains
Control of us by White Mountains and the holding of White Mountains shares by some of our directors and officers may result in conflicts of interest.
White Mountains beneficially owns all of our Class B common shares, representing 96.9% of the voting power of our voting securities and 76.0% of our total equity as of December 31, 2010. As long as White Mountains owns our common shares representing more than 50% of the voting power of our outstanding voting securities, White Mountains will generally be able to determine the outcome of all corporate actions requiring shareholder approval, including the election of directors. Furthermore, we are relying on the "controlled company" exemption under the rules of the New York Stock Exchange, and are therefore not required to have a majority of independent directors on our Board. Of the ten directors that we have on our Board, six are current or former employees, directors or officers of White Mountains. White Mountains also has control over the adoption or amendment of provisions in our memorandum of association or bye-laws and the approval of amalgamations, mergers, and other significant corporate transactions. Furthermore, White Mountains will continue to be able to exercise this control as long as their economic equity ownership in us is at least 20%. These factors also may delay or prevent a change in the management or voting control of us.
Also, at some time in the future, White Mountains may sell all or a portion of its ownership interest in us or may make a tax-free distribution to its shareholders of all or a portion of that interest.
Questions relating to conflicts of interest may arise between us and White Mountains in a number of areas relating to our past and ongoing relationships. Certain of our directors and a number of our executive officers may own substantial amounts of White Mountains stock and may also be directors or officers of White Mountains from time to time. Their ownership of White Mountains stock and these other relationships could create, or appear to create, potential conflicts of interest when these
34
individuals are faced with decisions that could have different implications for us and White Mountains. These potential conflicts could arise, for example, over matters such as the desirability of an acquisition opportunity, employee retention or recruiting, or our dividend policy.
White Mountains may compete with us and the involvement of those individuals who are directors and officers of White Mountains and directors of ours in resolving matters relating to such competition will not constitute a breach of fiduciary duty to us.
Our bye-laws provide that White Mountains will have no obligation to refrain from:
- •
- engaging in the same or similar business activities or lines of business as we do; or
- •
- doing business with any of our clients or customers.
Because White Mountains may currently or in the future engage in the same activities in which we engage, we may be in direct competition with White Mountains. While White Mountains has indicated to us that its current expectation is to manage its activities such that opportunities to acquire specialty businesses will be pursued through OneBeacon, White Mountains is not legally obligated to do so and could in the future manage its activities in a different way. Due to the resources of White Mountains, including financial resources, name recognition and knowledge of our strengths, weaknesses and business practices, White Mountains could have a competitive advantage over us should it decide to engage in the type of business we conduct, which may have a material adverse effect on our operations and financial condition. The corporate opportunity policy included in our bye-laws addresses potential conflicts of interest between us, on the one hand, and White Mountains and its officers and directors who are also our directors, on the other hand. These provisions are designed to resolve conflicts between us and White Mountains. Under our bye-laws, it is not a breach of fiduciary duty on the part of any of our officers and directors by reason of their participation in any of the above described activities.
Transitional and other arrangements with White Mountains may not be on arm's length terms.
In connection with the initial public offering, we entered into certain contractual arrangements with White Mountains and its affiliates. These agreements were made in the context of a parent-subsidiary relationship. For example, some of our investments are managed pursuant to an investment management agreement on a discretionary basis by a registered investment advisor which is owned by White Mountains. We have a multi-year investment management contract with this advisor. While we are satisfied with the terms of such arrangement, we cannot confirm that such terms are as favorable to us as they might have been had we contracted with an independent advisor. On the other hand, after the expiration of this agreement, we may not be able to replace these investment services in a timely manner or on terms and conditions, including cost, that are comparable to those we receive from White Mountains, and we may have to pay higher prices for similar services from unaffiliated third parties. For more information on these and other arrangements with White Mountains, see Note 16—"Related Party Disclosures" of the accompanying consolidated financial statements.
Refinancing of our Senior Notes may occur on unfavorable terms.
In connection with the initial public offering, we entered into an agreement with White Mountains pursuant to which White Mountains guarantees the Senior Notes of our subsidiary, OBH, for a specified fee in the amount of 25 basis points per annum on the outstanding principal amount of the Senior Notes. We further agreed that if White Mountains' voting interest in our common shares ceases to represent more than 50% of all our voting securities, we will seek to redeem, exchange or otherwise modify the Senior Notes in order to fully and permanently eliminate White Mountains' obligations under its guarantee. White Mountains and its subsidiaries beneficially own all of our outstanding Class B common shares, representing 96.9% of the voting power of our voting securities. If we have
35
not successfully eliminated the guarantee within 180 days upon notice of the triggering of the voting interest condition, the guarantee fee will increase by 200 basis points. The guarantee fee will further increase by 100 basis points for each subsequent 90 day period thereafter, up to a maximum guarantee fee of 425 basis points, until White Mountains' obligations under its guarantee have been extinguished. This arrangement could require us to devote significant time and expense trying to refinance the Senior Notes and we may not be able to do so on commercially reasonable terms or at all.
White Mountains has a revolving credit facility which provides for borrowing up to a maximum of $475 million and which contains restrictive financial covenants. The indenture documents governing the Senior Notes provide that if White Mountains as guarantor of the Senior Notes has a payment default in excess of $25 million under a credit agreement, mortgage or similar debt agreement, there is a default under the Senior Notes (commonly referred to as a "cross default"). Therefore, if White Mountains were to breach one or more of its financial covenants in its revolving credit facility, an event of default would result, which would allow lenders to declare all amounts owed under the revolving credit facility to be immediately due and payable. A failure to pay the amounts owed under the revolving credit facility would result in a trigger of the cross default provisions in the indenture documents governing the Senior Notes resulting in a required repayment of the Senior Notes. While we believe that White Mountains is able to meet its obligations under its revolving credit facility, there is the potential that adverse market or other conditions which cannot be controlled could adversely impact White Mountains' ability to meet its obligations as well as our ability to refinance the Senior Notes in the event of a cross default. As of December 31, 2010, the credit facility was undrawn. See "Management's Discussion and Analysis of Financial Condition and Results of Operations—Financing" and Note 16—"Related Party Disclosures" of the accompanying consolidated financial statements.
Risks That Relate to Taxes
We may become subject to taxes in Bermuda after 2016.
We have received a standard assurance from the Bermuda Minister of Finance, under Bermuda's Exempted Undertakings Tax Protection Act 1966, that if any legislation is enacted in Bermuda that would impose tax computed on profits or income, or computed on any capital asset, gain or appreciation, or any tax in the nature of estate duty or inheritance tax, then the imposition of any such tax will not be applicable to us or to any of our operations or our shares, debentures or other obligations until March 28, 2016. Given the limited duration of the Minister of Finance's assurance, we cannot be certain that we will not be subject to any Bermuda tax after March 28, 2016. In the event that we become subject to any Bermuda tax after such date, it could have a material adverse effect on our results of operations and financial condition.
Changes in tax laws or tax treaties may cause more of the income of certain non-U.S. companies in our group to become subject to taxes in the United States.
The taxable income of our U.S. subsidiaries is subject to U.S. federal, state and local income tax and other taxes. The income of the non-U.S. companies in our group is generally not subject to tax in the United States other than withholding taxes on interest and dividends. Certain of our non-U.S. companies are eligible for the benefits of tax treaties between the United States and other countries. We believe our non-U.S. companies will continue to be eligible for treaty benefits. However, it is possible that factual changes or changes to U.S. tax laws or changes to tax treaties that presently apply to our non-U.S. companies could increase income, or the tax rate on income, subject to tax in the United States. Similarly, changes to the applicable tax laws, treaties or regulations of other countries could subject the income of members of our group to higher rates of tax outside the United States.
36
ITEM 1B. UNRESOLVED STAFF COMMENTS
As of the date of this report, we had no unresolved written comments from the Commission staff regarding our periodic or current reports under the Exchange Act.
Our headquarters are located at 14 Wesley Street, 5th Floor, Hamilton HM 11, Bermuda. Our U.S. corporate headquarters are located at 601 Carlson Parkway, Minnetonka, Minnesota 55305 and our registered office is located at Clarendon House, 2 Church Street, Hamilton HM 11, Bermuda. We also maintain branch offices in various cities throughout the United States. Our headquarters, U.S. corporate headquarters and our branch offices are leased. We also own a building in Canton, Massachusetts that houses certain corporate functions, as well as claims, field and business operations personnel. Management considers our office facilities suitable and adequate for our current level of operations.
The Company from time to time is involved in various routine legal proceedings. We believe that the outcome of these proceedings, even if determined adversely, would not have a material adverse effect on our business, results of operations and financial condition.
ITEM 4. SUBMISSION OF MATTERS TO A VOTE OF SECURITY HOLDERS
There were no matters submitted to a vote of our shareholders during the fourth quarter of 2010.
Executive Officers of the Registrant and its Subsidiaries as of February 28, 2011:
Name
|
Age | Position(s) | |||
|---|---|---|---|---|---|
T. Michael Miller |
52 | Director, President and Chief Executive Officer | |||
Paul H. McDonough |
46 | Senior Vice President and Chief Financial Officer | |||
Ann Marie Andrews |
38 | Chief Accounting Officer | |||
Dennis A. Crosby |
52 | Executive Vice President, OneBeacon Insurance Company | |||
Jane E. Freedman |
42 | Secretary and Associate General Counsel | |||
Bradford W. Rich |
63 | Senior Vice President and General Counsel | |||
Paul F. Romano |
51 | Executive Vice President, OneBeacon Insurance Company | |||
Set forth below is information concerning our directors and executive officers as of the date of this filing:
T. Michael Miller became a director and President and Chief Executive Officer of OneBeacon in August 2006 and was elected President and Chief Executive Officer of OneBeacon LLC in July 2005 and joined OneBeacon LLC as its Chief Operating Officer in April 2005. Prior to joining OneBeacon, Mr. Miller spent 10 years at St. Paul Travelers, most recently as Co-Chief Operating Officer. Prior to joining St. Paul Travelers, Mr. Miller spent 14 years with The Chubb Corporation.
Paul H. McDonough was elected Chief Financial Officer of OneBeacon in August 2006 and was elected Chief Financial Officer of OneBeacon LLC in December 2005. Mr. McDonough previously served as Executive Vice President and Chief Financial Officer for BJ's Wholesale Club in 2005, and served as Treasurer for St. Paul Travelers, where he worked from 1999-2004. Prior to joining St. Paul Travelers, Mr. McDonough served in finance roles with Sears and with Chevron.
Ann Marie Andrews became Chief Accounting Officer of OneBeacon in October 2006. Prior thereto, Ms. Andrews served in various financial roles of increasing responsibility at OneBeacon, most
37
recently as controller of OneBeacon LLC. Prior to joining OneBeacon in July 2002, she was with Arthur Andersen LLP.
Dennis A. Crosby became Executive Vice President of OBIC in November 2010 and Vice President of OBIC in July 2010. Mr. Crosby previously served as President and CEO of ACE Westchester and Chairman of ACE Commercial Risk Services. Prior to his 6 years at ACE, he spent 23 years with St. Paul Travelers in a variety of senior roles including commercial middle market, insurance operations and public sector services.
Jane E. Freedman became Secretary of OneBeacon in November 2007. She joined OneBeacon in November 2006 as Associate General Counsel. Prior to joining OneBeacon, she served as Senior Counsel at Raytheon Company for 5 years. Prior to joining Raytheon, she was in private practice at Hinckley, Allen & Snyder LLP.
Bradford W. Rich became Senior Vice President and General Counsel of OneBeacon in September 2007. Mr. Rich previously served as General Counsel of USAA and ACE Ltd. He began his legal career as an assistant staff judge advocate in the United States Air Force, after serving as a staff assistant to the President of the United States.
Paul F. Romano became Executive Vice President of OBIC in December 2010 and President of OBPI in March 2008. Mr. Romano previously was responsible for underwriting, business development and marketing with Darwin Professional Underwriters. His prior experience includes leading Chubb Specialty's health care underwriting division. Mr. Romano spent the early part of his career with Aetna in the group insurance and managed care business.
38
ITEM 5. MARKET FOR THE COMPANY'S COMMON EQUITY, RELATED SHAREHOLDER MATTERS AND ISSUER PURCHASES OF EQUITY SECURITIES
The common shares of OneBeacon are listed and traded on the New York Stock Exchange (Symbol: OB). Our Class A common shares began trading on November 9, 2006. Prior to such date, there was no established public trading market for our common shares. We also have Class B common shares that are not listed for trading, all of which are held by White Mountains. There is no public market for this class of securities. The closing price per share of the Class A common shares on the New York Stock Exchange on February 24, 2011 was $13.50. As of February 24, 2011, the 22,661,739 outstanding Class A common shares were held by 19 holders of record. During 2010, we paid a quarterly dividend of $0.21 per common share and a special dividend of $2.50 per common share in September 2010, or $315.6 million total. On February 23, 2011, the Board declared an ordinary dividend of $0.21 per common share, payable on March 31, 2011 to shareholders of record on March 17, 2011. See "Management's Discussion and Analysis of Financial Condition and Results of Operations—Liquidity and Capital Resources—Dividend Capacity".
The following table presents the range of share prices for our Class A common shares for the periods indicated, and the quarterly dividends declared per share:
| |
Three months ended, | |||||||||||||
|---|---|---|---|---|---|---|---|---|---|---|---|---|---|---|
| |
March 31, | June 30, | September 30, | December 31, | ||||||||||
2010 |
||||||||||||||
Common share price: |
||||||||||||||
High |
$ | 17.25 | $ | 17.44 | $ | 16.26 | $ | 16.03 | ||||||
Low |
$ | 12.81 | $ | 14.02 | $ | 13.05 | $ | 13.54 | ||||||
Dividends declared |
$ | 0.21 | $ | 0.21 | $ | 2.71 | $ | 0.21 | ||||||
2009 |
||||||||||||||
Common share price: |
||||||||||||||
High |
$ | 11.71 | $ | 12.95 | $ | 14.54 | $ | 14.50 | ||||||
Low |
$ | 8.10 | $ | 9.83 | $ | 11.03 | $ | 11.92 | ||||||
Dividends declared |
$ | 0.21 | $ | 0.21 | $ | 0.21 | $ | 0.21 | ||||||
We were acquired by White Mountains from Aviva in 2001. White Mountains is a holding company whose businesses provide property and casualty insurance, reinsurance and certain other products. During the fourth quarter of 2006, White Mountains sold 27.6 million or 27.6% of our Class A common shares in an initial public offering. Prior to the initial public offering, we were a wholly-owned subsidiary of White Mountains. As of December 31, 2010, White Mountains owned 76.0% of our common shares.
For information on securities authorized for issuance under our equity compensation plans, see "Item 12—Security Ownership of Certain Beneficial Owners and Management and Related Shareholder Matters."
Purchases of Equity Securities by the Issuer
On August 22, 2007, the Board authorized us to repurchase up to $200.0 million of our Class A common shares from time to time, subject to market conditions. Shares may be repurchased on the open market or through privately negotiated transactions. This program does not have a stated expiration date. During the year ended December 31, 2010, 0.7 million of our Class A common shares under this program were repurchased for $10.5 million and retired. During the year ended December 31, 2009, no shares were repurchased. During the year ended December 31, 2008, 3.4 million of our Class A common shares under this program were repurchased for $68.8 million and
39
retired. As of December 31, 2010, 5.6 million Class A common shares under this program were repurchased for $112.3 million and retired.
The following table includes information regarding repurchases by us of our Class A common shares during the periods indicated. All repurchased shares were retired.
| |
Total Number of Shares Repurchased |
Average Price Paid per Share |
Total Number of Shares Purchased as Part of Publicly Announced Plan |
Approximate Dollar Value of Shares That May Yet Be Purchased Under the Plan |
|||||||||
|---|---|---|---|---|---|---|---|---|---|---|---|---|---|
May 1 - 31, 2010 |
150,062 | $ | 14.48 | 150,062 | $ | 96.0 | |||||||
June 1 - 30, 2010 |
258,881 | $ | 14.39 | 258,881 | $ | 92.3 | |||||||
July 1 - 31, 2010 |
94,941 | $ | 14.30 | 94,941 | $ | 90.9 | |||||||
August 1 - 31, 2010 |
222,845 | $ | 14.44 | 222,845 | $ | 87.7 | |||||||
Total |
726,729 | $ | 14.42 | 726,729 | $ | 87.7 | |||||||
Stock Performance Graph
The following chart compares the total return on a cumulative basis of $100 invested in our Class A common shares on November 9, 2006, the date our shares commenced trading on the New York Stock Exchange, to the Standard & Poor's 500 Stock Index and the Standard & Poor's Property and Casualty Insurance Index. The following chart includes reinvestment of dividends.
Comparison of Cumulative Total Return
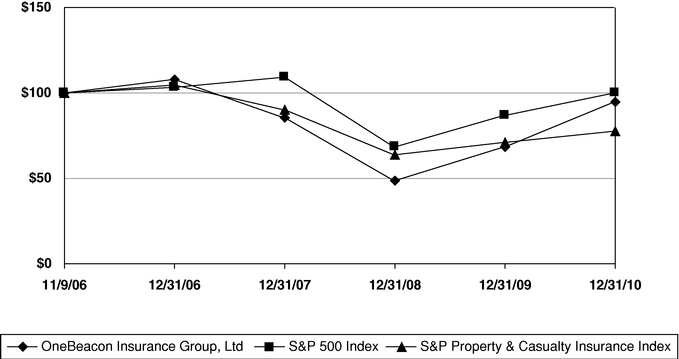
40
ITEM 6. SELECTED FINANCIAL DATA
The following tables set forth our selected consolidated financial information for the dates indicated. We have derived the selected consolidated financial information presented below as of and for the years ended December 31, 2010, 2009, 2008, 2007 and 2006 from our consolidated financial statements, which have been prepared in accordance with GAAP. As part of the resegmentation, agency results for business written on our paper and in which we have an ownership interest have been reclassified within the underwriting results. Prior periods have been reclassified to conform to the current presentation.
| |
Year ended December 31, | |||||||||||||||||
|---|---|---|---|---|---|---|---|---|---|---|---|---|---|---|---|---|---|---|
| |
2010 | 2009 | 2008 | 2007 | 2006 | |||||||||||||
| |
(in millions, except per share amounts) |
|||||||||||||||||
Summary Income Statement Data: |
||||||||||||||||||
Net written premiums |
$ | 1,236.3 | $ | 1,906.7 | $ | 1,963.1 | $ | 1,864.4 | $ | 2,007.0 | ||||||||
Revenues |
||||||||||||||||||
Earned premiums |
$ | 1,487.7 | $ | 1,959.5 | $ | 1,879.0 | $ | 1,873.6 | $ | 2,075.9 | ||||||||
Net investment income |
96.6 | 125.5 | 164.4 | 208.5 | 191.8 | |||||||||||||
Net realized and unrealized investment gains (losses)(1) |
74.6 | 248.6 | (763.6 | ) | 173.7 | 163.6 | ||||||||||||
Net other revenues |
9.6 | 23.1 | 3.5 | 9.4 | 32.7 | |||||||||||||
Total revenues |
1,668.5 | 2,356.7 | 1,283.3 | 2,265.2 | 2,464.0 | |||||||||||||
Expenses |
||||||||||||||||||
Loss and LAE |
930.2 | 1,121.9 | 1,126.2 | 1,089.8 | 1,283.6 | |||||||||||||
Policy acquisition expenses and other underwriting expenses |
567.2 | 719.7 | 651.8 | 640.5 | 733.9 | |||||||||||||
General and administrative expenses |
13.0 | 13.1 | 15.6 | 6.1 | 14.2 | |||||||||||||
Interest expense(2) |
29.6 | 39.7 | 78.3 | 110.6 | 104.1 | |||||||||||||
Accretion of fair value adjustment to loss and LAE reserves(3) |
— | 5.4 | 12.0 | 16.0 | 23.0 | |||||||||||||
Total expenses |
1,540.0 | 1,899.8 | 1,883.9 | 1,863.0 | 2,158.8 | |||||||||||||
Pre-tax income (loss) from continuing operations |
128.5 | 456.9 | (600.6 | ) | 402.2 | 305.2 | ||||||||||||
Income tax (expense) benefit |
(8.6 | ) | (112.8 | ) | 219.6 | (147.9 | ) | (68.9 | ) | |||||||||
Income (loss) from continuing operations before equity in earnings of unconsolidated affiliate |
119.9 | 344.1 | (381.0 | ) | 254.3 | 236.3 | ||||||||||||
Equity in earnings of unconsolidated affiliate |
— | — | — | — | 10.3 | |||||||||||||
Income (loss) from continuing operations |
119.9 | 344.1 | (381.0 | ) | 254.3 | 246.6 | ||||||||||||
Income from discontinued operations, net of tax |
— | — | — | — | 4.7 | |||||||||||||
Net income (loss) including noncontrolling interests |
119.9 | 344.1 | (381.0 | ) | 254.3 | 251.3 | ||||||||||||
Less: Net income from continuing operations attributable to noncontrolling interests |
(1.6 | ) | (2.1 | ) | (1.7 | ) | (3.7 | ) | (1.1 | ) | ||||||||
Net income from discontinued operations attributable to noncontrolling interests |
— | — | — | — | (3.5 | ) | ||||||||||||
Net income (loss) attributable to OneBeacon's common shareholders |
$ | 118.3 | $ | 342.0 | $ | (382.7 | ) | $ | 250.6 | $ | 246.7 | |||||||
Other comprehensive income (loss)(1) |
6.5 | 18.8 | (25.5 | ) | (5.8 | ) | 29.0 | |||||||||||
Comprehensive income (loss) attributable to OneBeacon's common shareholders |
$ | 124.8 | $ | 360.8 | $ | (408.2 | ) | $ | 244.8 | $ | 275.7 | |||||||
Basic and diluted earnings (loss) per share attributable to OneBeacon's common shareholders: |
||||||||||||||||||
Income (loss) from continuing operations |
$ | 1.25 | $ | 3.60 | $ | (3.99 | ) | $ | 2.51 | $ | 2.46 | |||||||
Discontinued operations |
— | — | — | — | 0.01 | |||||||||||||
Net income (loss) |
$ | 1.25 | $ | 3.60 | $ | (3.99 | ) | $ | 2.51 | $ | 2.47 | |||||||
Weighted average number of common shares outstanding |
94.8 | 95.1 | 95.9 | 99.8 | 100.0 | |||||||||||||
Amounts attributable to OneBeacon's common shareholders: |
||||||||||||||||||
Income (loss) from continuing operations, net of tax |
$ | 118.3 | $ | 342.0 | $ | (382.7 | ) | $ | 250.6 | $ | 245.5 | |||||||
Discontinued operations, net of tax |
— | — | — | — | 1.2 | |||||||||||||
Net income (loss) |
$ | 118.3 | $ | 342.0 | $ | (382.7 | ) | $ | 250.6 | $ | 246.7 | |||||||
41
| |
Year ended December 31, | ||||||||||||||||
|---|---|---|---|---|---|---|---|---|---|---|---|---|---|---|---|---|---|
| |
2010 | 2009 | 2008 | 2007 | 2006 | ||||||||||||
| |
(in millions) |
||||||||||||||||
Selected Ratios (Based on GAAP Income Statement Data): |
|||||||||||||||||
Consolidated(4) |
|||||||||||||||||
Loss and LAE ratio(5) |
62.5 | % | 57.3 | % | 59.9 | % | 58.2 | % | 61.8 | % | |||||||
Expense ratio(6) |
38.2 | 36.7 | 34.7 | 34.2 | 35.4 | ||||||||||||
Combined ratio(7) |
100.7 | % | 94.0 | % | 94.6 | % | 92.4 | % | 97.2 | % | |||||||
Specialty Insurance Operations |
|||||||||||||||||
Loss and LAE ratio(5) |
55.1 | % | 43.9 | % | 47.6 | % | 34.7 | % | 53.9 | % | |||||||
Expense ratio(6) |
38.4 | 38.7 | 36.4 | 32.8 | 34.1 | ||||||||||||
Combined ratio(8) |
93.5 | % | 82.6 | % | 84.0 | % | 67.5 | % | 88.0 | % | |||||||
Other Insurance Operations |
|||||||||||||||||
Loss and LAE ratio(5) |
76.8 | % | 69.0 | % | 67.8 | % | 69.8 | % | 63.3 | % | |||||||
Expense ratio(6) |
37.5 | 35.0 | 33.6 | 35.5 | 35.8 | ||||||||||||
Combined ratio(9) |
114.3 | % | 104.0 | % | 101.4 | % | 105.3 | % | 99.1 | % | |||||||
Summary Balance Sheet Data: |
|||||||||||||||||
Total cash and investments |
$ | 3,299.6 | $ | 4,087.6 | $ | 3,864.5 | $ | 5,218.9 | $ | 5,254.2 | |||||||
Total assets |
6,166.7 | 7,532.0 | 7,940.8 | 9,520.2 | 9,869.4 | ||||||||||||
Loss and LAE reserves(3) |
3,295.5 | 3,934.8 | 4,294.0 | 4,480.3 | 4,837.7 | ||||||||||||
Unearned premiums |
627.5 | 1,018.3 | 1,088.2 | 1,005.9 | 985.2 | ||||||||||||
Debt |
419.6 | 620.5 | 731.9 | 757.7 | 759.5 | ||||||||||||
Preferred stock subject to mandatory redemption(10) |
— | — | — | 278.4 | 262.3 | ||||||||||||
OneBeacon's common shareholders' equity |
1,229.0 | 1,429.0 | 1,155.1 | 1,906.5 | 1,777.2 | ||||||||||||
OneBeacon's common shareholders' equity and noncontrolling interests |
1,248.9 | 1,448.1 | 1,172.3 | 1,927.8 | 1,795.0 | ||||||||||||
- (1)
- Effective
January 1, 2008, we adopted the fair value option, subsequently codified within Financial Accounting Standards Board (FASB) Accounting
Standards Codification (ASC) 825, which allows companies the election to report financial assets and liabilities at fair value with unrealized gains and losses reported in revenues. We adopted ASC 825
for our available-for-sale securities and our investments in hedge funds, private equity funds and our investment in a community reinvestment vehicle. Subsequent to adoption,
we report changes in fair value in revenues. Accordingly, total revenues and pre-tax income (loss) for 2010, 2009 and 2008, which included $(7.3) million, $269.1 million and
$444.7 million, respectively, of change in net unrealized investment gains and losses, are not directly comparable to such measures for the 2006 and 2007 periods presented above.
- (2)
- In
accordance with ASC 480, we present all accretion and dividends on preferred stock subject to mandatory redemption as interest expense.
- (3)
- In
connection with purchase accounting for the OneBeacon Acquisition, we were required to adjust to fair value our loss and LAE reserves and the related
reinsurance recoverables by $646.9 million and $346.9 million, respectively, on our balance sheet as of June 1, 2001. This net charge to loss and LAE reserves of
$300.0 million is being accreted through an income statement charge ratably with and over the period the claims are settled.
- (4)
- Ratios
for 2006 include results of our affiliate quota shares. We entered into two quota share reinsurance agreements with subsidiaries of White Mountains
primarily for White Mountains' capital management purposes. These agreements were commuted in the fourth quarter of 2006 in connection with our initial public offering. Excluding the affiliate quota
shares, the loss and LAE, expense and combined ratios were 60.7%, 35.3% and 96.0%, respectively.
- (5)
- The
loss and LAE ratio is calculated by dividing loss and LAE, which includes long-term compensation expense, by earned premiums.
- (6)
- The
expense ratio is calculated by dividing policy acquisition expenses and other underwriting expenses, which includes long-term compensation
expense, by earned premiums.
- (7)
- The
combined ratio is the sum of the loss and LAE ratio and the expense ratio, including long-term incentive compensation expense.
Long-term incentive compensation expense increased our consolidated combined ratio by 1.7 points, 2.1 points, 0.7 points, 1.6 points and 2.1 points for the years ended
December 31, 2010, 2009, 2008, 2007 and 2006, respectively.
- (8)
- Includes
our long-term incentive compensation expense. Long-term incentive compensation expense increased our combined ratio for the
Specialty Insurance Operations segment by 1.7 points, 2.5 points, 1.0 points, 2.1 points and 4.2 points for the years ended December 31, 2010, 2009, 2008, 2007 and 2006, respectively.
- (9)
- Includes
our long-term incentive compensation expense. Long-term incentive compensation expense increased our combined ratio for the
Other Insurance Operations segment by 1.6 points, 1.8 points, 0.5 points, 1.3 points and 1.2 points for the years ended December 31, 2010, 2009, 2008, 2007 and 2006, respectively.
- (10)
- The Berkshire Preferred Stock was redeemed in May 2008 for $300.0 million, its redemption value. The Zenith Preferred Stock was redeemed in June 2007, for $20.0 million, its redemption value.
42
ITEM 7. MANAGEMENT'S DISCUSSION AND ANALYSIS OF FINANCIAL CONDITION AND RESULTS OF OPERATIONS
The following discussion contains "forward-looking statements." Statements that are not historical in nature are forward-looking statements. OneBeacon cannot promise that its expectations in such forward-looking statements will turn out to be correct. OneBeacon's actual results could be materially different from and worse than its expectations. See "Forward-Looking Statements" on page 103 for specific important factors that could cause actual results to differ materially from those contained in forward-looking statements.
Book Value Per Share
The following table presents our book value per share.
| |
As of December 31, | |||||||||
|---|---|---|---|---|---|---|---|---|---|---|
| |
2010 | 2009 | 2008 | |||||||
| |
(in millions except per share amounts) |
|||||||||
Numerator |
||||||||||
OneBeacon's common shareholders' equity |
$ | 1,229.0 | $ | 1,429.0 | $ | 1,155.1 | ||||
Denominator |
||||||||||
Common shares outstanding(1) |
94.4 | 95.1 | 95.1 | |||||||
Book value per share |
$ | 13.02 | $ | 15.03 | $ | 12.15 | ||||
- (1)
- Includes the impact of repurchases of Class A common shares made through the Company's share repurchase program.
Book Value Per Share—December 31, 2010 versus December 31, 2009
We ended the full year 2010 with a book value per share of $13.02, reflecting an increase of 9.4%, including dividends (a quarterly dividend of $0.21 per share and a special dividend of $2.50 per share paid in September 2010), on an internal rate of return basis, for the year ended December 31, 2010. The increase includes a 4.9% total return on invested assets for the year ended December 31, 2010. We reported comprehensive income attributable to OneBeacon's common shareholders of $124.8 million in the year ended December 31, 2010, compared to comprehensive income attributable to OneBeacon's common shareholders of $360.8 million in the year ended December 31, 2009. Our 2010 results include $6.6 million after tax ($10.2 million pre-tax) in additional consideration for aggregate premium renewals exceeding $200 million as part of the Commercial Lines Transaction, as well as a $24.6 million after tax ($8.5 million pre-tax) gain on sale related to the Personal Lines Transaction. These were partially offset by a $7.0 million after tax ($10.8 million pre-tax) loss related to the purchase of a portion of the Senior Notes. Change in other comprehensive income and loss items in the year ended December 31, 2010 includes the impact of a $5.8 million after tax increase in our pension plans primarily related to an increase in the over-funded status of our qualified pension plan driven by investment results.
Our GAAP combined ratio was 100.7% for the year ended December 31, 2010, compared to 94.0% for the year ended December 31, 2009. The increase in the combined ratio for the year ended December 31, 2010 was primarily due to higher current accident year catastrophe losses and a number of large losses experienced earlier in the year, particularly in the exited businesses, specifically the non-specialty commercial lines business which has been in run-off following the sale of the renewal rights to the business in December 2009, and the traditional personal lines business which was sold in July 2010. The year ended December 31, 2010 included $55.3 million of current accident year catastrophe losses primarily related to the March Northeast U.S. storms and an increased frequency of catastrophe losses relative to the prior year period, compared to $23.8 million of current accident year
43
catastrophe losses in the year ended December 31, 2009. Total net written premiums decreased 35.2% in the year ended December 31, 2010 to $1,236.3 million, compared to $1,906.7 million in the year ended December 31, 2009. The decrease in net written premiums was due primarily to the Commercial Lines Transaction and the Personal Lines Transaction, both of which are described below.
Book Value Per Share—December 31, 2009 versus December 31, 2008
We ended the full year 2009 with a book value per share of $15.03, reflecting an increase of 31.4%, including dividends (a quarterly dividend of $0.21 per share), on an internal rate of return basis, for the year ended December 31, 2009. The increase includes a 9.9% total return on invested assets for the year ended December 31, 2009. We reported comprehensive income attributable to OneBeacon's common shareholders of $360.8 million in the year ended December 31, 2009, compared to a comprehensive loss attributable to OneBeacon's common shareholders of $408.2 million in the year ended December 31, 2008. The increase in comprehensive income as compared to the prior year was due primarily to net realized and unrealized investment gains recognized in 2009, as described below. Our 2009 results include after tax proceeds of $15.1 million ($23.2 million pre-tax), from the Commercial Lines Transaction that was completed during the fourth quarter. The increase in book value also includes the impact of a settlement reached with the Internal Revenue Service in the fourth quarter of 2009 relating to the examination of our U.S. income tax returns for 2003 and 2004. As a result of the settlement, the year ended December 31, 2009 includes a tax benefit in the statement of operations of $15.5 million offset by a capital distribution of $8.4 million reflected in OneBeacon's common shareholders' equity. The net effect of the settlement resulted in an increase to book value of $7.1 million.
Our GAAP combined ratio was 94.0% for the year ended December 31, 2009, compared to 94.6% for the year ended December 31, 2008. The decrease in the combined ratio was primarily due to lower current accident year catastrophe losses, compared to the year ended December 31, 2008, which included $57.4 million of catastrophe losses primarily related to hurricanes Ike and Gustav and catastrophe losses from tornados in the southeastern United States experienced in the first quarter of 2008. The year ended December 31, 2009 also included the benefit of slightly more favorable loss reserve development offset by higher expenses, including increased incentive compensation costs and severance and other costs associated with the Commercial Lines Transaction. Total net written premiums decreased 2.9% in the year ended December 31, 2009 to $1,906.7 million, compared to $1,963.1 million in the year ended December 31, 2008. The decrease in net written premiums is due primarily to decreases in Other Insurance Operations in traditional personal lines, mainly due to the 30% homeowners quota share as described below, lower premiums at AutoOne, as well as decreases in our non-specialty middle market commercial businesses and small business division. These decreases were partially offset by an increase in Specialty Insurance Operations net written premiums driven primarily by our collector cars and boats business that we began writing in the second quarter of 2008 and EBI which we acquired in the third quarter of 2008.
Overview
We are an exempted Bermuda limited liability company. Our operating companies are U.S.-based property and casualty insurance writers, most of which operate in a multi-company pool. Pooling arrangements permit the participating companies to rely on the capacity of the entire pool's capital and surplus rather than just on its own capital and surplus. Under such arrangements, the members share substantially all insurance business that is written, and allocate the combined premiums, losses and expenses. We provide a wide range of specialty insurance products and services through independent agencies, regional and national brokers, wholesalers and managing general agencies. In the year ended December 31, 2010, our net written premiums totaled $1.2 billion and we had total assets of
44
approximately $6.2 billion and total OneBeacon's common shareholders' equity of $1.2 billion at December 31, 2010.
Our Segments
Our reportable segments are Specialty Insurance Operations, Other Insurance Operations and Investing, Financing and Corporate Operations.
Specialty Insurance Operations. Our Specialty Insurance Operations segment is comprised of twelve underwriting units that are aggregated into three major underwriting units: MGA Business, which includes those businesses that are distributed through MGAs, Specialty Industries, which includes those businesses that are targeted to specific industries, and Specialty Products, which includes those businesses that offer targeted products. See "Business—Specialty Insurance Operations".
Other Insurance Operations. Our Other Insurance Operations segment includes AutoOne, a division that offers products and services to assigned risk markets. Other Insurance Operations also includes the results of the non-specialty commercial lines business and the traditional personal lines business, other run-off business and certain purchase accounting adjustments relating to the OneBeacon Acquisition. See "Business—Other Insurance Operations".
Investing, Financing and Corporate Operations. Investing, Financing and Corporate Operations includes the investing and financing activities for OneBeacon on a consolidated basis, and certain other activities conducted through our top holding company, OneBeacon Insurance Group, Ltd., and our intermediate subsidiary holding companies which include OneBeacon U.S. Enterprises Holdings, Inc. and OneBeacon U.S. Holdings, Inc., both U.S.-domiciled companies, as well as various intermediate holding companies domiciled in the United States, Gibraltar, Luxembourg and Bermuda.
Significant Transactions
Historically, we have offered a range of specialty, commercial and personal products and services, however, in the wake of recent transactions we are now focused exclusively on specialty business. In addition, the transactions freed up significant capital, increased our financial flexibility and substantially reduced our catastrophe exposure.
Commercial lines. On December 3, 2009, we sold the renewal rights to approximately $490 million in premiums from our non-specialty commercial lines business to The Hanover. The transaction includes small commercial accounts and the non-specialty portion of the middle-market business, beginning with January 1, 2010 effective dates. As consideration, during the year ended December 31, 2009, we received $23.2 million. During the year ended December 31, 2010, we also recorded $10.2 million in additional consideration for 10% of premiums renewed in excess of $200 million for the first renewal period. We continue to manage claims from business written prior to the Commercial Lines Transaction. Through June 30, 2010, we also managed claims from business fronted by OneBeacon and reinsured to The Hanover. We continue to provide claims system access and first notice of loss service to The Hanover. The Hanover reimburses us for our expenses incurred to provide the claims administration services.
Personal lines. On July 1, 2010, we completed the sale of our traditional personal lines business to Tower. The Personal Lines Transaction included two insurance companies through which the majority of the traditional personal lines business was written on a direct basis, two attorneys-in-fact managing the reciprocals that wrote the traditional personal lines business in New York and New Jersey, the surplus notes issued by the New York and New Jersey reciprocals and the remaining renewal rights to certain other traditional personal lines insurance policies. In addition, the Personal Lines Transaction included the execution of reinsurance agreements with certain subsidiaries of the Company pursuant to which we cede, on a 100% quota share basis, traditional personal lines business not directly written by
45
companies included in the sale and assume, on a 100% quota share basis, non-traditional personal lines business written directly by York. Net written premiums for the traditional personal lines business totaled approximately $420 million for the year ended December 31, 2009. OneBeacon and Tower also entered into a TSA, pursuant to which we provide certain services to Tower during the three-year term of the TSA. Tower reimburses us for all of our expenses incurred to provide these services. Reimbursement for these services is netted against the expense incurred.
As consideration, based upon the carrying value of the traditional personal lines business as of July 1, 2010, we received $166.6 million. The consideration represented the statutory surplus in the reciprocals (as consideration for surplus notes issued by the reciprocals), the combined GAAP equity in the insurance companies and attorneys-in-fact being sold, plus $32.5 million. During the year ended December 31, 2010, we recorded a total after tax net gain on the sale of $24.6 million that is comprised of $8.5 million included in net other revenues and $16.1 million included in the tax provision. The purchase price is subject to post-closing adjustments.
Recent Developments. To better align our operating and reporting structure with our business profile as a result of the transactions, we revised our segment structure into Specialty Insurance Operations, Other Insurance Operations and Investing, Financing and Corporate Operations, as described above. As part of the resegmentation, agency results for business written on our paper and in which we have an ownership interest have been reclassified within underwriting results. Previously, we reported and managed our business through an Insurance Operations segment and an Other Operations segment. Within the Insurance Operations segment, we reported and managed our specialty lines businesses within a specialty lines underwriting unit and our traditional personal lines businesses and AutoOne within a personal lines underwriting unit, nearly all of which was subject to the Personal Lines Transaction. The Insurance Operations segment also included run-off business, which consisted primarily of non-specialty commercial lines business and other run-off business. Certain other activities conducted through the Company and our intermediate subsidiaries were included in our Other Operations segment. Investing and Financing activities were included within the Insurance Operations segment if they were owned or owed by insurance company legal entities or within the Other Operations segment if they were owned or owed by holding company legal entities. Prior periods have been reclassified to conform to the current presentation.
Other Acquisitions and Dispositions. During the fourth quarter of 2008, we sold one of our inactive licensed subsidiaries, Farmers and Merchants Insurance Company (FMIC), to Pride Holdings LLC for $7.8 million in cash and recorded a pre-tax gain of $1.1 million through net other revenues.
During the third quarter of 2008, we acquired EBI, an insurance agency specializing in the entertainment, sports and leisure industries, for $8.0 million in cash. In connection with the purchase of EBI, which was accounted for as an acquisition under the purchase method of accounting in accordance with GAAP at the time of the acquisition, we recorded the identifiable assets and liabilities of EBI at their fair value at acquisition date. Significant assets and liabilities acquired include premiums and commissions receivable of $16.6 million and premiums and commissions payable of $16.1 million. After allocating the purchase price to identifiable tangible assets and liabilities, we also recorded an adjustment to allocate the remaining acquisition cost to an intangible asset of $9.5 million which represents the value of business in force at the acquisition date. The amortization associated with the intangible asset will be amortized over a 10-year period in proportion to the timing of the discounted cash flows used to value the business. During the year ended December 31, 2010, $0.7 million in amortization was recognized. During the year ended December 31, 2009, no amortization was recognized.
46
During the first quarter of 2008, we sold one of our inactive licensed subsidiaries, Midwestern Insurance Company (MWIC), to National Guaranty Insurance Company for $4.2 million in cash and recorded a pre-tax gain of $1.0 million through net other revenues.
Revenues
We account for insurance policies that we write in accordance with ASC 944. Premiums written are recognized as revenues and are earned ratably over the term of the related policy. Unearned premiums represent the portion of premiums written that are applicable to future insurance coverage provided by policies. AutoOne, which acts as a LAD servicing carrier, enters into contractual arrangements with insurance companies to assume private passenger and commercial automobile assigned risk exposures. AutoOne receives LAD and CLAD servicing fees from these other companies for assuming these risks. AutoOne's LAD and CLAD servicing and take-out fees are recorded as written premium when billed and are earned ratably over the term of the related policy to which the fee relates.
Deferred Acquisition Costs
Deferred acquisition costs represent commissions, premium taxes, brokerage expenses and other costs that are directly attributable to and vary with the production of business. These costs are deferred and amortized over the applicable premium recognition period. Deferred acquisition costs are limited to the amount expected to be recovered from future earned premiums and anticipated investment income. This limitation is referred to as a premium deficiency. A premium deficiency is recognized if the sum of expected loss and LAE, unamortized acquisition costs, and maintenance costs exceeds related unearned premiums and anticipated investment income. A premium deficiency is recognized by charging any unamortized acquisition costs to expense to the extent required in order to eliminate the deficiency.
Loss and Loss Adjustment Expenses
Loss and LAE are charged against income as incurred. Unpaid loss and LAE reserves are based on estimates (generally determined by claims adjusters, legal counsel and actuarial staff) of the ultimate costs of settling claims, including the effects of inflation and other societal and economic factors. Unpaid loss and LAE reserves represent management's best estimate of ultimate loss and LAE, net of estimated salvage and subrogation recoveries, if applicable. Such estimates are reviewed and updated on a quarterly basis and any adjustments resulting therefrom are reflected in current operations. The process of estimating loss and LAE involves a considerable degree of judgment by management and the ultimate amount of expense to be incurred could be considerably greater than or less than the amounts currently reflected in the consolidated financial statements.
Reinsurance
Our insurance subsidiaries enter into ceded reinsurance contracts from time to time to protect their businesses from losses due to concentration of risk and to limit losses arising from catastrophic events. The majority of such reinsurance contracts are executed through excess-of-loss treaties and catastrophe contracts under which a third-party reinsurer indemnifies our insurance subsidiaries for a specified part or all of certain types of losses over stipulated amounts arising from any one occurrence or event. We also have entered into quota share treaties with reinsurers under which all risks meeting prescribed criteria are ceded to third-party reinsurers on a pro rata basis. The amount of each risk ceded by us is subject to maximum limits that vary by line of business and type of coverage. Amounts related to reinsurance contracts are recorded in our consolidated financial statements in accordance with ASC 944, as applicable.
47
Amounts recoverable from reinsurers are estimated in a manner consistent with the claim liability associated with the reinsured policies. Our ability to collect our reinsurance recoverables is subject to the solvency of the reinsurers with whom we have entered into reinsurance contracts. We are selective in regard to our reinsurers, principally placing reinsurance with those reinsurers with strong financial condition, industry ratings and underwriting ability. Management monitors the financial condition and ratings of our reinsurers on an ongoing basis.
Reinsurance premiums, commissions, expense reimbursements and reserves related to reinsured business are accounted for on a basis consistent with those used in accounting for the original policies issued and the terms of the reinsurance contracts. Premiums ceded to other companies are reported as a reduction of premiums written. Expense allowances received in connection with reinsurance ceded have been accounted for as a reduction of the related policy acquisition costs.
Share-Based Compensation
Compensation Philosophy
Our executive compensation policies are designed with one goal in mind, namely, the maximization of shareholder value over long periods of time. We believe that this goal is best pursued by utilizing a pay-for-performance program that serves to attract and retain superior executive talent and provide management with performance-based incentives to maximize shareholder value. Through this compensation program, we seek to maximize shareholder value by aligning closely the financial interests of management with those of our shareholders. The cost of all incentive compensation is fully accrued and expensed.
Compensation of our senior management team, including our named executive officers, consists primarily of three components: base salary, annual bonus and long-term incentive awards. Base salaries have been capped at $500,000. Annual bonus targets for all senior executives are 50%, with the exception of the Chief Executive Officer at 75%, of base salary. Long-term incentives for senior executives have in the past been comprised of performance shares and/or performance units. Under these instruments, payouts are explicitly tied to White Mountains' or OneBeacon's performance over a three-year period and are highly variable (the actual number of shares/units paid out at the end of the cycle will range from 0% to 200% of target depending on performance against established goals). See Note 9—"Employee Share-Based Incentive Compensation Plans" of the accompanying consolidated financial statements. Additionally, in recognition that the 2007-2009 and 2008-2010 performance share cycles, as described below, were projected to payout at or close to zero, creating a significant retention risk over the next years the OneBeacon Compensation Committee of the Board (the Compensation Committee) in February 2009 approved cash retention awards for the executive officers and certain members of senior management. The Compensation Committee also approved a pool of money for senior management to make retention awards to certain other key personnel.
Share-Based Compensation Recognition
Our share-based compensation plans consist of performance shares which are typically settled in cash, stock options which were granted in connection with our initial public offering and restricted stock units. We account for these share-based compensation plans in accordance with ASC 718. Compensation cost is measured and recognized based on the current market price of the underlying common shares and on the number of shares that are expected to vest.
48
Share-Based Compensation
2005-2007 through 2006-2008 performance cycles
For these cycles, OneBeacon revised the design of its long-term incentive plans from prior plan designs principally to use OneBeacon performance units instead of White Mountains performance shares, with performance targets primarily tied to OneBeacon's adjusted combined ratio. Each unit was initially valued at $100 and compounded in value over the performance period by the underwriting return on capital achieved by OneBeacon. In the case of certain senior officers, a portion of their long-term incentive compensation in these periods had been denominated in White Mountains performance shares. As a result of the shift from White Mountains performance shares to OneBeacon performance units, OneBeacon's incentive compensation expense associated with these performance cycles is no longer significantly impacted by changes in the market price of White Mountains common shares. Prior to February 2007, the value of OneBeacon's performance shares was based upon the market price of an underlying White Mountains common share (WTM Performance Shares). In February 2007, the Compensation Committee canceled all of OneBeacon's WTM Performance Shares outstanding (for the 2005-2007 and 2006-2008 performance cycles) and replaced the awards with two performance share grants, a one-year 2007 performance cycle and a two-year 2007-2008 performance cycle, whose value was based upon the market price of an underlying OneBeacon common share. In the 2007 performance cycle, a total of 117,363 performance shares were earned based upon a performance factor of 63%. In the 2007-2008 performance cycle, a total of 137,400 performance shares were earned based upon a performance factor of 1.4%.
2007-2009 performance cycle
In February 2007, the Compensation Committee approved the principal performance share goal of the OneBeacon Long-Term Incentive Plan to be growth in its intrinsic business value per share (GIBVPS). GIBVPS was defined by the Compensation Committee with respect to each award cycle. For the 2007-2009 performance cycle, the Compensation Committee defined GIBVPS to be a weighted measure comprised of growth in adjusted book value per share, underwriting return on equity and growth in our price per common share. In the 2007-2009 performance cycle, a total of 682,344 performance shares were earned based upon a performance factor of 14.2%.
2008-2010 performance cycle
In February 2008, the Compensation Committee defined GIBVPS for the 2008-2010 performance cycle to be a weighted measure comprised of growth in adjusted book value per share and underwriting return on equity. As of December 31, 2010, 929,849 performance shares were outstanding with respect to the 2008-2010 performance cycle.
2009-2011 and 2010-2012 performance cycles
In February 2009 and 2010, the Compensation Committee granted performance shares with a goal of growth in book value per share for the 2009-2011 performance cycle and the 2010-2012 performance cycle, respectively. As of December 31, 2010, 277,297 performance shares and 270,691 performance shares, respectively, were outstanding with respect to the 2009-2011 and 2010-2012 performance cycles.
As a result of the Commercial Lines Transaction and the Personal Lines Transaction, payments were made to certain former employees of OneBeacon prior to the end of the performance cycle on a pro rata basis. Performance shares earned and paid for the 2008-2010 and 2009-2011 performance cycles were based upon a performance factor of 100%.
49
Restricted Stock Units
In connection with OneBeacon's initial public offering, options were issued to certain key employees as a one-time incentive. The options did not include a mechanism to reflect the contribution to total return from the regular quarterly dividend. As a result, in February 2008, the Compensation Committee approved a grant of restricted stock units as a supplement to the initial public offering stock grant. The performance goal for the restricted stock units is growth in adjusted book value per share. As of December 31, 2010, there were 70,870 restricted stock units outstanding to actively employed option holders.
Purchase Accounting
In connection with purchase accounting for the OneBeacon Acquisition, we were required to adjust to fair value our loss and LAE reserves and the related reinsurance recoverables by $646.9 million and $346.9 million, respectively, on our balance sheet as of June 1, 2001. This net change to loss and LAE reserves of $300.0 million is being accreted through an income statement charge ratably with and over the period the claims are settled. Accordingly, we recognized $5.4 million and $12.0 million of such charges, recorded as loss and LAE, in the years ended December 31, 2009 and 2008, respectively. As of December 31, 2010 and 2009, the outstanding pre-tax unaccreted adjustment was $0.
Mandatorily Redeemable Preferred Stock
We had mandatorily redeemable preferred stock of a subsidiary which was redeemed in the year ended December 31, 2008. This instrument was classified as a liability and was carried at its historical carrying value. All dividends and accretion on our mandatorily redeemable preferred stock were recorded as interest expense. See Note 10—"Mandatorily Redeemable Preferred Stock of a Subsidiary" of the accompanying consolidated financial statements.
Income taxes
The income tax expense (benefit) related to pre-tax income (loss) for the years ended December 31, 2010, 2009 and 2008 represented effective tax rates of 6.7%, 24.7% and (36.6)%, respectively. Our effective tax rate for the year ended December 31, 2010 was lower than the U.S. statutory rate of 35% due to income generated in jurisdictions other than the United States and recognition of a deferred tax asset for a higher tax basis and deconsolidation of the companies sold as part of the Personal Lines Transaction, partially offset by an increase in the valuation allowance for insurance reciprocals. Our effective tax rate for the year ended December 31, 2009 was lower than the U.S. statutory rate of 35% primarily due to income generated in jurisdictions other than the United States and the settlement of federal income tax audits for 2003 and 2004. Our effective tax rate for the year ended December 31, 2008 was higher than the U.S. statutory rate of 35% due to a pre-tax loss from operations in the United States and income generated in jurisdictions other than the United States, partially offset by non-deductible dividends and accretion on the Berkshire Preferred Stock.
50
Results of Operations
Review of Consolidated Results
A summary of our consolidated financial results for the years ended December 31, 2010, 2009 and 2008 is as follows:
| |
Year ended December 31, | |||||||||||
|---|---|---|---|---|---|---|---|---|---|---|---|---|
| |
2010 | 2009 | 2008 | |||||||||
| |
($ in millions) |
|||||||||||
Net written premiums |
$ | 1,236.3 | $ | 1,906.7 | $ | 1,963.1 | ||||||
Revenues |
||||||||||||
Earned premiums |
$ | 1,487.7 | $ | 1,959.5 | $ | 1,879.0 | ||||||
Net investment income |
96.6 | 125.5 | 164.4 | |||||||||
Net realized and unrealized investment gains (losses) |
74.6 | 248.6 | (763.6 | ) | ||||||||
Net other revenues |
9.6 | 23.1 | 3.5 | |||||||||
Total revenues |
1,668.5 | 2,356.7 | 1,283.3 | |||||||||
Expenses |
||||||||||||
Loss and LAE |
930.2 | 1,121.9 | 1,126.2 | |||||||||
Policy acquisition expenses |
320.7 | 389.7 | 361.0 | |||||||||
Other underwriting expenses |
246.5 | 330.0 | 290.8 | |||||||||
General and administrative expenses |
13.0 | 13.1 | 15.6 | |||||||||
Interest expense on debt |
29.6 | 39.7 | 44.9 | |||||||||
Accretion of fair value adjustment to loss and LAE reserves |
— | 5.4 | 12.0 | |||||||||
Interest expense—dividends on preferred stock subject to mandatory redemption |
— | — | 11.8 | |||||||||
Interest expense—accretion on preferred stock subject to mandatory redemption |
— | — | 21.6 | |||||||||
Total expenses |
1,540.0 | 1,899.8 | 1,883.9 | |||||||||
Pre-tax income (loss) |
128.5 | 456.9 | (600.6 | ) | ||||||||
Income tax (expense) benefit |
(8.6 | ) | (112.8 | ) | 219.6 | |||||||
Net income (loss) including noncontrolling interests |
119.9 | 344.1 | (381.0 | ) | ||||||||
Less: Net income attributable to noncontrolling interests |
(1.6 | ) | (2.1 | ) | (1.7 | ) | ||||||
Net income (loss) attributable to OneBeacon's common shareholders |
118.3 | 342.0 | (382.7 | ) | ||||||||
Other comprehensive income (loss) |
6.5 | 18.8 | (25.5 | ) | ||||||||
Comprehensive income (loss) attributable to OneBeacon's common shareholders |
$ | 124.8 | $ | 360.8 | $ | (408.2 | ) | |||||
51
The following table provides ratios of our consolidated underwriting results for the years ended December 31, 2010, 2009 and 2008:
| |
Year ended December 31, | |||||||||||
|---|---|---|---|---|---|---|---|---|---|---|---|---|
| |
2010 | 2009 | 2008 | |||||||||
Ratios:(1)(2)(3)(4) |
||||||||||||
Loss and LAE |
62.5 | % | 57.3 | % | 59.9 | % | ||||||
Expense |
38.2 | 36.7 | 34.7 | |||||||||
Total GAAP combined |
100.7 | % | 94.0 | % | 94.6 | % | ||||||
- (1)
- As
part of the resegmentation, agency results for business written on OneBeacon paper and in which OneBeacon has an ownership interest have been
reclassified within the underwriting results. Financial information for the prior periods has been reclassified to conform to this presentation.
- (2)
- Includes
our long-term incentive compensation expense. For the years ended December 31, 2010, 2009 and 2008, long-term
incentive compensation expense increased our total GAAP combined ratio by 1.7 points, 2.1 points and 0.7 points, respectively.
- (3)
- Includes
loss and LAE relating to catastrophes. For the years ended December 31, 2010, 2009 and 2008, total calendar year incurred loss and LAE
relating to catastrophes increased our loss and LAE and total combined ratios by 3.0 points, 0.7 points and 2.8 points, respectively, including development on prior accident year catastrophes which
decreased our loss and LAE and total combined ratios by 0.7 points, 0.5 points and 0.3 points, respectively.
- (4)
- Prior accident year development, including development on catastrophes, for the years ended December 31, 2010, 2009 and 2008 decreased our loss and LAE and total combined ratios by 3.4 points, 4.3 points and 3.3 points, respectively.
Consolidated Results—Year ended December 31, 2010 versus year ended December 31, 2009
Our comprehensive income attributable to OneBeacon's common shareholders was $124.8 million in the year ended December 31, 2010, compared to $360.8 million in the year ended December 31, 2009. Change in other comprehensive income and loss items in the year ended December 31, 2010 included the impact of a $5.8 million after tax increase in our pension plans primarily related to an increase in the over-funded status of our qualified pension plan driven by investment results, as compared to a $12.1 million after tax increase in our pension plans in the prior year also driven by investment results. Change in other comprehensive income and loss items in the year ended December 31, 2009 also included a $7.4 million pre-tax ($4.8 million after tax) increase resulting from the settlement of our interest rate swap relating to the mortgage note. The impact was offset by a $7.4 million realized loss related to the settlement of the interest rate swap reflected in net other revenues. Net income attributable to OneBeacon's common shareholders was $118.3 million in the year ended December 31, 2010, compared to $342.0 million in the year ended December 31, 2009.
Our total revenues decreased by 29.2% to $1,668.5 million in the year ended December 31, 2010, compared to $2,356.7 million in the year ended December 31, 2009. The decrease was mainly due to a 24.1% decrease in earned premiums primarily due to the sale of our personal lines and our non-specialty commercial lines. Net realized and unrealized investment gains decreased by 70.0% to $74.6 million, compared to $248.6 million in the year ended December 31, 2009. Net investment income decreased by 23.0% to $96.6 million in the year ended December 31, 2010, primarily due to lower fixed maturity investment yields, a reduction in invested assets as a result of the Personal Lines Transaction, repurchases of our Senior Notes, payment of the special dividend, and an increased
52
allocation to lower yielding short-term investments during the first six months of 2010 in preparation for the closing of the Personal Lines Transaction. These were partially offset by a $1.7 million inflation adjustment related to our inflation indexed treasury securities as compared to a $(1.1) million inflation adjustment related to these securities for the year ended December 31, 2009. Net other revenues decreased by 58.4% to $9.6 million in the year ended December 31, 2010, compared to $23.1 million in the year ended December 31, 2009. The year ended December 31, 2010 included the $8.5 million net gain on the Personal Lines Transaction and $10.2 million of additional consideration related to the Commercial Lines Transaction, both described above, partially offset by a $10.8 million loss related to the purchase of a portion of our Senior Notes. The year ended December 31, 2009 included pre-tax proceeds of $23.2 million from the Commercial Lines Transaction and a $5.4 million gain related to the purchase of a portion of our Senior Notes, partially offset by a $7.4 million realized loss related to the settlement of the interest rate swap.
Our total expenses decreased by 18.9% in the year ended December 31, 2010 to $1,540.0 million, compared to $1,899.8 million in the year ended December 31, 2009. Loss and LAE decreased by 17.1% to $930.2 million in the year ended December 31, 2010, reflective of the shrink in our book of business resulting from the Commercial Lines Transaction and the Personal Lines Transaction, partially offset by higher current accident year catastrophe losses and a number of large losses experienced earlier in the year, particularly in businesses we have exited. Current accident year catastrophe losses were $55.3 million in the year ended December 31, 2010, compared to $23.8 million in the year ended December 31, 2009. Other underwriting expenses decreased by 25.3% to $246.5 million and policy acquisition expenses decreased by 17.7% to $320.7 million in the year ended December 31, 2010, reflecting the change in our book of business resulting from the Commercial Lines Transaction and the Personal Lines Transaction. Interest expense decreased by 25.4% to $29.6 million in the year ended December 31, 2010, reflective of actions taken to reduce outstanding debt. General and administrative expenses were flat as compared to the prior year.
Our income tax expense related to pre-tax income for the years ended December 31, 2010 and 2009 represented effective tax rates of 6.7% and 24.7%, respectively. The effective tax rate for the year ended December 31, 2010 was lower than the U.S. statutory rate of 35% due to income generated in jurisdictions other than the United States and recognition of a deferred tax asset for a higher tax basis and deconsolidation of the companies sold as part of the Personal Lines Transaction, partially offset by an increase in the valuation allowance for insurance reciprocals. The effective tax rate for the year ended December 31, 2009 was lower than the U.S. statutory rate of 35% primarily due to income generated in jurisdictions other than the United States and the settlement of federal income tax audits for 2003 and 2004.
Our GAAP combined ratio for the year ended December 31, 2010 increased to 100.7% from 94.0% for the year ended December 31, 2009. The loss and LAE ratio increased by 5.2 points to 62.5% while the expense ratio increased by 1.5 points to 38.2%. The increase in the loss and LAE ratio was primarily due to an increase in current accident year catastrophe and non-catastrophe losses. The year ended December 31, 2010 included $55.3 million or 3.7 points of current accident year catastrophe losses, as compared to $23.8 million or 1.2 points of current accident year catastrophe losses in the year ended December 31, 2009. We also experienced a number of large losses in our property and inland marine business within Specialty Insurance Operations and in our non-specialty commercial lines business within Other Insurance Operations. The year ended December 31, 2010 included $51.1 million or 3.4 points of favorable loss reserve development, as compared to $83.4 million or 4.3 points of favorable loss reserve development in the year ended December 31, 2009. The favorable loss reserve development was primarily related to lower than expected severity on non-catastrophe losses related to professional liability lines, multiple peril liability lines and other general liability lines. The favorable development also included a $7.5 million release of commercial catastrophe reserves associated with storms occurring in 2004 and 2005. The expense ratio increased primarily due to higher acquisition
53
costs in our specialty businesses as compared to the exited businesses and other underwriting expenses that have not decreased proportionately with the reduction in earned premium associated with the exited businesses.
Consolidated Results—Year ended December 31, 2009 versus year ended December 31, 2008
Our comprehensive income attributable to OneBeacon's common shareholders was $360.8 million in the year ended December 31, 2009, compared to a comprehensive loss attributable to OneBeacon's common shareholders of $408.2 million in the year ended December 31, 2008. Change in other comprehensive income and loss items in the year ended December 31, 2009 included the impact of a $12.1 million after tax increase in our pension plans primarily related to an increase in the over-funded status of our qualified pension plan driven by investment results. Change in other comprehensive income and loss items in the year ended December 31, 2009 also included a $7.4 million pre-tax ($4.8 million after tax) increase resulting from the settlement of our interest rate swap relating to the mortgage note. Change in other comprehensive income and loss items in the year ended December 31, 2008 included the impact of a $19.5 million after tax decrease in our pension plans primarily related to a decrease in the over-funded status of our qualified pension plan driven by investment results and a $5.7 million after tax decrease in our interest rate swap related to the mortgage note. Net income attributable to OneBeacon's common shareholders was $342.0 million in the year ended December 31, 2009, compared to a net loss attributable to OneBeacon's common shareholders of $382.7 million in the year ended December 31, 2008.
Our total revenues increased 83.6% to $2,356.7 million in the year ended December 31, 2009, compared to $1,283.3 million in the year ended December 31, 2008. The increase was mainly due to a $1,012.2 million increase in net realized and unrealized investment gains to $248.6 million. Net realized and unrealized investment losses for the year ended December 31, 2008 reflected the impact of the significant declines and high volatility in the equity markets, the lack of liquidity in the credit markets and the widening of credit spreads experienced during the second half of 2008. The increase in earned premiums was due primarily to our Specialty Insurance Operations, partially offset by decreased earned premiums in Other Insurance Operations in both personal lines and our non-specialty commercial lines. Net other revenues increased $19.6 million to $23.1 million in the year ended December 31, 2009. The increase was primarily due to pre-tax proceeds of $23.2 million from the renewal rights sale and a $5.4 million gain related to the purchase of a portion of our Senior Notes, partially offset by a $7.4 million realized loss related to the settlement of the interest rate swap. The year ended December 31, 2008 included a $1.0 million gain from the sale of MWIC and a $1.1 million gain from the sale of FMIC. These increases were partially offset by a $38.9 million decrease in net investment income to $125.5 million in the year ended December 31, 2009, due to a lower average invested asset base and lower investment yields. Contributing to the lower investment yields was a $(1.1) million inflation adjustment related to our inflation indexed treasury securities as compared to an $8.6 million inflation adjustment related to these securities for the year ended December 31, 2008.
Our total expenses increased 0.8% in the year ended December 31, 2009 to $1,899.8 million, compared to $1,883.9 million in the year ended December 31, 2008. Loss and LAE decreased by 0.4% to $1,121.9 million in the year ended December 31, 2009 due to lower current accident year catastrophe losses and slightly more favorable loss reserve development. Interest expense decreased by 49.3% due to the redemption of the Berkshire Preferred Stock in the second quarter of 2008, the repayment of the mortgage note in the second quarter of 2008 and repurchases of our Senior Notes. Partially offsetting these decreases were increased policy acquisition costs and other underwriting expenses. Policy acquisition expenses increased by 8.0% to $389.7 million in the year ended December 31, 2009 mainly due to higher acquisition costs associated with our newer specialty businesses and changes in mix of business. Other underwriting expenses increased 13.5% to $330.0 million in the year ended December 31, 2009. The year ended December 31, 2008 included
54
lower incentive compensation costs resulting from changes in assumptions on our long-term incentive compensation plans. General and administrative expenses were essentially flat as compared to the prior year.
Our income tax expense (benefit) related to pre-tax income (loss) for the years ended December 31, 2009 and 2008 represented effective tax rates of 24.7% and (36.6)%, respectively. The effective tax rate for the year ended December 31, 2009 was lower than the U.S. statutory rate of 35% primarily due to income generated in jurisdictions other than the United States and the settlement of federal income tax audits for 2003 and 2004. Our effective tax rate for the year ended December 31, 2008 was higher than the U.S. statutory rate of 35% due to a pre-tax loss from operations in the United States and income generated in jurisdictions other than the United States, partially offset by non-deductible dividends and accretion on the Berkshire Preferred Stock.
Our GAAP combined ratio for the year ended December 31, 2009 decreased to 94.0% from 94.6% for the year ended December 31, 2008. The loss and LAE ratio decreased 2.6 points to 57.3% while the expense ratio increased 2.0 points to 36.7%. The decrease in the loss and LAE ratio was due to decreases in the current accident year catastrophe loss ratio and also slightly more favorable loss reserve development. The year ended December 31, 2009 included $23.8 million or 1.2 points of current accident year catastrophe losses. The year ended December 31, 2008 included $57.4 million or 3.1 points of current accident year catastrophe losses, mainly due to losses related to hurricanes Ike and Gustav, and weather in the southeastern United States experienced in the first quarter. The year ended December 31, 2009 included $83.4 million or 4.3 points of favorable loss reserve development primarily due to lower than expected severity on non-catastrophe losses related to professional liability lines, multiple peril liability lines and general liability lines partially offset by adverse loss reserve development primarily related to personal injury protection litigation at AutoOne. The year ended December 31, 2008 included $62.0 million or 3.3 points of favorable loss reserve development primarily due to lower than expected severity on non-catastrophe losses and favorable loss reserve development on a prior accident year catastrophe. The favorable non-catastrophe loss reserve development was primarily related to professional liability lines and multiple peril liability lines partially offset by adverse loss reserve development at AutoOne and in legacy run-off business. The expense ratio increased due to higher policy acquisition expenses and other underwriting expenses, as described above.
Summary of Operations By Segment
To better align our operating and reporting structure with our business profile as a result of the transactions, we revised our segment structure into Specialty Insurance Operations, Other Insurance Operations and Investing, Financing and Corporate Operations. As described above, Specialty Insurance Operations is comprised of twelve underwriting units that are aggregated into three major underwriting units: MGA Business, Specialty Industries and Specialty Products. Other Insurance Operations includes AutoOne, the non-specialty commercial lines business and traditional personal lines business, other run-off business and certain purchase accounting adjustments relating to the OneBeacon Acquisition. . Investing, Financing and Corporate Operations includes the investing and financing activities for OneBeacon on a consolidated basis, and certain other activities conducted through our holding companies. Prior periods have been reclassified to conform to the current presentation. Our segment information is presented in Note 13—"Segment Information" of the accompanying consolidated financial statements.
55
Specialty Insurance Operations
Financial results for our Specialty Insurance Operations segment for the years ended December 31, 2010, 2009 and 2008 were as follows:
| |
Year ended December 31, | |||||||||
|---|---|---|---|---|---|---|---|---|---|---|
| |
2010 | 2009 | 2008 | |||||||
| |
($ in millions) |
|||||||||
Net written premiums |
$ | 988.0 | $ | 946.2 | $ | 836.9 | ||||
Earned premiums |
$ | 979.2 | $ | 917.9 | $ | 730.0 | ||||
Loss and LAE |
(539.6 | ) | (403.0 | ) | (347.7 | ) | ||||
Policy acquisition expenses |
(212.7 | ) | (204.1 | ) | (145.9 | ) | ||||
Other underwriting expenses |
(163.6 | ) | (151.4 | ) | (119.4 | ) | ||||
Total underwriting income |
63.3 | 159.4 | 117.0 | |||||||
Net other revenues |
2.7 | 3.5 | 3.3 | |||||||
General and administrative expenses |
(2.3 | ) | (2.6 | ) | (4.8 | ) | ||||
Pre-tax income |
$ | 63.7 | $ | 160.3 | $ | 115.5 | ||||
56
The following table provides net written premiums, earned premiums and underwriting ratios by major underwriting unit and Specialty Insurance Operations in total for the years ended December 31, 2010, 2009 and 2008:
| |
MGA Business |
Specialty Industries |
Specialty Products |
Specialty Insurance Operations |
|||||||||||
|---|---|---|---|---|---|---|---|---|---|---|---|---|---|---|---|
| |
($ in millions) |
||||||||||||||
Year ended December 31, 2010 |
|||||||||||||||
Net written premiums |
$ | 269.2 | $ | 317.6 | $ | 401.2 | $ | 988.0 | |||||||
Earned premiums |
266.0 | 302.2 | 411.0 | 979.2 | |||||||||||
Ratios:(1)(2)(3) |
|||||||||||||||
Loss and LAE |
49.8 | % | 54.0 | % | 59.2 | % | 55.1 | % | |||||||
Expense |
41.4 | 41.8 | 33.9 | 38.4 | |||||||||||
Total GAAP combined |
91.2 | % | 95.8 | % | 93.1 | % | 93.5 | % | |||||||
Year ended December 31, 2009 |
|||||||||||||||
Net written premiums |
$ | 256.7 | $ | 292.3 | $ | 397.2 | $ | 946.2 | |||||||
Earned premiums |
236.9 | 288.5 | 392.5 | 917.9 | |||||||||||
Ratios:(1)(2)(3) |
|||||||||||||||
Loss and LAE |
49.7 | % | 48.0 | % | 37.3 | % | 43.9 | % | |||||||
Expense |
42.1 | 41.5 | 34.8 | 38.7 | |||||||||||
Total GAAP combined |
91.8 | % | 89.5 | % | 72.1 | % | 82.6 | % | |||||||
Year ended December 31, 2008 |
|||||||||||||||
Net written premiums |
$ | 181.4 | $ | 279.7 | $ | 375.8 | $ | 836.9 | |||||||
Earned premiums |
105.1 | 272.8 | 352.1 | 730.0 | |||||||||||
Ratios:(1)(2)(3) |
|||||||||||||||
Loss and LAE |
54.7 | % | 55.3 | % | 39.6 | % | 47.6 | % | |||||||
Expense |
39.0 | 37.5 | 34.6 | 36.4 | |||||||||||
Total GAAP combined |
93.7 | % | 92.8 | % | 74.2 | % | 84.0 | % | |||||||
- (1)
- Includes
our long-term incentive compensation expense. For the years ended December 31, 2010, 2009 and 2008, long-term
incentive compensation expense increased our Specialty Insurance Operations combined ratio by 1.7 points, 2.5 points and 1.0 points, respectively.
- (2)
- Includes
loss and LAE relating to catastrophes. For the years ended December 31, 2010, 2009 and 2008, total calendar year incurred loss and LAE
relating to catastrophes increased our Specialty Insurance Operations loss and LAE and total combined ratios by 1.5 points, 1.0 points and 1.9 points, respectively, including development on prior
accident year catastrophes which decreased our Specialty Insurance Operations loss and LAE and total combined ratios by 0.7 points, 0.6 points and 0.7 points, respectively.
- (3)
- Prior accident year development, including development on catastrophes, for the years ended December 31, 2010, 2009 and 2008 decreased our Specialty Insurance Operations loss and LAE and total combined ratios by 2.8 points, 9.2 points and 8.3 points, respectively.
57
Specialty Insurance Operations—Year ended December 31, 2010 versus year ended December 31, 2009
Overview. We reported a GAAP combined ratio of 93.5% for the year ended December 31, 2010, compared to 82.6% for the year ended December 31, 2009. The increase in our combined ratio was primarily due to higher current accident year non-catastrophe losses and lower favorable loss reserve development, as expenses were essentially flat.
MGA Business. Net written premiums for MGA Business increased by 4.9% to $269.2 million in the year ended December 31, 2010 from $256.7 million in the year ended December 31, 2009. The increase compared to the prior year period was primarily due to an $8.5 million increase in net written premiums from our collector cars and boats business as well as a $4.3 million increase in net written premiums from OBE. Net written premiums for Dewar were essentially flat as compared to the prior year period.
The MGA Business combined ratio for the year ended December 31, 2010 decreased slightly to 91.2% from 91.8% for the year ended December 31, 2009. The loss and LAE ratio increased by 0.1 point to 49.8% while the expense ratio decreased by 0.7 points to 41.4%. The slight increase in the loss and LAE ratio reflects the impact of adverse loss reserve development substantially offset by lower current accident year losses. The year ended December 31, 2010 included 0.6 points of adverse loss reserve development primarily related to OBE, compared to 0.1 point of favorable loss reserve development related to our collector cars and boats business in the prior year period. This was essentially offset by a 0.6 point decrease in current accident year losses primarily related to non-catastrophe losses, compared with the year ended December 31, 2009. The year ended December 31, 2010 included 1.3 points of current accident year catastrophe losses, as compared to 0.9 points in the year ended December 31, 2009. The decrease in the expense ratio was driven by lower other underwriting expenses.
Specialty Industries. Net written premiums for Specialty Industries increased by 8.7% to $317.6 million in the year ended December 31, 2010 from $292.3 million in the year ended December 31, 2009. The increase was due to solid retention levels for many of the businesses and growth in some of our newer businesses. The increase compared to the prior year period was due to a $15.5 million increase in net written premiums from A&H, an $8.3 million increase in net written premiums from OBEG, which began writing business in July 2009, and a $6.2 million increase in net written premiums from OBGR, partially offset by a $4.1 million decrease in net written premiums from IMU and a $0.6 million decrease in net written premiums from OBTI.
The Specialty Industries combined ratio for the year ended December 31, 2010 increased to 95.8% from 89.5% for the year ended December 31, 2009. The loss and LAE ratio increased by 6.0 points to 54.0% while the expense ratio increased by 0.3 points to 41.8%. The increase in the loss and LAE ratio was primarily due to loss reserve development. The year ended December 31, 2010 included 0.4 points of adverse loss reserve development primarily related to A&H, compared to 5.1 points of favorable loss reserve development primarily related to OBTI in the prior year period. Further, the year ended December 31, 2010 included a 0.5 point increase in current accident year losses, compared with the year ended December 31, 2009. The year ended December 31, 2010 included 1.3 points of catastrophe losses, primarily related to severe wind and rainstorms in the northeastern United States experienced in the first quarter. The year ended December 31, 2009 included 0.7 points of current accident year catastrophe losses. The expense ratio was essentially flat.
Specialty Products. Net written premiums for Specialty Products increased by 1.0% to $401.2 million in the year ended December 31, 2010 from $397.2 million in the year ended December 31, 2009. The increase was primarily due to a $20.2 million increase in net written premiums from OBPI, partially offset by a $10.2 million decrease in net written premiums from PIM reflecting a
58
revised underwriting strategy and a $6.0 million decrease in net written premiums from OBSP, reflecting competition in the marketplace.
The Specialty Products combined ratio for the year ended December 31, 2010 increased to 93.1% from 72.1% for the year ended December 31, 2009. The loss and LAE ratio increased by 21.9 points to 59.2% while the expense ratio decreased by 0.9 points to 33.9%. The increase in the loss and LAE ratio was primarily due to an 11.7 point increase in current accident year losses, compared with the year ended December 31, 2009. The year ended December 31, 2010 included the impact of a number of large losses experienced at PIM. The year ended December 31, 2010 also included 3.3 points of current accident year catastrophe losses, primarily related to severe wind and rainstorms in the northeastern United States experienced in the first quarter and elsewhere in the U.S. in the second quarter. The year ended December 31, 2009 included 2.7 points of current accident year catastrophe losses. Further, the year ended December 31, 2010 included 7.5 points of favorable loss reserve development primarily related to professional liability, compared to 17.7 points of favorable loss reserve development related to professional liability in the prior year period. The decrease in the expense ratio was primarily due to a decrease in policy acquisition expenses partially offset by an increase in other underwriting expenses.
Reinsurance protection. We purchase reinsurance in order to minimize loss from large risks or catastrophic events. We also purchase individual property reinsurance coverage for certain risks to reduce large loss volatility through property-per-risk excess of loss reinsurance programs and individual risk facultative reinsurance. We also maintain excess of loss casualty reinsurance programs that provide protection for individual risk or catastrophe losses involving workers compensation, general liability, automobile liability, professional liability or umbrella liability. The availability and cost of reinsurance protection is subject to market conditions, which are outside of our control. Limiting our risk of loss through reinsurance arrangements serves to mitigate the impact of large losses; however, the cost of this protection in an individual period may exceed the benefit.
For the year ended December 31, 2010, our net combined ratio was higher than our gross combined ratio by 3.8 points, primarily due to the impact of the cost of catastrophe reinsurance and facultative reinsurance. For the year ended December 31, 2009, our net combined ratio was higher than our gross combined ratio by 3.6 points, primarily due to the cost of catastrophe, facultative and property reinsurance.
Specialty Insurance Operations—Year ended December 31, 2009 versus year ended December 31, 2008
Overview. We reported a GAAP combined ratio of 82.6% for the year ended December 31, 2009, compared to 84.0% for the year ended December 31, 2008. The decrease in our combined ratio was primarily due to lower current accident year non-catastrophe and catastrophe losses, partially offset by increased policy acquisition expenses mainly due to changes in mix of business.
MGA Business. Net written premiums for MGA Business increased by 41.5% to $256.7 million in the year ended December 31, 2009 from $181.4 million in the year ended December 31, 2008. The increase was primarily due to a $36.7 million increase in net written premiums from OBE which we acquired in the third quarter of 2008, and a $34.8 million increase in net written premiums from our collector cars and boats business that we began writing in the second quarter of 2008.
The MGA Business combined ratio for the year ended December 31, 2009 decreased to 91.8% from 93.7% for the year ended December 31, 2008. The loss and LAE ratio decreased by 5.0 points to 49.7% while the expense ratio increased by 3.1 points to 42.1%. The decrease in the loss and LAE ratio was primarily due to a 4.9 point decrease in current accident year non-catastrophe and catastrophe losses in the year ended December 31, 2009, compared with the year ended December 31, 2008. The year ended December 31, 2009 included 0.9 points of current accident year catastrophe
59
losses, as compared to 1.8 points in the year ended December 31, 2008. The increase in the expense ratio was mainly due to increased policy acquisition costs as our newer businesses receive higher compensation.
Specialty Industries. Net written premiums for Specialty Industries increased by 4.5% to $292.3 million in the year ended December 31, 2009 from $279.7 million in the year ended December 31, 2008. The increase compared to the prior year period was primarily due to an $18.5 million increase in net written premiums from A&H and a $14.5 million increase in net written premiums from OBGR, partially offset by a $21.5 million decrease in net written premiums from IMU.
The Specialty Industries combined ratio for the year ended December 31, 2009 decreased to 89.5% from 92.8% for the year ended December 31, 2008. The loss and LAE ratio decreased by 7.3 points to 48.0% while the expense ratio increased by 4.0 points to 41.5%. The decrease in the loss and LAE ratio was primarily due to a 4.3 point decrease in current accident year non-catastrophe and catastrophe losses in the year ended December 31, 2009, compared with the year ended December 31, 2008 which included the impact of large losses at IMU, as well as higher catastrophe losses primarily related to hurricanes Ike and Gustav. The year ended December 31, 2009 included 0.7 points of current accident year catastrophe losses, compared to 4.0 points of current accident year catastrophe losses for the year ended December 31, 2008. Further, the year ended December 31, 2009 included 5.1 points of favorable loss reserve development primarily related to OBTI, compared to 2.1 points primarily related to OBTI in the year ended December 31, 2008. The increase in the expense ratio was driven by higher other underwriting expenses.
Specialty Products. Net written premiums for Specialty Products increased by 5.7% to $397.2 million in the year ended December 31, 2009 from $375.8 million in the year ended December 31, 2008. The increase was primarily due to a $27.0 million increase in net written premiums from OBPI, partially offset by a $3.8 million decrease in net written premiums from PIM.
The Specialty Products combined ratio for the year ended December 31, 2009 decreased to 72.1% from 74.2% for the year ended December 31, 2008. The loss and LAE ratio decreased by 2.3 points to 37.3% while the expense ratio increased by 0.2 points to 34.8%. The decrease in the loss and LAE ratio was primarily due to an increase in favorable loss reserve development, compared with the year ended December 31, 2008. The year ended December 31, 2009 included 17.7 points of favorable loss reserve development related to professional liability while the year ended December 31, 2008 included 15.6 points of favorable loss reserve development related to professional liability. The expense ratio was essentially flat.
Reinsurance protection. For the year ended December 31, 2009, our net combined ratio was higher than our gross combined ratio by 3.6 points, primarily due to the cost of catastrophe, facultative and property reinsurance. For the year ended December 31, 2008, our net combined ratio was lower than our gross combined ratio by 0.1 point, with the impact of ceded large losses at IMU substantially offset by the cost of catastrophe, facultative and property reinsurance.
60
Other Insurance Operations
Financial results for our Other Insurance Operations segment for the years ended December 31, 2010, 2009 and 2008 were as follows:
| |
Year ended December 31, | |||||||||
|---|---|---|---|---|---|---|---|---|---|---|
| |
2010 | 2009 | 2008 | |||||||
| |
($ in millions) |
|||||||||
Net written premiums |
$ | 248.3 | $ | 960.5 | $ | 1,126.2 | ||||
Earned premiums |
$ | 508.5 | $ | 1,041.6 | $ | 1,149.0 | ||||
Loss and LAE |
(390.6 | ) | (718.9 | ) | (778.5 | ) | ||||
Policy acquisition expenses |
(108.0 | ) | (185.6 | ) | (215.1 | ) | ||||
Other underwriting expenses |
(82.9 | ) | (178.6 | ) | (171.4 | ) | ||||
Total underwriting loss |
(73.0 | ) | (41.5 | ) | (16.0 | ) | ||||
Net other revenues |
18.7 | 23.2 | — | |||||||
General and administrative expenses |
(0.1 | ) | — | — | ||||||
Accretion of fair value adjustment to loss and LAE reserves |
— | (5.4 | ) | (12.0 | ) | |||||
Pre-tax loss |
$ | (54.4 | ) | $ | (23.7 | ) | $ | (28.0 | ) | |
The following table provides underwriting ratios for Other Insurance Operations for the years ended December 31, 2010, 2009 and 2008:
| |
Year ended December 31, | |||||||||||
|---|---|---|---|---|---|---|---|---|---|---|---|---|
| |
2010 | 2009 | 2008 | |||||||||
Ratios:(1)(2)(3) |
||||||||||||
Loss and LAE |
76.8 | % | 69.0 | % | 67.8 | % | ||||||
Expense |
37.5 | 35.0 | 33.6 | |||||||||
Total GAAP combined |
114.3 | % | 104.0 | % | 101.4 | % | ||||||
- (1)
- Includes
our long-term incentive compensation expense. For the years ended December 31, 2010, 2009 and 2008, long-term
incentive compensation expense increased our Other Insurance Operations combined ratio by 1.6 points, 1.8 points and 0.5 points, respectively.
- (2)
- Includes
loss and LAE relating to catastrophes. For the years ended December 31, 2010, 2009 and 2008, total calendar year incurred loss and LAE
relating to catastrophes increased our Other Insurance Operations loss and LAE and total combined ratios by 6.1 points, 0.6 points and 3.3 points, respectively, including development on prior accident
year catastrophes which decreased our loss and LAE and total combined ratios by 0.6 points, 0.3 points and 0.1 points, respectively.
- (3)
- Prior accident year development, including development on catastrophes, for the years ended December 31, 2010, 2009 and 2008 (decreased) increased our Other Insurance Operations loss and LAE and total combined ratios by (4.6) points, 0.1 points and 0.2 points, respectively.
61
Other Insurance Operations—Year ended December 31, 2010 versus year ended December 31, 2009
Net written premiums for Other Insurance Operations decreased by 74.1% to $248.3 million in the year ended December 31, 2010 from $960.5 million in the year ended December 31, 2009, primarily due to the Commercial Lines Transaction and the Personal Lines Transaction. The year ended December 31, 2010 included $171.0 million of net written premiums primarily related to these exited businesses while the year ended December 31, 2009 included $871.7 million of net written premiums related to these businesses. Further, net written premiums at AutoOne decreased by 12.8% to $77.5 million primarily due to actions taken to reduce our exposure in the voluntary private passenger automobile market. Other Insurance Operations earned premiums for the year ended December 31, 2010 included the benefit of a $5.5 million correction of unearned LAD fees.
The Other Insurance Operations combined ratio for the year ended December 31, 2010 increased to 114.3% from 104.0% for the year ended December 31, 2009. The loss and LAE ratio increased 7.8 points to 76.8%, while the expense ratio increased by 2.5 points to 37.5%. The increase in the loss and LAE ratio was primarily due to a 12.5 point increase in current accident year losses. The year ended December 31, 2010 included 6.7 points of current accident year catastrophe losses primarily related to severe wind and rainstorms in the northeastern Untied States experienced in the first quarter, compared to 0.9 points of current accident year catastrophe losses in the year ended December 31, 2009. In addition, current accident year non-catastrophe losses were 6.7 points higher than the prior year period due to higher-than-average levels of large losses in the non-specialty commercial businesses. The increase was partially offset by 4.6 points of favorable loss reserve development in the year ended December 31, 2010, compared with 0.1 point of adverse loss reserve development in the year ended December 31, 2009, related to AutoOne and traditional personal lines. The increase in the expense ratio primarily results from expenses that have not decreased proportionately with the reduction in earned premiums.
Reinsurance protection. We purchase reinsurance in order to minimize loss from large risks or catastrophic events. We also purchase individual property reinsurance coverage for certain risks to reduce large loss volatility through property-per-risk excess of loss reinsurance programs and individual risk facultative reinsurance. We also maintain excess of loss casualty reinsurance programs that provide protection for individual risk or catastrophe losses involving workers compensation, general liability, automobile liability, professional liability or umbrella liability losses. In addition, we have a reinsurance cover with NICO, which entitles us to recover up to $2.5 billion in ultimate loss and LAE incurred related primarily to claims arising from business written prior to 1992 for asbestos claims and prior to 1987 for environmental claims, and certain other exposures. The availability and cost of reinsurance protection is subject to market conditions, which are outside of our control. Limiting our risk of loss through reinsurance arrangements serves to mitigate the impact of large losses; however, the cost of this protection in an individual period may exceed the benefit.
For the year ended December 31, 2010, our net combined ratio was higher than our gross combined ratio by 11.3 points, primarily due to the impact of the business fronted under the Commercial Lines Transaction as well as the cost of catastrophe reinsurance, and to a lesser extent the cost of property reinsurance, partially offset by losses ceded under facultative and casualty reinsurance. For the year ended December 31, 2009, our net combined ratio was higher than our gross combined ratio by 7.4 points, primarily due to the cost of catastrophe and facultative reinsurance.
Other Insurance Operations—Year ended December 31, 2009 versus year ended December 31, 2008
Net written premiums for Other Insurance Operations decreased by 14.7% to $960.5 million in the year ended December 31, 2009 from $1,126.2 million in the year ended December 31, 2008. In
62
traditional personal lines, net written premiums decreased $79.7 million to $419.9 million. In an effort to reduce our property catastrophe exposure in the Northeast, we entered into a 30% quota share agreement with a group of reinsurers. During the year ended December 31, 2009, we ceded $59.9 million of written premiums from our Northeast homeowners business written through OBIC and its subsidiary companies, along with Adirondack Insurance Exchange and New Jersey Skylands Insurance Association in New York and New Jersey, respectively. Net written premiums from non-specialty commercial businesses decreased primarily due to a $42.4 million decrease in the non-specialty middle market commercial businesses and a $13.1 million decrease in the small business division. Further, net written premiums at AutoOne decreased by $31.0 million primarily due to changes in New York's assigned risk pool and lower writings of voluntary private passenger automobile risks in New York.
The Other Insurance Operations combined ratio for the year ended December 31, 2009 increased to 104.0% from 101.4% for the year ended December 31, 2008. The loss and LAE ratio increased 1.2 points to 69.0%, while the expense ratio increased by 1.4 points to 35.0%. The increase in the loss and LAE ratio was primarily due to a 1.3 point increase in current accident year losses as compared to the prior year period primarily related to higher current accident non-catastrophe loss ratios related to poor automobile results. This was partially offset by a decrease in current accident year catastrophe losses. The year ended December 31, 2009 included 0.9 points of current accident year catastrophe losses, compared with 3.4 points for the year ended December 31, 2008 primarily related to hurricane Ike in our non-specialty middle market commercial businesses and small business division and losses from tornados in the southeastern United States in our non-specialty middle market commercial businesses in the first quarter of 2008. The increase in the expense ratio was primarily due to a 2.3 point increase in other underwriting expenses which included 1.7 points of higher incentive compensation costs, severance and other costs associated with the renewal rights transaction, partially offset by a 0.9 point decrease in policy acquisition costs as a result of the ceding commission related to the homeowners quota share, as described above. The year ended December 31, 2008 included $9.2 million of incurred unallocated loss adjustment expenses related to the Liberty Mutual settlement.
Reinsurance protection. For the year ended December 31, 2009, our net combined ratio was higher than our gross combined ratio by 7.4 points, primarily due to the cost of catastrophe and facultative reinsurance. For the year ended December 31, 2008, our net combined ratio was higher than our gross combined ratio by 3.7 points, primarily due to the cost of catastrophe reinsurance.
Investing, Financing and Corporate Operations
A summary of results from our Investing, Financing and Corporate Operations segment for the years ended December 31, 2010, 2009 and 2008 is as follows:
| |
Year ended December 31, | |||||||||
|---|---|---|---|---|---|---|---|---|---|---|
| |
2010 | 2009 | 2008 | |||||||
| |
($ in millions) |
|||||||||
Net investment income |
$ | 96.6 | $ | 125.5 | $ | 164.4 | ||||
Net realized and unrealized investment gains (losses) |
74.6 | 248.6 | (763.6 | ) | ||||||
Net other (expenses) revenues |
(11.8 | ) | (3.6 | ) | 0.2 | |||||
General and administrative expenses |
(10.6 | ) | (10.5 | ) | (10.8 | ) | ||||
Interest expense on debt |
(29.6 | ) | (39.7 | ) | (44.9 | ) | ||||
Interest expense—dividends on preferred stock |
— | — | (11.8 | ) | ||||||
Interest expense—accretion on preferred stock |
— | — | (21.6 | ) | ||||||
Pre-tax income (loss) |
$ | 119.2 | $ | 320.3 | $ | (688.1 | ) | |||
63
Investing, Financing and Corporate Operations—Year ended December 31, 2010 versus year ended December 31, 2009
Investing, Financing and Corporate Operations reported pre-tax income of $119.2 million in the year ended December 31, 2010, compared to pre-tax income of $320.3 million in the year ended December 31, 2009. The decrease was primarily related to a decrease in net investment income and net realized and unrealized investment gains. As further described below, net realized and unrealized investment gains decreased to $74.6 million in the year ended December 31, 2010, compared to $248.6 million in the prior year period and net investment income decreased to $96.6 million in the year ended December 31, 2010, compared to $125.5 million in the prior year period. See "Management's Discussion and Analysis of Financial Condition and Results of Operations—Summary of Investment Results". The decrease in interest expense reflects actions taken to reduce outstanding debt. See "Management's Discussion and Analysis of Financial Condition and Results of Operations—Financing". Further, net other expenses increased mainly due to a $10.8 million loss related to the purchase of a portion of our Senior Notes in the year ended December 31, 2010, compared with a $5.4 million gain related to the purchase of a portion of our Senior Notes, partially offset by a $7.4 million realized loss related to the settlement of the interest rate swap in the prior year period. General and administrative expenses were essentially flat as compared with the prior year period.
Investing, Financing and Corporate Operations—Year ended December 31, 2009 versus year ended December 31, 2008
Investing, Financing and Corporate Operations reported pre-tax income of $320.3 million in the year ended December 31, 2009, compared to a pre-tax loss of $688.1 million in the year ended December 31, 2008. The increase was primarily related to an increase in net realized and unrealized investment gains (losses), partially offset by a decrease in net investment income. As further described below, net realized and unrealized investment gains increased to $248.6 million in the year ended December 31, 2009, compared to net realized and unrealized investment losses of $763.6 million in the prior year period and net investment income decreased to $125.5 million in the year ended December 31, 2009, compared to $164.4 million in the prior year period. Net investment income in the year ended December 31, 2008 included $6.2 million related to assets held in trust for the Berkshire Preferred Stock. See "Management's Discussion and Analysis of Financial Condition and Results of Operations—Summary of Investment Results". The increase in income was also due to a decrease in interest expense related to the redemption of the Berkshire Preferred Stock in the second quarter of 2008, the repayment of the mortgage note in the second quarter of 2008 and repurchases of our Senior Notes. See "Management's Discussion and Analysis of Financial Condition and Results of Operations—Financing". The year ended December 31, 2009 included a $5.4 million gain related to the purchase of a portion of our Senior Notes, partially offset by a $7.4 million realized loss related to the settlement of the interest rate swap. General and administrative expenses were essentially flat as compared with the prior year period.
64
Summary of Investment Results
Investment Returns
A summary of our consolidated pre-tax investment results for the years ended December 31, 2010, 2009 and 2008 is as follows:
| |
Year ended December 31, | ||||||||||
|---|---|---|---|---|---|---|---|---|---|---|---|
| |
2010 | 2009 | 2008 | ||||||||
| |
($ in millions) |
||||||||||
Net investment income(1) |
$ | 96.6 | $ | 125.5 | $ | 164.4 | |||||
Net realized investment gains (losses) |
81.9 | (20.5 | ) | (318.9 | ) | ||||||
Change in net unrealized investment gains and losses |
(7.3 | ) | 269.1 | (444.7 | ) | ||||||
Total GAAP pre-tax investment results |
$ | 171.2 | $ | 374.1 | $ | (599.2 | ) | ||||
- (1)
- Includes $6.2 million of net investment income for assets held in trust for the year ended December 31, 2008.
Gross investment returns versus typical benchmarks for the years ended December 31, 2010, 2009 and 2008 are as follows:
| |
Year ended December 31,(1) |
||||||||||
|---|---|---|---|---|---|---|---|---|---|---|---|
| |
2010 | 2009 | 2008(2) | ||||||||
Fixed maturity investments |
4.4 | % | 12.3 | % | (2.6 | )% | |||||
Short-term investments |
— | 0.5 | 2.0 | ||||||||
Total fixed income |
3.5 | 9.8 | (1.8 | ) | |||||||
Barclays U.S. Intermediate Aggregate Index |
6.1 | 6.5 | 5.2 | ||||||||
Common equity securities |
18.5 | (7.4 | ) | (53.3 | ) | ||||||
Convertible bonds |
12.4 | 22.7 | (9.1 | ) | |||||||
Total common equity securities and convertible bonds |
16.4 | 10.8 | (39.9 | ) | |||||||
Other investments |
6.0 | 10.8 | (35.7 | ) | |||||||
Total common equity securities, convertible bonds and other investments |
13.2 | 10.8 | (39.0 | ) | |||||||
S&P 500 Index (total return) |
15.1 | 26.5 | (37.0 | ) | |||||||
Total consolidated portfolio |
4.9 | % | 9.9 | % | (13.0 | )% | |||||
- (1)
- Gross
investment returns exclude investment expenses of $8.9 million, $10.9 million and $14.1 million for the years ended
December 31, 2010, 2009 and 2008, respectively.
- (2)
- Includes $6.2 million of net investment income for assets held in trust for the year ended December 31, 2008.
During the third and fourth quarters of 2008, there were significant declines and high volatility in the equity markets, a lack of liquidity in the credit markets and a widening of credit spreads on debt securities. These factors had a significant adverse effect on the performance of our investment portfolio in 2008. In response to these factors, in 2008 and 2009, we shifted our focus from total return to capital preservation. In particular, we significantly reduced the size of our equity portfolio and managed our fixed income portfolio to avoid realizing losses. During 2010 as overall financial markets and our investment results continued to stabilize, we gradually shifted back from a focus on capital preservation to our traditional total return investment philosophy.
65
Investment Returns—Year ended December 31, 2010 versus year ended December 31, 2009
Overview
Our total pre-tax investment results were $171.2 million, a return of 4.9% for the year ended December 31, 2010, compared to $374.1 million, a return of 9.9% for the year ended December 31, 2009. Net investment income in the year ended December 31, 2010 was $96.6 million, a decrease of $28.9 million, compared to $125.5 million in the year ended December 31, 2009. The decrease was principally due to lower investment yields, a reduction in invested assets as a result of the Personal Lines Transaction, repurchases of our Senior Notes, payment of the special dividend, and an increased allocation to lower yielding short-term investments during the first six months of 2010 in preparation for the closing of the Personal Lines Transaction. The decrease was partially offset by a $1.7 million inflation adjustment related to our inflation indexed treasury securities for the year ended December 31, 2010 as compared to a $(1.1) million inflation adjustment related to these securities for the year ended December 31, 2009. Net realized investment gains (losses) were $81.9 million in the year ended December 31, 2010, an increase of $102.4 million compared to $(20.5) million in the year ended December 31, 2009. The increase was principally due to $56.2 million of realized gains on the sales of fixed maturity securities in the year ended December 31, 2010 mainly in preparation for the close of the Personal Lines Transaction and $31.5 million of realized losses on the sales of common equity investments resulting from the reduction in the size of the equity portfolio in the year ended December 31, 2009. The change in net unrealized investment gains and losses was a decrease of $7.3 million in the year ended December 31, 2010, compared to an increase of $269.1 million in the year ended December 31, 2009.
Fixed income
Our fixed income portfolio, which includes fixed maturity and short-term investments, returned 3.5% for the year ended December 31, 2010, compared to 9.8% for the year ended December 31, 2009. The fixed maturity portfolio, in particular the corporate bond portfolio, performed well during the year ended December 31, 2009, driven by spread tightening. We recorded $56.2 million in net realized gains in the year ended December 31, 2010, mainly due to sales of fixed maturity investments during the first six months of 2010 in preparation of the close of the Personal Lines Transaction. We maintained a high quality fixed maturity portfolio with a relatively short duration of approximately 2.8 years excluding short-term investments and approximately 2.5 years including short-term investments at December 31, 2010. Our fixed maturity portfolio performed consistently with its characteristics and below the Barclays U.S. Intermediate Aggregate Index benchmark for the year ended December 31, 2010.
Common equity securities, convertible bonds and other investments
Our total common equity securities, convertible bonds and other investments portfolio returned 13.2% for the year ended December 31, 2010, compared to 10.8% for the year ended December 31, 2009. Our total common equity securities and convertible bonds portfolio returned 16.4% and 10.8% for the years ended December 31, 2010 and 2009, respectively, or 130 basis points better and 1,570 basis points worse, respectively, than the S&P 500 benchmark. The S&P 500 rebounded during 2009; as a result of the timing of sales of common equity securities in 2009 in order to reduce our equity exposure discussed previously and given that we were more heavily weighted in convertible bonds than in common equity securities, our portfolio underperformed the S&P 500 benchmark. We recorded $20.4 million in net realized gains in the year ended December 31, 2010. Our other investments portfolio returned 6.0% for the year ended December 31, 2010, compared to 10.8% for the year ended December 31, 2009.
66
Investment Returns—Year ended December 31, 2009 versus year ended December 31, 2008
Overview
Our total pre-tax investment results were $374.1 million, a return of 9.9% for the year ended December 31, 2009, compared to $(599.2) million, a return of (13.0)%, for the year ended December 31, 2008. Net investment income in the year ended December 31, 2009 was $125.5 million, a decrease of $38.9 million, compared to $164.4 million in the year ended December 31, 2008. The decrease was due to a lower average invested asset base and lower investment yields. Contributing to the lower investment yields was a $(1.1) million inflation adjustment related to our inflation indexed treasury securities for the year ended December 31, 2009 as compared to an $8.6 million inflation adjustment related to these securities for the year ended December 31, 2008. Net investment income in the year ended December 31, 2008 included $6.2 million related to assets held in trust. Net realized investment (losses) gains were $(20.5) million in the year ended December 31, 2009, an increase of $298.4 million, compared to $(318.9) million in the year ended December 31, 2008. The change in net unrealized investment gains and losses resulted in a gain of $269.1 million in the year ended December 31, 2009, compared to a loss of $444.7 million in the year ended December 31, 2008. As described above, net realized and unrealized investment losses experienced in 2008 resulted from the crisis that occurred in the financial markets during the third and fourth quarters of 2008.
Fixed income
Our fixed income portfolio, which includes fixed maturity and short-term investments, returned 9.8% for the year ended December 31, 2009, compared to (1.8)% for the year ended December 31, 2008. As previously discussed, the fixed maturity portfolio, in particular the corporate bond portfolio, performed well during the year ended December 31, 2009, driven by spread tightening. We maintained a high quality fixed maturity portfolio with a relatively short duration of approximately 2.5 years excluding short-term investments and approximately 2.2 years including short-term investments at December 31, 2009. Our fixed maturity portfolio performed consistently with its characteristics and above the Barclays U.S. Intermediate Aggregate Index benchmark for the year ended December 31, 2009.
Common equity securities, convertible bonds and other investments
Our total common equity securities, convertible bonds and other investments portfolio returned 10.8% for the year ended December 31, 2009, compared to (39.0)% for the year ended December 31, 2008. Our total common equity securities and convertible bonds portfolio returned 10.8% and (39.9)% for the years ended December 31, 2009 and 2008, respectively, or 1,570 basis points worse and 290 basis points worse, respectively, than the S&P 500 benchmark. As previously discussed, the S&P 500 rebounded during 2009; as a result of the timing of sales of common equity securities in 2009 in order to reduce our equity exposure discussed previously and given that we were more heavily weighted in convertible bonds than in common equity securities, our portfolio underperformed the S&P 500 benchmark. We recorded $(20.5) million in net realized losses in the year ended December 31, 2009, which included $(19.2) million of net realized losses on the sales of common equity securities and convertible bond investments resulting from the reduction in the size of the equity portfolio discussed previously. Our other investments portfolio returned 10.8% for the year ended December 31, 2009, compared to (35.7)% for the year ended December 31, 2008.
67
Portfolio Composition
The following table presents the composition of our investment portfolio as of December 31, 2010 and 2009:
| |
As of December 31, | |||||||||||||
|---|---|---|---|---|---|---|---|---|---|---|---|---|---|---|
| |
2010 | 2009 | ||||||||||||
Type of Investment
|
$ in millions | % of total | $ in millions | % of total | ||||||||||
Fixed maturity investments |
$ | 2,415.5 | 74.0 | % | $ | 2,994.3 | 74.0 | % | ||||||
Short-term investments |
300.0 | 9.2 | 544.4 | 13.5 | ||||||||||
Common equity securities |
285.3 | 8.7 | 187.6 | 4.7 | ||||||||||
Convertible bonds |
93.8 | 2.9 | 170.2 | 4.2 | ||||||||||
Other investments(1) |
171.4 | 5.2 | 146.3 | 3.6 | ||||||||||
Total |
$ | 3,266.0 | 100.0 | % | $ | 4,042.8 | 100.0 | % | ||||||
- (1)
- Includes investments such as hedge funds and private equity funds.
The breakdown of our fixed maturity portfolio, including convertible bonds, at December 31, 2010 by credit class, based upon issue credit ratings provided by Standard & Poor's, or if unrated by Standard & Poor's, long-term obligation ratings provided by Moody's, is as follows:
Ratings
|
Amortized Cost | % of Total | Carrying value | % of Total | ||||||||||
|---|---|---|---|---|---|---|---|---|---|---|---|---|---|---|
| |
($ in millions) |
|||||||||||||
U.S. government and agency obligations |
$ | 241.7 | 9.9 | % | $ | 250.8 | 10.0 | % | ||||||
AAA/Aaa |
1,107.8 | 45.4 | 1,108.3 | 44.2 | ||||||||||
AA/Aa |
97.5 | 4.0 | 100.2 | 4.0 | ||||||||||
A/A |
398.9 | 16.3 | 411.8 | 16.4 | ||||||||||
BBB/Baa |
448.2 | 18.3 | 478.0 | 19.0 | ||||||||||
Other/not rated |
147.8 | 6.1 | 160.2 | 6.4 | ||||||||||
Total |
$ | 2,441.9 | 100.0 | % | 2,509.3 | 100.0 | % | |||||||
The weighted average duration of our fixed maturity portfolio, including convertible bonds, at December 31, 2010 is approximately 3 years. The maturity distribution for fixed maturity investments, including convertible bonds, held at December 31, 2010 is as follows:
Maturity
|
Amortized Cost | Carrying Value | ||||||
|---|---|---|---|---|---|---|---|---|
| |
($ in millions) |
|||||||
Due within one year |
$ | 119.3 | $ | 121.1 | ||||
Due after one through five years |
791.4 | 838.2 | ||||||
Due after five through ten years |
296.1 | 304.5 | ||||||
Due after ten years |
40.4 | 44.7 | ||||||
Asset-backed securities |
1,117.2 | 1,117.4 | ||||||
Preferred stocks |
77.5 | 83.4 | ||||||
Total |
$ | 2,441.9 | $ | 2,509.3 | ||||
68
Asset-backed Securities
We purchase commercial and residential mortgage backed securities to maximize our fixed income portfolio's risk adjusted returns in the context of a diversified portfolio. Our non-agency commercial mortgage-backed portfolio (CMBS) is generally short tenor and structurally senior, with more than 30 points of subordination on average for fixed rate CMBS and more than 65 points of subordination on average for floating rate CMBS as of December 31, 2010. In general, subordination represents the percentage of principal loss on the underlying collateral that would have to occur before the security incurs a loss. These collateral losses, instead, are first absorbed by other securities lower in the capital structure. We believe this structural protection mitigates the risk of loss tied to refinancing challenges facing the commercial real estate market. As of December 31, 2010, on average approximately 8% of the underlying loans were reported as non-performing for all CMBS held by us. We are not an originator of residential mortgage loans and did not hold any residential mortgage-backed securities (RMBS) categorized as sub-prime as of December 31, 2010. In addition, our investments in hedge funds and private equity funds contain negligible amounts of sub-prime mortgage backed securities as of December 31, 2010. We consider sub-prime mortgage backed securities to be those that are issued from dedicated sub-prime shelves or have underlying loan pools that exhibit weak credit characteristics or dedicated second-lien shelf registrations (i.e., we consider investments backed primarily by second-liens to be a sub-prime risk regardless of credit scores or other metrics).
There are also mortgage backed securities that we categorize as "non-prime" (also called "Alt A" or "A-") that are backed by collateral that has overall credit quality between prime and sub-prime, as determined based on our review of the characteristics of their underlying mortgage loan pools, such as credit scores and financial ratios. As of December 31, 2010, we did not hold any mortgage backed securities that were classified as non-prime. Our non-agency residential mortgage-backed portfolio is generally of moderate average life, fixed rate and structurally senior. We do not own any collateralized debt obligations, including residential mortgage-backed collateralized debt obligations.
69
The following table summarizes the carrying value of our asset-backed securities as of December 31, 2010 and 2009:
| |
December 31, | |||||||||||||||||||||
|---|---|---|---|---|---|---|---|---|---|---|---|---|---|---|---|---|---|---|---|---|---|---|
| |
2010 | 2009 | ||||||||||||||||||||
| |
Fair Value | Level 2 | Level 3 | Fair Value | Level 2 | Level 3 | ||||||||||||||||
| |
($ in millions) |
|||||||||||||||||||||
Mortgage-backed securities: |
||||||||||||||||||||||
Agency: |
||||||||||||||||||||||
GNMA |
$ | 684.7 | $ | 663.4 | $ | 21.3 | $ | 483.0 | $ | 483.0 | $ | — | ||||||||||
FNMA |
143.0 | 143.0 | — | 149.1 | 149.1 | — | ||||||||||||||||
FHLMC |
19.0 | 19.0 | — | 76.3 | 76.3 | — | ||||||||||||||||
Total agency(1) |
846.7 | 825.4 | 21.3 | 708.4 | 708.4 | — | ||||||||||||||||
Non-agency: |
||||||||||||||||||||||
Residential |
6.4 | — | 6.4 | 30.7 | 30.7 | — | ||||||||||||||||
Commercial |
36.3 | 36.3 | — | 136.1 | 120.4 | 15.7 | ||||||||||||||||
Total Non-agency |
42.7 | 36.3 | 6.4 | 166.8 | 151.1 | 15.7 | ||||||||||||||||
Total mortgage-backed securities |
889.4 |
861.7 |
27.7 |
875.2 |
859.5 |
15.7 |
||||||||||||||||
Other asset-backed securities: |
||||||||||||||||||||||
Credit card receivables |
97.5 | 97.5 | — | 27.7 | 27.7 | — | ||||||||||||||||
Vehicle receivables |
130.5 | 130.5 | — | 111.1 | 111.1 | — | ||||||||||||||||
Other |
— | — | — | 0.9 | 0.9 | — | ||||||||||||||||
Total other asset-backed securities |
228.0 | 228.0 | — | 139.7 | 139.7 | — | ||||||||||||||||
Total asset-backed securities |
$ | 1,117.4 | $ | 1,089.7 | $ | 27.7 | $ | 1,014.9 | $ | 999.2 | $ | 15.7 | ||||||||||
- (1)
- Represents publicly traded mortgage-backed securities which carry the full faith and credit guaranty of the U.S. government (i.e., GNMA) or are guaranteed by a government sponsored entity (i.e., FNMA, FHLMC).
Non-agency Mortgage Securities
The security issuance years of our investments in non-agency RMBS and non-agency CMBS securities as of December 31, 2010 are as follows:
| |
|
Security Issuance Year | ||||||||||||||||||||
|---|---|---|---|---|---|---|---|---|---|---|---|---|---|---|---|---|---|---|---|---|---|---|
| |
Fair Value | |||||||||||||||||||||
| |
2001 | 2003 | 2005 | 2006 | 2007 | 2010 | ||||||||||||||||
| |
($ in millions) |
|||||||||||||||||||||
Non-agency RMBS |
$ | 6.4 | $ | — | $ | — | $ | — | $ | — | $ | — | $ | 6.4 | ||||||||
Non-agency CMBS |
36.3 | — | 1.6 | 14.5 | — | 20.2 | — | |||||||||||||||
Total |
$ | 42.7 | $ | — | $ | 1.6 | $ | 14.5 | $ | — | $ | 20.2 | $ | 6.4 | ||||||||
70
Non-agency Residential Mortgage Securities
The classification of the underlying collateral quality and the tranche levels of our non-agency RMBS securities are as follows as of December 31, 2010:
| |
Fair Value | Super Senior(1) | Senior(2) | Subordinate(3) | |||||||||
|---|---|---|---|---|---|---|---|---|---|---|---|---|---|
| |
($ in millions) |
||||||||||||
Prime |
$ | 6.4 | $ | — | $ | 6.4 | $ | — | |||||
Sub-prime |
— | — | — | — | |||||||||
Total |
$ | 6.4 | $ | — | $ | 6.4 | $ | — | |||||
- (1)
- At
issuance, Super Senior were rated AAA by Standard & Poor's or Aaa by Moody's and were senior to other AAA or Aaa bonds.
- (2)
- At
issuance, Senior were rated AAA by Standard & Poor's and were senior to non-AAA bonds.
- (3)
- At issuance, Subordinate were not rated AAA by Standard & Poor's and were junior to other bonds.
Non-agency Commercial Mortgage Securities
The amount of fixed and floating rate securities and their tranche levels are as follows as of December 31, 2010:
| |
Fair Value | Super Senior(1) | Senior(2) | Subordinate(3) | |||||||||
|---|---|---|---|---|---|---|---|---|---|---|---|---|---|
| |
($ in millions) |
||||||||||||
Fixed rate CMBS |
$ | 20.7 | $ | 19.1 | $ | 1.6 | $ | — | |||||
Floating rate CMBS |
15.6 | 15.6 | — | — | |||||||||
Total |
$ | 36.3 | $ | 34.7 | $ | 1.6 | $ | — | |||||
- (1)
- At
issuance, Super Senior were rated AAA by Standard & Poor's and were senior to other AAA bonds.
- (2)
- At
issuance, Senior were rated AAA by Standard & Poor's and were senior to non-AAA bonds.
- (3)
- At issuance, Subordinate were not rated AAA by Standard & Poor's and were senior to other bonds.
Liquidity and Capital Resources
Operating cash and short-term investments
Our sources and uses of cash are as follows:
Holding company level. The primary sources of cash for OneBeacon Insurance Group, Ltd. and certain of our intermediate holding companies are expected to be distributions and tax sharing payments received from our insurance operating subsidiaries, capital raising activities and net investment income and proceeds from sales and maturities of holding company investments. The primary uses of cash are expected to be common share repurchases, interest payments on our debt obligations, repurchases and retirements of our debt obligations, dividend payments on our common shares, purchases of investments, payments made to tax authorities, contributions to our operating subsidiaries, and holding company operating expenses.
71
Operating subsidiary level. The primary sources of cash for our operating subsidiaries are expected to be premium collections, net investment income, capital raising activities, contributions from our holding companies and proceeds from sales and maturities of investments. The primary uses of cash are expected to be claim payments, policy acquisition costs, interest payments on our debt obligations, repurchases and retirements of our debt obligations, operating expenses, purchases of investments, and distributions and tax sharing payments made to parent holding companies.
Insurance companies typically collect premiums on policies that they write prior to paying claims made under those policies. During periods of premium growth, insurance companies typically experience positive cash flow from operations, as premium receipts typically exceed claim payments. When this happens, positive cash flow from operations is usually offset by negative cash flow from investing activities, as the positive operating cash flow is used to purchase investments. Conversely, during periods of premium decline, insurance companies typically experience negative cash flow from operations, even during periods in which they report GAAP net income, as the claims that they pay exceed the premiums that they collect. When this happens, negative cash flow from operations is typically offset by positive cash flow from investing activities, as invested assets are sold to fund current claim payments.
Both internal and external forces influence our financial condition, results of operations and cash flows. Claim settlements, premium levels and investment returns may be impacted by changing rates of inflation and other economic conditions. In many cases, significant periods of time, ranging up to several years or more, may lapse between the occurrence of an insured loss, the reporting of the loss to us and the settlement of the liability for that loss. The exact timing of the payment of claims and benefits cannot be predicted with certainty. Our operating subsidiaries maintain portfolios of invested assets with varying maturities and a substantial amount of cash and short-term investments to provide adequate liquidity for the payment of claims.
Management believes that our cash balances, cash flows from operations and cash flows from investments are adequate to meet expected cash requirements for the foreseeable future on both a holding company and operating subsidiary level.
Dividend Capacity
Under the insurance laws of the states and jurisdictions under which our operating subsidiaries are domiciled, an insurer is restricted with respect to the timing or the amount of dividends it may pay without prior approval by regulatory authorities. Accordingly, there can be no assurance regarding the amount of such dividends that may be paid by such subsidiaries in the future.
Generally, our regulated insurance operating subsidiaries have the ability to pay dividends during any 12-month period without the prior approval of regulatory authorities in an amount set by formula based on the greater of prior year statutory net income or 10% of prior year end statutory surplus, subject to the availability of unassigned funds. Our top tier regulated insurance operating subsidiaries have the ability to pay $291 million of dividends during 2011 without the prior approval of regulatory authorities, subject to the availability of unassigned funds. At December 31, 2010, OneBeacon's top tier regulated insurance operating subsidiaries had $0.8 billion of unassigned funds and statutory surplus of $1.1 billion. At December 31, 2010, we had approximately $390 million of net unrestricted cash, short-term investments and fixed maturity investments outside of our regulated insurance operating subsidiaries.
During the year ended December 31, 2010, our top tier regulated operating subsidiaries distributed $776.0 million to OneBeacon LLC. This amount included $71.0 million of ordinary dividends, $535.0 million of extraordinary dividends and $170.0 million representing a return of capital. During the years ended December 31, 2009 and 2008, our top tier regulated operating subsidiaries distributed $80.0 million and $197.0 million, respectively, of ordinary dividends to OneBeacon LLC. During the
72
years ended December 31, 2010, 2009 and 2008, our unregulated insurance operating subsidiaries paid $8.3 million, $11.9 million and $6.0 million, respectively, of dividends to their immediate parent.
During the year ended December 31, 2010, we paid $79.5 million of regular quarterly dividends and $236.1 million of a special dividend to holders of OneBeacon's common shares. During the year ended December 31, 2009, we paid $79.9 million of regular quarterly dividends to holders of OneBeacon's common shares. During the year ended December 31, 2008, we paid $80.2 million of regular quarterly dividends and $195.3 million of a special dividend to holders of OneBeacon's common shares.
OBH's ability to declare or pay dividends was limited by the terms of the Series A Preferred Stock issued to Berkshire. OBH could not, in certain circumstances, declare or pay any dividend or distribution to any other class or series of stock without the consent of the holders of a majority of outstanding shares of the Berkshire Preferred Stock. Under the terms of a Keep-Well Agreement dated November 30, 2004 between White Mountains and OBH (the Keep-Well), White Mountains had agreed to return to OBH up to approximately $1.1 billion if some or all of that amount was required by OBH to meet its obligations under the terms of the Berkshire Preferred Stock. As described below, the Keep-Well has expired. Under the Keep-Well, White Mountains had to make any required contributions to OBH prior to making any distributions to its shareholders. The aggregate amount of distributions that White Mountains could make to its shareholders was limited; the limit increased or decreased by an amount equal to White Mountains' consolidated net income or loss over the remaining life of the Keep-Well. The Keep-Well expired when all obligations of the Berkshire Preferred Stock were satisfied upon its redemption in May 2008. See "Management's Discussion and Analysis of Financial Condition and Results of Operations—Economic Defeasance" for a discussion of the creation and funding of an irrevocable grantor trust to economically defease the Berkshire Preferred Stock.
Economic Defeasance
In connection with our initial public offering, two of our subsidiaries, OBH and OBEH, each established an irrevocable grantor trust. The assets of each trust were solely dedicated to the satisfaction of the payment of dividends and redemption amounts on, respectively, the $300.0 million liquidation preference of OBH's Berkshire Preferred Stock and $20.0 million liquidation preference of OBEH's Zenith Preferred Stock. OBH and OBEH funded their respective trusts with cash and purchased a portfolio of fixed maturity securities issued by the U.S. government and government-sponsored enterprises. The scheduled interest and principal payments were sufficient to pay when due all amounts required under the terms of the Berkshire Preferred Stock and the Zenith Preferred Stock. The creation and funding of the trusts did not legally defease the preferred stock nor create any additional rights for the holders of the preferred stock either in the trusts or otherwise, although the assets in the trusts were segregated from OBH's and OBEH's other general assets and were not available to OBH or OBEH for any use other than the payment of the Berkshire Preferred Stock and the Zenith Preferred Stock. Assets held in one of the trusts were used to redeem the Zenith Preferred Stock in June 2007, while assets held in the other trust were used to redeem the Berkshire Preferred Stock in May 2008. White Mountains Capital, Inc., a subsidiary of White Mountains, served as the trustee for the irrevocable grantor trusts. Pre-tax net investment income earned on these investments totaled $6.2 million for the year ended December 31, 2008.
Insurance Float
Insurance float is an important aspect of our insurance operations. Insurance float represents funds that an insurance company holds for a limited time. In an insurance operation, float arises because premiums are collected before losses are paid. This interval can extend over many years. During that time, the insurer invests the funds. When the premiums that an insurer collects do not cover the losses and expenses it eventually must pay, the result is an underwriting loss, which is considered to be the
73
cost of insurance float. We calculate our insurance float by taking our net invested assets and subtracting our total capital. Although insurance float can be calculated using numbers determined under GAAP, insurance float is not a GAAP concept and, therefore, there is no comparable GAAP measure.
Insurance float can increase in a number of ways, including through acquisitions of insurance operations, organic growth in existing insurance operations and recognition of losses that do not cause a corresponding reduction in investment assets. Conversely, insurance float can decrease in a number of other ways, including sales of insurance operations, shrinking or run-off of existing insurance operations, the acquisition of operations that do not have substantial investment assets (e.g., an agency) and the recognition of gains that do not cause a corresponding increase in investment assets. We have historically obtained our insurance float through both acquisitions and organic growth. We intend to generate low-cost float over time through a combination of acquisitions and organic growth in our ongoing insurance operations. However, we will seek to increase our insurance float organically only when market conditions allow for an expectation of generating underwriting profits.
Certain operational leverage metrics can be measured with ratios that are calculated using insurance float. There are many activities that do not change the amount of insurance float at an insurance company but can have a significant impact on the company's operational leverage metrics. For example, investment gains and losses, foreign currency gains and losses, debt issuances and repurchases/repayments, common share issuances and repurchases and dividends paid to shareholders are all activities that do not change insurance float but that can meaningfully impact operational leverage metrics.
The following table illustrates our consolidated insurance float position and four operational leverage ratios based on insurance float and net invested assets as of December 31, 2010 and 2009.
| |
December 31, | |||||||
|---|---|---|---|---|---|---|---|---|
| |
2010 | 2009 | ||||||
| |
($ in millions) |
|||||||
Total investments |
$ | 3,266.0 | $ | 4,042.8 | ||||
Cash |
33.6 | 44.8 | ||||||
Accounts receivable on unsettled investment sales |
5.4 | 24.2 | ||||||
Accounts payable on unsettled investment purchases |
(14.1 | ) | (7.6 | ) | ||||
Net invested assets |
$ | 3,290.9 | $ | 4,104.2 | ||||
OneBeacon's common shareholders' equity |
$ | 1,229.0 | $ | 1,429.0 | ||||
Debt |
419.6 | 620.5 | ||||||
Total capital |
$ | 1,648.6 | $ | 2,049.5 | ||||
Insurance float |
$ | 1,642.3 | $ | 2,054.7 | ||||
Insurance float as a multiple of total capital |
1.0x | 1.0x | ||||||
Net invested assets as a multiple of total capital |
2.0x | 2.0x | ||||||
Insurance float as a multiple of OneBeacon's common shareholders' equity |
1.3x | 1.4x | ||||||
Net invested assets as a multiple of OneBeacon's common shareholders' equity |
2.7x | 2.9x | ||||||
During the year ended December 31, 2010, insurance float decreased by $412.4 million, primarily due to the Personal Lines Transaction, which reduced insurance float by approximately $390 million.
74
Financing
The following table summarizes our capital structure at December 31, 2010 and 2009:
| |
December 31, | |||||||
|---|---|---|---|---|---|---|---|---|
| |
2010 | 2009 | ||||||
| |
($ in millions) |
|||||||
Senior Notes, carrying value |
$ | 419.6 | $ | 606.5 | ||||
Other debt(1) |
— | 14.0 | ||||||
Total debt |
419.6 | 620.5 | ||||||
OneBeacon's common shareholders' equity |
1,229.0 | 1,429.0 | ||||||
Total capital |
$ | 1,648.6 | $ | 2,049.5 | ||||
Ratio of debt to total capital |
25.5 | % | 30.3 | % | ||||
- (1)
- See Note 6—"Debt" of the accompanying consolidated financial statements.
We believe that we have the flexibility and capacity to obtain funds externally as needed through debt or equity financing on both a short-term and long-term basis. However, we can provide no assurance that, if needed, we would be able to obtain additional debt or equity financing on satisfactory terms, if at all.
Senior Notes
On May 3, 2010, OBH commenced a cash tender offer for up to $200.0 million in aggregate principal amount of the 5.875% Senior Notes due 2013 of our subsidiary OBH at a price of $1,027.50 per $1,000 principal amount. The cash tender offer, which was not subject to the tender of any minimum principal amount of Senior Notes, expired on May 28, 2010. Holders of Senior Notes who tendered on or before May 14, 2010 received an early tender payment of $30 for every $1,000 principal amount of Senior Notes validly tendered. Payment for the Senior Notes included accrued and unpaid interest up to the settlement date. OBH accepted and retired $156.4 million aggregate principal amount, of which $155.2 million was tendered by the early tender deadline, for purchase for $165.4 million, which resulted in a $9.6 million loss.
During the year ended December 31, 2010, OBH repurchased and retired $29.7 million of outstanding Senior Notes for $30.8 million, which resulted in a $1.2 million loss. During the year ended December 31, 2010, OBIC purchased $1.1 million of outstanding Senior Notes for $1.1 million. During 2009, OBH repurchased and retired $10.6 million of outstanding Senior Notes for $8.1 million, which resulted in a $2.5 million gain. During the year ended December 31, 2009, OBIC purchased $58.3 million of outstanding Senior Notes for $55.0 million, which resulted in a $2.9 million gain. During the year ended December 31, 2008, OBH repurchased and retired $24.0 million of the outstanding Senior Notes for $22.3 million, which resulted in a $1.6 million gain.
White Mountains currently provides an irrevocable and unconditional guarantee as to the payment of principal and interest on the Senior Notes. In consideration of this Guarantee, we have agreed to pay a specified fee to White Mountains in the amount of 25 basis points per annum on the outstanding principal amount of the Senior Notes. We have further agreed that if White Mountains' voting interest in us ceases to represent more than 50% of all our voting securities, we will redeem, exchange or otherwise modify the Senior Notes in order to fully and permanently eliminate White Mountains' obligations under the Guarantee (the Guarantee Elimination). White Mountains has agreed to provide written notice to us when its voting interest in us has been reduced below 50%. We will have 180 days from the receipt of such notification to complete the Guarantee Elimination. If the Guarantee Elimination is not completed within the initial 180-day period, the Guarantee fee shall increase by 200
75
basis points. The Guarantee fee shall further increase by 100 basis points for each subsequent 90-day period thereafter, up to a maximum Guarantee fee of 425 basis points, until the Guarantee Elimination has been completed.
The Senior Notes were issued under an indenture which contains restrictive covenants that, among other things, limit the ability of White Mountains, OBH and their respective subsidiaries, which includes us, as a subsidiary of White Mountains, to create liens and enter into sale and leaseback transactions and substantially limit the ability of OBH and its respective subsidiaries, which includes us, to consolidate, merge or transfer their properties and assets. The indenture does not contain any financial ratios or specified levels of net worth or liquidity to which White Mountains or OBH must adhere. At December 31, 2010, White Mountains and OBH were in compliance with all of the covenants under the Senior Notes.
The indenture also contains a cross default provision which provides that if White Mountains as guarantor has a payment default in excess of $25 million under a credit agreement, mortgage or similar debt agreement, the default provisions under the indenture to the Senior Notes will be triggered. White Mountains has a revolving credit facility which provides for borrowing up to a maximum of $475 million and which contains restrictive financial covenants. As of December 31, 2010, the facility was undrawn. At December 31, 2010, White Mountains was in compliance with all of the covenants under the facility. See Note 16—"Related Party Disclosures" of the accompanying consolidated financial statements.
Other Debt of Operating Subsidiaries
In connection with the acquisition of ASIC on March 31, 2004, we issued the Atlantic Specialty Note. We were required to repay $2.0 million of principal on the Atlantic Specialty Note each year, commencing in January 2007. The Atlantic Specialty Note accrued interest at a rate of 5.2% except that the outstanding principal amount in excess of $15.0 million accrued interest at a rate of 3.6%. During the three months ended March 31, 2009, we repaid $2.0 million on the Atlantic Specialty Note. During the three months ended March 31, 2010, OneBeacon repaid $14.0 million on the Atlantic Specialty Note, representing the outstanding principal on the note.
Mortgage Note on Real Estate Owned
In connection with our December 2005 purchase of land and an office building in Canton, Massachusetts, we entered into a $40.8 million, 18-year mortgage note to fund renovations. As of December 31, 2008, we had fully drawn on the facility. Repayment on the mortgage note commenced in January 2009. During the three months ended March 31, 2009, we repaid $0.2 million of principal in accordance with the terms of the mortgage note. On May 7, 2009, we repaid $40.6 million, representing the outstanding principal on the mortgage note.
76
Contractual Obligations and Commitments
Below is a schedule of our material contractual obligations and commitments as of December 31, 2010:
| |
Due in One Year or Less |
Due in Two to Three Years |
Due in Four to Five Years |
Due After Five Years |
Total | ||||||||||||
|---|---|---|---|---|---|---|---|---|---|---|---|---|---|---|---|---|---|
| |
($ in millions) |
||||||||||||||||
Debt |
$ | — | $ | 419.9 | $ | — | $ | — | $ | 419.9 | |||||||
Loss and LAE reserves(1) |
763.8 | 868.0 | 451.4 | 1,388.8 | 3,472.0 | ||||||||||||
Interest on debt |
24.7 | 37.0 | — | — | 61.7 | ||||||||||||
Long-term incentive compensation |
32.5 | 32.4 | 4.9 | 8.0 | 77.8 | ||||||||||||
Pension and other benefit plan obligations(2) |
13.8 | 8.6 | 8.1 | 34.7 | 65.2 | ||||||||||||
Operating leases |
9.9 | 15.3 | 7.5 | 6.4 | 39.1 | ||||||||||||
Total contractual obligations |
$ | 840.3 | $ | 1,385.6 | $ | 471.9 | $ | 1,437.9 | $ | 4,135.7 | |||||||
- (1)
- Represents
expected future cash outflows resulting from loss and LAE payments. The amounts presented are gross of reinsurance recoverables on unpaid losses
of $2,069.7 million and include the discount on our workers compensation loss and LAE reserves of $119.4 million as of December 31, 2010. These balances add back the remaining
purchase accounting fair value adjustment of $176.5 million related to the OneBeacon Acquisition as it is a non-cash item.
- (2)
- Includes expected future cash outflows under our non-qualified, non-contributory, defined benefit pension plan and our 401(k) savings and employee stock ownership plan. Our pension plans were curtailed during the fourth quarter of 2002. As a result, new participants are no longer added and benefits for existing participants are not increased. Non-vested participants continue to vest during their employment. (See Note 8—"Retirement Plans" of the accompanying consolidated financial statements.)
Our loss and LAE reserves do not have contractual maturity dates. However, based on historical payment patterns, the preceding table includes an estimate of when management expects our loss and LAE reserves to be paid. The timing of claim payments is subject to significant uncertainty. We maintain a portfolio of marketable investments with varying maturities and a substantial amount of short-term investments to provide adequate cash flows for the payment of claims.
The balances included in the table above regarding our long-term incentive compensation plans include amounts payable for performance shares and units, as well as deferred compensation balances. Exact amounts to be paid cannot be predicted with certainty as the ultimate amounts of these liabilities are based on future performance. The estimated payments reflected in the table are based on current accrual factors (common share price and pay-out percentage) and assume that all outstanding balances were 100% vested as of December 31, 2010.
There are no provisions within our lease agreements that would trigger acceleration of future lease payments. As of December 31, 2010, we have accrued $4.0 million net of anticipated sub-lease income for leased space which we have ceased using. We do not finance our operations through the securitization of trade receivables, special purpose entities or synthetic leases. Further, we have not entered into any material arrangement requiring us to guarantee payment of third-party debt, lease payments or to fund losses of an unconsolidated special purpose entity.
We also have future binding commitments to fund certain limited partnership investments. These commitments, which total $19.2 million as of December 31, 2010, do not have fixed funding dates and are therefore excluded from the table above. Our future binding commitments to fund an investment in
77
a tax advantaged federal affordable housing development fund are $8.2 million, $6.8 million and $2.1 million for 2011, 2012 and 2013, respectively.
Share Repurchase Program
On August 22, 2007, our Board authorized us to repurchase up to $200.0 million of OneBeacon's Class A common shares from time to time, subject to market conditions. Shares may be repurchased on the open market or through privately negotiated transactions. This program does not have a stated expiration date. During the year ended December 31, 2010, 0.7 million Class A common shares under this program were repurchased for $10.5 million and retired. During the year ended December 31, 2009, no shares were repurchased. During the year ended December 31, 2008, 3.4 million Class A common shares under this program were repurchased for $68.8 million and retired.
The following table includes information regarding repurchases by us of our Class A common shares during the periods indicated. All repurchased shares were retired.
| |
Total Number of Shares Repurchased |
Average Price Paid per Share |
Total Number of Shares Purchased as Part of Publicly Announced Plan |
Approximate Dollar Value of Shares That May Yet Be Purchased Under the Plan |
|||||||||
|---|---|---|---|---|---|---|---|---|---|---|---|---|---|
May 1 - 31, 2010 |
150,062 | $ | 14.48 | 150,062 | $ | 96.0 | |||||||
June 1 - 30, 2010 |
258,881 | $ | 14.39 | 258,881 | $ | 92.3 | |||||||
July 1 - 31, 2010 |
94,941 | $ | 14.30 | 94,941 | $ | 90.9 | |||||||
August 1 - 31, 2010 |
222,845 | $ | 14.44 | 222,845 | $ | 87.7 | |||||||
Total |
726,729 | $ | 14.42 | 726,729 | $ | 87.7 | |||||||
Cash Flows
Detailed information concerning our cash flows during the years ended December 31, 2010, 2009 and 2008 follows:
Cash flows from operations for the years ended December 31, 2010, 2009 and 2008
Net cash flows from operations were $22.4 million, $165.4 million and $43.5 million, respectively, for the years ended December 31, 2010, 2009 and 2008. Net cash flows from operations in the years ended December 31, 2010, 2009 and 2008 were adversely impacted by declining net investment income, primarily due to lower overall portfolio yields, shifts in portfolio mix to lower risk, lower yield investments and a decrease in the overall invested asset base. In addition, the decline in cash flows from operations for the year ended December 31, 2010 reflects the impact of the Commercial Lines Transaction and Personal Lines Transaction.
Cash flows from investing and financing activities for the year ended December 31, 2010
Financing and Other Capital Activities
During 2010, we declared and paid $79.5 million of regular quarterly cash dividends and $236.1 million of a special dividend to holders of OneBeacon's common shares.
During 2010, we repurchased and retired 0.7 million of our Class A common shares for $10.5 million through our share repurchase program.
During 2010, we paid $30.5 million of interest on our debt obligations, including $30.2 million of interest on the Senior Notes.
During 2010, OBIC purchased a portion of the Senior Notes for $1.1 million.
78
During 2010, OBH repurchased and retired a portion of the Senior Notes for $30.8 million.
During the second quarter of 2010, OBH repurchased and retired a portion of the Senior Notes for $165.4 million in a cash tender offer.
During the first quarter of 2010, we repaid the $14.0 million outstanding balance on the note issued in connection with the acquisition of ASIC.
Acquisitions and Dispositions
During the third quarter of 2010, we completed the Personal Lines Transaction and received $166.6 million as consideration.
During 2010, we received $10.2 million of additional consideration related to the Commercial Lines Transaction.
Other Liquidity and Capital Resource Activities
During 2010, we reported net decreases in our loss and LAE reserves and reinsurance recoverables on paid and unpaid losses, primarily due to the decline of our business exposures related to the businesses we have exited.
During the third and fourth quarters of 2010, we made payments in cash with respect to our long-term incentive compensation plans totaling $6.8 million. These payments were made primarily with respect to 207,250 performance shares and 38,850 performance units for various performance cycles. As a result of the Commercial Lines Transaction and the Personal Lines Transaction, payments were made to certain former employees of OneBeacon prior to the end of the performance cycle on a pro rata basis.
During the first quarter of 2010, we made payments with respect to our long-term incentive compensation plans totaling $21.4 million, in cash or by deferral into certain of our non-qualified compensation plans. These payments were made primarily with respect to 682,344 performance shares for the 2007-2009 performance cycle.
Cash flows from investing and financing activities for the year ended December 31, 2009
Financing and Other Capital Activities
During 2009, we declared and paid $79.9 million of regular quarterly cash dividends to holders of OneBeacon's common shares.
During 2009, we paid $38.9 million of interest on our debt obligations, including $37.4 million of interest on the Senior Notes, and repaid $2.2 million of principal on our debt obligations.
During 2009, OBIC purchased a portion of the Senior Notes for $55.0 million.
During the first quarter of 2009, OBH repurchased and retired a portion of the Senior Notes for $8.1 million.
During the second quarter of 2009, we repaid the $40.6 million outstanding balance on our mortgage note.
Acquisitions and Dispositions
During the fourth quarter of 2009, we sold the renewal rights to our non-specialty commercial lines business for $23.2 million to a third party.
79
Other Liquidity and Capital Resource Activities
During 2009, we reported net decreases in our loss and LAE reserves and reinsurance recoverables on paid and unpaid losses, primarily due to the decline of our business exposures related to legacy run-off.
During the first quarter of 2009, we made payments with respect to our long-term incentive compensation plans totaling $27.3 million, in cash or by deferral into certain of our non-qualified compensation plans. These payments were made primarily with respect to 137,400 performance shares and 148,422 performance units for various performance cycles.
Cash flows from investing and financing activities for the year ended December 31, 2008
Financing and Other Capital Activities
During 2008, we declared and paid $80.2 million of regular quarterly cash dividends and $195.3 million of a special dividend to holders of OneBeacon's common shares.
During 2008, we repurchased and retired 3.4 million of our Class A common shares for $68.8 million through our share repurchase program.
During 2008, we declared and paid $11.8 million of cash dividends to holders of the Berkshire Preferred Stock.
During 2008, we paid $43.7 million of interest on our debt obligations, including $40.4 million of interest on the Senior Notes, and repaid $2.0 million of principal on our debt obligations.
During 2008, OBH repurchased and retired a portion of the Senior Notes for $22.3 million.
During the second quarter of 2008, we redeemed the Berkshire Preferred Stock for $300.0 million, its redemption value, using funds that had been held in trust.
Acquisitions and Dispositions
During the fourth quarter of 2008, we sold one of our inactive licensed subsidiaries, FMIC, for $7.8 million in cash, to a third party.
During the third quarter of 2008, we acquired EBI for $8.0 million in cash to a third party.
During the first quarter of 2008, we sold one of our inactive licensed subsidiaries, MWIC, for $4.2 million in cash to a third party.
Other Liquidity and Capital Resource Activities
During 2008, we reported net decreases in our loss and LAE reserves and reinsurance recoverables on paid and unpaid losses, primarily due to the decline of our business exposures related to legacy run-off.
During the first quarter of 2008, we made payments with respect to our long-term incentive compensation plans totaling $47.2 million, in cash or by deferral into certain of our non-qualified compensation plans. These payments were made primarily with respect to 117,363 performance shares and 178,006 performance units for various performance cycles.
Related Party Disclosures
See Note 16—"Related Party Disclosures" of the accompanying consolidated financial statements.
80
Management's Discussion and Analysis of Financial Condition and Results of Operations discusses our consolidated financial statements, which have been prepared in accordance with GAAP. The consolidated financial statements presented herein include all adjustments considered necessary by management to fairly present our financial position, results of operations and cash flows.
The preparation of financial statements in conformity with GAAP requires management to make estimates and assumptions that affect the reported amounts of assets and liabilities as of the date of the historical consolidated financial statements and the reported amounts of revenues and expenses during the reporting period.
On an ongoing basis, management evaluates its estimates, including those related to fair value measurements of investments, loss and LAE reserves, reinsurance transactions and purchase accounting. Management bases its estimates on historical experience and on various other factors that are believed to be reasonable under the circumstances, the results of which form the basis for making judgments about the carrying values of assets and liabilities that are not readily apparent from other sources.
Management believes that certain of these estimates are considered critical in that they involve a higher degree of judgment and are subject to a significant degree of variability. The descriptions below summarize the more significant estimates used in the preparation of our historical consolidated financial statements.
1. Fair Value Considerations
On January 1, 2008, we adopted the fair value option, subsequently codified as ASC 820 which provides a revised definition of fair value, establishes a framework for measuring fair value and expands financial statement disclosure requirements for fair value information. Under ASC 820, fair value is defined as the price that would be received to sell an asset or paid to transfer a liability in an orderly transaction between market participants (an exit price). ASC 820 establishes a fair value hierarchy that distinguishes between inputs based on market data from independent sources (observable inputs) and a reporting entity's internal assumptions based upon the best information available when external market data is limited or unavailable (unobservable inputs). The fair value hierarchy in ASC 820 prioritizes fair value measurements into three levels based on the nature of the inputs. Quoted prices in active markets for identical assets or liabilities have the highest priority (Level 1), followed by observable inputs other than quoted prices, including prices for similar but not identical assets or liabilities (Level 2) and unobservable inputs, including the reporting entity's estimates of the assumptions that market participants would use, having the lowest priority (Level 3).
Effective January 1, 2008, we adopted ASC 825 for our available-for-sale securities and our investments in hedge funds and private equity funds. Consistent with the guidance in ASC 825, in conjunction with the adoption, these securities are now reported as trading securities. Upon adoption, we recorded an adjustment of $180.6 million to reclassify net unrealized gains, after tax, and net unrealized foreign currency translation gains, after tax, related to investments from accumulated other comprehensive income to opening retained earnings. Subsequent to adoption, we report changes in fair value in revenues before the effect of tax.
We use brokers and outside pricing services to assist in determining fair values. For investments in active markets, we use the quoted market prices provided by the outside pricing services to determine fair value. The outside pricing services we use have indicated that they will only provide prices where observable inputs are available. In circumstances where quoted market prices are unavailable, we utilize fair value estimates based upon other observable inputs including matrix pricing, benchmark interest rates, market comparables and other relevant inputs. In circumstances where observable inputs are
81
adjusted to reflect management's best estimate of fair value, such fair value measurements are considered a lower level measurement in the fair value hierarchy.
Our process to validate the market prices obtained from the outside pricing sources includes, but is not limited to, periodic evaluation of model pricing methodologies and analytical reviews of certain prices. We also periodically perform back-testing of selected purchases and sales activity to determine whether there are any significant differences between the market price used to value the security prior to the purchase or sale and the actual purchase or sale price.
Other investments, which are comprised primarily of hedge funds and private equity funds for which the fair value option has been elected, are carried at fair value based upon our proportionate interest in the underlying fund's net asset value, which is deemed to approximate fair value. The fair value of our investments in hedge funds and private equity funds has been estimated using net asset value because it reflects the fair value of the funds' underlying investments in accordance with ASC 820. We employ a number of procedures to assess the reasonableness of the fair value measurements, including obtaining and reviewing each fund's audited financial statements and discussing each fund's pricing with the fund's manager. However, since the fund managers do not provide sufficient information to independently evaluate the pricing inputs and methods for each underlying investment, the inputs are considered to be unobservable. Accordingly, the fair values of our investment in hedge funds and private equity funds have been classified as Level 3 under the fair value hierarchy.
In circumstances where the underlying investments are publicly traded, such as the investments made by hedge funds, the fair value of the underlying investments is determined using current market prices. In circumstances where the underlying investments are not publicly traded, such as the investments made by private equity funds, the private equity fund managers have considered the need for a liquidity discount on each of the underlying investments when determining the fund's net asset value in accordance with ASC 820. In circumstances where our portion of a fund's net asset value is deemed to differ from fair value due to illiquidity or other factors associated with our investment in the fund, including counterparty credit risk, the net asset value is adjusted accordingly. At December 31, 2010 and 2009, we did not record an adjustment to the net asset value related to our investments in hedge funds or private equity funds.
As of December 31, 2010 and 2009, other investments represented approximately 5% and 4%, respectively, of the investment portfolio recorded at fair value. Other investments accounted for at fair value as of December 31, 2010 and 2009 were comprised of $63.4 million and $74.2 million, respectively, in hedge funds, $72.7 million and $58.0 million, respectively, in private equity funds and $14.1 million for both periods of an investment in a community reinvestment vehicle. At December 31, 2010 and 2009, we held investments in 10 and 15 hedge funds, respectively, and 15 and 16 private equity funds, respectively. The largest investment in a single fund was $24.6 million and $10.8 million at December 31, 2010 and 2009, respectively.
As of December 31, 2010, other investments also included $21.2 million of an investment in a tax advantaged federal affordable housing development fund which is accounted for using the equity method.
As of December 31, 2010 and 2009, approximately 91% and 93%, respectively, of the investment portfolio recorded at fair value was priced based upon observable inputs. Investments valued using Level 1 inputs include fixed maturities, primarily investments in U.S. Treasuries, common equities and short-term investments, which include U.S. Treasury Bills. Investments valued using Level 2 inputs comprise fixed maturities including corporate debt, state and other governmental debt, convertible fixed maturity securities and mortgage and asset-backed securities. Fair value estimates for investments that trade infrequently and have few or no observable market prices are classified as Level 3 measurements. Level 3 fair value estimates based upon unobservable inputs include OneBeacon's investments in hedge
82
funds and private equity funds, as well as investments in debt and equity securities, including certain asset-backed securities, where quoted market prices are unavailable.
The fair value measurements at December 31, 2010 and 2009 for assets recorded in accordance with ASC 825 and any related Level 3 inputs are as follows:
| |
Fair value at December 31, 2010 |
Level 3 Inputs |
Level 3 Percentage |
|||||||||
|---|---|---|---|---|---|---|---|---|---|---|---|---|
| |
($ in millions) |
|
||||||||||
Fixed maturity investments: |
||||||||||||
U.S. Government and agency obligations |
$ | 250.8 | $ | — | — | % | ||||||
Debt securities issued by corporations |
948.6 | — | — | |||||||||
Municipal obligations |
2.1 | — | — | |||||||||
Asset-backed securities |
1,117.4 | 27.7 | 2.5 | |||||||||
Foreign government obligations |
13.2 | — | — | |||||||||
Preferred stocks |
83.4 | 71.4 | 85.6 | |||||||||
Fixed maturity investments |
2,415.5 | 99.1 | 4.1 | |||||||||
Short-term investments |
300.0 | — | — | |||||||||
Common equity securities |
285.3 | 39.7 | 13.9 | |||||||||
Convertible bonds |
93.8 | — | — | |||||||||
Other investments(1) |
150.2 | 150.2 | 100.0 | |||||||||
Total |
$ | 3,244.8 | $ | 289.0 | 8.9 | % | ||||||
- (1)
- Excludes the carrying value of $21.2 million associated with a tax advantaged federal affordable housing development fund accounted for using the equity method.
| |
Fair value at December 31, 2009 |
Level 3 Inputs |
Level 3 Percentage |
|||||||||
|---|---|---|---|---|---|---|---|---|---|---|---|---|
| |
($ in millions) |
|
||||||||||
Fixed maturity investments: |
||||||||||||
U.S. Government and agency obligations |
$ | 531.6 | $ | — | — | % | ||||||
Debt securities issued by corporations |
1,347.0 | 0.2 | — | |||||||||
Municipal obligations |
2.6 | — | — | |||||||||
Asset-backed securities |
1,014.9 | 15.7 | 1.5 | |||||||||
Foreign government obligations |
26.7 | — | — | |||||||||
Preferred stocks |
71.5 | 70.0 | 97.9 | |||||||||
Fixed maturity investments |
2,994.3 | 85.9 | 2.9 | |||||||||
Short-term investments |
544.4 | — | — | |||||||||
Common equity securities |
187.6 | 33.8 | 18.1 | |||||||||
Convertible bonds |
170.2 | — | — | |||||||||
Other investments |
146.3 | 146.3 | 100.0 | |||||||||
Total |
$ | 4,042.8 | $ | 266.0 | 6.6 | % | ||||||
At December 31, 2010 and 2009, we held one private preferred stock that represented approximately 86% and 98%, respectively, of our preferred stock portfolio. We used quoted market prices for similar securities that were adjusted to reflect management's best estimate of fair value; this security is classified as a Level 3 measurement.
In addition to the investment portfolio described above, we had $41.3 million and $27.2 million, respectively, of liabilities recorded at fair value and included in other liabilities as of December 31, 2010 and 2009. These liabilities relate to securities that have been sold short by a limited partnership that we invest in and are required to consolidate in accordance with GAAP. All of the liabilities included in the $41.3 million and $27.2 million, respectively, have been deemed to have a Level 1 designation as of December 31, 2010 and 2009.
83
The changes in Level 3 fair value measurements for the year ended December 31, 2010 are as follows:
| |
Fixed maturity investments |
Common equity securities |
Convertible bonds |
Other investments |
Total | |||||||||||
|---|---|---|---|---|---|---|---|---|---|---|---|---|---|---|---|---|
| |
($ in millions) |
|||||||||||||||
Balance at January 1, 2010 |
$ | 85.9 | $ | 33.8 | $ | — | $ | 146.3 | $ | 266.0 | ||||||
Amortization/accretion |
(1.4 | ) | — | — | — | (1.4 | ) | |||||||||
Total net realized and unrealized gains (losses) |
3.3 | 6.1 | — | 9.3 | 18.7 | |||||||||||
Purchases |
44.8 | 0.2 | — | 28.1 | 73.1 | |||||||||||
Sales |
(1.7 | ) | (0.4 | ) | — | (33.5 | ) | (35.6 | ) | |||||||
Transfers in |
— | — | — | — | — | |||||||||||
Transfers out |
(31.8 | ) | — | — | — | (31.8 | ) | |||||||||
Balance at December 31, 2010 |
$ | 99.1 | $ | 39.7 | $ | — | $ | 150.2 | $ | 289.0 | ||||||
"Transfers out" of Level 3 and included in "transfers in" of Level 2 fixed maturity investments of $31.8 million for the year ended December 31, 2010 were comprised of securities which had been previously classified as a Level 3 measurement and were recategorized as a Level 2 measurement when quoted market prices for similar securities that were considered reliable and could be validated against an alternative source became available.
2. Loss and LAE
Reserves other than Asbestos and Environmental Reserves
We establish loss and LAE reserves that are estimates of amounts needed to pay claims and related expenses in the future for insured events that have already occurred. The process of estimating reserves involves a considerable degree of judgment by management and, as of any given date, is inherently uncertain.
Loss and LAE reserves are typically comprised of (1) case reserves for claims reported and (2) reserves for losses that have occurred but for which claims have not yet been reported, referred to as IBNR reserves, which include a provision for expected future development on case reserves. Case reserves are estimated based on the experience and knowledge of claims staff regarding the nature and potential cost of each claim and are adjusted as additional information becomes known or payments are made. IBNR reserves are derived by subtracting paid loss and LAE and case reserves from estimates of ultimate loss and LAE. Actuaries estimate ultimate loss and LAE using various generally accepted actuarial methods applied to known losses and other relevant information. Like case reserves, IBNR reserves are adjusted as additional information becomes known or payments are made.
Ultimate loss and LAE are generally determined by extrapolation of claim emergence and settlement patterns observed in the past that can reasonably be expected to persist into the future. In forecasting ultimate loss and LAE with respect to any line of business, past experience with respect to that line of business is the primary resource, but cannot be relied upon in isolation. Our own experience, particularly claims development experience, such as trends in case reserves, payments on and closings of claims, as well as changes in business mix and coverage limits, is the most important information for estimating our reserves. External data, available from organizations such as statistical bureaus, consulting firms and reinsurance companies, is sometimes used to supplement or corroborate our own experience, and can be especially useful for estimating costs of new business. For some lines of business, such as "long-tail" coverages discussed below, claims data reported in the most recent accident year is often too limited to provide a meaningful basis for analysis due to the typical delay in reporting of claims. For this type of business, we use a selected loss ratio method for the initial
84
accident year or years. This is a standard and accepted actuarial reserve estimation method in these circumstances in which the loss ratio is selected based upon information used in pricing policies for that line of business, as well as any publicly available industry data, such as industry pricing, experience and trends, for that line of business.
Uncertainties in estimating ultimate loss and LAE are magnified by the time lag between when a claim actually occurs and when it is reported and settled. This time lag is sometimes referred to as the "claim-tail". The claim-tail for most property coverages is typically short (usually a few days up to a few months). The claim-tail for liability/casualty coverages, such as automobile liability, general liability, products liability, multiple peril coverage, and workers compensation, can be especially long as claims are often reported and ultimately paid or settled years, even decades, after the related loss events occur. During the long claims reporting and settlement period, additional facts regarding coverages written in prior accident years, as well as about actual claims and trends may become known and, as a result, we may adjust our reserves. If management determines that an adjustment is appropriate, the adjustment is booked in the accounting period in which such determination is made in accordance with GAAP. Accordingly, should reserves need to be increased or decreased in the future from amounts currently established, future results of operations would be negatively or positively impacted, respectively.
In determining ultimate loss and LAE, the cost to indemnify claimants, provide needed legal defense and other services for insureds and administer the investigation and adjustment of claims are considered. These claim costs are influenced by many factors that change over time, such as expanded coverage definitions as a result of new court decisions, inflation in costs to repair or replace damaged property, inflation in the cost of medical services and legislated changes in statutory benefits, as well as by the particular, unique facts that pertain to each claim. As a result, the rate at which claims arose in the past and the costs to settle them may not always be representative of what will occur in the future. The factors influencing changes in claim costs are often difficult to isolate or quantify and developments in paid and incurred losses from historical trends are frequently subject to multiple and conflicting interpretations. Changes in coverage terms or claims handling practices may also cause future experience and/or development patterns to vary from the past. A key objective of actuaries in developing estimates of ultimate loss and LAE, and resulting IBNR reserves, is to identify aberrations and systemic changes occurring within historical experience and accurately adjust for them so that the future can be projected reliably. Because of the factors previously discussed, this process requires the use of informed judgment and is inherently uncertain.
Our actuaries use several generally accepted actuarial methods to evaluate our loss and LAE reserves, each of which has its own strengths and weaknesses. We place more or less reliance on a particular method based on the facts and circumstances at the time the reserve estimates are made. These methods generally fall into one of the following categories or are hybrids of one or more of the following categories:
- •
- Historical paid loss development methods: These methods use historical loss payments over discrete periods of time to estimate future losses. Historical paid loss development methods assume that the ratio of losses paid in one period to losses paid in an earlier period will remain constant. These methods necessarily assume that factors that have affected paid losses in the past, such as inflation or the effects of litigation, will remain constant in the future. Because historical paid loss development methods do not use case reserves to estimate ultimate losses, they can be more reliable than the other methods discussed below that look to case reserves (such as actuarial methods that use incurred losses) in situations where there are significant changes in how case reserves are established by a company's claims adjusters. However, historical paid loss development methods are more leveraged, meaning that small changes in payments have a larger impact on estimates of ultimate losses, than actuarial methods that use incurred losses because cumulative loss payments take much longer to equal the expected
85
- •
- Historical incurred loss development methods: These
methods, like historical paid loss development methods, assume that the ratio of losses in one period to losses in an earlier period will remain constant in the future. However, instead of using paid
losses, these methods use incurred losses (i.e., the sum of cumulative historical loss payments plus outstanding case reserves) over discrete periods of time to estimate future losses.
Historical incurred loss development methods can be preferable to historical paid loss development methods because they explicitly take into account open cases and the claims adjusters' evaluations of
the cost to settle all known claims. However, historical incurred loss development methods necessarily assume that case reserving practices are consistently applied over time. Therefore, when there
have been significant changes in how case reserves are established, using incurred loss data to project ultimate losses can be less reliable than other methods.
- •
- Expected loss ratio methods: These methods are based on
the assumption that ultimate losses vary proportionately with premiums. Expected loss ratios are typically developed based upon the information used in pricing, and are multiplied by the total amount
of premiums written to calculate ultimate losses. Expected loss ratio methods are useful for estimating ultimate losses in the early years of long-tailed lines of business, when little or
no paid or incurred loss information is available.
- •
- Adjusted historical paid and incurred loss development methods: These methods take traditional historical paid and incurred loss development methods and adjust them for the estimated impact of changes from the past in factors such as inflation, the speed of claim payments or the adequacy of case reserves. Adjusted historical paid and incurred loss development methods are often more reliable methods of predicting ultimate losses in periods of significant change, provided the actuaries can develop methods to reasonably quantify the impact of changes.
ultimate losses than cumulative incurred amounts. In addition, and for similar reasons, historical paid loss development methods are often slow to react to situations when new or different factors arise than those that have affected paid losses in the past.
We perform an actuarial review of our recorded reserves each quarter. Our actuaries compare the previous quarter's estimates of paid loss and LAE, case reserves and IBNR to amounts indicated by actual experience. Differences between previous estimates and actual experience are evaluated to determine whether a given actuarial method for estimating loss and LAE should be relied upon to a greater or lesser extent than it had been in the past. While some variance is expected each quarter due to the inherent uncertainty in loss and LAE, persistent or large variances would indicate that prior assumptions and/or reliance on certain reserving methods may need to be revised going forward.
In its selection of recorded reserves, our management historically gave greater weight to adjusted paid loss development methods, which are not dependent on the consistency of case reserving practices, over methods that rely on incurred losses. In recent years, the amount of weight given to methods based on incurred losses has increased with management's confidence that our case reserving practices have been more consistently applied.
Upon completion of each quarterly review, our actuaries select indicated reserve levels based on the results of the actuarial methods described previously, which are the primary consideration in determining management's best estimate of required reserves. However, in making its best estimate, management also considers other qualitative factors that may lead to a difference between held reserves and actuarially recommended levels in the future. Typically, these factors exist when management and our actuaries conclude that there is insufficient historical incurred and paid loss information or that trends included in the historical incurred and paid loss information are unlikely to repeat in the future. Such factors include, among others, recent entry into new markets or new products, improvements in the claims department that are expected to lessen future ultimate loss costs
86
and legal and regulatory developments. At December 31, 2010 and 2009, total carried reserves were 11.7% and 10.2% above the actuarial point estimate, respectively.
Asbestos and Environmental Reserves
Our reserves include provisions made for claims that assert damages from A&E related exposures. Asbestos claims relate primarily to injuries asserted by those who allegedly came in contact with asbestos or products containing asbestos. Environmental claims relate primarily to pollution and related clean-up cost obligations, particularly as mandated by Federal and state environmental protection agencies. In addition to the factors described above under "Reserves other than Asbestos and Environmental Reserves" regarding the reserving process, we estimate our A&E reserves based upon, among other factors, facts surrounding reported cases and exposures to claims, such as policy limits and deductibles, current law, past and projected claim activity and past settlement values for similar claims, as well as analysis of industry studies and events, such as recent settlements and asbestos-related bankruptcies. The cost of administering A&E claims, which is an important factor in estimating loss and LAE reserves, tends to be higher than in the case of non-A&E claims due to the higher legal costs typically associated with A&E claims.
A large portion of our A&E losses resulted from the operations of the Employers Group, an entity acquired by one of the legacy companies in 1971. These operations, including business of Employers Surplus Lines Insurance Company and Employers Liability Assurance Corporation, provided primary and excess liability insurance for commercial insureds, including Fortune 500-sized accounts, some of whom subsequently experienced claims for A&E losses. We stopped writing such coverage in 1984.
Our liabilities for A&E losses from business underwritten in the recent past are substantially limited by the application of exclusionary clauses in the policy language that eliminated coverage for such claims. After 1987 for pollution and 1992 for asbestos, most liability policies contained industry-standard absolute exclusions of such claims. In earlier years, various exclusions were also applied, but the wording of those exclusions was less strict and subsequent court rulings have reduced their effectiveness.
We also incurred A&E losses via our participation in industry pools and associations. The most significant of these pools was Excess Casualty Reinsurance Association, or ECRA, which provided excess liability reinsurance to U.S. insurers from 1950 until the early 1980s. ECRA incurred significant liabilities for A&E, of which we bear approximately a 4.7% share at both December 31, 2010 and 2009, or $31.8 million and $35.8 million at December 31, 2010 and 2009, respectively, which is fully reflected in our loss and LAE reserves.
More recently, since the 1990s, we have experienced an influx of claims from commercial insureds, including many non-Fortune 500-sized accounts written during the 1970s and 1980s, who are named as defendants in asbestos lawsuits. As a number of large well-known manufacturers of asbestos and asbestos-containing products have gone into bankruptcy, plaintiffs have sought recoveries from peripheral defendants, such as installers, transporters or sellers of such products, or from owners of premises on which the plaintiffs' exposure to asbestos allegedly occurred. At December 31, 2010, 478 policyholders had asbestos-related claims against us. In 2010, 103 new insureds with such peripheral involvement presented asbestos claims under prior policies we had written.
Historically, most asbestos claims have been asserted as product liability claims. Recently, insureds who have exhausted the available products liability limits of their insurance policies have sought from insurers such as us payment for asbestos claims under the premises and operations coverage of their liability policies, which may not be subject to similar aggregate limits. We expect this trend to continue. However, to date there have been fewer of these premises and operations coverage claims than product liability coverage claims. This may be due to a variety of factors, including that it may be more difficult for underlying plaintiffs to establish losses as stemming from premises and operations exposures, which
87
requires proof of the defendant's negligence, rather than products liability under which strict legal liability applies. Premises and operations claims may vary significantly and policyholders may seek large amounts, although such claims frequently settle for a fraction of the initial alleged amount. Accordingly, there is a great deal of variation in damages awarded for the actual injuries. As of December 31, 2010, there were approximately 265 active claims by insureds against us without product liability coverage asserting operations or premises coverage, which may not be subject to aggregate limits under the policies.
Immediately preceding the OneBeacon Acquisition, we purchased a reinsurance contract with NICO under which we are entitled to recover from NICO up to $2.5 billion in the future for asbestos claims arising from business written by us in 1992 and prior, environmental claims arising from business written by us in 1987 and prior, and certain other exposures. Under the terms of the NICO Cover, NICO receives the economic benefit of reinsurance recoverables from certain of our third-party reinsurers in existence at the time the NICO Cover was executed, or Third-Party Recoverables. As a result, the Third-Party Recoverables serve to protect the $2.5 billion limit of NICO coverage for the benefit of us. Any amounts uncollectible from third-party reinsurers due to dispute or the reinsurers' financial inability to pay are covered by NICO under its agreement with us. Third-Party Recoverables are typically for the amount of loss in excess of a stated level each year. Of claim payments from 2000 through 2010, approximately 44% of A&E losses have been recovered under the historical third-party reinsurance.
In September 2008, we completed a study of our A&E exposures. This study considered, among other items, (1) facts, such as policy limits, deductibles and available third-party reinsurance, related to reported claims; (2) current law; (3) past and projected claim activity and past settlement values for similar claims; (4) industry studies and events, such as recent settlements and asbestos-related bankruptcies; and (5) collectibility of third-party reinsurance. Based on the study, we increased our best estimate of our incurred losses ceded to NICO, net of underlying reinsurance, by $83.4 million to $2.2 billion, which is within the $2.5 billion coverage provided by the NICO Cover. The increase in the estimate of incurred A&E losses was principally driven by raised projections for claims related to asbestos. Based on the results of the study, we believe that, under all reasonable scenarios, ultimate incurred losses will not exceed the NICO Cover. Due to the NICO Cover, there was no impact to income or equity from the change in estimate.
As part of our previously described actuarial review process, we review A&E activity each quarter and compare that activity to what was assumed in the most recently completed study. As of December 31, 2010, we noted no change in the range of reasonable outcomes around our best estimate described above.
As noted above, we have ceded estimated incurred losses of approximately $2.2 billion to the NICO Cover at December 31, 2010. Since entering into the NICO Cover, approximately 5% of the $2.2 billion of utilized coverage relates to uncollectible Third-Party Recoverables and settlements on Third-Party Recoverables through December 31, 2010. Net losses paid totaled $1.4 billion as of December 31, 2010, with $182.1 million paid in 2010. Asbestos payments during 2010 reflect payments resulting from intensified efforts by claimants to resolve asbestos claims prior to the potential enactment of U.S. federal asbestos legislation. To the extent that actual experience differs from our estimate of incurred A&E losses and Third-Party Recoverables, future losses could exceed the $320.2 million of protection remaining under the NICO Cover.
Our reserves for A&E losses, net of Third-Party Recoverables but prior to NICO recoveries, were $0.7 billion at December 31, 2010. An industry benchmark of reserve adequacy is the "survival ratio", computed as a company's reserves divided by its historical average yearly loss payments. This ratio indicates approximately how many more years of payments the reserves can support, assuming future yearly payments are equal to historical levels. Our survival ratio was 10.7 at December 31, 2010. This
88
was computed as the ratio of A&E reserves, net of Third-Party Recoverables prior to the NICO Cover of $0.7 billion plus the remaining unused portion of the NICO Cover of $320.2 million, to the average A&E loss payments over the three-year period ended December 31, 2010, net of Third-Party Recoverables. Our survival ratio was 11.6 at December 31, 2009. We believe that as a result of the NICO Cover and our historical third-party reinsurance programs, we should not experience material financial loss from A&E exposures under current coverage interpretations and that our survival ratio compares favorably to industry survival ratios. However, the survival ratio is a simplistic measure estimating the number of years it would be before the current ending loss reserves for these claims would be paid using recent annual average payments. Many factors, such as aggressive settlement procedures, mix of business and coverage provided, have a significant effect on the amount of A&E reserves and payments and the resultant survival ratio. Thus, caution should be exercised in attempting to determine reserve adequacy for these claims based simply on this survival ratio.
Our reserves for A&E losses at December 31, 2010 represent management's best estimate of its ultimate liability based on information currently available. However, significant uncertainties, including but not limited to case law developments, medical and clean-up cost increases and industry settlement practices, limit our ability to accurately estimate ultimate liability and we may be subject to A&E losses beyond currently estimated amounts. In addition, we remain liable for risks reinsured in the event that a reinsurer does not honor its obligations under reinsurance contracts. See Note 3—"Reserves for Unpaid Loss and LAE—Asbestos and environmental loss and LAE reserve activity" of the accompanying consolidated financial statements for more information regarding our A&E reserves.
A&E Claims Activity
Our A&E claims activity, which is all in our Other Insurance Operations segment, is illustrated in the table below:
| |
Year ended December 31, |
|||||||
|---|---|---|---|---|---|---|---|---|
| |
2010 | 2009 | ||||||
Asbestos |
||||||||
Accounts with asbestos claims at the beginning of the year |
482 | 474 | ||||||
Accounts reporting asbestos claims during the year |
103 | 93 | ||||||
Accounts on which asbestos claims were closed during the year |
(107 | ) | (85 | ) | ||||
Accounts with asbestos claims at the end of the year |
478 | 482 | ||||||
Environmental |
||||||||
Accounts with environmental claims at the beginning of the year |
384 | 378 | ||||||
Accounts reporting environmental claims during the year |
106 | 131 | ||||||
Accounts on which environmental claims were closed during the year |
(137 | ) | (125 | ) | ||||
Accounts with environmental claims at the end of the year |
353 | 384 | ||||||
Total |
||||||||
Total accounts with A&E claims at the beginning of the year |
866 | 852 | ||||||
Accounts reporting A&E claims during the year |
209 | 224 | ||||||
Accounts on which A&E claims were closed during the year |
(244 | ) | (210 | ) | ||||
Total accounts with A&E claims at the end of the year |
831 | 866 | ||||||
Reserve Estimation by Line of Business
The process of establishing loss reserves is complex and imprecise as it must consider many variables that are subject to the outcome of future events. As a result, informed subjective estimates
89
and judgments as to our ultimate exposure to losses are an integral component of our loss reserving process. We, like other insurance companies, categorize and track our insurance reserves by "line of business", such as automobile liability, multiple peril liability and workers compensation. Furthermore, we regularly review the appropriateness of reserve levels at the line of business level, considering the variety of trends that impact the ultimate settlement of claims for the subsets of claims in each particular line of business.
For loss and allocated loss adjustment expense reserves, excluding A&E, the key assumption as of December 31, 2010 was that the impact of the various reserving factors, as described below, on future paid losses would be similar to the impact of those factors on the historical loss data with the following exceptions:
- •
- Severity trends have been relatively stable over the relevant historical period. The actuarial methods use would project
losses assuming continued stability in severity trends. Management has considered future increases in loss severity trends in making its reserve selections.
- •
- During 2010, we reassigned a significant amount of our claims to a run-off claims unit. While initial emerged losses have suggested better than expected outcomes, we have selected reserves more in line with our previous expectations.
The major causes of material uncertainty ("reserving factors") generally will vary for each product line, as well as for each separately analyzed component of the product line. The following section details reserving factors by product line. There could be other reserving factors that may impact ultimate claim costs. Each reserving factor presented will have a different impact on estimated reserves. Also, reserving factors can have offsetting or compounding effects on estimated reserves. For example, in workers compensation, the use of expensive medical procedures that result in medical cost inflation may enable workers to return to work faster, thereby lowering indemnity costs. Thus, in almost all cases, it is impossible to discretely measure the effect of a single reserving factor and construct a meaningful sensitivity expectation. Actual results will likely vary from expectations for each of these assumptions, resulting in an ultimate claim liability that is different from that being estimated currently.
Workers compensation
Workers compensation covers an employer's liability for injuries, disability or death of employees, without regard to fault, as prescribed by state workers compensation law and other statutes. Workers compensation is generally considered a long-tail coverage, as it takes a relatively long period of time to finalize claims from a given accident year. While certain payments such as initial medical treatment or temporary wage replacement for the injured worker are made quickly, some other payments are made over the course of several years, such as awards for permanent partial injuries. In addition, some payments can run as long as the injured worker's life, such as permanent disability benefits and ongoing medical care. Despite the possibility of long payment tails, the reporting lags are generally short, settlements are generally not complex, and most of the liability can be considered high frequency with moderate severity. The largest reserve risk generally comes from the low frequency, high severity claims providing lifetime coverage for medical expense arising from a worker's injury.
Examples of common reserving factors that can change and, thus, affect the estimated workers compensation reserves include:
General workers compensation reserving factors
- •
- Mortality trends of injured workers with lifetime benefits and medical treatment or dependents entitled to survivor
benefits
- •
- Degree of cost shifting between workers compensation and health insurance
90
- •
- Changes in claim handling philosophies (e.g., case reserving standards)
Indemnity reserving factors
- •
- Time required to recover from the injury
- •
- Degree of available transitional jobs
- •
- Degree of legal involvement
- •
- Changes in the interpretations and processes of various workers compensation bureaus' oversight of claims
- •
- Future wage inflation for states that index benefits
- •
- Changes in the administrative policies of second injury funds
- •
- Re-marriage rate for spouse in instances of death
Medical reserving factors
- •
- Changes in the cost of medical treatments, including prescription drugs, and underlying fee schedules
- •
- Frequency of visits to health providers
- •
- Number of medical procedures given during visits to health providers
- •
- Types of health providers used
- •
- Type of medical treatments received
- •
- Use of preferred provider networks and other medical cost containment practices
- •
- Availability of new medical processes and equipment
- •
- Changes in the use of pharmaceutical drugs
- •
- Degree of patient responsiveness to treatment
Workers compensation book of business reserving factors
- •
- Product mix
- •
- Injury type mix
- •
- Changes in underwriting standards
Personal automobile liability
Automobile covers both physical damage and liability coverage. Automobile physical damage insurance covers loss or damage to vehicles from collision, vandalism, fire, theft or other causes. Automobile liability insurance covers bodily injury of others, damage to their property and costs of legal defense resulting from a collision caused by the insured. The personal automobile product line is a mix of property and liability coverages and, therefore, includes both short-and long-tail coverages. The payments that are made quickly typically pertain to automobile physical damage (property) claims and property damage (liability) claims. The payments that take longer to finalize and are more difficult to estimate relate to bodily injury claims. Personal automobile reserves are typically analyzed in three components: bodily injury liability, property damage liability, and collision/comprehensive claims. This last component has minimum reserve risk and fast payouts and, accordingly, separate factors are not presented. Reporting lags are relatively short and the claim settlement process for personal automobile
91
liability generally is the least complex of the liability products. It is generally viewed as a high frequency, low to moderate severity product line.
Examples of common reserving factors that can change and, thus, affect the estimated personal automobile liability reserves include:
Personal automobile liability reserving factors
- •
- Trends in jury awards
- •
- Changes in the underlying court system and its philosophy
- •
- Changes in case law
- •
- Litigation trends
- •
- Frequency of claims with payment capped by policy limits
- •
- Change in average severity of accidents, or proportion of severe accidents
- •
- Subrogation opportunities
- •
- Degree of patient responsiveness to treatment
- •
- Changes in claim handling philosophies (e.g., case reserving standards)
Personal automobile liability book of business reserving factors
- •
- Changes in policy provisions (e.g., deductibles, policy limits, or endorsements)
- •
- Changes in underwriting standards
Multiple peril
Multiple peril represents a package policy sold to insureds or to members of trade associations or other groups that include general liability and property insurance. General liability covers businesses for any liability resulting from bodily injury and property damage arising from general business operations, accidents on a premises and the products manufactured or sold. Property covers losses to a business' premises, inventory and equipment as a result of weather, fire, theft and other causes. Because commercial multiple peril provides a combination of property and liability coverage typically for small businesses, it includes both short- and long-tail coverages. For property coverage, it generally takes a relatively short period of time to close claims, while for the other coverages, generally for the liability coverages, it takes a longer period of time to close claims. The reserving risk for this line is dominated by the liability coverage portion of this product, except occasionally in the event of catastrophic or large single losses.
Multiple peril liability reserves here are generally analyzed as two components: bodily injury and property damage. Bodily injury payments reimburse the claimant for damages pertaining to physical injury as a result of the policyholder's legal obligation arising from non-intentional acts such as negligence, subject to the insurance policy provisions. In some cases the damages can include future wage loss (which is a function of future earnings power and wage inflation) and future medical treatment costs. Property damage payments result from damages to the claimant's private property arising from the policyholder's legal obligation for non-intentional acts. In most cases, property damage losses are a function of costs as of the loss date, or soon thereafter. Defense costs are also a part of the insured costs covered by liability policies and can be significant, sometimes greater than the cost of the actual paid claims, though for some products this risk is mitigated by policy language such that the insured portion of defense costs erodes the amount of policy limit available to pay the claim.
92
Multiple peril liability is generally considered a long-tail line, as it takes a relatively long period of time to finalize and settle claims from a given accident year. The speed of claim reporting and claim settlement is a function of the specific coverage provided and the jurisdiction, among other factors. There are numerous components underlying the multiple peril liability product line. Some of these have relatively moderate payment patterns (with most of the claims for a given accident year closed within 5 to 7 years), while others can have extreme lags in both reporting and payment of claims (e.g., a reporting lag of a decade for "construction defect" claims).
Examples of common reserving factors that can change and, thus, affect the estimated multiple peril liability reserves include:
Multiple peril liability reserving factors
- •
- Changes in claim handling philosophies (e.g., case reserving standards)
- •
- Changes in policy provisions or court interpretations of such provisions
- •
- New theories of liability
- •
- Trends in jury awards
- •
- Changes in the propensity to sue, in general with specificity to particular issues
- •
- Changes in statutes of limitations
- •
- Changes in the underlying court system
- •
- Distortions from losses resulting from large single accounts or single issues
- •
- Changes in tort law
- •
- Shifts in lawsuit mix between federal and state courts
- •
- Changes in settlement patterns
Multiple peril liability book of business reserving factors
- •
- Changes in policy provisions (e.g., deductibles, policy limits, or endorsements)
- •
- Changes in underwriting standards
- •
- Product mix (e.g., size of account, industries insured, or jurisdiction mix)
Commercial automobile liability
The commercial automobile product line is a mix of property and liability coverages and, therefore, includes both short- and long-tail coverages. The payments that are made quickly typically pertain to automobile physical damage (property) claims and property damage (liability) claims. The payments that take longer to finalize and are more difficult to estimate relate to bodily injury claims. Commercial automobile reserves are typically analyzed in three components; bodily injury liability, property damage liability, and collision/comprehensive claims. This last component has minimum reserve risk and fast payouts and, accordingly, separate reserving factors are not presented. In general, claim reporting lags are minor, claim complexity is not a major issue, and the line is viewed as high frequency, low to moderate severity.
93
Examples of common reserving factors that can change and, thus, affect the estimated commercial automobile liability reserves include:
Bodily injury and property damage liability reserving factors
- •
- Trends in jury awards
- •
- Changes in the underlying court system
- •
- Changes in case law
- •
- Litigation trends
- •
- Frequency of claims with payment capped by policy limits
- •
- Change in average severity of accidents, or proportion of severe accidents
- •
- Subrogation opportunities
- •
- Changes in claim handling philosophies (e.g., case reserving standards)
- •
- Frequency of visits to health providers
- •
- Number of medical procedures given during visits to health providers
- •
- Types of health providers used
- •
- Types of medical treatments received
- •
- Changes in cost of medical treatments
- •
- Degree of patient responsiveness to treatment
Commercial automobile liability book of business reserving factors
- •
- Changes in policy provisions (e.g., deductibles, policy limits, or endorsements)
- •
- Changes in mix of insured vehicles (e.g., long-haul trucks versus local and smaller vehicles, or fleet
risks versus non-fleet risks)
- •
- Changes in underwriting standards
General liability
See the above discussions under the liability product lines with regard to reserving factors for multiple peril.
Homeowners/Farmowners
Homeowners/Farmowners is generally considered a short-tail coverage. Most payments are related to the property portion of the policy, where the claim reporting and settlement process is generally restricted to the insured and the insurer. Claims on property coverage are typically reported soon after the actual damage occurs, although delays of several months are not unusual. The resulting settlement process is typically fairly short term, although exceptions do exist. The liability portion of the homeowners/farmowners policy generates claims which take longer to pay due to the involvement of litigation and negotiation, but with generally small reporting lags. Overall, the line is generally high frequency, low to moderate severity (except for catastrophes), with simple to moderate claim complexity.
94
Examples of common reserving factors that can change and, thus, affect the estimated homeowners/farmowners reserves include:
Non-catastrophe reserving factors
- •
- Salvage opportunities
- •
- Amount of time to return property to residential use
- •
- Changes in weather patterns
- •
- Local building codes
- •
- Litigation trends
- •
- Trends in jury awards
Catastrophe reserving factors
- •
- Physical concentration of policyholders
- •
- Availability and cost of local contractors
- •
- Local building codes
- •
- Quality of construction of damaged homes
- •
- Amount of time to return property to residential use
- •
- For the more severe catastrophic events, "demand surge" inflation, whereby the greatly increased demand for building materials such as plywood far surpasses the immediate supply, leading to short-term material increases in building material costs
Homeowners/Farmowners book of business reserving factors
- •
- Policy provisions mix (e.g., deductibles, policy limits, or endorsements)
- •
- Degree of concentration of policyholders
- •
- Changes in underwriting standards
Loss and LAE Development
Loss and LAE development—2010
In 2010, we experienced $51.1 million of favorable loss and LAE reserve development on prior accident year loss reserves. The favorable development in our Specialty Insurance Operations was $28.0 million with favorable development of $23.1 million in our Other Insurance Operations. The favorable loss reserve development was primarily due to lower than expected severity on non-catastrophe losses related to professional liability lines, multiple peril liability lines and other general liability lines. The favorable development also included a $7.5 million release of commercial catastrophe reserves associated with storms occurring in 2004 and 2005.
Specifically, at December 31, 2009, management had revised its expectations downward with respect to future loss emergence in the professional liability business, which is included in the general liability line of business, which had initially been based on market analysis when this business was initiated in 2002 and 2003. However, during 2010, losses continued to be significantly lower than these revised expectations. As a result, management lowered its selected reserves on the earliest years which affected more recent years as total loss expectations for those years are based in part on prior years'
95
results. The impact of this revised estimate was a decrease to professional liability reserves of $19.3 million which affected Specialty Insurance Operations.
At December 31, 2009, management had recorded $7.5 million of reserves for certain claims related to catastrophes from accident years 2004 and 2005 related to our excess property business. During 2010, these claims were resolved for amounts below our policy coverage therefore the reserves were no longer necessary. This development affected our Specialty Insurance Operations.
At December 31, 2009, based on actuarial techniques described above, management estimated that IBNR related to multiple peril liability was $170.5 million, or approximately 93% of case reserves of $184.1 million for accident years 2004 through 2009. During 2010, case incurred loss and allocated LAE (ALAE) was $65.8 million, which was less than expected for this line of business. As a result of the lower than expected case incurred loss and ALAE during 2010, the actuarial methods based on case incurred losses produced lower estimated ultimate losses for these accident years. As a result, at December 31, 2010, the IBNR was determined to be $86.2 million, or approximately 57% of the remaining case reserves. The impact of this revised estimate was a decrease to multiple peril liability reserves of $18.4 million. This favorable development was split between Specialty Insurance Operations of $7.6 million and Other Insurance Operations of $10.8 million.
At December 31, 2009, based on actuarial techniques described above, management estimated that IBNR related to general liability occurrence was $107.1 million, or approximately 265% of case reserves of $40.4 million for accident years 2004 through 2009. During 2010, case incurred loss and ALAE was $33.1 million, which was less than expected for this line of business. As a result of the lower than expected case incurred loss and ALAE during 2010, the actuarial methods based on case incurred losses produced lower estimated ultimate losses for these accident years. As a result, at December 31, 2010, the IBNR was determined to be $61.7 million, or approximately 164% of the remaining case reserves. The impact of this revised estimate was a decrease to general liability occurrence reserves of $12.3 million. This favorable development was split between Specialty Insurance Operations of $1.5 million and Other Insurance Operations of $10.8 million.
In addition to the development described for the lines of business above, management also recorded a $6.4 million net increase in IBNR in other lines of business as a result of its review of loss reserves at December 31, 2010. The change in IBNR for each other line of business was not individually significant.
Loss and LAE development—2009
In 2009, we experienced $83.4 million of favorable loss and LAE reserve development on prior accident year loss reserves. The favorable development in our Specialty Insurance Operations was $84.6 million with slight adverse development of $1.2 million in our Other Insurance Operations. The favorable loss reserve development was primarily related to lower than expected severity on non-catastrophe losses. The favorable non-catastrophe loss reserve development was primarily related to professional liability lines, multiple peril liability lines and other general liability lines partially offset by adverse loss reserve development at AutoOne.
Specifically, at December 31, 2008, management had revised its expectations downward with respect to future loss emergence in the professional liability business, which is included in the general liability line of business, which had initially been based on market analysis when this business was initiated in 2002 and 2003. However, during 2009, losses continued to be significantly lower than these revised expectations. As a result, management lowered its selected reserves on the earliest years which affected more recent years as total loss expectations for those years are based in part on prior years' results. The impact of this revised estimate was a decrease to professional liability reserves of $60.0 million which affected Specialty Insurance Operations.
96
At December 31, 2008, management had estimated that future payments from personal injury protection (PIP) litigation from our AutoOne business would be approximately $7.8 million. During 2009, the legal expenses related to this litigation were higher than expected. As a result, management increased estimates of all accident years for AutoOne. The total increase in estimate was $33.3 million which affected Other Insurance Operations.
At December 31, 2008, based on actuarial techniques described above, management estimated that IBNR related to multiple peril liability was $173.9 million, or approximately 85% of case reserves of $204.9 million for 2002 and subsequent accident years. During 2009, case incurred loss and ALAE was $36.8 million, which was less than expected for this line of business. As a result of the lower than expected case incurred loss and ALAE during 2009, the actuarial methods based on case incurred losses produced lower estimated ultimate losses for these accident years. As a result, at December 31, 2009, the IBNR was determined to be $95.4 million, or approximately 73% of the remaining case reserves. The impact of this revised estimate was a decrease to multiple peril liability reserves of $42.6 million. This favorable development was split between Specialty Insurance Operations of $12.1 million and Other Insurance Operations of $30.5 million.
At December 31, 2008, based on actuarial techniques described above, management estimated that IBNR related to general liability occurrence was $93.9 million, or approximately 275% of case reserves of $34.2 million for 2002 and subsequent accident years. During 2009, case incurred loss and ALAE was $15.6 million, which was less than expected for this line of business. As a result of the lower than expected case incurred loss and ALAE during 2009, the actuarial methods based on case incurred losses produced lower estimated ultimate losses for these accident years. As a result, at December 31, 2009, the IBNR was determined to be $61.6 million, or approximately 214% of the remaining case reserves. The impact of this revised estimate was a decrease to general liability occurrence reserves of $14.1 million. This favorable development was split between Specialty Insurance Operations of $5.2 million and Other Insurance Operations of $8.9 million.
In addition to the development described for the lines of business above, management also recorded changes in IBNR in other lines of business as a result of its review of loss reserves at December 31, 2009 that essentially offset. The change in IBNR for each other line of business was not individually significant.
Loss and LAE development—2008
In 2008, we experienced $62.0 million of favorable loss and LAE reserve development on prior accident year loss reserves. The favorable development in our Specialty Insurance Operations was $64.8 million with slight adverse development of $2.8 million in our Other Insurance Operations. The favorable loss reserve development was primarily related to lower than expected severity on non-catastrophe losses. The favorable non-catastrophe loss reserve development was primarily related to professional liability lines and multiple peril liability lines partially offset by adverse loss reserve development at AutoOne and in legacy run-off.
Specifically, at December 31, 2007, management had revised its expectations downward with respect to future loss emergence in the professional liability business, which is included in the general liability line of business, which had initially been based on market analysis when this business was initiated in 2002 and 2003. However, during 2008, losses continued to be significantly lower than these revised expectations. As a result, management lowered its selected reserves on the earliest years which affected more recent years as total loss expectations for those years are based in part on prior years' results. The impact of this revised estimate was a decrease to professional liability reserves of $50.5 million which affected Specialty Insurance Operations.
At December 31, 2007, management had estimated that future payments from PIP litigation from our New York Automobile Insurance Plan (NYAIP) business would be approximately $14.0 million.
97
During 2008, the legal expenses related to this litigation were higher than expected as the 2002 accident year neared conclusion. As a result, management increased estimates of all accident years for NYAIP and other similar business in New York. The total increase in estimate was $10.8 million which affected Other Insurance Operations.
At December 31, 2007, based on actuarial techniques described above, management estimated that IBNR related to multiple peril liability was $137.0 million, or approximately 64% of case reserves of $212.8 million for 2002 and subsequent accident years. During 2008, case incurred loss and ALAE was $16.2 million, which was less than expected for this line of business. As a result of the lower than expected case incurred loss and ALAE during 2008, the actuarial methods based on case incurred losses produced lower estimated ultimate losses for these accident years. As a result, at December 31, 2008, the IBNR was determined to be $86.9 million, or approximately 64% of the remaining case reserves. The impact of this revised estimate was a decrease to multiple peril liability reserves of $33.8 million. This favorable development was split between Specialty Insurance Operations of $10.9 million and Other Insurance Operations of $22.9 million.
At December 31, 2007, based on actuarial techniques described above, management estimated that IBNR related to workers compensation was $41.1 million, or approximately 96% of case reserves of $43.0 million for 2005 and subsequent accident years. During 2008, case incurred loss and ALAE was $20.2 million, which was greater than expected for this line of business. As a result of the higher than expected case incurred loss and ALAE during 2008, the actuarial methods based on case incurred losses produced higher estimated ultimate losses for these accident years. As a result, at December 31, 2008, the IBNR was determined to be $34.8 million, or approximately 81% of the remaining case reserves. The impact of this revised estimate was an increase to workers compensation reserves of $13.9 million. This adverse development was split between Specialty Insurance Operations of $4.5 million and Other Insurance Operations of $9.4 million.
In addition to the development described for the lines of business above, management also recorded a $2.4 million net decrease in IBNR in other lines of business as a result of its review of loss reserves at December 31, 2008. The change in IBNR for each other line of business was not individually significant.
Case and IBNR Reserves
Loss and LAE reserves, net of reinsurance recoverables on unpaid losses, at December 31, 2010 and 2009 were as follows:
| |
December 31, 2010 | December 31, 2009 | |||||||||||||||||
|---|---|---|---|---|---|---|---|---|---|---|---|---|---|---|---|---|---|---|---|
| |
Case | IBNR | Total | Case | IBNR | Total | |||||||||||||
| |
($ in millions) |
||||||||||||||||||
Specialty Insurance Operations |
$ | 283.2 | $ | 498.2 | $ | 781.4 | $ | 215.6 | $ | 442.7 | $ | 658.3 | |||||||
Other Insurance Operations |
335.1 | 285.8 | 620.9 | 519.1 | 564.5 | 1,083.6 | |||||||||||||
Total |
$ | 618.3 | $ | 784.0 | $ | 1,402.3 | $ | 734.7 | $ | 1,007.2 | $ | 1,741.9 | |||||||
98
Loss and LAE reserves, net of reinsurance recoverables on unpaid losses, by line of business at December 31, 2010 and 2009 were as follows:
| |
December 31, 2010 | December 31, 2009 | |||||||||||||||||
|---|---|---|---|---|---|---|---|---|---|---|---|---|---|---|---|---|---|---|---|
| |
Case | IBNR | Total | Case | IBNR | Total | |||||||||||||
| |
($ in millions) |
||||||||||||||||||
Workers compensation |
$ | 171.0 | $ | 102.6 | $ | 273.6 | $ | 134.7 | $ | 126.7 | $ | 261.4 | |||||||
Personal automobile liability |
83.2 | 35.4 | 118.6 | 254.4 | 117.6 | 372.0 | |||||||||||||
Multiple peril |
0.1 | 135.7 | 135.8 | (30.7 | ) | 222.4 | 191.7 | ||||||||||||
Commercial automobile liability |
81.3 | 53.7 | 135.0 | 90.5 | 68.9 | 159.4 | |||||||||||||
General liability(1) |
163.9 | 388.7 | 552.6 | 129.3 | 382.6 | 511.9 | |||||||||||||
Homeowners/Farmowners |
4.0 | 2.3 | 6.3 | 41.8 | 22.9 | 64.7 | |||||||||||||
Other(2) |
114.8 | 65.6 | 180.4 | 114.7 | 66.1 | 180.8 | |||||||||||||
Total |
$ | 618.3 | $ | 784.0 | $ | 1,402.3 | $ | 734.7 | $ | 1,007.2 | $ | 1,741.9 | |||||||
- (1)
- Includes
loss and LAE reserves related to professional liability.
- (2)
- Includes loss and LAE reserves related to marine liability.
Range of Reserves
Our range of reserve estimates at December 31, 2010 was evaluated to consider the strengths and weaknesses of the actuarial methods applied against our historical claims experience data. The following table shows the recorded reserves and the high and low ends of our range of reasonable loss and LAE reserve estimates at December 31, 2010. The high and low ends of our range of reserve estimates in the table below are based on the results of various actuarial methods described above.
| |
December 31, 2010 | |||||||||
|---|---|---|---|---|---|---|---|---|---|---|
| |
Low | Recorded | High | |||||||
| |
($ in millions) |
|||||||||
Specialty Insurance Operations |
$ | 625.5 | $ | 781.4 | $ | 806.9 | ||||
Other Insurance Operations |
455.0 | 620.9 | 664.5 | |||||||
Total |
$ | 1,080.5 | $ | 1,402.3 | $ | 1,471.5 | ||||
The following table shows the recorded reserves and the high and low ends of our range of reasonable loss and LAE reserve estimates by line of business at December 31, 2010.
| |
December 31, 2010 | |||||||||
|---|---|---|---|---|---|---|---|---|---|---|
| |
Low | Recorded | High | |||||||
| |
($ in millions) |
|||||||||
Workers compensation |
$ | 197.7 | $ | 273.6 | $ | 292.4 | ||||
Personal automobile liability |
109.9 | 118.6 | 131.3 | |||||||
Multiple peril |
66.8 | 135.8 | 141.3 | |||||||
Commercial automobile liability |
120.3 | 135.0 | 138.2 | |||||||
General liability |
404.9 | 552.6 | 570.0 | |||||||
Homeowners/Farmowners |
6.1 | 6.3 | 6.7 | |||||||
Other |
174.8 | 180.4 | 191.6 | |||||||
Total |
$ | 1,080.5 | $ | 1,402.3 | $ | 1,471.5 | ||||
99
The recorded reserves represent management's best estimate of unpaid loss and LAE by line of business. We use the results of several different actuarial methods to develop our estimate of ultimate reserves. While we have not determined the statistical probability of actual ultimate paid losses falling within the range, management believes that it is reasonably likely that actual ultimate paid losses will fall within the ranges noted above because the ranges were developed by using several different generally accepted actuarial methods.
The probability that ultimate losses will fall outside of the ranges of estimates by line of business is higher for each line of business individually than it is for the sum of the estimates for all lines taken together due to the effects of diversification. The diversification effects result from the fact that losses across our different lines of business are not completely correlated. Although management believes our reserves are reasonably stated, ultimate losses may deviate, perhaps materially, from the recorded reserve amounts and could be above the high end of the range of actuarial projections. This is because ranges are developed based on known events as of the valuation date, whereas the ultimate disposition of losses is subject to the outcome of events and circumstances that may be unknown as of the valuation date.
The percentages shown in the following table represent the linear interpolation of where our recorded loss and LAE reserves are within the range of reserves estimates by line of business at December 31, 2010 and 2009, where the low end of the range equals zero, the middle of the range equals 50% and the high end of the range equals 100%.
| |
December 31, | ||||||
|---|---|---|---|---|---|---|---|
| |
2010 | 2009 | |||||
| |
(expressed as a percentage of the range) |
||||||
Workers compensation |
80 | % | 58 | % | |||
Personal automobile liability |
40 | 50 | |||||
Multiple peril |
93 | 89 | |||||
Commercial automobile liability |
82 | 74 | |||||
General liability |
90 | 94 | |||||
Homeowners/Farmowners |
33 | 76 | |||||
Other |
34 | 97 | |||||
Total |
82 | % | 78 | % | |||
During 2010, emerged loss experience for workers compensation was lower than had been projected by several of the actuarial methods. As this favorable emerged loss experience coincides with some significant changes in claims staffing, management has selected reserves consistent with previous projections which results in our selected reserves being higher in the range.
At year end 2009, management had recorded reserves in other lines for catastrophe claims from accident years 2004 and 2005 above the actuarial projections. During 2010, these losses were settled and are no longer included in the outstanding reserves as of December 31, 2010. As a result, management selected reserves at year end 2010 lower in the range of actuarial methods.
Overall, management is concerned about the impact of future increases in inflation, including adverse changes in tort liability. These types of changes would result in deterioration in the loss reserves, therefore, management continues to select loss reserves closer to the high end of the actuarial indications.
100
Sensitivity Analysis
The following discussion includes disclosure of possible variations from current estimates of loss reserves due to a change in certain key assumptions. Each of the impacts described below is estimated individually, without consideration for any correlation among key assumptions or among lines of business. Therefore, it would be inappropriate to take each of the amounts described below and add them together in an attempt to estimate volatility for our reserves in total. It is important to note that the variations discussed are not meant to be a worst-case scenario, and therefore, it is possible that future variations may be more than amounts discussed below.
- •
- Workers compensation: Recorded reserves for workers
compensation were $273.6 million at December 31, 2010. The two most important assumptions for workers compensation reserves are loss development factors and loss cost trends,
particularly medical cost inflation. Loss development patterns are dependent on medical cost inflation. Approximately half of the workers compensation net reserves are related to future medical costs.
Across the entire reserve base, a 0.5 point change in calendar year medical inflation would have changed the estimated net reserve by approximately $49 million at December 31, 2010, in
either direction.
- •
- Professional liability: Recorded reserves for
professional liability were $363.8 million at December 31, 2010. A key assumption for professional liability is the implicit loss cost trend, particularly the severity inflation trend
component of loss costs. Across the entire reserve base, a 10.0 point change in assumed annual severity would have changed the estimated net reserve by approximately $60 million at
December 31, 2010, in either direction.
- •
- Multiple peril liability: Recorded reserves for multiple peril were $135.8 million at December 31, 2010. Reported loss development patterns are a key assumption for these lines of business, particularly for more mature accident years. Historically, assumptions on reported loss development patterns have been impacted by, among other things, emergence of new types of claims (e.g. construction defect claims) or a shift in the mixture between smaller, more routine claims and larger, more complex claims. If case reserve adequacy for non-construction defect claims changed by 10.0 points this would have changed the estimated net reserve by approximately $20 million at December 31, 2010, in either direction.
3. Reinsurance Transactions
Our insurance subsidiaries purchase reinsurance from time to time to protect their businesses from losses due to exposure aggregation, to manage their operating leverage ratios and to limit ultimate losses arising from catastrophic events. Amounts recoverable from reinsurers are estimated in a manner consistent with the claim liability associated with the reinsured policies. Amounts related to reinsurance contracts are recorded in accordance with ASC 944.
In connection with the OneBeacon Acquisition, Aviva caused us to purchase reinsurance contracts with two reinsurance companies rated "A++" ("Superior", the highest of fifteen financial strength ratings) by A.M. Best and "AA+" ("Very Strong", the second highest of twenty-one financial strength ratings) by Standard & Poor's. One is a reinsurance cover with NICO which entitles us to recover up to $2.5 billion in ultimate loss and LAE incurred related to asbestos claims arising from business written prior to 1992, environmental claims arising from business written prior to 1987 and certain other latent exposures. As of December 31, 2010, we have ceded estimated incurred losses of approximately $2.2 billion to NICO under the NICO Cover. The other contract is a reinsurance cover with GRC for up to $570 million of additional losses on all claims arising from accident years 2000 and prior. As of December 31, 2010, we have ceded estimated incurred losses of $550.0 million to GRC under the GRC Cover. The NICO Cover and GRC Cover, which were contingent on and occurred contemporaneously with the OneBeacon Acquisition, were put in place in lieu of a seller guarantee of loss and LAE
101
reserves and are therefore accounted for as a seller guarantee under GAAP. NICO and GRC are wholly-owned subsidiaries of Berkshire.
The collectibility of reinsurance recoverables is subject to the solvency and willingness to pay of the reinsurer. We are selective in choosing our reinsurers, placing reinsurance principally with those reinsurers with a strong financial condition, industry ratings and underwriting ability. Management monitors the financial condition and ratings of our reinsurers on an ongoing basis. See Note 4—"Reinsurance" of the accompanying consolidated financial statements for additional information on our reinsurance programs.
4. Purchase Accounting
When we acquire another company, our management must estimate the fair values of the assets and liabilities acquired, in accordance with GAAP at the time of the acquisition. Certain assets and liabilities require little judgment to estimate their fair values, particularly those that are quoted on a market exchange, such as publicly-traded investment securities. Other assets and liabilities, however, require a substantial amount of judgment to estimate their fair values. The most significant of these is the estimation required to fair value loss and LAE reserves. We estimate the fair value of loss and LAE reserves obtained in an acquisition following the principles contained within FASB Statement of Financial Accounting Concepts No. 7: "Using Cash Flow Information and Present Value in Accounting Measurements" (CON 7). Under CON 7, the fair value of a particular asset or liability essentially contains five elements: (1) an estimate of the future cash flows; (2) expectations about possible variations in the amount or timing of those cash flows; (3) the time value of money, represented by the risk-free rate of interest; (4) the price for bearing the uncertainty inherent in the asset or liability; and (5) other, sometimes unidentifiable, factors including illiquidity and market imperfections.
Our actuaries estimate the fair value of loss and LAE reserves obtained in an acquisition by taking the acquired company's recorded reserves and discounting them based on expected reserve payout patterns using the current risk-free rate of interest. Then, our actuaries develop additional cash flow scenarios that use different payout and ultimate reserve assumptions deemed to be reasonably possible based upon the inherent uncertainties present in determining the amount and timing of payment of such reserves. In each scenario, the risk-free rate of interest is used to discount future cash flows. These scenarios are put in a statistical model that assigns a probability to each cash flow scenario. Our actuaries then choose the scenario that best represents the price for bearing the uncertainty inherent within the acquired company's recorded reserves. The "price" for bearing the uncertainty inherent within the acquired company's reserves is measured as the difference between the selected cash flow scenario and the expected cash flow scenario. The scenario selected has typically been between 1.5 and 2 standard deviations from the expected cash flow outcome. The fair value of the acquired company's loss and LAE reserves is determined to be the sum of the expected cash flow scenario (i.e., the acquired company's discounted loss and LAE reserves) and the uncertainty "price."
The difference between an acquired company's loss and LAE reserves and our best estimate of the fair value of such reserves at the acquisition date is amortized ratably over the payout period of the acquired loss and LAE reserves. Historically, the fair value of an acquired company's loss and LAE reserves has been less than its nominal reserves at acquisition. Accordingly, the amortization has been and will continue to be recorded as an expense on our income statement until fully amortized.
In connection with purchase accounting for the OneBeacon Acquisition, we were required to adjust to fair value our loss and LAE reserves and the related reinsurance recoverables by $646.9 million and $346.9 million, respectively, on OneBeacon's acquired balance sheet as of June 1, 2001. This net reduction to loss and LAE reserves of $300.0 million is being accreted through an income statement charge ratably with and over the period the claims are settled. The outstanding pre-tax unaccreted adjustment as of December 31, 2010 and 2009 was $0.
102
The information contained in this report may contain "forward-looking statements" within the meaning of Section 27A of the Securities Act of 1933 and Section 21E of the Securities Exchange Act of 1934. All statements, other than statements of historical facts, included or referenced in this report that address activities, events or developments which we expect or anticipate will or may occur in the future are forward-looking statements. The words "will," "believe," "intend," "expect," "anticipate," "project," "estimate," "predict" and similar expressions are also intended to identify forward-looking statements. These forward-looking statements include, among others, statements with respect to our:
- •
- change in book value per share or return on equity;
- •
- business strategy;
- •
- financial and operating targets or plans;
- •
- incurred loss and loss adjustment expenses and the adequacy of our loss and loss adjustment expense reserves and related
reinsurance;
- •
- projections of revenues, income (or loss), earnings (or loss) per share, dividends, market share or other financial
forecasts;
- •
- expansion and growth of our business and operations; and
- •
- future capital expenditures.
These statements are based on certain assumptions and analyses made by us in light of our experience and perception of historical trends, current conditions and expected future developments, as well as other factors believed to be appropriate in the circumstances. However, whether actual results and developments will conform with our expectations and predictions is subject to a number of risks and uncertainties that could cause actual results to differ materially from expectations, including:
- •
- the risks discussed beginning on page 25 of this Form 10-K;
- •
- recorded loss and loss adjustment expense reserves subsequently proving to have been inadequate;
- •
- claims arising from catastrophic events, such as hurricanes, windstorms, earthquakes, floods or terrorist attacks;
- •
- the continued availability and cost of reinsurance;
- •
- competitive forces, including the conduct of other property and casualty insurers and agents;
- •
- changes in domestic or foreign laws or regulations, or their interpretation, applicable to us, our competitors, our agents
or our customers;
- •
- the continued availability of capital and financing;
- •
- general economic, market or business conditions;
- •
- an economic downturn or other economic conditions adversely affecting our financial position;
- •
- business opportunities (or lack thereof) that may be presented to us and pursued;
- •
- actions taken by rating agencies from time to time, such as financial strength or credit rating downgrades or placing
ratings on negative watch; and
- •
- other factors, most of which are beyond our control.
Consequently, all of the forward-looking statements made in this report are qualified by these cautionary statements, and there can be no assurance that the actual results or developments
103
anticipated by us will be realized or, even if substantially realized, that they will have the expected consequences to, or effects on, us or our business or operations. We assume no obligation to update publicly any such forward-looking statements, whether as a result of new information, future events or otherwise.
ITEM 7A. QUANTITATIVE AND QUALITATIVE DISCLOSURES ABOUT MARKET RISK
Our consolidated balance sheet includes a substantial amount of assets and liabilities whose fair values are subject to market risk. The term market risk refers to the risk of loss arising from adverse changes in interest rates, credit spreads, equity market prices and other relevant market rates and prices. Due to our sizable investment portfolio, market risk can have a significant effect on OneBeacon's consolidated financial position.
Interest Rate Risk
Fixed Maturity and Convertible Bond Portfolios. In connection with our consolidated insurance subsidiaries, we invest in interest rate sensitive securities, primarily debt securities. Our strategy is to purchase fixed maturity investments and convertible bonds that are attractively priced in relation to perceived credit risks. In accordance with ASC 825, our portfolio of fixed maturity investments held for general investment purposes are classified as trading securities which are reported at fair value as of the balance sheet date as determined by quoted market prices when available. Realized and unrealized investment gains and losses on trading securities are reported pre-tax in revenues.
In accordance with ASC 825, our convertible bonds are carried at fair value with changes therein recorded in revenues as unrealized investment gains or losses.
We generally manage the interest rate risk associated with our portfolio of fixed maturity investments and convertible bonds by monitoring the average duration of the portfolio. Our fixed maturity and convertible bond portfolios are comprised of primarily investment grade corporate securities, U.S. government and agency securities, municipal obligations and mortgage-backed securities.
Increases and decreases in prevailing interest rates generally translate into decreases and increases in fair values of fixed maturity and convertible bond investments, respectively. Additionally, fair values of interest rate sensitive instruments may be affected by the creditworthiness of the issuer, prepayment options, relative values of alternative investments, the liquidity of the instrument and other market factors.
104
The table below summarizes the estimated effects of hypothetical increases and decreases in market interest rates on our fixed maturity and convertible bond investments and pension fixed maturity and convertible bond investments:
| |
Fair value at December 31, 2010 |
Assumed change in relevant interest rate |
Estimated fair value after change in interest rate |
After tax increase (decrease) in carrying value |
|||||||||
|---|---|---|---|---|---|---|---|---|---|---|---|---|---|
| |
($ in millions) |
||||||||||||
Fixed maturity and convertible bond investments |
$ | 2,509.3 | 100 bp decrease | $ | 2,577.7 | $ | 44.5 | ||||||
|
50 bp decrease | 2,544.3 | 22.8 | ||||||||||
|
50 bp increase | 2,474.2 | (22.8 | ) | |||||||||
|
100 bp increase | 2,439.2 | (45.6 | ) | |||||||||
Qualified pension plan fixed maturity and convertible bond investments |
$ |
56.2 |
100 bp decrease |
57.5 |
$ |
0.8 |
|||||||
|
50 bp decrease | 56.8 | 0.4 | ||||||||||
|
50 bp increase | 55.5 | (0.5 | ) | |||||||||
|
100 bp increase | 54.9 | (0.8 | ) | |||||||||
Long-term obligations. As of December 31, 2010, our interest and dividend bearing long-term obligations consisted of the Senior Notes which have a fixed interest rate. As a result, our exposure to interest rate risk resulting from variable interest rate obligations is insignificant.
The Senior Notes were issued in 2003 and mature on May 15, 2013. At December 31, 2010, the fair value of the Senior Notes was $435.1 million, which compared to a carrying value of $419.6 million. The fair value of this obligation was estimated by discounting future cash flows using current market rates for similar obligations or using quoted market prices.
Credit Spread Risk
Sensitivity analysis of spread risk
Our overall fixed maturity investment strategy is to purchase securities that are attractively priced in relation to their investment risks. Widening and tightening of spreads generally translate into decreases and increases in fair values of fixed maturity investments, respectively. The table below summarizes the estimated effects of hypothetical widening and tightening of spreads for different classes of our fixed maturity and convertible bond portfolios. In estimating the impact of hypothetical tightening of spreads, for fixed maturity investments yielding more than the 3 year Constant Maturity Treasury Index (CMT Index) as of December 31, 2010, to the extent their yields would have decreased to levels lower than the 3 year CMT Index as of December 31, 2010, we limited their price appreciation to a level equal to the yield of the 3 year CMT Index. For fixed maturity investments yielding less than the 3 year CMT Index as of December 31, 2010, we assumed no price appreciation.
| |
December 31, 2010 Fair Value |
Tighten 50 | Tighten 25 | Widen 25 | Widen 50 | |||||||||||
|---|---|---|---|---|---|---|---|---|---|---|---|---|---|---|---|---|
| |
($ in millions) |
|||||||||||||||
U.S Government and agency obligations |
$ | 250.7 | $ | — | $ | — | $ | — | $ | — | ||||||
Foreign government obligations |
13.3 | 0.1 | — | — | (0.1 | ) | ||||||||||
| |
|
Tighten 100 | Tighten 50 | Widen 50 | Widen 100 | |||||||||||
|---|---|---|---|---|---|---|---|---|---|---|---|---|---|---|---|---|
Agency mortgage-backed securities |
$ | 846.7 | $ | 27.8 | $ | 13.9 | $ | (14.0 | ) | $ | (27.5 | ) | ||||
Other asset-backed securities |
228.0 | 0.2 | 0.1 | (0.9 | ) | (1.7 | ) | |||||||||
105
| |
December 31, 2010 Fair Value |
Tighten 200 | Tighten 100 | Widen 100 | Widen 200 | |||||||||||
|---|---|---|---|---|---|---|---|---|---|---|---|---|---|---|---|---|
Debt securities issued by industrial corporations |
$ | 948.6 | $ | 60.9 | $ | 33.1 | $ | (33.5 | ) | $ | (65.1 | ) | ||||
Municipal obligations |
2.1 | 0.2 | 0.1 | (0.1 | ) | (0.2 | ) | |||||||||
Convertible bonds |
93.8 | 2.1 | 1.1 | (2.1 | ) | (4.2 | ) | |||||||||
| |
|
Tighten 400 | Tighten 200 | Widen 200 | Widen 400 | |||||||||||
|---|---|---|---|---|---|---|---|---|---|---|---|---|---|---|---|---|
Non-agency commercial mortgage-backed securities |
$ | 36.3 | $ | 0.7 | $ | 0.6 | $ | (0.7 | ) | $ | (1.3 | ) | ||||
| |
|
Tighten 600 | Tighten 300 | Widen 300 | Widen 600 | |||||||||||
|---|---|---|---|---|---|---|---|---|---|---|---|---|---|---|---|---|
Preferred stocks |
$ | 83.4 | $ | 4.8 | $ | 4.8 | $ | (9.7 | ) | $ | (24.0 | ) | ||||
Non-agency residential mortgage-backed securities |
6.4 | 0.2 | 0.2 | (0.4 | ) | (0.7 | ) | |||||||||
The table below summarizes the estimated effects of hypothetical widening and tightening of spreads on our qualified pension plan fixed maturity investments.
| |
December 31, 2010 Fair Value |
Tighten 200 | Tighten 100 | Widen 100 | Widen 200 | |||||||||||
|---|---|---|---|---|---|---|---|---|---|---|---|---|---|---|---|---|
| |
($ in millions) |
|||||||||||||||
Convertible bonds |
$ | 55.7 | $ | 1.4 | $ | 0.7 | $ | (1.2 | ) | $ | (2.4 | ) | ||||
| |
|
Tighten 600 | Tighten 300 | Widen 300 | Widen 600 | |||||||||||
|---|---|---|---|---|---|---|---|---|---|---|---|---|---|---|---|---|
Preferred stocks |
$ | 0.5 | $ | 0.1 | $ | 0.1 | $ | (0.1 | ) | $ | (0.2 | ) | ||||
Equity Price Risk
The carrying values of our common equity securities and other long-term equity investments are based on quoted market prices or management's estimates of fair value as of the balance sheet date. Market prices of common equity securities, in general, are subject to fluctuations. These fluctuations could cause the amount realized upon sale or exercise of these instruments to differ significantly from the current reported value. The fluctuations may result from perceived changes in the underlying economic characteristics of the investment, the relative price of alternative investments, supply and demand imbalances for a particular security or other market factors.
Sensitivity analysis of likely changes in fair values of common equity securities, hedge fund and private equity fund investments
Our investment portfolio includes investments in common equity securities, hedge funds and private equity funds. The underlying investments of the hedge funds and private equity funds are typically publicly traded and private common equity investments, and, as such, are subject to market risks that are similar to those in our common equity portfolio.
The following illustrates the estimated effect on December 31, 2010 fair values resulting from hypothetical changes in market value:
| |
Change in fair value | ||||||||||||
|---|---|---|---|---|---|---|---|---|---|---|---|---|---|
| |
10% decline | 10% increase | 30% decline | 30% increase | |||||||||
| |
($ in millions) |
||||||||||||
Common equity securities |
$ | (28.5 | ) | $ | 28.5 | $ | (85.6 | ) | $ | 85.6 | |||
Hedge funds |
(6.3 | ) | 6.3 | (19.0 | ) | 19.0 | |||||||
Private equity funds |
(7.3 | ) | 7.3 | (21.8 | ) | 21.8 | |||||||
106