Attached files
| file | filename |
|---|---|
| 8-K - 8-K - CVR Refining, LP | a13-12887_18k.htm |
Exhibit 99.1
|
|
Investor Presentation May 2013 |

|
|
Forward Looking Statements The following information contains forward-looking statements based on management’s current expectations and beliefs, as well as a number of assumptions concerning future events. These statements are subject to risks, uncertainties, assumptions and other important factors. You are cautioned not to put undue reliance on such forward-looking statements (including forecasts and projections regarding our future performance) because actual results may vary materially from those expressed or implied as a result of various factors, including, but not limited those set forth under “Risk Factors” in CVR Refining, LP’s Annual Report on Form 10-K, Quarterly Reports on Form 10-Q and any other filings CVR Refining, LP makes with the Securities and Exchange Commission. CVR Refining, LP assumes no obligation to, and expressly disclaims any obligation to, update or revise any forward-looking statements, whether as a result of new information, future events or otherwise. 1 |
|
|
Owns two of only seven refineries in the underserved Group 3 of the PADD II region – nameplate refining capacity of 185 thousand barrels per day (“Mbpd”) and a weighted average complexity of 11.5 between the two refineries Represents ~22% of regional refining capacity Strategic location and logistics assets provide access to price-advantaged mid-continent, Bakken and Canadian crude oils Favorable products demand / supply dynamics, with local demand on average 13.8% higher than local fuel production over 2008-2012 (1) Company Overview (1) Based on EIA data, including gasoline and ultra-low sulfur diesel (ULSD) demand and production in the states of Kansas, Oklahoma, Missouri, Nebraska, and Iowa. (2) Data for quarter ended March 31, 2013. (3) Other includes pet coke, asphalt, natural gas liquids (“NGLs”), slurry, sulfur, gas oil and specialty products such as propylene and solvents, excludes internally produced fuel. Leading independent mid-con refiner with strategically located refineries and supporting logistics assets 2 Key operational data (2): Production (205,568 bpd) (3) Wynnewood Refinery CVR Refining Crude Transportation CVR Refining Crude Oil Pipeline Third-Party Crude Oil Pipeline CVR Refining Headquarters Other PADD II Group 3 refineries Coffeyville Refinery Legend Crude throughput (194,816 bpd) Refinery Nameplate Capacity (Mbpd) Complexity Coffeyville 115 12.9 Wynnewood 70 9.3 CVR Refining 185 11.5 Gasoline 47.8% Distillate 40.8% Other 11.4% Sweet 80.4% Medium 7.6% Heavy sour 12.0% Bakken |
|
|
115,000 bpd of nameplate crude throughput capacity 12.9 complexity Located in Kansas in Group 3 of the PADD II region Access to cost-advantaged, WTI price-linked crude oils (100% of crude slate) – local and Canadian ~100 miles from Cushing, Oklahoma High complexity refinery with quarter ended March 31, 2013 product yield including gasoline (46.7%), distillate (41.6%), and pet coke and other specialty products (11.7%) Sales and distribution primarily to the central mid-continent Over $700 million invested since 2005 to modernize the refinery and meet more stringent environmental, health, and safety requirements Two-phase turnaround completed in early 2012 at a total cost of ~$89 million High Quality Refineries: Coffeyville 2005 (Acquisition year) Current Operational Upgrades Invested $700 million since 2005 Now, one of the most flexible Mid-Con refineries Crude throughput capacity (bpsd) (4) <90,000 ~125,000 Feedstock flexibility No heavy sour Up to 25,000 bpd Complexity 10.3 12.9 Gathered Barrels Capacity (bpd) ~7,000 > 50,000 Summary Crude oil & product mix (1) Management’s proven track record (1) For the quarter ended March 31, 2013. (2) Other includes pet coke, asphalt, NGLs, slurry, sulfur and gas oil, excludes internally produced fuel. (3) Includes 5.0% by volume used as blendstock. (4) Barrels per stream day (“bpsd”). 3 Crude oil throughput Production 123,639 bpd 133,733 bpd Heavy sour 18.9% Light/medium sour 0.4% Sweet 80.7% Other (2) 11.7% Distillate 41.6% Gasoline 46.7% (3) |
|
|
High Quality Refineries: Wynnewood 70,000 bpd of nameplate crude throughput capacity 9.3 complexity Located in Oklahoma in Group 3 of the PADD II region Access to local cost-advantaged, WTI price-linked crude oils (100% of crude slate) For the quarter ended March 31, 2013 product yield includes gasoline (49.8%), distillate (39.3%), asphalt and other products (10.9%) Sales and distributions primarily to Oklahoma market Turnaround was completed in Q4 2012 for a total of ~$102 million Project Opportunity Logistics Opportunity to share feedstocks based on unit economics Crude slate Optimize crudes to improve consumed crude differentials and improve realized refining margin Rail options Wynnewood connected to a BNSF main line Property can accommodate new track and off-take infrastructure Storage options Currently 500,000 barrels of storage Sufficient land for significant additional storage / blending tanks Summary Asset improvement opportunities 4 Crude oil & product mix (1) Light/medium sour 20.0% Production 71,177 bpd 71,835 bpd Crude oil throughput Sweet 80.0% (1) For quarter ended March 31, 2013. (2) Other includes asphalt, NGLs, slurry, sulfur, gas oil and specialty products such as propylene and solvents, excludes internally produced fuel. (2) Gasoline 49.8% Distillate 39.3% Other 10.9% |
|
|
Source: EIA and Wall Street research. (1) PADD II consolidated refinery statistics. (2) For the quarter ended March 31, 2013. NTI as of December 31, 2012. (3) Operating expenses calculated on a per barrel of crude throughput and excluding SG&A and direct turnaround expenses. TSO operating expenses include manufacturing expenses and other operating expenses. High Quality Assets Favorable high distillate yield (2) “Top quartile” consolidated asset profile (1) Low cost operator (operating expenses in $/bbl) (2) (3) 5 Median Capacity: 185.0 Median Complexity 9.7 NCRA CMC SR Capacity: 185 kbpd (Coffeyville & Wynnewood) Complexity: 11.5 (blended average) 0.0 2.0 4.0 6.0 8.0 10.0 12.0 14.0 16.0 0 50 100 150 200 250 300 350 400 450 500 550 600 650 700 Crude Unit Processing Capacity (000's bpd) Complexity Index |
|
|
Strategically Located Mid-con Refineries CVR Refining asset locations Strategically located refineries Source: EIA and Wall Street research. Located in the Group 3 of the PADD II region which currently has access to lower cost mid-continent domestic sweet and sour crude oils Located near the current crude export bottleneck at Cushing Near emerging mid-continent shale plays such as the Niobrara in the DJ basin and the Mississippian Lime in Northern Oklahoma and Southwestern Kansas Served by major pipelines (Keystone, Spearhead) with access to various light and heavy grade Canadian crude oils Close proximity to, and substantial controlled storage capacity at, Cushing minimizes the likelihood of a supply interruption Supply-constrained products market with transportation and crude cost advantage relative to Gulf Coast refineries 6 Canada TX AR OK MO IA NE SD ND WY MT UT MN IL Houston Shidler Kansas City Cushing Midland Des Moines Sioux Falls Sioux City Oklahoma City Tulsa Topeka Seaway Pipeline Basin Pipeline Wichita Falls CO KS Plainville Phillipsburg Jayhawk Pipeline Spearhead Pipeline Denver Clearbrook Flanagan Enbridge Pipeline NM Bakken WI DJ Basin (Niobrara) Keystone Pipeline Salt Lake City Jackson Anadarko Basin (Miss Lime) Columbia Freeport Sugar Land Wichita Coffeyville Permian Basin LA Omaha Bartlesville Wynnewood Refinery CVR Refining Crude Transportation CVR Refining crude Oil Pipeline Third-Party Crude Oil Pipeline CVR Refining Headquarters Other PADD II Group 3 refineries Coffeyville Refinery Legend |
|
|
Historical Forecast (MMbpd) 2016 – 2026 increase: + 48% 2011 – 2016 increase: + 41% Crude Advantage Sustainable Long Term We expect WTI to continue to trade at a discount to Brent over the long term, but anticipate that this discount will vary over time Canadian production currently exceeds existing transportation capacity south to the U.S. Increasing domestic and Canadian crude oil production Regional Play Oil and NGL Forecasts Western Canada Crude Oil Forecasts Source: Investment Technology Group. Note: Anadarko Basin includes Mississippian Lime, Granite Wash, Cleveland Tonkawa, Marmaton; DJ Niobrara includes horizontal wells only. Source: Canadian Association of Petroleum Refiners, “Crude Oil Forecast, Markets & Pipelines, June 2012.” Note: Oil sands includes upgraded conventional, imported condensate, manufactured diluent from upgraders and upgraded heavy volumes coming from upgraders. (MMbpd) 2016 – 2026 increase: + 29% 2011 – 2016 increase: + 68% 7 0 1 2 3 4 5 6 Conventional Oil Sands |
|
|
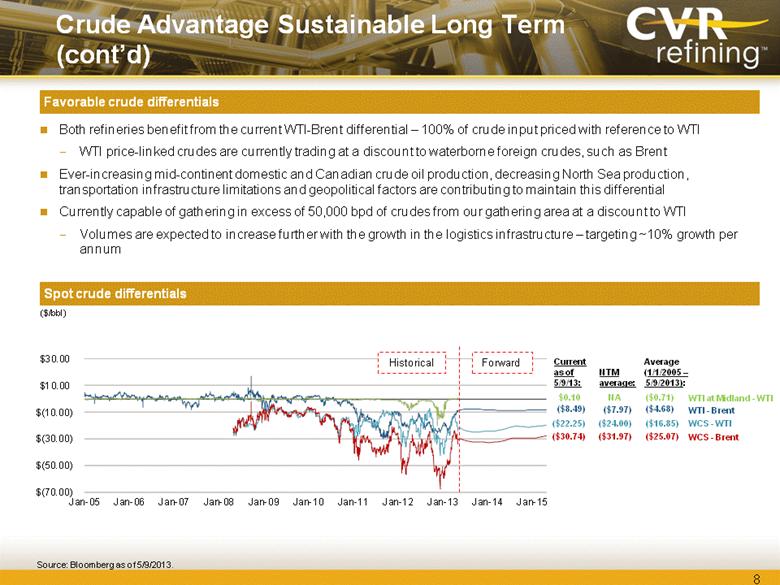
Crude Advantage Sustainable Long Term (cont’d) Both refineries benefit from the current WTI-Brent differential – 100% of crude input priced with reference to WTI WTI price-linked crudes are currently trading at a discount to waterborne foreign crudes, such as Brent Ever-increasing mid-continent domestic and Canadian crude oil production, decreasing North Sea production, transportation infrastructure limitations and geopolitical factors are contributing to maintain this differential Currently capable of gathering in excess of 50,000 bpd of crudes from our gathering area at a discount to WTI Volumes are expected to increase further with the growth in the logistics infrastructure – targeting ~10% growth per annum Favorable crude differentials Spot crude differentials ($/bbl) 8 Source: Bloomberg as of 5/9/2013. Historical Forward Current as of 5/9/13: Average (1/1/2005 – 5/9/2013): ($22.25) ($16.85) WCS - WTI ($8.49) ($4.68) WTI - Brent NTM average: ($7.97) ($24.00) ($30.74) ($25.07) WCS - Brent ($31.97) $0.10 ($0.71) WTI at Midland - WTI NA Brent Differentials Current as of 11/2/12: Average (1/1/2005 - 11/2/2012): ($27.26) ($3.94) WTI at Midland - Brent ($27.66) ($7.06) WTS - Brent ($52.51) ($19.20) WCS - Brent $(70.00) $(50.00) $(30.00) $(10.00) $10.00 $30.00 Jan-05 Jan-06 Jan-07 Jan-08 Jan-09 Jan-10 Jan-11 Jan-12 Jan-13 Jan-14 Jan-15 |
|
|
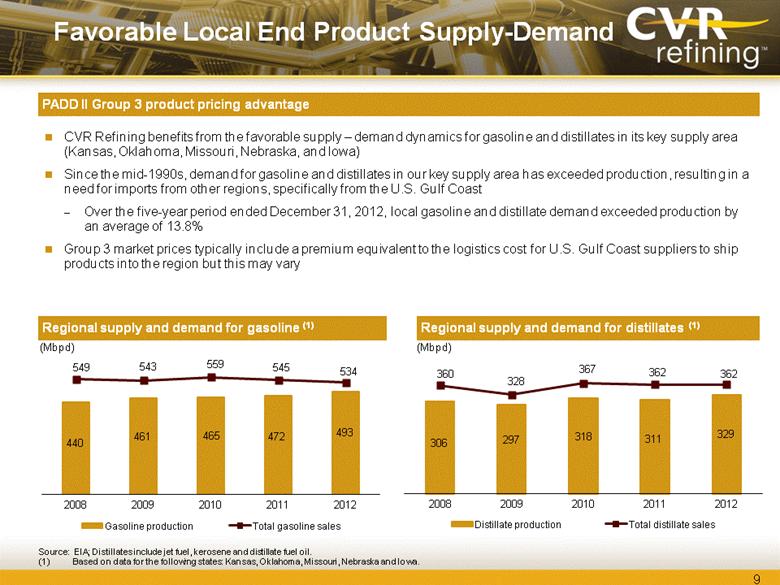
CVR Refining benefits from the favorable supply – demand dynamics for gasoline and distillates in its key supply area (Kansas, Oklahoma, Missouri, Nebraska, and Iowa) Since the mid-1990s, demand for gasoline and distillates in our key supply area has exceeded production, resulting in a need for imports from other regions, specifically from the U.S. Gulf Coast Over the five-year period ended December 31, 2012, local gasoline and distillate demand exceeded production by an average of 13.8% Group 3 market prices typically include a premium equivalent to the logistics cost for U.S. Gulf Coast suppliers to ship products into the region but this may vary Favorable Local End Product Supply-Demand 9 Regional supply and demand for distillates (1) (Mbpd) Regional supply and demand for gasoline (1) (Mbpd) Source: EIA; Distillates include jet fuel, kerosene and distillate fuel oil. (1) Based on data for the following states: Kansas, Oklahoma, Missouri, Nebraska and Iowa. PADD II Group 3 product pricing advantage |
|
|
Strong Operating Track Record Utilization rate (1) High average annual refining utilization rate of 93.3% over 2009 – 2012 Source: Company data and peer group filings. (1) Refinery utilization defined as crude throughput divided by the capacity of the refinery. (2) 2009 and 2010 utilization rate is not pro forma for the Wynnewood acquisition. (3) 2011 utilization rate is full year pro forma for Wynnewood acquisition. 10 (2) (2) (3) 93.3% 94.1% 98.6% 92.4% 91.5% 105.3% 2009 - 2012 average 2009 2010 2011 2012 Q1 2013 95.0% 94.1% 98.6% 92.4% 93.1% 2009 - 2011 average 2009 2010 2011 YTD Sept 30, 2012 2009 - 2011 p eer average: 87.1% 87.1% |
|
|
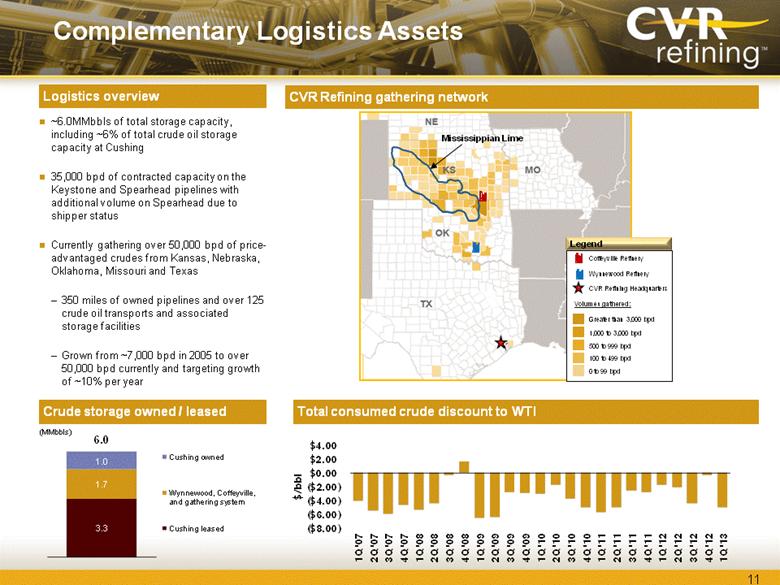
Complementary Logistics Assets Logistics overview ~6.0MMbbls of total storage capacity, including ~6% of total crude oil storage capacity at Cushing 35,000 bpd of contracted capacity on the Keystone and Spearhead pipelines with additional volume on Spearhead due to shipper status Currently gathering over 50,000 bpd of price-advantaged crudes from Kansas, Nebraska, Oklahoma, Missouri and Texas 350 miles of owned pipelines and over 125 crude oil transports and associated storage facilities Grown from ~7,000 bpd in 2005 to over 50,000 bpd currently and targeting growth of ~10% per year CVR Refining gathering network Crude storage owned / leased Total consumed crude discount to WTI (MMbbls) 11 Greater than 3,000 bpd 1,000 to 3,000 bpd 500 to 999 bpd 100 to 499 bpd 0 to 99 bpd Coffeyville Refinery Wynnewood Refinery CVR Refining Headquarters Legend Volumes gathered: Mississippian Lime 1.7 3.3 1.0 Cushing owned Wynnewood, Coffeyville, and gathering system Cushing leased 6.0 ($8.00) ($6.00) ($4.00) ($2.00) $0.00 $2.00 $4.00 1Q'07 2Q'07 3Q'07 4Q'07 1Q'08 2Q'08 3Q'08 4Q'08 1Q'09 2Q'09 3Q'09 4Q'09 1Q'10 2Q'10 3Q'10 4Q'10 1Q'11 2Q'11 3Q'11 4Q'11 1Q'12 2Q'12 3Q'12 4Q'12 1Q'13 $/bbl |
|
|
Seasoned Management Team with Proven Track Record of Success Jack Lipinski CEO & President Edmund Gross SVP, General Counsel & Secretary Prior to the formation of CVR, Mr. Lipinski served as CEO and President of Coffeyville Resources, LLC since 2005 Mr. Lipinski has over 40 years of experience in the petroleum refining industry Prior to the formation of CVR, Mr. Gross served as General counsel and Secretary of Coffeyville Resources, LLC Mr. Gross was previously of Counsel at Stinson Morrison Hecker LLP in Kansas City, Missouri Susan Ball Chief Financial Officer & Treasurer Wyatt Jernigan EVP, Crude Acquisition & Petroleum Marketing Prior to joining CVR, Ms. Ball served as a Tax Managing Director with KPMG LLP Ms. Ball has over 25 years of experience in the accounting industry Prior to the formation of CVR, Mr. Jernigan served as EVP – Crude & Feedstocks at Coffeyville Resources, LLC Mr. Jernigan has over 35 years of experience in the petroleum industry Chris Swanberg VP, Environmental, Health & Safety Prior to the formation of CVR, Mr. Swanberg served as VP, Environmental, Health and Safety at Coffeyville Resources, LLC Mr. Swanberg worked previously at ARCO and Lyondell Citgo Refining in a similar capacity Stanley Riemann Chief Operating Officer Robert Haugen EVP, Refining Operations Prior to the formation of CVR, Mr. Riemann served as COO for Coffeyville Resources, LLC Mr. Riemann previously spent over 30 years at Farmland Industries, Inc., most recently as EVP in the Energy and Crop Nutrient Division Prior to the formation of CVR, Mr. Haugen served as EVP – Engineering & Construction at Coffeyville Resources, LLC Mr. Haugen has over 30 years of experience in the refining, petrochemical and nitrogen fertilizer industries 12 David L. Landreth VP, Economics & Planning Prior to the formation of CVR, Mr. Landreth served as VP, Economics and Planning of Coffeyville Resources, LLC Mr. Landreth has more than 30 years experience in refining and petrochemicals |
|
|
Financial Overview |

|
|
Source: Company filings. Note: 2009 and 2010 numbers for Coffeyville only. (1) Refining margin per crude oil throughput barrel adjusted for FIFO impact. Calculated as the difference between net sales and cost of product sold (exclusive of depreciation and amortization) adjusted for FIFO impact. (2) Represents EBITDA adjusted for FIFO impact, share-based compensation, loss on extinguishment of debt, major scheduled turnaround expenses, Wynnewood acquisition transaction fees and integration expenses, loss on disposition of assets and net unrealized gain (loss) on derivatives. Historical Financial Summary Refinery crude throughput Refining gross margin (1) Capital expenditures 14 Adjusted EBITDA (2) (mbpd) ($ in millions) ($/bbl) ($ in millions) Pro forma for Wynnewood acquisition Pro forma for Wynnewood acquisition Pro forma for Wynnewood acquisition Pro forma for Wynnewood acquisition $34.0 $21.2 $87.6 $120.2 $35.5 $44.6 2009 2010 2011 2012 Q1 2012 Q1 2013 108.2 113.4 162.4 169.4 146.7 194.8 2009 2010 2011 2012 Q1 2012 Q1 2013 |
|
|
Hedging Policy Locks in Attractive Spreads Hedged an average of ~68,000 bpd of production for 2013 and ~12,000 bpd for 2014 Crack spreads hedged at an average $26.43/bbl for 2013 and $33.04/bbl for 2014 Hedging provides protection in a downside scenario Ability to cover costs in a severe downside scenario 15 (1) Hedged crack spreads represent weighted-average price of all positions for respective quarters. Data as of April 29, 2013. 2014 cracks are all distillate cracks. Commodity Swaps Barrels Fixed Price(1) Fourth Quarter 2012 5,850,000 23.50 First Quarter 2013 6,375,000 24.95 Second Quarter 2013 5,400,000 26.85 Third Quarter 2013 5,175,000 25.31 Fourth Quarter 2013 3,525,000 24.66 Total 26,325,000 25.05 Hedging Summary(1) 6.6 7.7 5.8 4.9 3.0 1.4 0.1 0.1 $15.00 $17.00 $19.00 $21.00 $23.00 $25.00 $27.00 $29.00 $31.00 $33.00 $35.00 0.0 1.0 2.0 3.0 4.0 5.0 6.0 7.0 8.0 9.0 10.0 Q1 '13 Q2 '13 Q3 '13 Q4 '13 Q1 '14 Q2 '14 Q3 '14 Q4 '14 Hedged bbls (millions) Hedged crack spread ($/bbl) |
|
|
Financial Strategy As of March 31, 2013, the cash balance at CVRR was $525 million Cash balance includes IPO proceeds that pre-funded certain planned environmental expenditures Strong liquidity through committed credit facilities ($400 million ABL) Intermediation arrangement with Vitol reduces working capital requirements Liquidity management Capital structure $500.0 million of unsecured notes Debt covenants allow for distributions when fixed charge coverage ratio is 2.5x or higher $150 million senior unsecured credit facility with CVR Energy to fund growth capex program Distributions First distribution of $1.58 per common unit paid on May 17, 2013 to unit holders of record on May 10, 2013 Represents pro-rated first quarter 2013 distribution since IPO Calculated full first quarter 2013 distribution would have been $1.76 per common unit Variable distribution with no MQD and no IDRs – 100% of available cash to be distributed Cash is reserved ratably for turnaround costs associated with both refineries as well as expected environmental and maintenance capital expenditures 16 |
|
|
Appendix |

|
|
EBITDA. EBITDA represents net income before (i) interest expense and other financing costs, net of interest income, (ii) income tax expense and (iii) depreciation and amortization. Management believes that EBITDA enables investors to better understand our ability to make distributions to our common unitholders, evaluate our ongoing operating results and allows for greater transparency in reviewing our overall financial, operational and economic performance. 18 Non-GAAP Financial Measures |
|
|
Adjusted EBITDA. Adjusted EBITDA represents EBITDA adjusted for FIFO impacts (favorable) unfavorable; non-cash share-based compensation; non-cash major scheduled turnaround expenses; loss on disposition of fixed assets; unrealized (gain) loss on derivatives, net loss on extinguishment of debt and expenses associated with the Gary-Williams acquisition. Management believes that Adjusted EBITDA enables investors to better understand our ability to make distributions to our common unit holders, evaluate our ongoing operating results and allows for greater transparency in reviewing our overall financial, operational and economic performance. 19 Non-GAAP Financial Measures (cont’d) |
|
|
Direct Operating Expenses (Excluding Major Scheduled Turnaround Expenses) Per Crude Oil Throughput Barrel. Direct operating expenses excluding major scheduled turnaround expenses per crude oil throughput barrel is a measurement calculated by excluding major scheduled turnaround expenses from direct operating expenses (exclusive of depreciation and amortization) divided by our refineries’ crude oil throughput volumes for the respective periods presented. Direct operating expenses excluding major scheduled turnaround expenses per crude oil throughput barrel is a supplemental measure of our performance that is not required by, nor presented in accordance with, GAAP. Management believes direct operating expenses excluding major scheduled turnaround expenses per crude oil throughput most directly represents ongoing direct operating expenses at our refineries. 20 Non-GAAP Financial Measures (cont’d) |
|
|
Gross Profit (Excluding Major Scheduled Turnaround Expenses and Adjusted for FIFO Impact) Per Crude Oil Throughput Barrel. Gross profit excluding major scheduled turnaround expenses and adjusted for FIFO impact per crude oil throughput barrel is calculated as the difference between net sales, cost of product sold (exclusive of depreciation and amortization) adjusted for FIFO impact, direct operating expenses (exclusive of depreciation and amortization) excluding scheduled turnaround expenses divided by our refineries’ crude oil throughput volumes for the respective periods presented. Gross profit excluding major scheduled turnaround expenses and adjusted for FIFO impact is a non-GAAP measure that should not be substituted for gross profit or operating income. Management believes it is important to investors in evaluating our refineries’ performance and our ongoing operating results. Our calculation of gross profit excluding major scheduled turnaround expenses and adjusted for FIFO impact per crude oil throughput may differ from similar calculations of other companies in our industry, thereby limiting its usefulness as a comparative measure. 21 Non-GAAP Financial Measures (cont’d) |
|
|
Refining Margin Per Crude Oil Throughput Barrel. Refining margin per crude oil throughput barrel is a measurement calculated as the difference between net sales and cost of product sold (exclusive of depreciation and amortization) divided by our refineries’ crude oil throughput volumes for the respective periods presented. Refining margin per crude oil throughput barrel is a non-GAAP measure that should not be substituted for gross profit or operating income. Management believes this measure is important to investors in evaluating our refineries’ performance as a general indication of the amount above our cost of product sold that we are able to sell refined products. Our calculation of refining margin per crude oil throughput barrel may differ from similar calculations of other companies in our industry, thereby limiting its usefulness as a comparative measure. We use refining margin per crude oil throughput barrel as the most direct and comparable metric to a crack spread which is an observable market indication of industry profitability. 22 Non-GAAP Financial Measures (cont’d) |
|
|
Refining Margin Per Crude Oil Throughput Barrel Adjusted for FIFO Impact. Refining margin per crude oil throughput barrel adjusted for FIFO impact is a measurement calculated as the difference between net sales and cost of product sold (exclusive of depreciation and amortization) adjusted for FIFO impact divided by our refineries’ crude oil throughput volumes for the respective periods presented. Refining margin adjusted for FIFO impact is a non-GAAP measure that we believe is important to investors in evaluating our refineries’ performance as a general indication of the amount above our cost of product sold (taking into account the impact of our utilization of FIFO) that we are able to sell refined products. Our calculation of refining margin adjusted for FIFO impact may differ from calculations of other companies in our industry, thereby limiting its usefulness as a comparative measure. Under our FIFO accounting method, changes in crude oil prices can cause fluctuations in the inventory valuation of our crude oil, work in process and finished goods, thereby resulting in favorable FIFO impacts when crude oil prices increase and unfavorable FIFO impacts when crude oil prices decrease. 23 Non-GAAP Financial Measures (cont’d) |
|
|
(a) FIFO is our basis for determining inventory value on a GAAP basis. Changes in crude oil prices can cause fluctuations in the inventory valuation of our crude oil, work in process and finished goods thereby resulting in favorable FIFO impacts when crude oil prices increase and unfavorable FIFO impacts when crude oil prices decrease. The FIFO impact is calculated based upon inventory values at the beginning of the accounting period and at the end of the accounting period. Non-GAAP Financial Measures (cont’d) 24 ($ in millions) CVR Refining, LP Pro Forma Year Ended December 31, 2009 2010 2011 2012 2012 2013 2011 (unaudited) Net Income 64.6 $ 38.2 $ 480.3 $ 595.3 $ (37.4) $ 275.4 $ 749.0 $ Add: Interest expense and other financing costs 43.8 49.7 53.0 76.2 18.8 14.1 41.7 Depreciation and amortization 64.4 66.4 69.8 107.6 26.3 28.0 98.9 EBITDA 172.8 154.3 603.1 779.1 7.7 317.5 889.6 Add: FIFO impact (favorable)/unfavorable (a) (67.9) (31.7) (25.6) 58.4 (19.3) (4.7) (46.6) Share-based compensation, non-cash 2.5 11.5 8.9 18.5 1.8 3.5 8.9 Loss on disposition of assets - 1.3 2.5 - - - 2.5 Loss on extinguishment of debt 2.1 16.6 2.1 37.5 - 26.1 2.1 Wynnewood acquisition transaction fees and integration expenses - - 5.2 11.0 3.7 - 5.2 Major scheduled turnaround expense - 1.2 66.4 123.7 21.0 - 66.4 Unrealized (gain) loss on derivatives, net 37.8 (0.6) (85.3) 148.0 128.1 (32.5) (85.4) Adjusted EBITDA 147.3 $ 152.6 $ 577.3 $ 1,176.2 $ 143.0 $ 309.9 $ 842.7 $ Year Ended December 31, CVR Refining, LP Historical Combined Quarter Ended March 31, |
|
|
Non-GAAP Financial Measures (cont’d) 25 ($ in millions, except per barrel data) 2009 2010 2011 2012 2012 2013 Direct operating expenses 142.2 $ 153.1 $ 247.7 $ 426.5 $ 92.7 $ 86.0 $ Less: major scheduled turnaround expense - (1.2) (66.4) (123.7) (21.0) 0.0 Direct operating expenses excluding major scheduled turnaround expenses 142.2 151.9 181.3 302.8 71.7 86.0 Crude oil throughput (bpd) 108,226 113,365 103,702 169,356 146,658 194,816 Direct operating expenses excluding major scheduled turnaround expenses per crude oil throughput barrel 3.60 $ 3.67 $ 4.79 $ 4.89 $ 5.38 $ 4.91 $ Year Ended December 31, Quarter Ended March 31, CVR Refining, LP Historical Combined |
|
|
Non-GAAP Financial Measures (cont’d) 26 ($ in millions, except per barrel data) 2009 2010 2011 2012 2012 2013 Net sales 2,936.5 $ 3,905.6 $ 4,752.8 $ 8,281.7 $ 1,898.5 $ 2,274.0 $ Cost of product sold 2,515.9 3,539.8 3,927.6 6,667.5 1,630.7 1,805.8 Direct operating expenses 142.2 153.1 247.7 426.5 92.7 86.0 Depreciation and amortization 64.4 66.4 69.8 107.6 26.3 28.0 Gross profit 214.0 146.3 507.7 1,080.1 148.8 354.2 Add: Major scheduled turnaround expense - 1.2 66.4 123.7 21.0 - FIFO impact (favorable)/unfavorable (67.9) (31.7) (25.6) 58.4 (19.3) (4.7) Gross profit excluding major scheduled turnaround expenses and 146.1 115.8 548.5 1,262.2 150.5 349.5 adjusted for FIFO impact Crude oil throughput (bpd) 108,226 113,365 103,702 169,356 146,658 194,816 Gross profit excluding major scheduled turnaround expenses and 3.70 $ 2.80 $ 14.49 $ 20.36 $ 11.28 $ 19.93 $ adjusted for FIFO impact per barrel Year Ended December 31, Quarter Ended March 31, CVR Refining, LP Historical Combined |
|
|
Non-GAAP Financial Measures (cont’d) 27 ($ in millions, except per barrel data) CVR Refining, LP Pro Forma Year Ended December 31, 2009 2010 2011 2012 2012 2013 2011 (unaudited) Net sales 2,936.5 $ 3,905.6 $ 4,752.8 $ 8,281.7 $ 1,898.5 $ 2,274.0 $ 7,398.3 $ Less: cost of product sold 2,515.9 3,539.8 3,927.6 6,667.5 1,630.7 1,805.8 6,126.0 Refining margin 420.6 365.8 825.2 1,614.2 267.8 468.2 1,272.3 FIFO impact (favorable)/unfavorable (67.9) (31.7) (25.6) 58.4 (19.3) (4.7) (46.6) Refining margin adjusted for FIFO impact 352.7 334.1 799.6 1,672.6 248.5 463.5 1,225.7 Crude oil throughput (bpd) 108,226 113,365 103,702 169,356 146,658 194,816 162,437 Refining margin per crude oil throughput barrel 10.65 $ 8.84 $ 21.80 $ 26.04 $ 20.07 $ 26.71 $ 21.46 $ Refining margin per crude oil throughput barrel adjusted for FIFO impact 8.93 $ 8.07 $ 21.12 $ 26.98 $ 18.62 $ 26.44 $ 20.67 $ Year Ended December 31, Quarter Ended March 31, CVR Refining, LP Historical Combined |