Attached files
| file | filename |
|---|---|
| 8-K - FORM 8-K - SmartStop Self Storage, Inc. | d540533d8k.htm |
 First Quarter
Update May 21, 2013
Strategic Storage Trust, Inc.
Exhibit 99.1 |
 Disclaimers
CAUTIONARY NOTE REGARDING FORWARD-LOOKING STATEMENTS
Certain
statements
contained
in
this
material,
other
than
historical
facts,
may
be
considered
forward-looking
statements
within
the
meaning
of
Section
27A
of
the
Securities
Act
of
1933,
as
amended
(the
“Securities
Act”)
and
Section
21E
of
the
Securities
Exchange
Act
of
1934,
as
amended
(the
“Exchange
Act”).
We
intend
for
all
such
forward
looking
statements
to
be
covered
by
the
applicable
safe
harbor
provisions
for
forward-looking
statements
contained
in
Section
27A
of
the
Securities
Act
and
Section
21E
of
the
Exchange
Act,
as
applicable.
Such
statements
include,
in
particular,
statements
about
our
plans,
strategies,
and
prospects
and
are
subject
to
certain
risks
and
uncertainties,
including
known
and
unknown
risks,
which
could
cause
actual
results
to
differ
materially
from
those
projected
or
anticipated.
Therefore,
such
statements
are
not
intended
to
be
a
guarantee
of
our
performance
in
future
periods.
Such
forward-looking
statements
can
generally
be
identified
by
our
use
of
forward-looking
terminology
such
as
“may,”
“will,”
“expect,”
“intend,”
“anticipate,”
“estimate,”
“believe,”
“continue,”
or
other
similar
words.
Readers
are
cautioned
not
to
place
undue
reliance
on
these
forward-looking
statements,
which
speak
only
as
of
the
date
this
report
is
filed
with
the
Securities
and
Exchange
Commission.
We
cannot
guarantee
the
accuracy
of
any
such
forward
looking
statements
contained
in
this
material,
and we do not intend to publicly update or revise any forward-looking statements, whether
as a result of new information, future events, or otherwise. Any
such
forward-looking
statements
are
subject
to
risks,
uncertainties,
and
other
factors
and
are
based
on
a
number
of
assumptions
involving
judgments
with
respect
to,
among
other
things,
future
economic,
competitive,
and
market
conditions,
all
of
which
are
difficult
or
impossible
to
predict
accurately.
To
the
extent
that
our
assumptions
differ
from
actual
results,
our
ability
to
meet
such
forward-looking
statements,
including
our
ability
to
generate
positive
cash
flow
from
operations
and
provide
distributions
to
stockholders,
and
our
ability
to
find
suitable
investment
properties,
may
be
significantly
hindered.
All
forward-looking
statements
should
be
read
in
light
of
the
risks
identified
in
our
prospectus
and
supplements.
Risk Factors
2
•
See our Form 10-K, Form 10-K/A, and recent Form 10-Q for specific risks associated
with an investment in Strategic Storage Trust, Inc. •
As of March 31, 2013, our accumulated deficit was approximately $64.1 million, and our
operations will not be profitable in 2013. •
No public market currently exists for shares of our common stock
and we may not list our shares on a national securities exchange before three to five years
after completion of this offering, if at all. It may be difficult to sell your shares.
If you sell your shares, it will likely be at a substantial discount.
•
We have paid distributions from sources other than our cash flows from operations, including
from the net proceeds from our initial public offering. We are not prohibited from
undertaking such activities by our charter, bylaws or investment
policies, and we may use an unlimited amount from any source to
pay our distributions. Until we generate
operating cash flows sufficient to pay distributions to you, we may pay distributions from the
net proceeds of this offering or from borrowings in anticipation of future cash flows.
We also may be required to sell assets or issue new securities for cash in order to pay
distributions. Any such actions could reduce the amount of capital we ultimately invest in
assets and negatively impact the amount of income available for future distributions.
•
We have no employees and must depend on our advisor to select investments and conduct our
operations, and there is no guarantee that our advisor will devote adequate time or
resources to us. •
Our board of directors may change any of our investment objectives, including our focus on
self storage facilities. •
We will pay substantial fees and expenses to our advisor, its affiliates and participating
broker-dealers, which will reduce cash available for investment and distribution.
•
There are substantial conflicts of interest among us and our sponsor, advisor, property
manager and dealer manager. •
We may fail to remain qualified as a REIT, which could adversely
affect our operations and our ability to make distributions.
•
We may incur substantial debt, which could hinder our ability to
pay distributions to our stockholders or could decrease the value of your investment.
•
Future distribution declarations are at the sole discretion of our board of directors and are
not guaranteed. Since our inception, our cumulative distributions have exceeded
cumulative GAAP earnings. We cannot assure you that we will achieve any of our investment
objectives. •
We encourage you to review our SEC filings at www.sec.gov.
Disclaimer and Risk Factors |
 Strategic
Storage Trust, Inc. About Us
3
•
First and only publicly registered non-traded REIT
focused on self storage
•
Sponsor was ranked 7th in Mini-Storage Messenger’s
Top Operators List in 2012
•
As of 3/31/13, SSTI wholly owned 110 properties in
17 states and Ontario, Canada with approximately
70,000 units and approximately 9.2 million rentable
square feet |
 Investment
Philosophy Stabilized Properties
•
70% occupancy
•
More predictable income
Lease-Up Properties
•
Occupancy below 70%
•
Greater opportunity for growth
Stabilized + Lease-Up Properties
=
Income + Growth
=
Stockholder Value
4 |
 Agenda
•
Performance Highlights
•
Portfolio Update
•
Self Storage Operations –
Why it Works
•
Vision
5 |
 Performance
Highlights Cash Flow from Operations
•
$2 Million for Three Months Ended 3/31/2012
•
$4 Million for Three Months Ended 3/31/2013
103%
IPA Modified Funds from Operations
•
$1.1 Million for Three Months Ended 3/31/2012
•
$4.6 Million for Three Months Ended 3/31/2013
315%
6 |
 Performance
Highlights IPA Modified Funds From Operations
•
10% increase in Q1 2013 vs. Q4 2012
•
74% increase in Q1 2013 vs. Q3 2012
•
373% increase in Q1 2013 vs. Q2 2012
•
315% increase in Q1 2013 vs. Q1 2012
7 |
 Performance
Highlights Same Store Performance
•
First Quarter 2013 vs. 2012
•
Revenues
9.0%
•
Net Operating Income
19.0%
2013
2012
•
Property Operating Expenses as a
Percentage of Revenue
39.9%
45%
•
Number of Facilities
90
90
•
Occupancy
81%
73%
8 |
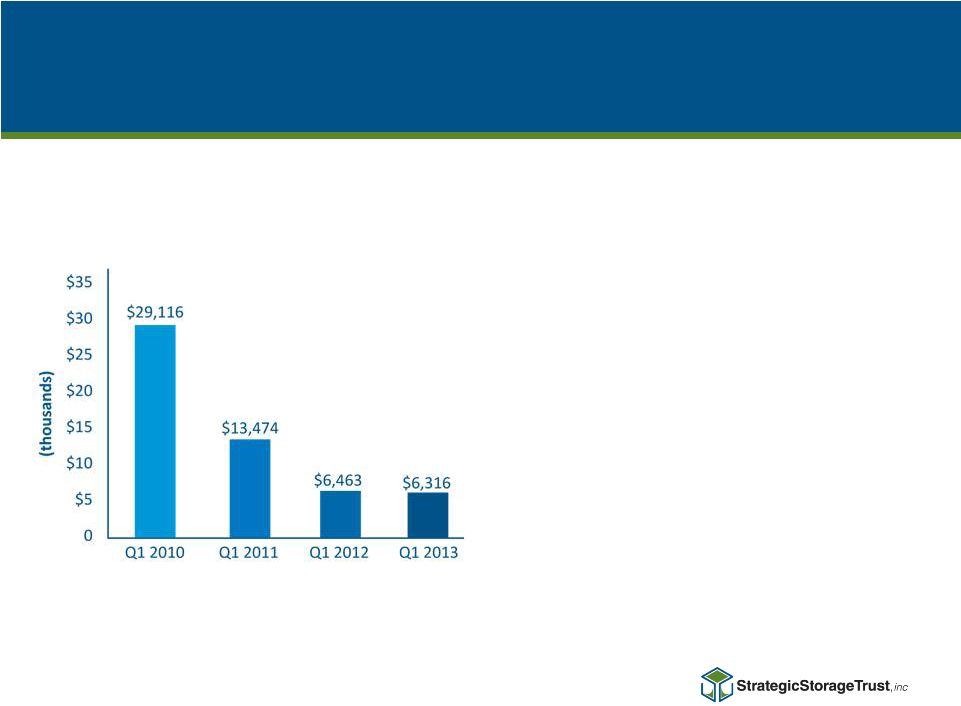 Performance
Highlights G&A Per Property
Q1
2010
$29,116
Q1
2011
$13,474
(53.7% decrease)
Q1
2012
$6,463
(52.0% decrease)
Q1
2013
$6,316
(2.3% decrease)
G&A Per Property by Quarter
9 |
 Agenda
•
Performance Highlights
•
Portfolio Update
•
Self Storage Operations –
Why it Works
•
Vision
10 |
 Portfolio
Update Wholly-Owned Properties by Year
11 |
 Portfolio
Update 12
Rentable Square Feet
by State (as of 3/31/13)
•
110 properties
•
17 states, 1 province
•
70,190 units
•
9.2 million SF |
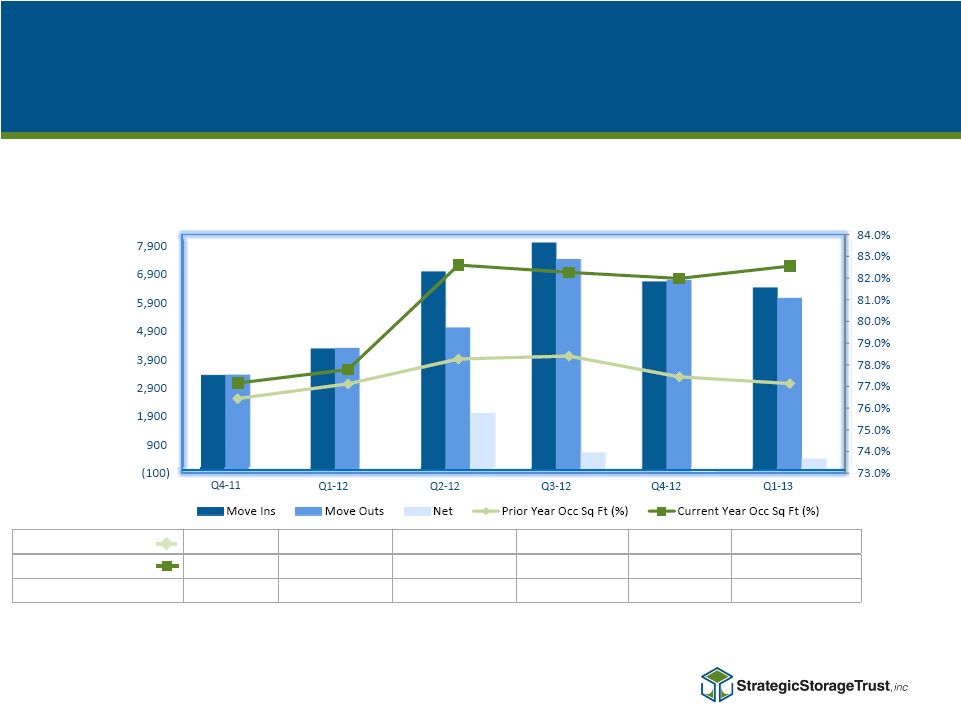 Portfolio
Update Prior Year Occ Sq Ft (%)
76.4%
76.1%
78.3%
78.4%
77.4%
73.3%
Current Year Occ Sq Ft (%)
77.2%
77.1%
82.6%
82.3%
82.0%
81.6%
No. of Properties
41
45
60
71
76
89
13
* Note: Highest occupancy achieved in 2011 was 79.3% on 7/31/11.
Does not include Canadian properties, but does include consolidated joint venture, SF
property. Same Store Occupancy
Q4 -
2011 -
Q1 -
2013 |
 Portfolio
Update Occ Sq Ft(%)
51.00%
61.00%
67.10%
69.00%
74.60%
Q1-12
Q2-12
Q3-12
Q4-12
Q1-13
14 |
 Portfolio
Update No. of Properties
8
8
10
16
16
16
16
16
16
Occ Sq Ft (%)
60.90%
63.00%
65.80%
72.60%
73.80%
75.10%
75.80%
77.40%
78.90%
15
Note: At acquisition, the occupancy for the properties in this portfolio was 71.3% for
combined 16 stores |
 Agenda
•
Performance Highlights
•
Portfolio Update
•
Self Storage Operations –
Why it Works
•
Vision
16 |
 Self Storage
Operations – Why it Works
Self Storage Is An Operating Business
Increasing Revenues
Decreasing Expenses
Increasing Occupancy
=
Increasing Net Operating Income
17
Because We Can |
 Increasing
Revenues -
Existing customers
-
Street (asking) rates
-
Merchandise sales
-
Truck rentals
Self Storage Operations –
Why it Works
18
•
Increasing rates based on dynamic pricing
•
Convenience fees
•
Tenant insurance
•
Ancillary sales |
 Self Storage
Operations – Why it Works
Decreasing Expenses
19
•
Largest Components
•
Economies of Scale
•
National Pricing Power |
 Self Storage
Operations – Why it Works
Discounts
Promotions
Revenues
Occupancy =
Pricing Power
20 |
 Self Storage
Operations – Why it Works
Why it Works
And We Are Just Now Getting to Busy Season!
21
•
167,000 Unit Code Permutations for Price
Changes
•
Asking Rents Higher Than in Place Leases
•
Move Outs Lead to Higher Revenues |
 Self Storage
Operations – Why it Works
Time
Technology Driven Marketing
22
•
Properties Maturing
•
Key People in Place
•
Training Initiatives
•
Economies of Scale
•
Pay Per Click Specific to Time of Day
•
Relevant Search Engine Optimization
•
Reservation Marketing –
Sense of Urgency |
 Self Storage
Operations – Why it Works
Technology Size Advantage
-
Over 15,000 price changes in 2012
-
Sense of urgency
-
Improved conversion
23
•
Reservation system
•
Real time analytics dashboard
•
Logic based operating system for dynamic unit pricing
•
Reservation management |
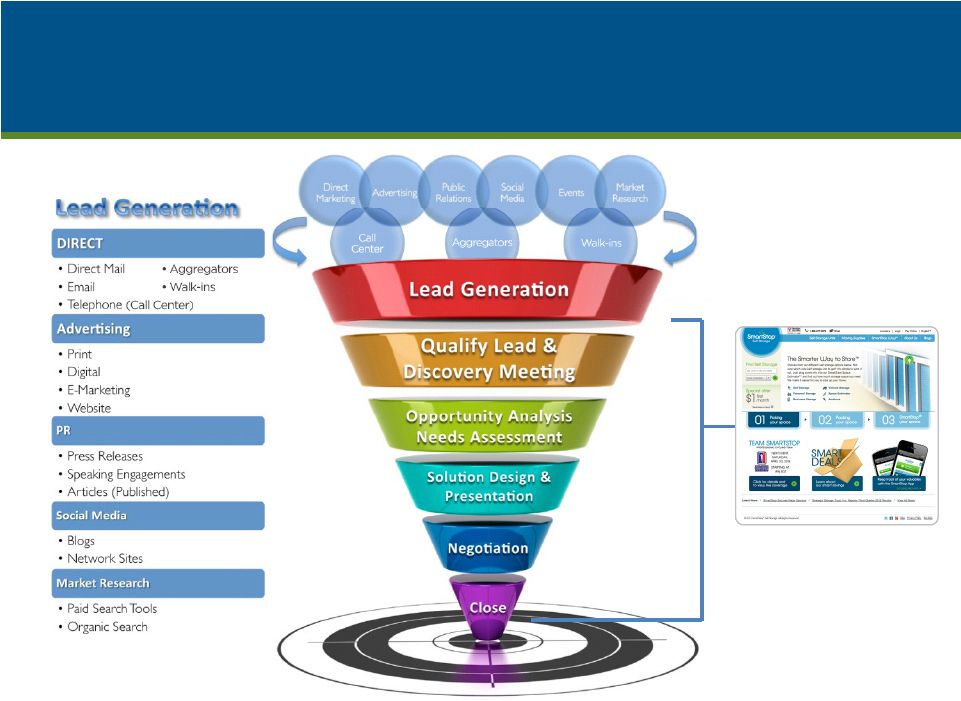 Marketing
- It’s All About Reservations!
24 |
 Website
25 |
 Website
26 |
 Agenda
•
Performance Highlights
•
Portfolio Update
•
Self Storage Operations –
Why it Works
•
Vision
27 |
 Strategic
Vision $2.16
(Billion)
$4.93
(Billion)
$2.29
(Billion)
$28.69
(Billion)
PUBLICLY TRADED SELF STORAGE REITS
Market Cap
(1)
PUBLIC NON-TRADED SELF STORAGE REIT
(1)
Bloomberg 5/20/2013
28 |
 Questions?
29 |
 Recap
Property Performance
•
Strategy is Working
Financials
•
Double Digit Same Store NOI Increase
Portfolio Update
•
Buying for Income AND Growth
Vision
•
We Are on Path
30 |
 May 21,
2013 Strategic Storage Trust, Inc.
First Quarter Update |