Attached files
| file | filename |
|---|---|
| EXCEL - IDEA: XBRL DOCUMENT - SmartStop Self Storage, Inc. | Financial_Report.xls |
| EX-31.2 - EX-31.2 - SmartStop Self Storage, Inc. | d336436dex312.htm |
| EX-32.2 - EX-32.2 - SmartStop Self Storage, Inc. | d336436dex322.htm |
| EX-31.1 - EX-31.1 - SmartStop Self Storage, Inc. | d336436dex311.htm |
| EX-32.1 - EX-32.1 - SmartStop Self Storage, Inc. | d336436dex321.htm |
Table of Contents
UNITED STATES
SECURITIES AND EXCHANGE COMMISSION
WASHINGTON, D.C. 20549
FORM 10-Q
| x | QUARTERLY REPORT PURSUANT TO SECTION 13 OR 15(d) OF THE SECURITIES EXCHANGE ACT OF 1934 |
For the quarterly period ended March 31, 2012
| ¨ | TRANSITION REPORT PURSUANT TO SECTION 13 OR 15(d) OF THE SECURITIES EXCHANGE ACT OF 1934 |
For the transition period from to
Commission File Number: 000-53644
Strategic Storage Trust, Inc.
(Exact name of Registrant as specified in its charter)
| Maryland | 32-0211624 | |
| (State or other jurisdiction of incorporation or organization) |
(IRS Employer Identification No.) |
111 Corporate Drive, Suite 120, Ladera Ranch, California 92694
(Address of principal executive offices)
(877) 327-3485
(Registrant’s telephone number)
N/A
(Former name, former address and former fiscal year, if changed since last report)
Indicate by check mark whether the registrant (1) has filed all reports required to be filed by Section 13 or 15(d) of the Securities Exchange Act of 1934 during the preceding 12 months (or for such shorter period that the registrant was required to file such reports) and (2) has been subject to such filing requirements for the past 90 days. Yes x No ¨
Indicate by check mark whether the registrant has submitted electronically and posted on its corporate Web site, if any, every Interactive Data File required to be submitted and posted pursuant to Rule 405 of Regulation S-T (§232.405 of this chapter) during the preceding 12 months (or for such shorter period that the registrant was required to submit and post such files). Yes x No ¨
Indicate by check mark whether the registrant is a large accelerated filer, an accelerated filer, a non-accelerated filer, or a smaller reporting company. See the definitions of “large accelerated filer,” “accelerated filer” and “smaller reporting company” in Rule 12b-2 of the Exchange Act. (Check one)
| Large accelerated filer | ¨ | Accelerated filer | ¨ | |||
| Non-accelerated filer | x (Do not check if a smaller reporting company) | Smaller reporting company | ¨ | |||
Indicate by check mark whether the registrant is a shell company (as defined in Rule 12b-2 of the Exchange Act). Yes ¨ No x
Indicate the number of shares outstanding of each of the issuer’s classes of common stock, as of May 9, 2012: 37,959,063, $0.001 par value per share.
Table of Contents
FORM 10-Q
STRATEGIC STORAGE TRUST, INC.
| Page No. |
||||||
| PART I. |
||||||
| 3 | ||||||
| Item 1. |
4 | |||||
| Consolidated Balance Sheets as of March 31, 2012 (unaudited) and December 31, 2011 (unaudited) |
5 | |||||
| Consolidated Statements of Operations for the Three Months Ended March 31, 2012 and 2011 (unaudited) |
6 | |||||
| 7 | ||||||
| Consolidated Statement of Stockholders’ Equity for the Three Months Ended March 31, 2012 (unaudited) |
8 | |||||
| Consolidated Statements of Cash Flows for the Three Months Ended March 31, 2012 and 2011 (unaudited) |
9 | |||||
| 10 | ||||||
| Item 2. |
Management’s Discussion and Analysis of Financial Condition and Results of Operations |
32 | ||||
| Item 3. |
48 | |||||
| Item 4. |
49 | |||||
| PART II. |
||||||
| Item 1. |
50 | |||||
| Item 1A. |
50 | |||||
| Item 2. |
51 | |||||
| Item 3. |
52 | |||||
| Item 4. |
52 | |||||
| Item 5. |
52 | |||||
| Item 6. |
52 | |||||
2
Table of Contents
CAUTIONARY NOTE REGARDING FORWARD-LOOKING STATEMENTS
Certain statements contained in this Form 10-Q of Strategic Storage Trust, Inc., other than historical facts, may be considered forward-looking statements within the meaning of Section 27A of the Securities Act of 1933, as amended (the “Securities Act”) and Section 21E of the Securities Exchange Act of 1934, as amended (the “Exchange Act”). We intend for all such forward-looking statements to be covered by the applicable safe harbor provisions for forward-looking statements contained in Section 27A of the Securities Act and Section 21E of the Exchange Act, as applicable. Such statements include, in particular, statements about our plans, strategies, and prospects and are subject to certain risks and uncertainties, including known and unknown risks, which could cause actual results to differ materially from those projected or anticipated. Therefore, such statements are not intended to be a guarantee of our performance in future periods. Such forward-looking statements can generally be identified by our use of forward-looking terminology such as “may,” “will,” “expect,” “intend,” “anticipate,” “estimate,” “believe,” “continue,” or other similar words. Readers are cautioned not to place undue reliance on these forward-looking statements, which speak only as of the date this report is filed with the Securities and Exchange Commission. We cannot guarantee the accuracy of any such forward-looking statements contained in this Form 10-Q, and we do not intend to publicly update or revise any forward-looking statements, whether as a result of new information, future events, or otherwise.
Any such forward-looking statements are subject to risks, uncertainties, and other factors and are based on a number of assumptions involving judgments with respect to, among other things, future economic, competitive, and market conditions, all of which are difficult or impossible to predict accurately. To the extent that our assumptions differ from actual results, our ability to meet such forward-looking statements, including our ability to generate positive cash flow from operations and provide distributions to stockholders, and our ability to find suitable investment properties, may be significantly hindered. See the risk factors identified in the “Risk Factors” section of our Annual Report on Form 10-K for the year ended December 31, 2011, as filed with the Securities and Exchange Commission, and Part II, Item 1A in this Form 10-Q for a discussion of some, although not all, of the risks and uncertainties that could cause actual results to differ materially from those presented in our forward-looking statements.
3
Table of Contents
| ITEM 1. | CONSOLIDATED FINANCIAL STATEMENTS |
The information furnished in the accompanying consolidated balance sheets and related consolidated statements of operations, comprehensive loss, stockholders’ equity and cash flows reflects all adjustments that are, in management’s opinion, necessary for a fair and consistent presentation of the aforementioned financial statements.
The accompanying financial statements should be read in conjunction with the notes to our financial statements and Management’s Discussion and Analysis of Financial Condition and Results of Operations included in this report on Form 10-Q. The accompanying financial statements should also be read in conjunction with our financial statements and notes thereto and Management’s Discussion and Analysis of Financial Condition and Results of Operations included in our Annual Report on Form 10-K for the year ended December 31, 2011. Our results of operations for the three months ended March 31, 2012 are not necessarily indicative of the operating results expected for the full year.
4
Table of Contents
STRATEGIC STORAGE TRUST, INC. AND SUBSIDIARIES
(Unaudited)
| March 31, 2012 | December 31, 2011 | |||||||
| ASSETS | ||||||||
| Cash and cash equivalents |
$ | 12,246,580 | $ | 13,217,410 | ||||
| Real estate facilities: |
||||||||
| Land |
147,837,976 | 149,269,391 | ||||||
| Buildings |
332,157,002 | 330,842,349 | ||||||
| Site improvements |
30,427,133 | 30,283,836 | ||||||
|
|
|
|
|
|||||
| 510,422,111 | 510,395,576 | |||||||
| Accumulated depreciation |
(19,261,561 | ) | (15,971,288 | ) | ||||
|
|
|
|
|
|||||
| 491,160,550 | 494,424,288 | |||||||
| Construction in process |
2,192,469 | 1,754,582 | ||||||
|
|
|
|
|
|||||
| Real estate facilities, net ($17,024,014 and $17,070,146 related to VIEs) |
493,353,019 | 496,178,870 | ||||||
| Deferred financing costs, net of accumulated amortization |
6,574,579 | 7,449,525 | ||||||
| Intangible assets, net of accumulated amortization |
12,694,504 | 15,922,955 | ||||||
| Restricted cash |
6,099,433 | 5,234,479 | ||||||
| Investments in unconsolidated joint ventures |
9,406,366 | 9,180,538 | ||||||
| Other assets |
3,481,181 | 3,250,490 | ||||||
|
|
|
|
|
|||||
| Total assets |
$ | 543,855,662 | $ | 550,434,267 | ||||
|
|
|
|
|
|||||
| LIABILITIES AND STOCKHOLDERS’ EQUITY | ||||||||
| Secured debt ($10,201,318 and $10,210,249 related to VIEs) |
$ | 322,291,818 | $ | 330,043,207 | ||||
| Accounts payable and accrued liabilities |
13,254,450 | 7,855,033 | ||||||
| Due to affiliates |
1,247,080 | 2,065,615 | ||||||
| Distributions payable |
2,148,386 | 2,071,876 | ||||||
|
|
|
|
|
|||||
| Total liabilities |
338,941,734 | 342,035,731 | ||||||
| Commitments and contingencies (Note 8) |
||||||||
| Redeemable common stock |
— | 2,807,837 | ||||||
| Stockholders’ equity: |
||||||||
| Strategic Storage Trust, Inc. stockholders’ equity: |
||||||||
| Common stock, $0.001 par value; 700,000,000 shares authorized; 36,486,624 and 35,020,561 shares issued and outstanding at March 31, 2012 and December 31, 2011, respectively |
36,487 | 35,021 | ||||||
| Additional paid-in capital |
296,123,971 | 285,211,557 | ||||||
| Distributions |
(48,815,345 | ) | (42,602,530 | ) | ||||
| Accumulated deficit |
(48,387,527 | ) | (42,955,433 | ) | ||||
| Accumulated other comprehensive loss |
(507,344 | ) | (829,652 | ) | ||||
|
|
|
|
|
|||||
| Total Strategic Storage Trust, Inc. stockholders’ equity |
198,450,242 | 198,858,963 | ||||||
|
|
|
|
|
|||||
| Noncontrolling interests in Operating Partnership |
500,278 | 718,907 | ||||||
| Other noncontrolling interests |
5,963,408 | 6,012,829 | ||||||
|
|
|
|
|
|||||
| Total noncontrolling interests |
6,463,686 | 6,731,736 | ||||||
|
|
|
|
|
|||||
| Total stockholders’ equity |
204,913,928 | 205,590,699 | ||||||
|
|
|
|
|
|||||
| Total liabilities and stockholders’ equity |
$ | 543,855,662 | $ | 550,434,267 | ||||
|
|
|
|
|
|||||
See notes to consolidated financial statements.
5
Table of Contents
STRATEGIC STORAGE TRUST, INC. AND SUBSIDIARIES
CONSOLIDATED STATEMENTS OF OPERATIONS
(Unaudited)
| Three
Months Ended March 31, 2012 |
Three
Months Ended March 31, 2011 |
|||||||
| Revenues: |
||||||||
| Self storage rental income |
$ | 14,880,550 | $ | 9,611,086 | ||||
| Ancillary operating income |
471,367 | 193,527 | ||||||
|
|
|
|
|
|||||
| Total revenues |
15,351,917 | 9,804,613 | ||||||
|
|
|
|
|
|||||
| Operating expenses: |
||||||||
| Property operating expenses |
6,220,666 | 4,029,815 | ||||||
| Property operating expenses - affiliates |
1,968,949 | 1,072,891 | ||||||
| General and administrative |
588,160 | 821,927 | ||||||
| Depreciation |
3,356,761 | 1,876,981 | ||||||
| Intangible amortization expense |
3,228,452 | 3,050,925 | ||||||
| Property acquisition expenses - affiliates |
27,031 | 1,233,159 | ||||||
| Other property acquisition expenses |
65,326 | 575,315 | ||||||
|
|
|
|
|
|||||
| Total operating expenses |
15,455,345 | 12,661,013 | ||||||
|
|
|
|
|
|||||
| Operating loss |
(103,428 | ) | (2,856,400 | ) | ||||
| Other income (expense): |
||||||||
| Interest expense |
(4,636,984 | ) | (2,387,794 | ) | ||||
| Deferred financing amortization expense |
(973,535 | ) | (332,104 | ) | ||||
| Equity in earnings of real estate ventures |
221,137 | 244,956 | ||||||
| Other |
41,665 | (10,477 | ) | |||||
|
|
|
|
|
|||||
| Net loss |
(5,451,145 | ) | (5,341,819 | ) | ||||
| Less: Net loss attributable to the noncontrolling interests in our Operating Partnership |
28,877 | 14,108 | ||||||
| Net (income) loss attributable to other noncontrolling interests |
(9,826 | ) | 111,648 | |||||
|
|
|
|
|
|||||
| Net loss attributable to Strategic Storage Trust, Inc. |
$ | (5,432,094 | ) | $ | (5,216,063 | ) | ||
|
|
|
|
|
|||||
| Net loss per share - basic |
$ | (0.15 | ) | $ | (0.19 | ) | ||
| Net loss per share - diluted |
$ | (0.15 | ) | $ | (0.19 | ) | ||
|
|
|
|
|
|||||
| Weighted average shares outstanding - basic |
35,675,255 | 27,868,794 | ||||||
| Weighted average shares outstanding - diluted |
35,675,255 | 27,868,794 | ||||||
|
|
|
|
|
|||||
See notes to consolidated financial statements.
6
Table of Contents
STRATEGIC STORAGE TRUST, INC. AND SUBSIDIARIES
CONSOLIDATED STATEMENTS OF COMPREHENSIVE LOSS
(Unaudited)
| Three
Months Ended March 31, 2012 |
Three
Months Ended March 31, 2011 |
|||||||
| Net loss |
$ | (5,451,145 | ) | $ | (5,341,819 | ) | ||
| Other comprehensive income (loss): |
||||||||
| Foreign currency translation adjustments |
405,389 | 166,614 | ||||||
| Change in fair value of interest rate swap |
(83,081 | ) | — | |||||
|
|
|
|
|
|||||
| Other comprehensive income |
322,308 | 166,614 | ||||||
|
|
|
|
|
|||||
| Comprehensive loss |
(5,128,837 | ) | (5,175,205 | ) | ||||
| Comprehensive loss allocated to noncontrolling interests: |
||||||||
| Comprehensive loss attributable to the noncontrolling interests in our Operating Partnership |
27,054 | 11,761 | ||||||
| Comprehensive (income) loss attributable to other noncontrolling interests |
(9,826 | ) | 111,648 | |||||
|
|
|
|
|
|||||
| Comprehensive loss attributable to Strategic Storage Trust, Inc. |
$ | (5,111,609 | ) | $ | (5,051,796 | ) | ||
|
|
|
|
|
|||||
See notes to consolidated financial statements.
7
Table of Contents
STRATEGIC STORAGE TRUST, INC. AND SUBSIDIARIES
STOCKHOLDERS’ EQUITY
(Unaudited)
| Number of Shares |
Common Stock Par Value |
Additional Paid-in Capital |
Distributions | Accumulated Deficit |
Accumulated Other Comprehensive Income (Loss) |
Noncontrolling Interests in Operating Partnership |
Total | |||||||||||||||||||||||||
| Balance as of December 31, 2011 |
35,020,561 | $ | 35,021 | $ | 285,211,557 | $ | (42,602,530 | ) | $ | (42,955,433 | ) | $ | (829,652 | ) | $ | 6,731,736 | $ | 205,590,699 | ||||||||||||||
| Gross proceeds from issuance of common stock |
1,279,359 | 1,280 | 12,795,845 | — | — | — | — | 12,797,125 | ||||||||||||||||||||||||
| Offering costs |
— | — | (1,668,681 | ) | — | — | — | — | (1,668,681 | ) | ||||||||||||||||||||||
| Changes to redeemable common stock |
— | — | (1,748,057 | ) | — | — | — | — | (1,748,057 | ) | ||||||||||||||||||||||
| Redemptions of common stock |
(92,002 | ) | (92 | ) | (887,680 | ) | — | — | — | — | (887,772 | ) | ||||||||||||||||||||
| Issuance of restricted stock |
1,250 | 1 | — | — | — | — | — | 1 | ||||||||||||||||||||||||
| Distributions ($0.70 per share) |
— | — | — | (6,212,815 | ) | — | — | — | (6,212,815 | ) | ||||||||||||||||||||||
| Distributions for noncontrolling interests |
— | — | — | — | — | — | (73,596 | ) | (73,596 | ) | ||||||||||||||||||||||
| Issuance of shares for distribution reinvestment plan |
277,456 | 277 | 2,635,552 | — | — | — | — | 2,635,829 | ||||||||||||||||||||||||
| Repurchase of limited partnership units in our Operating Partnership |
— | — | (221,335 | ) | — | — | — | (175,403 | ) | (396,738 | ) | |||||||||||||||||||||
| Stock based compensation expense |
— | — | 6,770 | — | — | — | — | 6,770 | ||||||||||||||||||||||||
| Net loss attributable to Strategic Storage Trust, Inc. |
— | — | — | — | (5,432,094 | ) | — | — | (5,432,094 | ) | ||||||||||||||||||||||
| Net loss attributable to the noncontrolling interests |
— | — | — | — | — | — | (19,051 | ) | (19,051 | ) | ||||||||||||||||||||||
| Foreign currency translation adjustment |
— | — | — | — | — | 405,389 | — | 405,389 | ||||||||||||||||||||||||
| Change in fair value of interest rate swap |
— | — | — | — | — | (83,081 | ) | — | (83,081 | ) | ||||||||||||||||||||||
|
|
|
|
|
|
|
|
|
|
|
|
|
|
|
|
|
|||||||||||||||||
| Balance as of March 31, 2012 |
36,486,624 | $ | 36,487 | $ | 296,123,971 | $ | (48,815,345 | ) | $ | (48,387,527 | ) | $ | (507,344 | ) | $ | 6,463,686 | $ | 204,913,928 | ||||||||||||||
|
|
|
|
|
|
|
|
|
|
|
|
|
|
|
|
|
|||||||||||||||||
See notes to consolidated financial statements.
8
Table of Contents
STRATEGIC STORAGE TRUST, INC. AND SUBSIDIARIES
CONSOLIDATED STATEMENTS OF CASH FLOWS
(Unaudited)
| Three Months Ended March 31, 2012 |
Three Months Ended March 31, 2011 |
|||||||
| Cash flows from operating activities: |
||||||||
| Net loss |
$ | (5,451,145 | ) | $ | (5,341,819 | ) | ||
| Adjustments to reconcile net loss to cash provided by (used in) operating activities: |
||||||||
| Depreciation and amortization expense |
7,558,748 | 5,260,010 | ||||||
| Noncash interest expense |
104,340 | 94,490 | ||||||
| Expense related to issuance of restricted stock |
6,771 | 6,250 | ||||||
| Equity in income of unconsolidated joint ventures |
(196,215 | ) | (187,667 | ) | ||||
| Distributions from unconsolidated joint ventures |
203,162 | 204,389 | ||||||
| Foreign currency exchange gain |
(51,957 | ) | (51,022 | ) | ||||
| Increase (decrease) in cash from changes in assets and liabilities: |
||||||||
| Restricted cash |
141,381 | (1,092,569 | ) | |||||
| Other assets |
(39,227 | ) | (316,762 | ) | ||||
| Accounts payable and other accrued liabilities |
521,539 | 807,700 | ||||||
| Due to affiliates |
(821,428 | ) | 243,094 | |||||
|
|
|
|
|
|||||
| Net cash flows provided by (used in) operating activities |
1,975,969 | (373,906 | ) | |||||
|
|
|
|
|
|||||
| Cash flows from investing activities: |
||||||||
| Purchases of real estate |
— | (33,568,272 | ) | |||||
| Additions to real estate facilities |
(981,126 | ) | (1,683,008 | ) | ||||
| Development and construction of real estate facilities |
(720,545 | ) | — | |||||
| Proceeds from land disposition |
1,978,746 | — | ||||||
| Restricted cash |
(1,006,335 | ) | — | |||||
| Deposits on acquisitions of real estate facilities |
(100,000 | ) | (309,902 | ) | ||||
| Additional investment in unconsolidated joint venture |
(232,775 | ) | — | |||||
|
|
|
|
|
|||||
| Net cash flows used in investing activities |
(1,062,035 | ) | (35,561,182 | ) | ||||
|
|
|
|
|
|||||
| Cash flows from financing activities: |
||||||||
| Proceeds from issuance of secured debt |
6,222,378 | 42,985,900 | ||||||
| Principal payments on secured debt |
(763,425 | ) | (340,333 | ) | ||||
| Repayment of secured debt |
(13,500,000 | ) | (9,939,555 | ) | ||||
| Deferred financing costs |
(93,451 | ) | (1,053,317 | ) | ||||
| Gross proceeds from issuance of common stock |
12,797,125 | 22,706,741 | ||||||
| Repurchase of limited partnership units in our Operating Partnership |
(396,738 | ) | — | |||||
| Offering costs |
(1,668,681 | ) | (2,767,286 | ) | ||||
| Redemptions of common stock |
(887,772 | ) | — | |||||
| Distributions paid |
(3,499,186 | ) | (2,692,434 | ) | ||||
| Distributions paid to noncontrolling interests |
(74,886 | ) | (87,078 | ) | ||||
| Escrow receivable |
(71,350 | ) | 13,250 | |||||
| Due to affiliates |
1,205 | (129,450 | ) | |||||
|
|
|
|
|
|||||
| Net cash flows provided by (used in) financing activities |
(1,934,781 | ) | 48,696,438 | |||||
|
|
|
|
|
|||||
| Effect of exchange rate changes on cash |
50,017 | (12,730 | ) | |||||
| Increase (decrease) in cash and cash equivalents |
(970,830 | ) | 12,748,620 | |||||
| Cash and cash equivalents, beginning of period |
13,217,410 | 6,438,091 | ||||||
|
|
|
|
|
|||||
| Cash and cash equivalents, end of period |
$ | 12,246,580 | $ | 19,186,711 | ||||
|
|
|
|
|
|||||
| Supplemental cash flow and non-cash transactions: |
||||||||
| Cash paid for interest |
$ | 4,607,055 | $ | 2,248,738 | ||||
| Interest capitalized |
$ | 86,643 | $ | — | ||||
| Distributions payable |
$ | 2,148,386 | $ | 1,711,595 | ||||
| Issuance of shares pursuant to distribution reinvestment plan |
$ | 2,635,829 | $ | 1,963,793 | ||||
| Assumption of notes payable issued in connection with purchase of real estate facilities |
$ | — | $ | 31,291,119 | ||||
| Issuance of limited partnership units in connection with the purchase of real estate facilities |
$ | — | $ | 903,928 | ||||
See notes to consolidated financial statements.
9
Table of Contents
STRATEGIC STORAGE TRUST, INC. AND SUBSIDIARIES
NOTES TO CONSOLIDATED FINANCIAL STATEMENTS
March 31, 2012
Note 1. Organization
Strategic Storage Trust, Inc., a Maryland corporation (the “Company”), was formed on August 14, 2007 under the Maryland General Corporation Law for the purpose of engaging in the business of investing in self storage facilities. The Company’s year end is December 31. As used in this report, “we” “us” and “our” refer to Strategic Storage Trust, Inc.
Strategic Capital Holdings, LLC, a Virginia limited liability company (our “Sponsor”), is the sponsor of our Offering (as defined below). Our Sponsor was formed on July 21, 2004 to engage in private structured offerings of limited partnerships and other entities with respect to the acquisition, management and disposition of commercial real estate assets. Our Sponsor owns a majority of Strategic Storage Holdings, LLC, which is the sole member of our advisor and our property manager.
Our advisor is Strategic Storage Advisor, LLC, a Delaware limited liability company (our “Advisor”) which was formed on August 13, 2007. Our Advisor is responsible for managing our affairs on a day-to-day basis and identifying and making acquisitions and investments on our behalf under the terms of an advisory agreement we have with our Advisor (our “Advisory Agreement”). Some of the officers of our Advisor are also officers of our Sponsor and of us.
On August 24, 2007, our Advisor purchased 100 shares of our common stock for $1,000 and became our initial stockholder. Our Second Articles of Amendment and Restatement authorize 700,000,000 shares of common stock with a par value of $0.001 and 200,000,000 shares of preferred stock with a par value of $0.001.
Our operating partnership, Strategic Storage Operating Partnership, L.P., a Delaware limited partnership (our “Operating Partnership”), was formed on August 14, 2007. On August 24, 2007, our Advisor purchased a limited partnership interest in our Operating Partnership for $200,000 and on August 24, 2007, we contributed the initial $1,000 capital contribution we received to our Operating Partnership in exchange for the general partner interest. Our Operating Partnership owns, directly or indirectly through one or more special purpose entities, all of the self storage properties that we have acquired. As of March 31, 2012, we owned 99.54% of the limited partnership interests of our Operating Partnership. The remaining limited partnership interests are owned by our Advisor (0.06%) and unaffiliated third parties (0.40%). As the sole general partner of our Operating Partnership, we have the exclusive power to manage and conduct the business of our Operating Partnership. We will conduct certain activities (such as selling packing supplies and locks and renting trucks or other moving equipment) through our taxable REIT subsidiaries (the “TRSs”), which are our wholly-owned subsidiaries.
Our property manager is Strategic Storage Property Management, LLC, a Delaware limited liability company (our “Property Manager”), which was formed in August 2007 to manage our properties. Our Property Manager derives substantially all of its income from the property management services it performs for us.
On March 17, 2008, we began our initial public offering of common stock (our “Initial Offering”). On May 22, 2008, we satisfied the minimum offering requirements of the Initial Offering and commenced formal operations. On September 16, 2011, we terminated the Initial Offering, having sold approximately 29 million shares for gross proceeds of approximately $289 million. On September 22, 2011, we commenced our follow-on public offering of stock for a maximum of 110,000,000 shares of common stock, consisting of 100,000,000 shares for sale to the public (our “Primary Offering”) and 10,000,000 shares for sale pursuant to our distribution reinvestment plan (collectively, our “Offering”). We intend to invest a substantial amount of the net proceeds from our Offering in self storage facilities and related self storage real estate investments. Our Offering will not last beyond September 22, 2013 (two years after the effective date of our Offering), provided, however, that subject to applicable law, we may extend our Offering for an additional year, or, in certain circumstances, longer. We also reserve the right to terminate our Offering at any time. In addition to our Initial Offering and our Offering, in September 2009 we also issued approximately 6.2 million shares of common stock in connection with two mergers with private real estate investment trusts sponsored by our Sponsor.
Our dealer manager is Select Capital Corporation, a California corporation (our “Dealer Manager”). Our Dealer Manager is responsible for marketing our shares being offered pursuant to the Offering. Our president owns a 15% beneficial non-voting equity interest in our Dealer Manager. U.S. Select Securities LLC, our dealer manager for our Initial Offering, was terminated as our dealer manager upon completion of our Initial Offering.
10
Table of Contents
STRATEGIC STORAGE TRUST, INC. AND SUBSIDIARIES
NOTES TO CONSOLIDATED FINANCIAL STATEMENTS
March 31, 2012
As we accept subscriptions for shares of our common stock, we transfer substantially all of the net proceeds of the Offering to our Operating Partnership as capital contributions in exchange for additional units of interest in our Operating Partnership. However, we are deemed to have made capital contributions in the amount of the gross offering proceeds received from investors and the Operating Partnership is deemed to have simultaneously paid the sales commissions and other costs associated with the Offering. In addition, our Operating Partnership is structured to make distributions with respect to limited partnership units (except for Class D units) that will be equivalent to the distributions made to holders of our common stock. In March 2011, we adopted Amendment No. 1 to our Operating Partnership’s First Amended and Restated Limited Partnership Agreement, which established Class D Units, and our Operating Partnership issued approximately 120,000 Class D Units in connection with our acquisition of the Las Vegas VII and Las Vegas VIII properties. The Class D Units have all of the rights, powers, duties and preferences of the Operating Partnership’s other limited partnership units, except that they are subject to an annual distribution limit (initially zero percent) and the holders of the Class D Units have agreed to modified exchange rights that prevent them from exercising their exchange rights until the occurrence of a specified event (see Note 8). Finally, a limited partner in our Operating Partnership may later exchange his or her limited partnership units in our Operating Partnership for shares of our common stock at any time after one year following the date of issuance of their limited partnership units, subject to certain restrictions as outlined in the limited partnership agreement. Our Advisor is prohibited from exchanging or otherwise transferring its limited partnership units so long as it is acting as our Advisor pursuant to our Advisory Agreement.
As of March 31, 2012, we wholly-owned 91 self storage facilities located in 17 states and Canada, comprising approximately 60,140 units and approximately 7.5 million rentable square feet. As of March 31, 2012, we also had minority interests in nine additional self storage facilities through preferred equity and/or minority interests. Of those interests, one has been deemed to be a controlling interest and is therefore consolidated in our consolidated financial statements as discussed in Note 2. Additionally, we have an interest in a net leased industrial property in California with 356,000 rentable square feet leased to a single tenant.
Note 2. Summary of Significant Accounting Policies
Basis of Presentation
The accompanying interim consolidated financial statements have been prepared in accordance with U.S. generally accepted accounting principles (“GAAP”) as contained within the Financial Accounting Standards Board (“FASB”) Accounting Standards Codification (“ASC”) and the rules and regulations of the SEC. Certain information and footnote disclosures required for annual financial statements have been condensed or excluded pursuant to SEC rules and regulations. Accordingly, the interim financial statements do not include all of the information and footnotes required by GAAP for complete financial statements. The accompanying financial statements reflect all adjustments which are, in the opinion of our management, of a normal recurring nature and necessary for a fair presentation of our financial position, results of operations and cash flows for the interim period. Operating results for the three months ended March 31, 2012 are not necessarily indicative of the results that may be expected for the year ending December 31, 2012.
Effective September 15, 2009, the ASC was established as the single source of authoritative nongovernmental GAAP. Prior to the issuance of the ASC, all GAAP pronouncements were issued in separate topical pronouncements in the form of statements, staff positions or Emerging Issues Task Force Abstracts, and were referred to as such. While the ASC does not change GAAP, it introduces a new structure and supersedes all previously issued non-SEC accounting and reporting standards. In addition to the ASC, the Company is still required to follow SEC rules and regulations relating to the preparation of financial statements. The Company’s accounting policies are consistent with the guidance set forth by both ASC and the SEC.
Reclassifications
Certain amounts previously reported in our 2011 financial statements have been reclassified to conform to the fiscal 2012 presentation.
Principles of Consolidation
Our financial statements, the financial statements of our Operating Partnership, including its wholly-owned subsidiaries, the financial statements of Self Storage REIT, LLC (REIT I) and Self Storage REIT II, LLC (REIT II), and the accounts of variable interest entities (VIEs) for which we are the primary beneficiary are consolidated in the accompanying consolidated financial statements. The portion of these entities not wholly-owned by us is presented as noncontrolling interests both as of and during the periods presented. All significant intercompany accounts and transactions have been eliminated in consolidation.
11
Table of Contents
STRATEGIC STORAGE TRUST, INC. AND SUBSIDIARIES
NOTES TO CONSOLIDATED FINANCIAL STATEMENTS
March 31, 2012
Consolidation Considerations for Our Investments in Joint Ventures
Current accounting guidance provides a framework for identifying VIEs and determining when a company should include the assets, liabilities, noncontrolling interests, and results of activities of the VIE in its consolidated financial statements. In general, a VIE is an entity or other legal structure used to conduct activities or hold assets that either (1) has an insufficient amount of equity to carry out its principal activities without additional subordinated financial support, (2) has a group of equity owners that are unable to make significant decisions about its activities, or (3) has a group of equity owners that do not have the obligation to absorb losses or the right to receive returns generated by its operations. Generally, a VIE should be consolidated if a party with an ownership, contractual, or other financial interest in the VIE (a variable interest holder) has the power to direct the VIE’s most significant activities and the obligation to absorb losses or right to receive benefits of the VIE that could be significant to the VIE. A variable interest holder that consolidates the VIE is called the primary beneficiary. Upon consolidation, the primary beneficiary generally must initially record all of the VIE’s assets, liabilities, and noncontrolling interest at fair value and subsequently account for the VIE as if it were consolidated based on majority voting interest. As of March 31, 2012 and December 31, 2011, we had entered into contracts/interests that are deemed to be variable interests in VIEs. Those variable interests include both lease agreements and equity investments. We have evaluated those variable interests against the criteria for consolidation and determined that we are not the primary beneficiary of certain investments discussed further in the “Equity Investments” section of this note.
As of March 31, 2012 and December 31, 2011, we had an equity interest in a self storage property located in San Francisco, California (“SF property”) which was deemed to be a VIE of which we are the primary beneficiary. As such, the SF property has been consolidated in our consolidated financial statements since we acquired our interest in the property through the REIT I merger. In January 2010, we acquired an approximately 2% additional interest in the SF property, bringing our total interest to approximately 12%. The SF property is owned by a Delaware Statutory Trust (DST), and by virtue of the trust agreement the investors in the trust have no direct or indirect ability through voting rights to make decisions about the DST’s significant activities. The REIT I operating partnership (the “REIT I Operating Partnership”) has also entered into a lease agreement for the SF property, in which the REIT I Operating Partnership is the tenant, which exposes it to losses of the VIE that could be significant to the VIE and also allows it to direct activities of the VIE that determine its economic performance by means of its operation of the leased facility. The lease has an initial term of 10 years which commenced on December 19, 2006. The initial term of the lease may be extended at the option of the REIT I Operating Partnership for up to four successive five year terms. As of March 31, 2012, the consolidated joint venture had net real estate assets of approximately $17.0 million. Such assets are only available to satisfy the obligations of the SF property. We have also consolidated approximately $10.2 million of secured debt and approximately $6.0 million of noncontrolling interest related to this entity. The lenders of the secured debt have no recourse to other Company assets. Our Sponsor has entered into an agreement to indemnify us for any losses as a result of potential shortfalls in the lease payments required to be made by the REIT I Operating Partnership. Despite such indemnification, we continue to be deemed the primary beneficiary as our Sponsor is not deemed to have a variable interest in the SF property.
Use of Estimates
The preparation of the consolidated financial statements in conformity with accounting principles generally accepted in the United States requires management to make estimates and assumptions that affect the amounts reported in the consolidated financial statements and accompanying notes. The current economic environment has increased the degree of uncertainty inherent in these estimates and assumptions. Management adjusts such estimates when facts and circumstances dictate. The most significant estimates made include the allocation of property purchase price to tangible and intangible assets acquired and liabilities assumed at fair value, the determination if certain entities should be consolidated, the evaluation of potential impairment of long-lived assets and of assets held by equity method investees, and the useful lives of real estate assets and intangibles. Actual results could materially differ from those estimates.
Cash and Cash Equivalents
We consider all short-term, highly liquid investments that are readily convertible to cash with a maturity of three months or less at the time of purchase to be cash equivalents.
We may maintain cash equivalents in financial institutions in excess of insured limits, but believe this risk is mitigated by only investing in or through major financial institutions.
12
Table of Contents
STRATEGIC STORAGE TRUST, INC. AND SUBSIDIARIES
NOTES TO CONSOLIDATED FINANCIAL STATEMENTS
March 31, 2012
Restricted Cash
Restricted cash consists primarily of impound reserve accounts for property taxes, insurance and capital improvements in connection with the requirements of certain of our loan agreements. Also included in restricted cash are any amounts required to be held in trust for statutory reasons.
Real Estate Purchase Price Allocation
We account for acquisitions in accordance with accounting guidance which requires that we allocate the purchase price of the property to the tangible and intangible assets acquired and the liabilities assumed based on estimated fair values. This guidance requires us to make significant estimates and assumptions, including fair value estimates, as of the acquisition date and to adjust those estimates as necessary during the measurement period (defined as the period, not to exceed one year, in which we may adjust the provisional amounts recognized for an acquisition). Acquisitions of portfolios of facilities are allocated to the individual facilities based upon an income approach or a cash flow analysis using appropriate risk adjusted capitalization rates which take into account the relative size, age, and location of the individual facility along with current and projected occupancy and rental rate levels or appraised values, if available. Allocations to the individual assets and liabilities are based upon comparable market sales information for land and estimates of depreciated replacement cost of equipment, building and site improvements. In allocating the purchase price, we determine whether the acquisition includes intangible assets or liabilities. Substantially all of the leases in place at acquired properties are at market rates, as the majority of the leases are month-to-month contracts. Accordingly, to date we have not allocated any portion of the purchase price to above or below market leases. We also consider whether in-place, market leases represent an intangible asset. We do not expect, nor to date have we recorded, intangible assets for the value of tenant relationships because we will not have concentrations of significant tenants and the average tenant turnover is fairly frequent. Our acquisition related transaction costs are required to be expensed as incurred. During the three months ended March 31, 2012 and 2011 we expensed approximately $0.1 million and $1.8 million, respectively, of acquisition related transaction costs.
Should the initial accounting for an acquisition be incomplete by the end of a reporting period that falls within the measurement period, we report provisional amounts in our financial statements. During the measurement period, we adjust the provisional amounts recognized at the acquisition date to reflect new information obtained about facts and circumstances that existed as of the acquisition date that, if known, would have affected the measurement of the amounts recognized as of that date and we record those adjustments to our financial statements. We apply those measurement period adjustments that we determine to be significant retrospectively to comparative information in our financial statements, potentially including adjustments to interest, depreciation and amortization expense.
Evaluation of Possible Impairment of Long-Lived Assets
Management will continually monitor events and changes in circumstances that could indicate that the carrying amounts of our long-lived assets, including those held through joint ventures, may not be recoverable. When indicators of potential impairment are present that indicate that the carrying amounts of the assets may not be recoverable, we will assess the recoverability of the assets by determining whether the carrying value of the long-lived assets will be recovered through the undiscounted future operating cash flows expected from the use of the asset and its eventual disposition. In the event that such expected undiscounted future cash flows do not exceed the carrying value, we will adjust the value of the long-lived assets to the fair value and recognize an impairment loss. As of March 31, 2012 and December 31, 2011, no impairment losses have been recognized.
Equity Investments
Our investments in unconsolidated real estate joint ventures and VIEs in which we are not the primary beneficiary, where we have significant influence, but not control, are recorded under the equity method of accounting in the accompanying consolidated financial statements. Under the equity method, our investments in real estate ventures are stated at cost and adjusted for our share of net earnings or losses and reduced by distributions. Equity in earnings of real estate ventures is generally recognized based on the allocation of cash distributions upon liquidation of the investment in accordance with the joint venture agreements.
Investments representing passive preferred equity and/or minority interests (less than 20%) are accounted for under the cost method. Under the cost method, our investments in real estate ventures are carried at cost and adjusted for other-than-temporary declines in fair value, distributions representing a return of capital and additional investments.
13
Table of Contents
STRATEGIC STORAGE TRUST, INC. AND SUBSIDIARIES
NOTES TO CONSOLIDATED FINANCIAL STATEMENTS
March 31, 2012
Through the mergers with REIT I and REIT II, we acquired five preferred equity and/or minority interests in unconsolidated joint ventures (one of which became wholly-owned in 2011; see Note 3), all of which were deemed to be VIEs. We have evaluated each variable interest against the amended criteria for consolidation and determined that we are not the primary beneficiary, generally due to our inability to direct significant activities that determine the economic performance of the VIE. Three of those investments are passive or limited partner interests in self storage facilities (two of which properties are owned by DSTs, and by virtue of the related trust agreements, the investors have no direct or indirect ability through voting rights to make decisions about the DSTs significant activities) and are therefore accounted for under the cost method; our aggregate investment therein is approximately $0.7 million. Individually our ownership interest in those investments ranges from 0.28% to 11.5%; the carrying value of the investments ranged from approximately $27,000 to $610,000 and our risk of loss is limited to our individual investment therein.
The remaining interest is in a net leased industrial property (“Hawthorne property”) in California with 356,000 rentable square feet leased to a single tenant. This investment is accounted for under the equity method of accounting and our risk of loss is limited to our investment, including our maximum exposure under the terms of a debt guarantee. We own a 12% interest in Westport LAX LLC, the joint venture that acquired the Hawthorne property and the carrying value in such investment is approximately $1.3 million. Hawthorne LLC, an affiliate of our Sponsor, owns 78% of Westport LAX LLC, and we have a preferred equity interest in Hawthorne LLC which entitles us to distributions equal to 10% per annum on our investment of approximately $7.3 million. The preferred equity interest has a redemption date in November 2012, subject to extension at our sole discretion. The preferred equity interest may be called at any time in whole or part by Hawthorne LLC or redeemed at any time by us. The remaining 10% interest in Westport LAX LLC is owned by a third party, who is also the co-manager, along with our Sponsor, of the Hawthorne property. Such third party is the acting property manager and directs the operating activities of the property that determine its economic performance. We, along with other non-affiliated parties, are guarantors on the approximately $19.5 million loan used to secure the Hawthorne property; the loan has a maturity date of August 1, 2020. As of March 31, 2012, our maximum exposure to loss as a result of our involvement with this VIE, consisting of our investment balance and our guarantee of the secured debt, totaled approximately $28.1 million.
Revenue Recognition
Management believes that all of our leases are operating leases. Rental income is recognized in accordance with the terms of the leases, which generally are month-to-month. Revenues from any long-term operating leases are recognized on a straight-line basis over the term of the lease. The excess of rents received over amounts contractually due pursuant to the underlying leases is included in accounts payable and accrued liabilities in our consolidated balance sheets and contractually due but unpaid rent is included in other assets.
Allowance for Doubtful Accounts
Tenant accounts receivable are reported net of an allowance for doubtful accounts. Management’s estimate of the allowance is based upon a review of the current status of tenant accounts receivable. It is reasonably possible that management’s estimate of the allowance will change in the future.
Depreciation of Real Property Assets
Our management is required to make subjective assessments as to the useful lives of our depreciable assets. We consider the period of future benefit of the asset to determine the appropriate useful lives.
Depreciation of our real property assets is charged to expense on a straight-line basis over the estimated useful lives as follows:
| Description |
Standard Depreciable Life | |||||
| Land | Not Depreciated | |||||
| Buildings | 30 to 35 years | |||||
| Site Improvements | 7 to 15 years | |||||
Depreciation of Personal Property Assets
Personal property assets, consisting primarily of furniture, fixtures and equipment are depreciated on a straight-line basis over the estimated useful lives generally ranging from 3 to 5 years, and are included in other assets on our consolidated balance sheets.
14
Table of Contents
STRATEGIC STORAGE TRUST, INC. AND SUBSIDIARIES
NOTES TO CONSOLIDATED FINANCIAL STATEMENTS
March 31, 2012
Intangible Assets
We have allocated a portion of our real estate purchase price to in-place leases. We are amortizing in-place leases on a straight-line basis over the estimated future benefit period. As of March 31, 2012 and December 31, 2011, accumulated amortization of in-place lease intangibles totaled approximately $28.1 million and $24.9 million, respectively.
Amortization of Deferred Financing Costs
Costs incurred in connection with obtaining financing are deferred and amortized on a straight-line basis over the term of the related loan, which is not materially different than the effective interest method. As of March 31, 2012 and December 31, 2011, accumulated amortization of deferred financing costs totaled approximately $2.5 million and $1.5 million, respectively.
Organizational and Offering Costs
Our Advisor may fund organization and offering costs on our behalf. We are required to reimburse our Advisor for such organization and offering costs; provided, however, our Advisor must reimburse us within 60 days after the end of the month in which the Offering terminates to the extent we paid or reimbursed organization and offering costs (excluding sales commissions and dealer manager fees) in excess of 3.5% of the gross offering proceeds from the Primary Offering. If at any point in time we determine that the total organization and offering costs are expected to exceed 3.5% of the gross proceeds anticipated to be received from the Primary Offering, we will recognize such excess as a capital contribution from our Advisor. As of March 31, 2012, we do not believe total organization and offering costs will exceed 3.5% of the gross proceeds anticipated to be received from the Primary Offering. Offering costs are recorded as an offset to additional paid-in capital, and organization costs are recorded as an expense.
Redeemable Common Stock
We have adopted a share redemption program that may enable stockholders to sell their shares to us in limited circumstances.
We record amounts that are redeemable under the share redemption program as redeemable common stock in the accompanying consolidated balance sheets since the shares are mandatorily redeemable at the option of the holder and therefore their redemption is outside our control. The maximum amount redeemable under our share redemption program is limited to the number of shares we could repurchase with the amount of the net proceeds from the sale of shares under the distribution reinvestment plan. However, accounting guidance states that determinable amounts that can become redeemable but that are contingent on an event that is likely to occur (e.g., the passage of time) should be presented as redeemable when such amount is known. Therefore, the net proceeds from the distribution reinvestment plan are considered to be temporary equity and are presented as redeemable common stock in the accompanying consolidated balance sheets.
In addition, current accounting guidance requires, among other things, that financial instruments that represent a mandatory obligation of us to repurchase shares be classified as liabilities and reported at settlement value. Our redeemable common shares are contingently redeemable at the option of the holder. When we determine we have a mandatory obligation to repurchase shares under the share redemption program, we will reclassify such obligations from temporary equity to a liability based upon their respective settlement values.
During the three months ended March 31, 2012, we redeemed approximately 92,000 shares of common stock for approximately $0.9 million ($9.65 per share). As of March 31, 2012, we had redemption requests for approximately 694,900 shares of common stock for approximately $6.6 million that, if honored in full, would have caused us to exceed the limits of the share redemption program. We honored such redemption requests, pursuant to the terms of the share redemption program, redeeming all death and disability redemption requests and approximately 80% of the other outstanding redemption requests. Such redemptions totaled approximately 568,800 shares for approximately $5.4 million ($9.57 per share) and were redeemed on April 30, 2012 and such amount was reclassified from redeemable common stock to accounts payable and accrued liabilities in the consolidated balance sheets as of March 31, 2012. As of March 31, 2012, we had approximately 126,000 shares that were requested for redemption, but could not be redeemed as it would have caused us to exceed the limits of the share redemption program. We treated the remainder of each redemption request as a request for redemption in the second quarter of 2012. Our board of directors may choose to amend, suspend or terminate our share redemption program upon 30 days’ written notice at any time.
15
Table of Contents
STRATEGIC STORAGE TRUST, INC. AND SUBSIDIARIES
NOTES TO CONSOLIDATED FINANCIAL STATEMENTS
March 31, 2012
Foreign Currency Translation
For non-U.S. functional currency operations, assets and liabilities are translated to U.S. dollars at current exchange rates. Revenues and expenses are translated at the average rates for the period. All related adjustments are recorded in other comprehensive income (loss) as a separate component of stockholders’ equity. Transactions denominated in a currency other than the functional currency of the related operation are recorded at rates of exchange in effect at the date of the transaction. Gains or losses on foreign currency transactions are recorded in other income (expense). For the three months ended March 31, 2012 and 2011, there was a net gain recorded of approximately $52,000 and $51,000, respectively.
Accounting for Equity Awards
The cost of restricted stock is required to be measured based on the grant-date fair value and the cost to be recognized over the relevant service period.
Fair Value Measurements
The accounting standard for fair value measurements and disclosures defines fair value, establishes a framework for measuring fair value, and provides for expanded disclosure about fair value measurements. Fair value is defined by the accounting standard for fair value measurements and disclosures as the exchange price that would be received for an asset or paid to transfer a liability (an exit price) in the principal or most advantageous market for the asset or liability in an orderly transaction between market participants on the measurement date. It also establishes a fair value hierarchy that prioritizes observable and unobservable inputs used to measure fair value into three levels. The following summarizes the three levels of inputs and hierarchy of fair value we use when measuring fair value:
| • | Level 1 inputs utilize quoted prices (unadjusted) in active markets for identical assets or liabilities that we have the ability to access; |
| • | Level 2 inputs may include quoted prices for similar assets and liabilities in active markets, as well as interest rates and yield curves that are observable at commonly quoted intervals; and |
| • | Level 3 inputs are unobservable inputs for the assets or liabilities that are typically based on an entity’s own assumptions as there is little, if any, related market activity. |
In instances where the determination of the fair value measurement is based on inputs from different levels of the fair value hierarchy, the fair value measurement will fall within the lowest level that is significant to the fair value measurement in its entirety.
The accounting guidance for fair value measurements and disclosures provides a framework for measuring fair value and establishes a fair value hierarchy which requires an entity to maximize the use of observable inputs and minimize the use of unobservable inputs when measuring fair value. In determining fair value, we utilize valuation techniques that maximize the use of observable inputs and minimize the use of unobservable inputs to the extent possible as well as consider counterparty credit risk in our assessment of fair value. Considerable judgment is necessary to interpret Level 2 and 3 inputs in determining fair value of our financial and non-financial assets and liabilities. Accordingly, there can be no assurance that the fair values we present herein are indicative of amounts that may ultimately be realized upon sale or other disposition of these assets.
Financial and non-financial assets and liabilities measured at fair value on a non-recurring basis in our consolidated financial statements consist of real estate and related assets and investments in unconsolidated joint ventures and related liabilities assumed and common stock issued related to our acquisitions. The fair values of these assets, liabilities and common stock were determined as of the acquisition dates using widely accepted valuation techniques, including (i) discounted cash flow analysis, which considers, among other things, leasing assumptions, growth rates, discount rates and terminal capitalization rates, (ii) income capitalization approach, which considers prevailing market capitalization rates, and (iii) comparable sales activity. In general, we consider multiple valuation techniques when measuring fair values. However, in certain circumstances, a single valuation technique may be appropriate. All of the fair values of the assets, liabilities and common stock as of the acquisition dates were derived using Level 3 inputs.
The carrying amounts of cash and cash equivalents, tenant accounts receivable, other assets, accounts payable and accrued liabilities, distributions payable and amounts due to affiliates approximate fair value because of the relatively short-term nature of these instruments.
16
Table of Contents
STRATEGIC STORAGE TRUST, INC. AND SUBSIDIARIES
NOTES TO CONSOLIDATED FINANCIAL STATEMENTS
March 31, 2012
The table below summarizes our fixed rate notes payable at March 31, 2012. The estimated fair value of financial instruments is subjective in nature and is dependent on a number of important assumptions, including discount rates and relevant comparable market information associated with each financial instrument. The fair value of the fixed rate notes payable was estimated by discounting the future cash flows using the current rates at which similar loans would be made to borrowers with similar credit ratings and for the same remaining maturities. The use of different market assumptions and estimation methodologies may have a material effect on the reported estimated fair value amounts. Accordingly, the estimates presented below are not necessarily indicative of the amounts we would realize in a current market exchange.
| March 31, 2012 | ||||||||
| Fair Value | Carrying Value | |||||||
| Fixed Rate Secured Debt |
$ | 216,701,938 | $ | 211,218,639 | ||||
As of March 31, 2012, we had an interest rate swap on one of our loans (See Notes 5 and 6). The valuation of this instrument was determined using widely accepted valuation techniques including discounted cash flow analysis on the expected cash flows of each derivative. This analysis reflects the contractual terms of the derivatives, including the period to maturity, and uses observable market-based inputs, including interest rate curves and implied volatilities. The fair values of interest rate swaps are determined using the market standard methodology of netting the discounted future fixed cash payments and the discounted expected variable cash receipts. The variable cash receipts are based on an expectation of future interest rates (forward curves) derived from observable market interest rate curves.
To comply with GAAP, we incorporate credit valuation adjustments to appropriately reflect both our own nonperformance risk and the respective counterparty’s nonperformance risk in the fair value measurements. In adjusting the fair value of our derivative contracts for the effect of nonperformance risk, we have considered the impact of netting and any applicable credit enhancements, such as collateral postings, thresholds, mutual puts, and guarantees.
Although we have determined that the majority of the inputs used to value our derivatives fall within Level 2 of the fair value hierarchy, the credit valuation adjustments associated with our derivatives utilize Level 3 inputs, such as estimates of current credit spreads to evaluate the likelihood of default by us and our counterparties. However, as of March 31, 2012, we have assessed the significance of the impact of the credit valuation adjustments on the overall valuation of our derivative positions and have determined that the credit valuation adjustments are not significant to the overall valuation of our derivatives. As a result, we have determined that our derivative valuations in their entirety are classified in Level 2 of the fair value hierarchy. As of March 31, 2012, we had $394,711 of Level 2 derivatives (interest rate swap) classified in accounts payable and accrued liabilities on our consolidated balance sheet.
Derivative Instruments and Hedging Activities
The accounting for changes in the fair value of derivatives depends on the intended use of the derivative and the resulting designation. Derivatives used to hedge exposure to changes in the fair value of an asset, liability or firm commitment attributable to a particular risk are considered fair value hedges. Derivatives used to hedge the exposure to variability in expected future cash flows or other types of forecasted transactions are considered cash flow hedges.
For derivatives designated as fair value hedges, changes in the fair value of the derivative and the hedged item related to the hedged risk are recognized in the statements of operations. For derivatives designated as cash flow hedges, the effective portion of changes in the fair value of the derivative is initially reported in other comprehensive income, outside of earnings and subsequently reclassified to earnings when the hedged transaction affects earnings.
Noncontrolling Interest in Consolidated Entities
We account for the noncontrolling interest in our Operating Partnership in accordance with amended accounting guidance. Due to our control through our general partnership interest in our Operating Partnership and the limited rights of the limited partner, our Operating Partnership, including its wholly-owned subsidiaries, is consolidated with the Company and the limited partner interest is reflected as a noncontrolling interest in the accompanying consolidated balance sheets. In addition, we account for the noncontrolling interest in the SF property in accordance with the amended accounting guidance. The noncontrolling interests shall continue to be attributed their share of income and losses, even if that attribution results in a deficit noncontrolling interest balance.
17
Table of Contents
STRATEGIC STORAGE TRUST, INC. AND SUBSIDIARIES
NOTES TO CONSOLIDATED FINANCIAL STATEMENTS
March 31, 2012
Income Taxes
We made an election to be taxed as a Real Estate Investment Trust (“REIT”), under Sections 856 through 860 of the Internal Revenue Code of 1986, as amended (the “Code”), commencing with our taxable year ended December 31, 2008. To qualify as a REIT, we must meet certain organizational and operational requirements, including a requirement to currently distribute at least 90% of the REIT’s ordinary taxable income to stockholders. As a REIT, we generally will not be subject to federal income tax on taxable income that we distribute to our stockholders. If we fail to qualify as a REIT in any taxable year, we will then be subject to federal income taxes on our taxable income at regular corporate rates and will not be permitted to qualify for treatment as a REIT for federal income tax purposes for four years following the year during which qualification is lost unless the IRS grants us relief under certain statutory provisions. Such an event could materially adversely affect our net income and net cash available for distribution to stockholders. However, we believe that we will be organized and operate in such a manner as to qualify for treatment as a REIT and intend to operate in the foreseeable future in such a manner that we will remain qualified as a REIT for federal income tax purposes. We have concluded that there are no significant uncertain tax positions requiring recognition or disclosure in our consolidated financial statements.
Even if we qualify for taxation as a REIT, we may be subject to certain state and local taxes on our income and property, and federal income and excise taxes on our undistributed income.
We have filed an election to treat the TRSs as taxable REIT subsidiaries. In general, the TRSs may perform additional services for our tenants and generally may engage in any real estate or non-real estate related business. The TRSs are subject to corporate federal and state income tax. The TRSs follow accounting guidance which requires the use of the asset and liability method. Deferred income taxes will represent the tax effect of future differences between the book and tax bases of assets and liabilities.
Per Share Data
Basic earnings per share attributable for all periods presented are computed by dividing net income (loss) by the weighted average number of shares outstanding during the period. Diluted earnings per share are computed by dividing net income (loss) by the weighted average number of shares outstanding, including all restricted stock grants as though fully vested. For the three months ended March 31, 2012 and 2011, 5,625 and 5,625 shares, respectively, of unvested restricted stock were not included in the diluted weighted average shares as such shares were antidilutive.
Recently Issued Accounting Guidance
Accounting Standards Update (“ASU”) No. 2011-04, “Amendments to Achieve Common Fair Value Measurement and Disclosure Requirements in U.S. GAAP and IFRSs” (“ASU 2011-04”), was issued in May 2011. This ASU represents the converged guidance of the FASB and the International Accounting Standards Board on fair value measurement. ASU 2011-04 sets forth common requirements for measuring fair value and for disclosing information about fair value measurements, including a consistent meaning of the term “fair value.” The amendments in this ASU are to be applied prospectively. For public entities, this ASU became effective during interim and annual periods beginning after December 15, 2011. We adopted this ASU in the interim period ending March 31, 2012 and such adoption did not have a material impact on our consolidated financial statements.
ASU No. 2011-05, “Presentation of Comprehensive Income” (“ASU 2011-05”), was issued in June 2011 to allow an entity the option to present the total of comprehensive income, the components of net income, and the components of other comprehensive income in either a single continuous statement of comprehensive income or two separate but consecutive statements. Under either option, an entity is required to present each component of net income along with total net income, each component of other comprehensive income along with a total for other comprehensive income, and a total amount for comprehensive income. ASU 2011-05 eliminates the option to present the components of other comprehensive income as part of the statement of changes in stockholders’ equity. ASU 2011-05 does not change the items that are required to be reported in other comprehensive income or when an item of other comprehensive income must be reclassified to net income and is required to be applied retrospectively. For public entities, this ASU is effective for fiscal years beginning after December 15, 2011. We adopted this ASU in the interim period ending March 31, 2012 by selecting the option of two separate but consecutive statements.
Note 3. USA Self Storage I, DST Acquisition
On February 1, 2011, we, through an indirect wholly-owned subsidiary, closed on the purchase of an additional 73.824% in beneficial interests (“Interests”) in USA Self Storage I, DST (the “DST”), a Delaware Statutory Trust sponsored by our Sponsor, from 36 third-party sellers pursuant to separate purchase agreements with each seller. None of the purchases was contingent upon any of the
18
Table of Contents
STRATEGIC STORAGE TRUST, INC. AND SUBSIDIARIES
NOTES TO CONSOLIDATED FINANCIAL STATEMENTS
March 31, 2012
others. The agreed upon purchase price of the properties relating to the Interests acquired was approximately $27.7 million ($37.55 million total purchase price multiplied by 73.824%), consisting of $10.2 million in cash and the ratable portion of approximately $17.5 million of three separate bank loans held by the three property owning subtrusts (the “Subtrusts”) of the DST (the “Bank of America Loans”).
The acquisition brought our ownership of the DST to 93.577%, including 19.753% in Interests that were acquired previously in unrelated transactions. We closed on the purchase of the remaining 6.423% in Interests on February 15, 2011, with the majority of the consideration being provided in the form of approximately 70,000 limited partnership units in our Operating Partnership. We paid our Advisor approximately $377,000 in acquisition fees in connection with these acquisitions.
The DST, through the Subtrusts, owns 10 self storage facilities located in Georgia, North Carolina and Texas with an aggregate of approximately 5,440 units and 726,000 rentable square feet. The three Subtrusts lease their respective properties to master tenants (the “Tenants”) on a triple-net basis pursuant to master leases (the “Leases”) that have terms of 10 years and expire on November 1, 2015. The Tenants are owned by affiliates of the Sponsor. Under the Leases, the Tenants pay a stated monthly rent equivalent to the monthly debt service payment under the Bank of America Loans, which is paid directly to the lender on behalf of the Subtrusts, a monthly stated rent equivalent to an investor return of 7.0% per annum, and may pay certain annual bonus rent per the terms of the Leases, both of which stated rent and bonus rent are remitted to the Subtrusts. As an Interest holder, we are entitled to our pro rata share of the total rent less the debt service under the Bank of America Loans. The Tenants are entitled to retain any cash flow in excess of these rent payments. We and our Sponsor have agreed to assign 100% of the economic benefits and obligations from these properties to us in exchange for indemnification by us for any potential liability incurred subsequent to the assignment by the Sponsor in connection with the Leases.
The properties owned by the Subtrusts are subject to the three Bank of America Loans, which had an aggregate principal balance of approximately $23.8 million as of February 1, 2011. The Bank of America Loans bear a fixed interest rate of 5.18%, had original terms of 10 years and mature on November 1, 2015. The Bank of America Loans required monthly interest-only payments during the first three years of their terms and now require monthly principal-and-interest payments based on a 30-year amortization period. Each of the Bank of America Loans is secured only by the properties owned by the respective Subtrust that obtained such loan.
19
Table of Contents
STRATEGIC STORAGE TRUST, INC. AND SUBSIDIARIES
NOTES TO CONSOLIDATED FINANCIAL STATEMENTS
March 31, 2012
Note 4. Real Estate Facilities
The following summarizes our activity in real estate facilities during the three months ended March 31, 2012:
| Real estate facilities |
||||
| Balance at December 31, 2011 |
$ | 510,395,576 | ||
| Land disposition |
(1,675,860 | ) | ||
| Impact of foreign exchange rate changes |
592,987 | |||
| Improvements and additions |
1,109,408 | |||
|
|
|
|||
| Balance at March 31, 2012 |
$ | 510,422,111 | ||
|
|
|
|||
| Accumulated depreciation |
||||
| Balance at December 31, 2011 |
$ | (15,971,288 | ) | |
| Depreciation expense |
(3,290,273 | ) | ||
|
|
|
|||
| Balance at March 31, 2012 |
$ | (19,261,561 | ) | |
|
|
|
|||
20
Table of Contents
STRATEGIC STORAGE TRUST, INC. AND SUBSIDIARIES
NOTES TO CONSOLIDATED FINANCIAL STATEMENTS
March 31, 2012
Note 5. Secured Debt
Our secured debt is summarized as follows:
| Carrying value as of: | ||||||||||||||||
| Encumbered Property |
March 31, 2012 |
December 31, 2011 |
Stated
Interest Rate |
Maturity Date |
||||||||||||
| Crescent Springs(14) |
$ | — | $ | 800,000 | 5.00% | 2/11/2014 | ||||||||||
| Florence, Walton(14) |
— | 3,700,000 | 5.00% | 2/11/2014 | ||||||||||||
| Montgomery |
2,821,462 | 2,838,810 | 6.42% | 7/1/2016 | ||||||||||||
| Seabrook |
4,567,137 | 4,584,013 | 5.73% | 1/1/2016 | ||||||||||||
| Greenville |
2,288,608 | 2,297,069 | 5.65% | 3/1/2016 | ||||||||||||
| Kemah |
8,946,281 | 8,975,529 | 6.20% | 6/1/2016 | ||||||||||||
| Memphis |
2,529,445 | 2,538,295 | 5.67% | 12/1/2016 | ||||||||||||
| Tallahassee |
7,601,476 | 7,622,854 | 6.16% | 8/1/2016 | ||||||||||||
| Houston |
2,045,215 | 2,053,995 | 5.67% | 2/1/2017 | ||||||||||||
| San Francisco (consolidated VIE) |
10,478,404 | 10,500,000 | 5.84% | 12/1/2016 | ||||||||||||
| Lake Forest |
18,000,000 | 18,000,000 | 6.47% | 10/1/2017 | ||||||||||||
| Las Vegas I |
1,540,000 | 1,540,000 | 5.72% | 6/1/2017 | ||||||||||||
| Pearland |
3,500,000 | 3,500,000 | 5.93% | 7/1/2017 | ||||||||||||
| Daphne |
1,660,561 | 1,698,407 | 5.47% | 8/1/2020 | ||||||||||||
| Mesa |
3,084,181 | 3,100,077 | 5.38% | 4/1/2015 | ||||||||||||
| Riverdale |
4,800,000 | 4,800,000 | 4.00% | 5/14/2014 | ||||||||||||
| Prudential Portfolio Loan(1) |
31,907,623 | 32,024,379 | 5.42%(2) | 9/5/2019 | ||||||||||||
| Dufferin – Toronto – Ontario, Canada |
6,966,709 | 6,862,800 | 5.20%(3) | 12/15/2013 | ||||||||||||
| Citi Loan(4) |
28,738,497 | 28,829,407 | 5.77% | 2/6/2021 | ||||||||||||
| Bank of America Loan – 1(5) |
4,455,878 | 4,474,310 | 5.18% | 11/1/2015 | ||||||||||||
| Bank of America Loan – 2(6) |
6,751,848 | 6,779,778 | 5.18% | 11/1/2015 | ||||||||||||
| Bank of America Loan – 3(7) |
12,135,755 | 12,185,955 | 5.18% | 11/1/2015 | ||||||||||||
| Prudential – Long Beach(8) |
6,712,619 | 6,736,892 | 5.27% | 9/5/2019 | ||||||||||||
| SF Bay Area – Morgan Hill – CA |
2,980,147 | 2,997,061 | 5.75% | 4/1/2013 | ||||||||||||
| SF Bay Area – Vallejo – CA |
4,456,844 | 4,478,882 | 6.04% | 6/1/2014 | ||||||||||||
| Citi Las Vegas Loan(9) |
7,623,838 | 7,649,929 | 5.26% | 6/6/2021 | ||||||||||||
| ING Loan(10) |
21,818,015 | 21,892,726 | 5.47% | 7/1/2021 | ||||||||||||
| Ladera Ranch |
6,912,493 | 6,942,734 | 5.84% | 6/1/2016 | ||||||||||||
| SF Bay Area – San Lorenzo—CA |
2,152,659 | 2,170,037 | 6.07% | 1/1/2014 | ||||||||||||
| Las Vegas V |
1,694,956 | 1,704,037 | 5.02% | 7/1/2015 | ||||||||||||
| Second Restated KeyBank Credit Facility(11) |
82,000,000 | 76,635,000 | 4.74% | 12/24/2014 | ||||||||||||
| Key Bank Bridge Loan(12) |
19,000,000 | 28,000,000 | 6.65% | 8/31/2012 | ||||||||||||
| Mississauga(13) – Ontario, Canada |
3,106,470 | 2,194,874 | 5.00% | 10/31/2014 | ||||||||||||
| Net fair value adjustment |
(985,303 | ) | (1,064,643 | ) | ||||||||||||
|
|
|
|
|
|||||||||||||
| Total secured debt |
$ | 322,291,818 | $ | 330,043,207 | ||||||||||||
|
|
|
|
|
|||||||||||||
21
Table of Contents
STRATEGIC STORAGE TRUST, INC. AND SUBSIDIARIES
NOTES TO CONSOLIDATED FINANCIAL STATEMENTS
March 31, 2012
| (1) | This portfolio loan is comprised of 11 discrete mortgage loans on 11 respective properties (Manassas, Marietta, Erlanger, Pittsburgh, Weston, Fort Lee, Oakland Park, Tempe, Phoenix II, Davie and Las Vegas II). Each of the individual loans is cross-collateralized by the other ten. |
| (2) | Ten of the loans in this portfolio loan bear an interest rate of 5.43% and the remaining loan bears an interest rate of 5.31%. The weighted average interest rate of this portfolio is 5.42%. |
| (3) | On January 12, 2011, we encumbered the Dufferin property with a Canadian dollar denominated loan of $7 million which bears interest at the bank’s floating rate plus 3.5% (subject to a reduction in certain circumstances). The rate in effect at March 31, 2012 was 5.2%. |
| (4) | This portfolio loan encumbers 11 properties (Biloxi, Gulf Breeze I, Alpharetta, Florence II, Jersey City, West Mifflin, Chicago – 95th St., Chicago – Western Ave., Chicago – Ogden Ave., Chicago – Roosevelt Rd. and Las Vegas IV). |
| (5) | This loan encumbers the Lawrenceville I and II properties. |
| (6) | This loan encumbers the Concord, Hickory and Morganton properties. |
| (7) | This loan encumbers the El Paso II, III, IV & V properties as well as the Dallas property. |
| (8) | This loan is cross-collateralized by the 11 properties discussed in (1). |
| (9) | This loan encumbers the Las Vegas VII and Las Vegas VIII properties. |
| (10) | This portfolio loan is comprised of 11 discrete mortgage loans on 11 respective properties (Peachtree City, Buford, Jonesboro, Ellenwood, Marietta II, Collegeville, Skippack, Ballston Spa, Trenton, Fredericksburg and Sandston). Each of the individual loans has a term of 30 years and matures on July 1, 2041. ING has the option to require payment of the loan in full every five years beginning on July 1, 2021. |
| (11) | This credit facility is collateralized by 24 properties (Phoenix I, Gulf Breeze II, Los Angeles – La Cienega, Las Vegas III, Las Vegas VI, El Paso I, Hampton, SF Bay Area – Gilroy, Toms River, the Homeland Portfolio, Crescent Springs, Florence, Walton and a parcel of unimproved land). For additional discussion related to the maturity date see footnote (1) below. |
| (12) | This loan is collateralized by the same properties as the Second Restated KeyBank Credit Facility. This loan has a variable interest rate, which as of March 31, 2012 was 6.65%. |
| (13) | In December 2011, we entered into a Canadian dollar denominated construction loan with an aggregate commitment amount of approximately $9.2 million. Such loan bears interest at the bank’s floating rate, plus 2% (totaling 5.0% as of March 31, 2012). |
| (14) | These loans were refinanced in January 2012 through the Second Restated KeyBank Credit Facility. |
As of March 31, 2012 and December 31, 2011, the Company’s secured promissory notes shown above were secured by the properties shown above, which properties had net book values of approximately $488 million and $489 million, respectively.
Citi Loan
On January 28, 2011, we encumbered 11 of our self storage facilities (the “Encumbered Properties”) in connection with a loan obtained from The Citigroup Global Markets Realty Corp. (the “Citi Loan”) in the principal amount of approximately $29.1 million. The proceeds from the Citi Loan were used to repay the existing debt obligations of approximately $5 million related to two of our existing Encumbered Properties, to make future acquisitions of self storage facilities and for other general corporate purposes. The Citi Loan has a term of ten years and matures on February 6, 2021. The Citi Loan bears a fixed rate of 5.77% per annum on a 30-year amortization schedule. Payments of principal and interest are due on a monthly basis. We may prepay the Citi Loan without penalty in the last three months of the ten-year term. We have guaranteed the obligations under the Citi Loan in limited circumstances set forth in the loan documents. The Citi Loan contains a number of other customary terms and covenants. The net book value of the Encumbered Properties as of March 31, 2012 was approximately $51 million. Such amounts are only available to satisfy the obligations of the Citi Loan.
ING Loan
On June 10, 2011, in connection with our acquisition of a portfolio of 11 self storage properties located in five states (the “B&B Portfolio”), we, through 11 special purpose entities, entered into a loan agreement and various promissory notes and other loan documents for 11 individual loans obtained from ING Life Insurance and Annuity Company in the principal amount of approximately $22 million (collectively, the “ING Loan”). The proceeds from the ING Loan were used to help fund the acquisition of the B&B Portfolio. Each of the individual loans comprising the ING Loan has a term of 30 years and matures on July 1, 2041. ING has the option to require payment of the loan in full every five years beginning on July 1, 2021. Each of the loans bears a fixed interest rate of 5.47%, based on a 30-year amortization schedule. Payments of principal and interest are due on a monthly basis, and we may prepay the ING Loan after July 1, 2012 upon 60 days’ written notice to ING, subject to a prepayment premium.
22
Table of Contents
STRATEGIC STORAGE TRUST, INC. AND SUBSIDIARIES
NOTES TO CONSOLIDATED FINANCIAL STATEMENTS
March 31, 2012
The ING Loan is secured by interests in the 11 properties constituting the B&B Portfolio (Peachtree City, Buford, Jonesboro, Ellenwood, Marietta II, Collegeville, Skippack, Ballston Spa, Trenton, Fredericksburg and Sandston). The security instruments for each encumbered property are cross-collateralized and cross-defaulted with those related to the other encumbered properties. In addition, each of the 11 property-owning special purpose entities has guaranteed the obligations under each of the other 10 loans and granted a junior security interest in the encumbered property owned by the respective special purpose entity.
We have guaranteed the obligations of the 11 special purpose entities under the ING Loan in certain limited circumstances set forth in the loan documents. The ING Loan contains a number of other customary terms and covenants.
KeyBank Credit Facility
On July 1, 2011, we obtained a delayed draw credit facility (the “KeyBank Credit Facility”) from KeyBank, National Association, as administrative agent (“KeyBank”). The total principal amount of commitments available under the KeyBank Credit Facility was $22 million, of which $15 million was initially drawn on July 1, 2011 and was secured by our Las Vegas III, Las Vegas VI and La Cienega-LA properties. We used the initial $15 million draw on the KeyBank Credit Facility to assist in financing the acquisition of the Ladera Ranch property. In connection with closing the Hampton and SF Bay Area – Gilroy properties we drew down an additional $3 million and $4 million, respectively.
The KeyBank Credit Facility originally had a term of 90 days, subject to a 90-day extension, which was exercised. This facility was amended on November 15, 2011 (see below).
In connection with the KeyBank Credit Facility, our Operating Partnership paid customary lender fees, legal fees and other expenses.
Restated KeyBank Credit Facility
On November 15, 2011, our Operating Partnership and five of our Operating Partnership’s wholly-owned special purpose entities entered into an Amended and Restated Credit Agreement pursuant to which KeyBank provided our Operating Partnership with up to $30 million in financing commitments under a revised revolving credit facility (the “Restated KeyBank Credit Facility”). At closing, our Operating Partnership drew down approximately $20 million under the Restated KeyBank Credit Facility, which was secured by our Las Vegas III, Las Vegas VI, Los Angeles – La Cienega, Hampton and SF Bay Area – Gilroy properties. We used the proceeds of the Restated KeyBank Credit Facility to repay the previously outstanding KeyBank Credit Facility, which had a balance of approximately $19.7 million and was to mature on December 28, 2011.
The Restated KeyBank Credit Facility had a term of three years, required monthly interest-only payments and was scheduled to mature on November 15, 2014. We had the option of selecting one of three variable interest rates, which had applicable spreads that varied based on our total leverage ratio.
The Restated KeyBank Credit Facility was secured by cross-collateralized first mortgage liens or first lien deeds of trust on all properties refinanced or acquired using borrowings thereunder and was cross-defaulted to the KeyBank Working Capital Line (defined below) and any other recourse debt of $25 million or greater in the aggregate or non-recourse debt of $75 million or greater in the aggregate.
In connection with the Restated KeyBank Credit Facility, we paid customary lender fees, legal fees and other expenses.
This facility was amended on December 27, 2011 (see below).
KeyBank Working Capital Line
On November 15, 2011, our Operating Partnership and the same five SPEs, included in the Restated KeyBank Credit Facility, entered into a separate credit agreement pursuant to which KeyBank provided our Operating Partnership with up to $10 million in financing commitments under a working capital line of credit (the “KeyBank Working Capital Line”), none of which was drawn down by our Operating Partnership at closing or through the date of termination of the line (see below).
Second Restated KeyBank Credit Facility
On December 27, 2011, in connection with the acquisition of the Homeland Portfolio (an $80 million portfolio of 10 properties in Atlanta, GA and two properties in Jacksonville, FL), our Operating Partnership and various property owning SPEs entered into a secured credit facility (the “Second Restated KeyBank Credit Facility”) with KeyBank with total commitments of $82 million (such facility replaced our then existing $30 million Restated KeyBank Credit Facility, which had
23
Table of Contents
STRATEGIC STORAGE TRUST, INC. AND SUBSIDIARIES
NOTES TO CONSOLIDATED FINANCIAL STATEMENTS
March 31, 2012
approximately $20 million outstanding before the purchase of the Homeland Portfolio) and we drew down an additional approximately $56.6 million thereunder. On January 12, 2012, we drew down an additional approximately $5.4 million in connection with the repayment of the previously outstanding debt on our Crescent Springs, Florence and Walton properties. At any time prior to June 15, 2013, our Operating Partnership may request funding up to an additional $68 million (for a total loan amount of up to $150 million). Any such additional funding will be subject to the sole discretion of KeyBank and any other lender who may ultimately participate in the Second Restated KeyBank Credit Facility.
The Second Restated KeyBank Credit Facility has a term of three years, maturing on December 24, 2014, subject to two, one-year extension options (subject to the fulfillment of certain conditions), and requires monthly interest-only payments.
We were required to purchase an interest rate swap with a notional amount of $45 million, which requires us to pay an effective fixed interest rate of approximately 5.41% on the hedged portion of the debt. For the remaining amount outstanding, under the terms of the Second Restated KeyBank Credit Facility, our Operating Partnership has the option of selecting one of three variable interest rates which have applicable spreads. Our Operating Partnership has elected to have a 30-day LIBOR rate apply, which, including the applicable spread, equaled an interest rate of approximately 4.74% as of March 31, 2012. Our Operating Partnership may change this election from time to time for the non-hedged portion of the debt, as provided in the agreement.
The Second Restated KeyBank Credit Facility is secured by cross-collateralized first mortgage liens or first lien deeds of trust on all properties in the Homeland Portfolio, the Las Vegas III, Las Vegas VI, Los Angeles – La Cienega, Hampton, SF Bay Area – Gilroy Phoenix I, Gulf Breeze II, El Paso I, Toms River, Crescent Springs, Florence and Walton properties and a parcel of unimproved land in Ladera Ranch, California, and is cross-defaulted to the KeyBank Bridge Loan (defined below) and any other recourse debt of $25 million or greater in the aggregate or non-recourse debt of $75 million or greater in the aggregate. Our Operating Partnership may prepay the Second Restated KeyBank Credit Facility, in whole or in part, at any time without penalty. Pursuant to that certain guaranty dated December 27, 2011 in favor of KeyBank, we serve as a guarantor of all obligations due under the Second Restated KeyBank Credit Facility.
The Second Restated KeyBank Credit Facility provides that if KeyBank is unable to syndicate the loan to other lenders such that its aggregate lending commitment is not reduced from $82 million to $36 million by March 31, 2012, then, on or before June 30, 2012, our Operating Partnership shall use its best efforts to refinance all or a portion of the mortgaged properties, other than those in the Homeland Portfolio, and use the net refinance proceeds to reduce the principal balance of the Second Restated KeyBank Credit Facility to an amount no greater than $45 million. Upon repayment of the KeyBank Bridge Loan (defined below), if KeyBank is unable to syndicate the loan and the remaining amount otherwise outstanding has not been reduced to $45 million, our Operating Partnership shall pay monthly the greater of $5 million or 100% of the net offering proceeds from our Offering to reduce the principal balance of the Second Restated KeyBank Credit Facility to an amount no greater than $45 million; provided that, in any event, the Second Restated KeyBank Credit Facility must be repaid such that the principal balance is no greater than $45 million by December 31, 2012. If KeyBank determines that successful syndication cannot be achieved such that its aggregate lending commitment is reduced to $36 million, KeyBank reserves the right, after consultation with us, to change the terms of the Second Restated KeyBank Credit Facility, if KeyBank reasonably and in good faith determines that such changes are advisable in order to ensure successful syndication. As of March 31, 2012, KeyBank had not successfully syndicated the loan, but is continuing its efforts to do so (see footnote (1) in the following table for additional discussion).
In connection with the Second Restated KeyBank Credit Facility, our Operating Partnership paid customary lender fees, legal fees and other expenses. Our Operating Partnership will be required to pay additional lender fees on any unused commitments and upon the exercise of each extension option. Per the terms of the Second Restated KeyBank Credit Facility, we were required to fund a $1.55 million interest reserve account at closing, which KeyBank may draw upon on a monthly basis in an amount equal to the shortfall between the net operating income of the mortgaged properties and the interest on the Second Restated KeyBank Credit Facility. We are required to replenish the interest reserve account if it falls below a certain threshold, but will be refunded the entire balance upon achieving (as defined therein) a debt service coverage ratio (“DSCR”) of 1.30 to 1 for two consecutive quarters provided no event of default then exists.
The Second Restated KeyBank Credit Facility contains a number of customary representations, warranties, indemnities and covenants, including, but not limited to, the following (as defined therein and tested as of the close of each fiscal quarter):
| • | a maximum total leverage ratio (beginning at 65% and decreasing to 60% on July 1, 2012, 57.5% on October 1, 2012, 55% on October 1, 2013 and 50% on October 1, 2014); |
24
Table of Contents
STRATEGIC STORAGE TRUST, INC. AND SUBSIDIARIES
NOTES TO CONSOLIDATED FINANCIAL STATEMENTS
March 31, 2012
| • | a minimum interest service coverage ratio (beginning at 1.50 to 1 and increasing to 1.60 to 1 on July 1, 2012 and 1.75 to 1 on January 1, 2014); |
| • | a minimum fixed charge ratio (beginning at 1.30 to 1 and increasing to 1.35 to 1 on July 1, 2012 and 1.50 to 1 on January 1, 2014); |
| • | a minimum DSCR (beginning on March 31, 2014 at 1.10 to 1 and increasing to 1.30 to 1 on March 31, 2015 and 1.40 to 1 on March 31, 2016); |
| • | a minimum liquidity (unencumbered cash and cash equivalents plus marketable securities) of $2 million; and |
| • | a minimum tangible net worth of at least $175 million plus 75% of the net proceeds of our ongoing public offering (less funded share redemptions, but in no event may our net worth be less than $175 million) |
We have ten business days from the date on which any violation of the above covenants occurs in which to cure the violation, to the extent the violation can be cured with a cash payment. The terms of the Second Restated KeyBank Credit Facility also restrict us and our Operating Partnership in our ability to incur debt in the future without the consent of KeyBank and limits availability thereunder to the lesser of certain loan-to-value and debt yield calculations set forth in the agreement.
KeyBank Bridge Loan
On December 27, 2011, in connection with the acquisition of the Homeland Portfolio, our Operating Partnership and the related property owning SPEs also obtained a bridge loan with total commitments of $28 million (the “KeyBank Bridge Loan”) from KeyBank ($10 million of which was previously committed with nothing outstanding under our previously existing KeyBank Working Capital Line, which was terminated) and drew down the entire committed amount.
The KeyBank Bridge Loan matures on August 31, 2012 and requires monthly principal and interest payments, with the monthly principal portion of the payment increasing from $3 million in January, February and March 2012 to $4 million in April, May and June 2012 and $5 million July 2012. Under the terms of the KeyBank Bridge Loan, our Operating Partnership has the option of selecting one of three variable interest rates, which have applicable spreads. Our Operating Partnership elected to have a 30-day LIBOR rate apply, which, including the applicable spread, equaled an interest rate of approximately 6.65% as of March 31, 2012. Our Operating Partnership may change this election from time to time, as provided in the agreement.
The KeyBank Bridge Loan is secured similarly to the Second Restated KeyBank Credit Facility, but, in addition, is secured by a pledge of the net equity proceeds of our Offering and a pledge of our Operating Partnership’s economic interest in each of the related property owning SPEs. The KeyBank Bridge Loan is cross-defaulted to the Second Restated KeyBank Credit Facility and any other recourse debt of us or our Operating Partnership of $25 million or greater in the aggregate or non-recourse debt of $75 million or greater in the aggregate. Our Operating Partnership may prepay the KeyBank Bridge Loan, in whole or in part, at any time without penalty. Pursuant to that certain guaranty dated December 27, 2011 in favor of KeyBank, we serve as a guarantor of all obligations due under the KeyBank Bridge Loan.
In connection with the KeyBank Bridge Loan, the Operating Partnership paid customary lender fees, legal fees and other expenses. The KeyBank Bridge Loan is subject to similar representations, warranties, indemnities and covenants as those described above for the Second Restated KeyBank Credit Facility.
The following table presents the future principal payment requirements on outstanding secured promissory notes as of March 31, 2012:
| 2012 |
$ | 58,366,439 | (1) | |
| 2013 |
12,820,529 | |||
| 2014 |
62,304,713 | |||
| 2015 |
29,372,676 | |||
| 2016 |
45,413,201 | |||
| 2017 and thereafter |
114,999,563 | |||
|
|
|
|||
| Total payments |
323,277,121 | |||
| Unamortized fair value adjustment |
(985,303 | ) | ||
|
|
|
|||
| Total |
$ | 322,291,818 | ||
|
|
|
25
Table of Contents
STRATEGIC STORAGE TRUST, INC. AND SUBSIDIARIES
NOTES TO CONSOLIDATED FINANCIAL STATEMENTS
March 31, 2012
| (1) | Included in the 2012 principal payment requirements above is $19 million related to the Bridge Loan which matures on August 31, 2012 as described above. Subsequent to March 31, 2012, we have made scheduled monthly principal payments totaling $4 million which has reduced the amount outstanding on the Bridge Loan to $15 million as of April 30, 2012. We intend to continue to fund the required monthly principal payments on the Bridge Loan using proceeds from our Offering, cash on hand and cash flow from operations. |
Also included in the 2012 principal payment requirements above is $37 million related to the Second Restated KeyBank Credit Facility. The $37 million represents that portion of the Second Restated KeyBank Credit Facility which would be required to be repaid in 2012 if KeyBank is unable to successfully syndicate the loan to other lenders as described above. If such successful syndication is not realized, we plan to refinance the portion of the Secured KeyBank Credit Facility related to the non-Homeland Portfolio on a long-term basis at favorable terms, the proceeds from which, along with proceeds from our Offering, will be used to reduce the outstanding balance of the Second Restated KeyBank Credit Facility in accordance with the terms of the agreement.
We record the amortization of debt discounts related to fair value adjustments to interest expense. The weighted average interest rate of the Company’s fixed rate debt as of March 31, 2012 was approximately 5.7%.
Note 6. Derivative Instruments – Cash Flow Hedge of Interest Rate Risk
Our objectives in using interest rate derivatives are to add stability to interest expense and to manage our exposure to interest rate movements. To accomplish this objective, we use interest rate swaps as part of our interest rate risk management strategy. Interest rate swaps designated as cash flow hedges involve the receipt of variable amounts from a counterparty in exchange for us making fixed-rate payments over the life of the agreements without exchange of the underlying notional amount.
The effective portion of the change in the fair value of the derivative designated and that qualifies as a cash flow hedge is recorded in accumulated other comprehensive income (“AOCI”) and is subsequently reclassified into earnings in the period that the hedged forecasted transaction affects earnings. During 2011 and 2012, such derivatives were used to hedge the variable cash flows associated with existing variable-rate debt. The ineffective portion of the change in fair value of the derivatives is recognized directly in earnings, of which there were none during the three months ended March 31, 2012 and 2011.
Amounts reported in AOCI related to derivatives will be reclassified to interest expense as interest payments are made on our variable-rate debt. Over the next twelve months, we estimate that an additional $251,000 will be reclassified as an increase to interest expense.
As of March 31, 2012, we had one derivative outstanding, which was an interest rate derivative that was designated as a cash flow hedge of interest rate risk:
| Interest Rate Derivative | Number of Instruments | Notional | ||
|
Interest Rate Swaps |
1 | $45,000,000 |
The table below presents the fair value of our derivative financial instruments as well as their classification on the balance sheet as of March 31, 2012 and December 31, 2011:
| As of March 31, 2012 | As of December 31, 2011 | |||||||||||
| Balance Sheet Location |
Fair Value | Balance Sheet Location |
Fair Value | |||||||||
| Interest rate derivatives |
||||||||||||
| Assets |
Other assets | $ | — | Other assets | $ | — | ||||||
|
|
|
|
|
|||||||||
| Liabilities |
Accounts payable and accrued liabilities |
$ | 394,711 | Accounts payable and accrued liabilities |
$ | 311,630 | ||||||
|
|
|
|
|
|||||||||
26
Table of Contents
STRATEGIC STORAGE TRUST, INC. AND SUBSIDIARIES
NOTES TO CONSOLIDATED FINANCIAL STATEMENTS
March 31, 2012
We have agreements with our derivative counterparty that contain a provision where if we either default or are capable of being declared in default, including default where repayment of the indebtedness has not been accelerated, on any of our indebtedness, then we could also be declared in default on our derivative obligations.
Certain of our agreements with our derivative counterparties contain provisions where if a specified event or condition (Credit Event Upon Merger) occurs that materially changes our creditworthiness in an adverse manner, we may be required to fully collateralize our obligations under the derivative instrument. As of March 31, 2012 we had not posted any collateral.
As of March 31, 2012, the fair value of derivatives in a net liability position, which includes accrued interest but excludes any adjustment for nonperformance risk, related to these agreements was approximately $424,000. If we had breached any of these provisions at March 31, 2012, we could have been required to settle our obligations under the agreements at their termination value of approximately $424,000.
Note 7. Related Party Transactions
Fees to Affiliates
Our Advisory Agreement with our Advisor and dealer manager agreement (“Dealer Manager Agreement”) with our Dealer Manager entitle our Advisor and our Dealer Manager to specified fees upon the provision of certain services with regard to the Offering and investment of funds in real estate properties, among other services, as well as reimbursement for organizational and offering costs incurred by our Advisor on our behalf and reimbursement of certain costs and expenses incurred by our Advisor in providing services to us.
Organization and Offering Costs
Organization and offering costs of the Offering may be paid by our Advisor on our behalf and will be reimbursed to our Advisor from the proceeds of the Offering. Organization and offering costs consist of all expenses (other than sales commissions and the dealer manager fee) to be paid by us in connection with the Offering, including our legal, accounting, printing, mailing and filing fees, charges of our escrow holder and other accountable offering expenses, including, but not limited to, (i) amounts to reimburse our Advisor for all marketing related costs and expenses such as salaries and direct expenses of employees of our Advisor and its affiliates in connection with registering and marketing our shares; (ii) technology costs associated with the Offering; (iii) our costs of conducting our training and education meetings; (iv) our costs of attending retail seminars conducted by participating broker-dealers; and (v) payment or reimbursement of bona fide due diligence expenses. Our Advisor must reimburse us within 60 days after the end of the month which the Offering terminates to the extent we paid or reimbursed organization and offering costs (excluding sales commissions and dealer manager fees) in excess of 3.5% of the gross offering proceeds from the Primary Offering.
Advisory Agreement
We do not expect to have any employees. Our Advisor is primarily responsible for managing our business affairs and carrying out the directives of our board of directors. Our Advisor receives various fees and expenses under the terms of our Advisory Agreement. As discussed above, we are required under our Advisory Agreement to reimburse our Advisor for organization and offering costs; provided, however, our Advisor must reimburse us within 60 days after the end of the month in which the Offering terminates to the extent we paid or reimbursed organization and offering costs (excluding sales commissions and dealer manager fees) in excess of 3.5% of the gross offering proceeds from the Primary Offering.
Our Advisory Agreement also requires our Advisor to reimburse us to the extent that offering expenses, including sales commissions, dealer manager fees and organization and offering expenses, are in excess of 15% of gross proceeds from the Offering. Our Advisor receives acquisition fees equal to 2.5% of the contract purchase price of each property we acquire plus reimbursement of any acquisition expenses the Advisor incurs. Our Advisor also receives a monthly asset management fee equal to one-twelfth of 1.0% of the average of the aggregate asset value, as defined, of our assets, excluding those assets acquired as part of the mergers with REIT I and REIT II; provided, however, that if the average of the aggregate asset value, as defined, of our assets exceeds $500 million, the monthly asset management fee shall be reduced to one-twelfth of 0.75% of the average of the aggregate asset value, as defined, of those assets exceeding $500 million unless our modified funds from operations (as defined in the Advisory Agreement), including payment of the fee, is greater than 100% of our distributions in any month. The monthly asset management fees for our properties acquired through our mergers with REIT I and REIT II and the USA Self Storage I, DST acquisition are equal to 2.0% of the gross revenues from the properties and are paid to affiliates of our Sponsor. Under our Advisory Agreement, our Advisor receives fees in an amount equal to up to one-half of the total real estate commission paid but in no event to exceed an amount equal to 3.0% of the contract sale price for each property we sell as long as our Advisor provides substantial assistance in connection with the sale. The
27
Table of Contents
STRATEGIC STORAGE TRUST, INC. AND SUBSIDIARIES
NOTES TO CONSOLIDATED FINANCIAL STATEMENTS
March 31, 2012
total real estate commissions paid (including disposition fee paid to our Advisor) may not exceed the lesser of a competitive real estate commission or an amount equal to 6.0% of the contract sale price of the property and are subordinated to receipt of our stockholders of a 6% cumulative, non-compounded, annual return on such stockholders’ invested capital. Our Advisor may also be entitled to various subordinated fees if we (1) list our shares of common stock on a national exchange, (2) terminate our Advisory Agreement, or (3) liquidate our portfolio.
The advisors of REIT I and REIT II are entitled to various fees related to their properties if we (1) dispose of a property, (2) liquidate our portfolio, or (3) terminate their advisory agreement.
Our Advisory Agreement provides for reimbursement of our Advisor’s direct and indirect costs of providing administrative and management services to us (see footnote (1) in the following table for a discussion of the Advisor’s permanent waiver of certain reimbursements for the three months ended March 31, 2012). Beginning October 1, 2009 (four fiscal quarters after the acquisition of our first real estate asset), our Advisor must pay or reimburse us the amount by which our aggregate annual operating expenses, as defined, exceed the greater of 2% of our average invested assets or 25% of our net income, as defined, unless a majority of our independent directors determine that such excess expenses were justified based on unusual and non-recurring factors. For any fiscal quarter for which total operating expenses for the 12 months then ended exceed the limitation, we will disclose this fact in our next quarterly report or within 60 days of the end of that quarter and send a written disclosure of this fact to our stockholders. In each case the disclosure will include an explanation of the factors that the independent directors considered in arriving at the conclusion that the excess expenses were justified. For the 12 months ended March 31, 2012, our aggregate annual operating expenses, as defined, did not exceed the thresholds described above.
Dealer Manager Agreement
Our Dealer Manager receives a sales commission of up to 7.0% of gross proceeds from sales in the Primary Offering and a dealer manager fee equal to up to 3.0% of gross proceeds from sales in the Primary Offering under the terms of our Dealer Manager Agreement. Our Dealer Manager has entered into participating dealer agreements with certain other broker-dealers which authorizes them to sell our shares. Upon sale of our shares by such broker-dealers, our Dealer Manager will re-allow all of the sales commissions paid in connection with sales made by these broker-dealers. Our Dealer Manager may also re-allow to these broker-dealers a portion of the 3.0% dealer manager fee as marketing fees, reimbursement of certain costs and expenses of attending training and education meetings sponsored by our Dealer Manager, payment of attendance fees required for employees of our Dealer Manager or other affiliates to attend retail seminars and public seminars sponsored by these broker-dealers, or to defray other distribution related expenses. Our Dealer Manager also receives reimbursement of bona fide due diligence expenses; however, to the extent these due diligence expenses cannot be justified, any excess over actual due diligence expenses will be considered underwriting compensation subject to a 10% FINRA limitation and, when aggregated with all other non-accountable expenses may not exceed 3% of gross offering proceeds from sales in the Primary Offering.
Our dealer manager agreement with our prior dealer manager for our Initial Offering was substantially equivalent to the terms described above.
Affiliated Dealer Manager
Our president owns a 15% beneficial non-voting equity interest in our Dealer Manager.
Property Management Agreement
Our Property Manager receives a fee for its services in managing our properties, except for those properties acquired in the REIT I merger transaction and the USA Self Storage I, DST acquisition, generally equal to 6% of the gross revenues from the properties plus reimbursement of the direct costs of managing the properties under our property management agreement. The properties acquired in the REIT I merger transaction and USA Self Storage I, DST acquisition are managed by an affiliate of our Sponsor. As a condition of the REIT II merger transaction, the monthly property management fees for properties acquired from REIT II have been waived until the FFO of the properties acquired from REIT II, as defined in the merger agreement relating to the REIT II merger transaction, reaches $0.70 per share. In the event that our Property Manager assists with the development or redevelopment of a property, we may pay a separate market-based fee for such services.
28
Table of Contents
STRATEGIC STORAGE TRUST, INC. AND SUBSIDIARIES
NOTES TO CONSOLIDATED FINANCIAL STATEMENTS
March 31, 2012
Pursuant to the terms of the agreements described above, the following summarizes the related party costs incurred for the three months ended March 31, 2012 and 2011:
| Three Months Ended March 31, 2012 |
Three Months Ended March 31, 2011 |
|||||||
| Expensed |
||||||||
| Reimbursement of operating expenses (including organizational costs)(1) |
$ | 15,518 | $ | 270,647 | ||||
| Asset management fees |
1,116,127 | 565,346 | ||||||
| Property management fees |
852,822 | 507,545 | ||||||
| Acquisition expenses |
27,031 | 1,233,159 | ||||||
| Additional Paid-in Capital |
||||||||
| Selling commissions |
887,105 | 1,554,811 | ||||||
| Dealer Manager fee |
380,188 | 666,347 | ||||||
| Reimbursement of offering costs |
127,656 | 119,757 | ||||||
|
|
|
|
|
|||||
| Total |
$ | 3,406,447 | $ | 4,917,612 | ||||
|
|
|
|
|
|||||
| (1) | For the three months ended March 31, 2012, the Advisor permanently waived certain reimbursable indirect costs, primarily payroll and related overhead costs, related to administrative and management services, totaling approximately $260,000. Such amounts were waived permanently and accordingly, will not be paid to the Advisor. |
As of March 31, 2012 and December 31, 2011, we had amounts due to affiliates totaling $1,247,080 and $2,065,615, respectively.
Tenant Reinsurance Program
Beginning in 2011, affiliates of our Sponsor, including our president, are participating in a tenant reinsurance program whereby tenants of our self storage facilities can purchase insurance to cover damage or destruction to their property while stored at our facilities. Such affiliates have invested in a Cayman Islands company (the “Reinsurance Company”) that will insure a portion of the insurance required by the program insurer to cover the risks of loss at participating facilities in the program. The program insurer provides fees (approximately 50% of the tenant premium paid) to us as owner of the facilities. The Reinsurance Company may be required to fund additional capital or entitled to receive distributions of profits depending on actual losses incurred under the program. For the three months ended March 31, 2012 and 2011, we earned approximately $0.3 million and $0 in fees, respectively, in connection with the tenant reinsurance program.
Note 8. Commitments and Contingencies
Distribution Reinvestment Plan
We have adopted a distribution reinvestment plan that allows our stockholders to have distributions otherwise distributable to them invested in additional shares of our common stock. The plan became effective on the effective date of our initial public offering. The purchase price per share was the higher of $9.50 per share or 95% of the fair market value of a share of our common stock. Effective March 28, 2012, the purchase price per share under the distribution reinvestment plan was changed to 95% of the offering price of our shares. No sales commission or dealer manager fee will be paid on shares sold through the distribution reinvestment plan. We may amend or terminate the distribution reinvestment plan for any reason at any time upon 10 days’ prior written notice to stockholders. As of March 31, 2012 we have sold approximately 2.1 million shares through our distribution reinvestment plan.
Share Redemption Program
We have adopted a share redemption program that may enable stockholders to sell their shares to us in limited circumstances. As long as our common stock is not listed on a national securities exchange or over-the-counter market, our stockholders who have held their stock for at least one year may be able to have all or any portion of their shares of stock redeemed by us. We may redeem the shares of stock presented for redemption for cash to the extent that we have sufficient funds available to fund such redemption.
29
Table of Contents
STRATEGIC STORAGE TRUST, INC. AND SUBSIDIARIES
NOTES TO CONSOLIDATED FINANCIAL STATEMENTS
March 31, 2012
Our board of directors may amend, suspend or terminate the share redemption program with 30 days’ notice to our stockholders. We may provide this notice by including such information in a Current Report on Form 8-K or in our annual or quarterly reports, all publicly filed with the SEC, or by a separate mailing to our stockholders. Our share redemption program was amended on October 1, 2011 and March 28, 2012. The complete terms of our share redemption program, as so revised, are described in detail in our prospectus, as supplemented. You may also see our Form 8-K filed with the SEC on February 24, 2012.
The amount that we may pay to redeem stock for redemptions is the redemption price set forth in the following table which is based upon the number of years the stock is held:
| Number of Years Held | Redemption Price | |
| Less than 1 | No Redemption Allowed | |
| 1 or more but less than 2 | 90.0% of Redemption Amount | |
| 2 or more but less than 3 | 92.5% of Redemption Amount | |
| 3 or more but less than 4 | 95.0% of Redemption Amount | |
| 4 or more | 100.0% of Redemption Amount | |
At any time we are engaged in an offering of shares, the Redemption Amount for shares purchased under our share redemption program will always be equal to or lower than the applicable per share offering price. As long as we are engaged in an offering, the Redemption Amount shall be the lesser of the amount the stockholder paid for their shares or the price per share in the current offering. If we are no longer engaged in an offering, the per share Redemption Amount will be determined by our board of directors. Our board will announce any redemption price adjustment and the time period of its effectiveness as a part of its regular communications with our stockholders. At any time the redemption price during an offering is determined by any method other than the offering price, if we have sold property and have made one or more special distributions to our stockholders of all or a portion of the net proceeds from such sales, the per share redemption price will be reduced by the net sale proceeds per share distributed to investors prior to the redemption date as a result of the sale of such property in the special distribution. Our board will, in its sole discretion, determine which distributions, if any, constitute a special distribution. While our board does not have specific criteria for determining a special distribution, we expect that a special distribution will only occur upon the sale of a property and the subsequent distribution of the net sale proceeds.
There are several limitations on our ability to redeem shares under the share redemption program including, but not limited to:
| • | Unless the shares are being redeemed in connection with a stockholder’s death, “qualifying disability” (as defined under the share redemption program) or bankruptcy, we may not redeem shares until the stockholder has held his or her shares for one year. |
| • | During any calendar year, we will not redeem in excess of 5% of the weighted-average number of shares outstanding during the prior calendar year. |
| • | The cash available for redemption is limited to the proceeds from the sale of shares pursuant to our distribution reinvestment plan. |
| • | We have no obligation to redeem shares if the redemption would violate the restrictions on distributions under Maryland law, which prohibits distributions that would cause a corporation to fail to meet statutory tests of solvency. |
Operating Partnership Redemption Rights
The limited partners of our Operating Partnership have the right to cause our Operating Partnership to redeem their limited partnership units for cash equal to the value of an equivalent number of our shares, or, at our option, we may purchase their limited partnership units by issuing one share of our common stock for each limited partnership unit redeemed. The holders of the Class D Units have agreed to modified exchange rights that prevent them from exercising their exchange rights: (1) until the earlier of (a) a listing of our shares or (b) our merger into another entity whereby our stockholders receive securities listed on a national securities exchange; or (2) until FFO of the properties contributed by the holders of the Class D Units reaches $0.70 per share, based on our fully-loaded cost of equity. These rights may not be exercised under certain circumstances that could cause us to lose our REIT election. Furthermore, limited partners may exercise their redemption rights only after their limited partnership units have been outstanding for one year. Our Advisor is prohibited from exchanging or otherwise transferring its limited partnership units so long as our Sponsor is acting as our sponsor.
30
Table of Contents
STRATEGIC STORAGE TRUST, INC. AND SUBSIDIARIES
NOTES TO CONSOLIDATED FINANCIAL STATEMENTS
March 31, 2012
Ground Lease Commitment – SF Bay Area—San Lorenzo
In connection with the acquisition of our SF Bay Area – San Lorenzo property, we assumed a land lease, with a remaining term of approximately 23 years as of March 31, 2012 and recorded rent expense of approximately $33,000 for the three months ended March 31, 2012. The lease has minimum lease payments of approximately $99,200, $132,300, $133,400, $138,900 and $138,900 for the years ending 2012, 2013, 2014, 2015 and 2016.
Note 9. Declaration of Distributions
On March 21, 2012, our board of directors declared a distribution rate for the second quarter of 2012 of $0.001912569 per day per share on the outstanding shares of common stock (equivalent to an annual distribution rate of 7% assuming the share was purchased for $10) payable to stockholders of record of such shares as shown on our books at the close of business on each day during the period commencing on April 1, 2012 and continuing on each day thereafter through and including June 30, 2012.
Note 10. Selected Quarterly Data
The following is a summary of quarterly financial information for the periods shown below:
| Three months ended | ||||||||||||||||||||
| March 31, 2011 | June 30, 2011 | September 30, 2011 | December 31, 2011 | March 31, 2012 | ||||||||||||||||
| Total revenues |
$ | 9,804,613 | $ | 11,371,860 | $ | 13,930,807 | $ | 14,288,798 | $ | 15,351,917 | ||||||||||
| Total operating expenses |
$ | 12,661,013 | $ | 13,895,617 | $ | 15,657,652 | $ | 16,397,585 | $ | 15,455,345 | ||||||||||
| Net loss |
$ | (5,341,819 | ) | $ | (5,399,076 | ) | $ | (5,292,070 | ) | $ | (5,801,272 | ) | $ | (5,451,145 | ) | |||||
| Net loss attributable to the Company |
$ | (5,216,063 | ) | $ | (5,248,767 | ) | $ | (5,146,419 | ) | $ | (5,746,180 | ) | $ | (5,432,094 | ) | |||||
| Net loss per share-basic and diluted |
$ | (0.19 | ) | $ | (0.17 | ) | $ | (0.16 | ) | $ | (0.17 | ) | $ | (0.15 | ) | |||||
Note 11. Potential Acquisitions
On March 23, 2012, we entered into a purchase and sale agreement for a facility located in Chantilly, Virginia. The purchase price for the facility is approximately $7.3 million. We expect to close this acquisition by the end of the second quarter of 2012. There can be no assurance that we will complete such acquisition. In some circumstances, if we fail to complete such acquisition, we may forfeit some earnest money as a result.
On April 5, 2012, we entered into a purchase and sale agreement for a facility located in Peoria, Arizona. The purchase price for the facility is approximately $4.4 million. We expect to close this acquisition by the end of the third quarter of 2012. There can be no assurance that we will complete such acquisition. In some circumstances, if we fail to complete such acquisition, we may forfeit some earnest money as a result.
Note 12. Subsequent Events
Determination of New Offering Price
On April 2, 2012, our board of directors approved an estimated value per share of our common stock of $10.79 based on the estimated value of our assets less the estimated value of our liabilities, or net asset value, divided by the number of shares outstanding on an adjusted fully diluted basis, calculated as of December 31, 2011. Please see our Form 8-K filed with the SEC on April 3, 2012.
Effective June 1, 2012, the offering price of our shares of common stock will increase from the current $10.00 per share to $10.79 per share. In light of the above-described net asset value calculation, our board of directors determined that it was appropriate to increase the per share offering price for new purchases of our shares. This determination by the board of directors is subjective and was primarily based on (i) the estimated net asset value per share, (ii) the commissions and dealer manager fees payable in connection with the offering of our shares, (iii) our historical and anticipated results of operations and financial condition, (iv) our current and anticipated distribution payments, (v) our current and anticipated capital and debt structure, and (vi) our Advisor’s recommendations and assessment of our prospects and continued execution of our investment and operating strategies.
Offering Status
As of May 9, 2012, in connection with our Initial Offering and Offering we have issued approximately 33.8 million shares of our common stock for gross proceeds of approximately $336 million.
31
Table of Contents
| ITEM 2. | MANAGEMENT’S DISCUSSION AND ANALYSIS OF FINANCIAL CONDITION AND RESULTS OF OPERATIONS |
The following Management’s Discussion and Analysis of Financial Condition and Result of Operations should be read in conjunction with our financial statements and notes thereto contained elsewhere in this report. The following Management’s Discussion and Analysis of Financial Condition and Result of Operations should also be read in conjunction with our financial statements and notes thereto and Management’s Discussion and Analysis of Financial Condition and Results of Operations included in our Annual Report on Form 10-K for the year ended December 31, 2011. See also “Cautionary Note Regarding Forward Looking Statements” preceding Part I.
Overview
Strategic Storage Trust, Inc., a Maryland Corporation (the “Company”), was formed on August 14, 2007 for the purpose of engaging in the business of investing in self storage facilities. The Company made an election to be taxed as a real estate investment trust (“REIT”) beginning with the taxable year ended December 31, 2008. As used in this report, “we” “us” and “our” refer to Strategic Storage Trust, Inc.
On March 17, 2008, we began our initial public offering of common stock (our “Initial Offering”). On May 22, 2008, we satisfied the minimum offering requirements of the Initial Offering and commenced formal operations. On September 16, 2011, we terminated the Initial Offering, having sold approximately 29 million shares for gross proceeds of approximately $289 million. On September 22, 2011, we commenced our follow-on public offering of stock for a maximum of 110,000,000 shares of common stock, consisting of 100,000,000 shares for sale to the public (the “Primary Offering”) and 10,000,000 shares for sale pursuant to our distribution reinvestment plan (collectively, our “Offering”). We intend to invest a substantial amount of the net proceeds from our Offering in self storage facilities and related self storage real estate investments. Our Offering will not last beyond September 22, 2013 (two years after the effective date of our Offering), provided, however, that subject to applicable law, we may extend our Offering for an additional year, or, in certain circumstances, longer. We also reserve the right to terminate our Offering at any time. In addition to our Initial Offering and our Offering, in September 2009 we also issued approximately 6.2 million shares of common stock in connection with two mergers with private real estate investment trusts sponsored by our Sponsor.
Our dealer manager is Select Capital Corporation, a California corporation (our “Dealer Manager”). Our Dealer Manager is responsible for marketing our shares being offered pursuant to the Offering. Our president owns a 15% beneficial non-voting equity interest in our Dealer Manager. U.S. Select Securities LLC, our dealer manager for our Initial Offering, was terminated as our dealer manager upon completion of our Initial Offering.
As of March 31, 2012, we wholly-owned 91 self storage facilities located in 17 states (Alabama, Arizona, California, Florida, Georgia, Illinois, Kentucky, Mississippi, Nevada, New Jersey, New York, North Carolina, Pennsylvania, South Carolina, Tennessee, Texas and Virginia) and Canada comprising approximately 60,140 units and approximately 7.5 million rentable square feet. We also had interests in nine additional self storage facilities through preferred equity and/or minority interests. Additionally, we have an interest in a net leased industrial property in California with 356,000 rentable square feet leased to a single tenant. As of March 31, 2011, we owned 61 self storage facilities located in 16 states and Canada, comprising approximately 40,750 units and approximately 5.1 million rentable square feet.
Strategic Storage Operating Partnership, L.P. (our “Operating Partnership”) was formed on August 14, 2007. Our Operating Partnership owns, directly or indirectly through one or more special purpose entities, all of the self storage properties that we have acquired.
Strategic Capital Holdings, LLC, a Virginia limited liability company (our “Sponsor”), is the sponsor of our Offering. Our Sponsor was formed on July 21, 2004 to engage in private structured offerings of limited partnerships and other entities with respect to the acquisition, management and disposition of commercial real estate assets. Our Sponsor owns a majority of Strategic Storage Holdings, LLC, which is the sole member of our advisor, Strategic Storage Advisor, LLC (our “Advisor”), and our property manager, Strategic Storage Property Management, LLC (our “Property Manager”).
We have no paid employees. Our Advisor is responsible for managing our affairs on a day-to-day basis and identifying and making acquisitions and investments on our behalf under the terms of an advisory agreement with our Advisor. Our Advisor was formed on August 13, 2007.
Our Property Manager was organized in August 2007 to manage our properties. Our Property Manager derives substantially all of its income from the property management services it performs for us. Our Property Manager may enter into sub-property management agreements with third party management companies and pay part of its management fee to such sub-property manager.
32
Table of Contents
As of March 31, 2012, our self storage portfolio was comprised as follows:
| State |
No. of Properties |
Units | Sq. Ft. (net) |
% of
Total Rentable Sq. Ft. |
Physical Occupancy %(1) |
Climate Controlled %(2) |
Revenue %(3) |
|||||||||||||||||||||
| Alabama(4) |
2 | 1,075 | 144,500 | 1.9 | % | 67.4 | % | 49.1 | % | 1.2 | % | |||||||||||||||||
| Arizona |
4 | 1,970 | 242,850 | 3.3 | % | 74.9 | % | 21.8 | % | 2.4 | % | |||||||||||||||||
| California(4) |
8 | 6,480 | 831,700 | 11.1 | % | 80.9 | % | 19.3 | % | 16.9 | % | |||||||||||||||||
| Florida |
8 | 7,070 | 756,350 | 10.1 | % | 73.2 | % | 60.9 | % | 11.3 | % | |||||||||||||||||
| Georgia |
19 | 11,530 | 1,481,200 | 19.8 | % | 60.6 | % | 58.1 | % | 13.6 | % | |||||||||||||||||
| Illinois |
4 | 2,475 | 370,400 | (5) | 5.0 | % | 68.2 | % | 7.0 | % | 4.9 | % | ||||||||||||||||
| Kentucky |
5 | 2,800 | 401,000 | 5.4 | % | 82.7 | % | 9.6 | % | 5.1 | % | |||||||||||||||||
| Mississippi |
1 | 600 | 66,600 | 0.9 | % | 61.3 | % | 12.2 | % | 0.5 | % | |||||||||||||||||
| Nevada |
8 | 4,710 | 563,700 | 7.6 | % | 75.5 | % | 70.0 | % | 6.9 | % | |||||||||||||||||
| New Jersey |
5 | 4,190 | 395,100 | 5.3 | % | 77.0 | % | 59.7 | % | 10.5 | % | |||||||||||||||||
| New York |
1 | 690 | 82,800 | 1.1 | % | 83.5 | % | 20.2 | % | 1.3 | % | |||||||||||||||||
| North Carolina |
3 | 1,580 | 178,900 | 2.4 | % | 82.8 | % | 20.7 | % | 2.1 | % | |||||||||||||||||
| Ontario, Canada |
3 | 2,790 | (6) | 319,800 | (6) | 4.3 | % | 68.1 | % | 96.7 | % | 2.4 | % | |||||||||||||||
| Pennsylvania |
4 | 2,220 | 269,900 | 3.6 | % | 66.4 | % | 17.1 | % | 3.4 | % | |||||||||||||||||
| South Carolina |
1 | 460 | 65,200 | 0.9 | % | 89.9 | % | 66.0 | % | 1.0 | % | |||||||||||||||||
| Tennessee |
1 | 800 | 100,400 | 1.3 | % | 84.7 | % | 0.0 | % | 1.0 | % | |||||||||||||||||
|
Texas(4) |
10 | 6,250 | 933,300 | 12.5 | % | 82.7 | % | 19.2 | % | 11.3 | % | |||||||||||||||||
| Virginia |
4 | 2,450 | 257,800 | 3.5 | % | 71.6 | % | 59.9 | % | 4.2 | % | |||||||||||||||||
|
|
|
|
|
|
|
|
|
|
|
|
|
|
|
|||||||||||||||
| Total |
91 | 60,140 | 7,461,500 | 100 | % | 73.5 | % | 39.9 | % | 100 | % | |||||||||||||||||
|
|
|
|
|
|
|
|
|
|
|
|
|
|
|
|||||||||||||||
| (1) | Represents the occupied square feet of all facilities we own in a state divided by total rentable square feet of all the facilities we own in such state as of March 31, 2012. |
| (2) | Represents the percentage of rentable square feet in climate controlled units as of March 31, 2012 for each state. |
| (3) | Represents rental income (excludes administrative fees, late fees, and other ancillary income) for all facilities we owned in a state divided by our total rental income for the month ended March 31, 2012. |
| (4) | Does not include properties in which we own a minority interest, including the interests owned in the Montgomery County Self Storage, DST properties, the San Francisco Self Storage DST property, the Hawthorne property, the WP Baltimore Self Storage property and the Southwest Colonial, DST properties. |
| (5) | Includes approximately 85,000 rentable square feet of industrial warehouse/office space at the Chicago – Ogden Ave. property. |
| (6) | The Mississauga and the Brampton properties are currently partially or fully under construction, thus the related occupancy statistics exclude these properties. |
33
Table of Contents
The map below shows the geographic location of our self storage portfolio as of March 31, 2012.

As of March 31, 2012, we owned the following preferred equity and/or minority interests:
| Property |
% Owned | Acquisition Date (1) |
Year Built | Approx. Units |
Approx. Sq. Ft. (net) |
%Physical Occupancy (2) |
% Climate Controlled (3) |
|||||||||||||||||
| WP Baltimore Self Storage – MD |
11.5 | % | 9/24/2009 | 2004 | 500 | 70,900 | 82.7 | % | 0.0 | % | ||||||||||||||
| San Francisco Self Storage DST – CA |
12.26 | % | 9/24/2009 and 1/07/2010 |
1909/2000 | 1,100 | 77,900 | 72.5 | % | 0.0 | % | ||||||||||||||
| Hawthorne Property (4) – CA |
12.0 | % | 9/24/2009 | 1943-1966 | n/a | 356,000 | 100.0 | % | n/a | |||||||||||||||
| Southwest Colonial, DST –TX |
0.28 | % | 9/24/2009 | 1981-2007 | 2,850 | 369,600 | 82.5 | % | 12.1 | % | ||||||||||||||
| Montgomery County Self Storage, DST – AL |
1.49 | % | 9/24/2009 | 1997-2005 | 1,600 | 152,900 | 78.7 | % | 100.0 | % | ||||||||||||||
|
|
|
|
|
|
|
|
|
|||||||||||||||||
| Total |
6,050 | 1,027,300 | 80.6 | % | 18.9 | % | ||||||||||||||||||
|
|
|
|
|
|
|
|
|
|||||||||||||||||
| (1) | Represents the date we acquired the interest in such property. |
| (2) | Represents occupied square feet divided by total rentable square feet as of March 31, 2012. |
| (3) | Represents the percentage of rentable square feet in climate controlled units as of March 31, 2012. |
| (4) | Not a self storage facility. We have a 12% direct investment in Westport LAX LLC, the entity owning this property, and an indirect interest in Westport LAX LLC through a preferred equity investment in Hawthorne LLC, which has a direct investment in Westport LAX LLC. |
34
Table of Contents
A summary of the wholly-owned facilities that we have acquired through March 31, 2012 is as follows:
Our Facilities by Year Acquired – Rental Income
| Rental Income by Year
of Acquisition (1) |
||||||||||||||||
| Number of Facilities |
Current Rentable Square Feet |
For the Three Months Ended March 31, |
||||||||||||||
| Year Acquired |
2012 | 2011 | ||||||||||||||
| 2008 |
3 | 196,500 | $409,491 | $416,176 | ||||||||||||
| 2009 |
23 | 2,147,050 | $3,852,087 | $3,800,665 | ||||||||||||
| 2010 |
19 | 1,605,950 | $3,925,173 | $3,870,275 | ||||||||||||
| 2011 |
46 | 3,512,000 | $5,542,221 | $748,526 | ||||||||||||
|
|
|
|
|
|
|
|
|
|
||||||||
| All Facilities Owned |
91 | 7,461,500 | $13,728,972 | $8,835,642 | ||||||||||||
| (1) | The rental income attributable to our consolidated joint venture is excluded from the above table. Rental revenue includes rental income, but excludes ancillary income, administrative and late fees. |
Our Facilities by Year Acquired – Rent Per Occupied Square Foot
| Rent Per Occupied Square Foot (1) |
||||||||||||||||
| Number of Facilities |
Current Rentable Square Feet |
For the Three Ended March 31, |
||||||||||||||
| Year Acquired |
2012 | 2011 | ||||||||||||||
| 2008 |
3 | 196,500 | $0.86 | $0.87 | ||||||||||||
| 2009 |
23 | 2,147,050 | $0.73 | $0.72 | ||||||||||||
| 2010 |
19 | 1,605,950 | $1.10 | $1.12 | ||||||||||||
|
2011(2) |
46 | 3,512,000 | $0.80 | $0.62 | ||||||||||||
|
|
|
|
|
|
|
|
|
|
||||||||
| All Facilities Owned |
91 | 7,461,500 | $0.85 | $0.85 | ||||||||||||
| (1) | Determined by dividing the aggregate rental revenue for each applicable period by the aggregate of the month-end occupied square feet for the period. Properties are included in the calculation in their first full month of operations. Rental revenue includes rental income, but excludes ancillary income, administrative and late fees. |
| (2) | The rent per occupied square foot data excludes the Mississauga and Brampton properties. All other related data is based on estimates of when the construction on such properties are complete. |
Our Facilities by Year Acquired-Average Physical Occupancy
| Average Physical Occupancy % (1) |
||||||||||||||||
| Number of Facilities |
Current Rentable Square Feet |
For the Three Months Ended March 31, |
||||||||||||||
| Year Acquired |
2012 | 2011 | ||||||||||||||
| 2008 |
3 | 196,500 | 80% | 82% | ||||||||||||
| 2009 |
23 | 2,147,050 | 82% | 82% | ||||||||||||
| 2010 |
19 | 1,605,950 | 74% | 72% | ||||||||||||
|
2011(2) |
46 | 3,512,000 | 68% | (3) | 84% | |||||||||||
|
|
|
|
|
|
|
|
|
|
||||||||
| All Facilities Owned |
91 | 7,461,500 | 74% | 79% | ||||||||||||
| (1) | Determined by dividing the sum of the month-end occupied square feet for the applicable group of facilities for each applicable period by the sum of their month-end rentable square feet for the period. |
| (2) | The average physical occupancy data excludes the Mississauga and Brampton properties. All other related data is based on estimates of when the construction on such properties are complete. |
| (3) | The average physical occupancy for the 2011 acquisitions decreased in 2012 largely due to the addition of the Homeland Portfolio which is a lease-up portfolio. Excluding the Homeland Portfolio the average physical occupancy is 75%. |
35
Table of Contents
Below are comparisons of revenue and operating income for the 45 wholly-owned self storage facilities that were owned for the entire three month periods ended March 31, 2012 and 2011, respectively:
| 2012 Revenue (1) |
2011 Revenue (1) |
Increase % |
2012 Operating Income(2) |
2011 Operating Income(2) |
Increase % |
No. Of Facilities | ||||||
| $8,893,501 | $8,586,060 | 3.6% | $5,008,508 | $4,608,059 | 8.7% | 45 |
| (1) | Revenue includes rental income, ancillary income, administrative and late fees. |
| (2) | Operating income excludes asset management fees, interest expense, depreciation, amortization expense and acquisition expenses. |
The weighted average capitalization rate at acquisition for these 91 self storage facilities we owned as of March 31, 2012 was approximately 7.34% (7.71% for our 71 stabilized properties and 4.53% for our 18 lease-up properties at acquisition, and we had two properties under development). Upon stabilization of the lease-up properties, we expect the weighted average capitalization rate to increase. The weighted average capitalization rate is calculated as the estimated first year annual net operating income at the respective property divided by the property purchase price, exclusive of offering costs, closing costs and fees paid to our Advisor. Estimated first year net operating income on our real estate investments is total estimated revenues generally derived from the terms of in-place leases at the time we acquire the property, less property operating expenses generally based on the operating history of the property. In instances where management determines that historical amounts will not be representative of first year revenues or property operating expenses, management uses its best faith estimate of such amounts based on anticipated property operations. Estimated first year net operating income excludes interest expense, asset management fees, depreciation and amortization and our company-level general and administrative expenses. Historical operating income for these properties is not necessarily indicative of future operating results.
We derive revenues principally from rents received from our customers who rent units at our self storage facilities under month-to-month leases. Therefore, our operating results depend significantly on our ability to retain our existing customers and lease our available self storage units to new customers, while maintaining and, where possible, increasing the prices for our self storage units. Additionally, our operating results depend on our customers making their required rental payments to us. We believe that our Property Manager’s approach to the management and operation of our facilities, which emphasizes local market oversight and control, results in quick and effective response to changes in local market conditions, including increasing rents and/or increasing occupancy levels where appropriate.
Competition in the market areas in which we operate is significant and affects the occupancy levels, rental rates, rental revenues and operating expenses of our facilities. Development of any new self storage facilities would intensify competition of self storage operators in markets in which we operate.
We believe that we will experience minor seasonal fluctuations in the occupancy levels of our facilities, which we believe will be slightly higher over the summer months due to increased moving activity.
Critical Accounting Estimates
We have established accounting policies which conform to generally accepted accounting principles (“GAAP”). Preparing financial statements in conformity with GAAP requires management to use judgment in the application of accounting policies, including making estimates and assumptions. Following is a discussion of the estimates and assumptions used in setting accounting policies that we consider critical in the presentation of our financial statements. Many estimates and assumptions involved in the application of GAAP may have a material impact on our financial condition or operating performance, or on the comparability of such information to amounts reported for other periods, because of the subjectivity and judgment required to account for highly uncertain items or the susceptibility of such items to change. These estimates and assumptions affect our reported amounts of assets and liabilities, our disclosure of contingent assets and liabilities at the dates of the financial statements and our reported amounts of revenue and expenses during the period covered by this report. If management’s judgment or interpretation of the facts and circumstances relating to various transactions had been different, it is possible that different accounting policies would have been applied or different amounts of assets, liabilities, revenues and expenses would have been recorded, thus resulting in a materially different presentation of the financial statements or materially different amounts being reported in the financial statements. Additionally, other companies may use different estimates and assumptions that may impact the comparability of our financial condition and results of operations to those companies.
36
Table of Contents
We believe that our critical accounting policies include the following: real estate purchase price allocations; the evaluation of whether any of our long-lived assets have been impaired; the determination of the useful lives of our long-lived assets; and the evaluation of the consolidation of our interests in joint ventures. The following discussion of these policies supplements, but does not supplant the description of our significant accounting policies, as contained in Note 2 of the Notes to the Consolidated Financial Statements contained in this report, and is intended to present our analysis of the uncertainties involved in arriving upon and applying each policy.
Real Estate Purchase Price Allocation
We allocate the purchase prices of acquired properties based on a number of estimates and assumptions. We allocate the purchase prices to the tangible and intangible assets acquired and the liabilities assumed based on estimated fair values. These estimated fair values are based upon comparable market sales information for land and estimates of depreciated replacement cost of equipment, building and site improvements. Acquisitions of portfolios of properties are allocated to the individual properties based upon an income approach or a cash flow analysis using appropriate risk adjusted capitalization rates which we estimate based upon the relative size, age, and location of the individual property along with actual historical and estimated occupancy and rental rate levels, and other relevant factors. If available, and determined by management to be appropriate, appraised values are used, rather than these estimated values. Because we believe that substantially all of the leases in place at properties we will acquire will be at market rates, as the majority of the leases are month-to-month contracts, we do not expect to allocate any portion of the purchase prices to above or below market leases. The determination of market rates is also subject to a number of estimates and assumptions. Our allocations of purchase prices could result in a materially different presentation of the financial statements or materially different amounts being reported in the financial statements, as such allocations may vary dramatically based on the estimates and assumptions we use.
Impairment of Long-Lived Assets
The majority of our assets consist of long-lived real estate assets as well as intangible assets related to our acquisitions. We will continually evaluate such assets for impairment based on events and changes in circumstances that may arise in the future and that may impact the carrying amounts of our long-lived assets. When indicators of potential impairment are present, we will assess the recoverability of the particular asset by determining whether the carrying value of the asset will be recovered, through an evaluation of the undiscounted future operating cash flows expected from the use of the asset and its eventual disposition. This evaluation is based on a number of estimates and assumptions. Based on this evaluation, if the expected undiscounted future cash flows do not exceed the carrying value, we will adjust the value of the long-lived asset and recognize an impairment loss. Our evaluation of the impairment of long-lived assets could result in a materially different presentation of the financial statements or materially different amounts being reported in the financial statements, as the amount of impairment loss, if any, recognized may vary based on the estimates and assumptions we use.
Estimated Useful Lives of Long-Lived Assets
We assess the useful lives of the assets underlying our properties based upon a subjective determination of the period of future benefit for each asset. We will record depreciation expense with respect to these assets based upon the estimated useful lives we determine. Our determinations of the useful lives of the assets could result in a materially different presentation of the financial statements or materially different amounts being reported in the financial statements, as such determinations, and the corresponding amount of depreciation expense, may vary dramatically based on the estimates and assumptions we use.
Consolidation of Investments in Joint Ventures
We evaluate the consolidation of our investments in joint ventures in accordance with relevant accounting guidance. This evaluation requires us to determine whether we have a controlling interest in a joint venture through a means other than voting rights, and, if so, such joint venture may be required to be consolidated in our financial statements. Our evaluation of our joint ventures under such accounting guidance could result in a materially different presentation of the financial statements or materially different amounts being reported in the financial statements, as the entities included in our financial statements may vary based on the estimates and assumptions we use.
REIT Qualification
We made an election under Section 856(c) of the Code to be taxed as a REIT commencing with the taxable year ended December 31, 2008. By qualifying as a REIT for federal income tax purposes, we generally will not be subject to federal income tax on income that we distribute to our stockholders. If we fail to qualify as a REIT in any taxable year, we will be subject to federal
37
Table of Contents
income tax on our taxable income at regular corporate rates and will not be permitted to qualify for treatment as a REIT for federal income tax purposes for four years following the year in which our qualification is denied. Such an event could materially and adversely affect our net income and could have a material adverse impact on our financial condition and results of operations. However, we believe that we are organized and will operate in a manner that will enable us to qualify for treatment as a REIT for federal income tax purposes commencing with the year ended December 31, 2008, and we intend to continue to operate as to remain qualified as a REIT for federal income tax purposes.
Results of Operations
Overview
As of March 31, 2012, we wholly-owned 91 self storage facilities located in 17 states and Canada, comprising approximately 60,140 units and approximately 7.5 million rentable square feet. As of March 31, 2011, we wholly-owned 61 self storage facilities, located in 16 states and Canada, comprising approximately 40,750 units and approximately 5.1 million rentable square feet.
The comparability of our results of operations is significantly affected by acquisition activity during 2011 as listed below:
| • | In the three months ended March 31, 2011, we acquired 16 self storage facilities for consideration of approximately $69 million. |
| • | The three months ended March 31, 2012 includes activity related to 30 facilities that were acquired between April 1, 2011 and December 31, 2011 for consideration of approximately $176 million. |
Furthermore, on December 27, 2011, we acquired the Homeland Portfolio (consisting of 12 self storage lease-up facilities with initial occupancy of 46%) for $80 million. Within the next 12 to 24 months, we believe the Homeland Portfolio will provide accretive operating income and cash flows. However, we expect the Homeland Portfolio to continue to negatively impact our results of operations as it did in the current quarter, albeit to a lesser extent, for at least the next several fiscal quarters for several reasons. First, the Homeland Portfolio is a lease-up portfolio and while occupancy is increasing (51% as of March 31, 2012), these properties are currently operating at a loss, after considering interest expense and deferred financing amortization expense (discussed below). Second, we are offering concessions to increase occupancy. However, as the occupancy begins to stabilize, such concessions will decrease and rental revenues should be positively impacted. Third, we incurred additional debt by entering into the Second Amended and Restated KeyBank Credit Facility and the KeyBank Bridge Loan to acquire the Homeland Portfolio. See “Note 5 - Secured Debt”. This additional debt resulted in the recognition of approximately $1.5 million of interest expense and approximately $0.8 million of deferred financing amortization expense (a non-cash expense) for the three months ended March 31, 2012, which negatively impacted our operating results. Furthermore, for the three months ended March 31, 2012, included in interest expense and deferred financing amortization expense was $0.4 million and $0.4 million, respectively, of amounts related to the KeyBank Bridge Loan, which by its terms, will be repaid by August 31, 2012, and as such, these amounts will not impact future results once the Key Bank Bridge Loan is repaid. If leasing trends continue, the Homeland Portfolio should begin to contribute positively to our operating results in 2013. Below is a chart illustrating the increase in the Homeland Portfolio occupancy since our acquisition:
Homeland Portfolio Occupancy
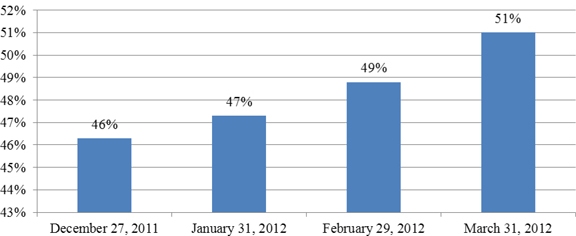
Due to the items noted above, we believe there is little basis for comparison between the three months ended March 31, 2012 and 2011.
38
Table of Contents
Comparison of Operating Results for the Three Months Ended March 31, 2012 and 2011
Self Storage Rental Income
Rental income for the three months ended March 31, 2012, was approximately $14.9 million, as compared to rental income for the three months ended March 31, 2011 of approximately $9.6 million, an increase of approximately 55%. The increase in rental income arises primarily from the acquisition of 46 properties during 2011 (approximately $5.0 million) and an increase of approximately $0.3 million related to increased rental income from same store sales. We expect rental income to increase in future periods as we acquire additional operating facilities.
Property Operating Expenses
Property operating expenses for the three months ended March 31, 2012 were approximately $8.2 million, as compared to property operating expenses for the three months ended March 31, 2011 of approximately $5.1 million. Property operating expenses include the costs to operate our facilities including payroll, utilities, insurance, real estate taxes, marketing, property management fees and asset management fees. The increase in property operating expenses arises primarily from the increase in the number of self storage facilities we owned. For the three months ended March 31, 2012 and 2011, approximately $2.0 million and $1.1 million, respectively, of total operating expenses were paid to affiliates. We expect property operating expenses to increase in future periods as we acquire additional operating facilities.
General and Administrative Expenses
General and administrative expenses for the three months ended March 31, 2012 were approximately $0.6 million, compared to approximately $0.8 million for the three months ended March 31, 2011. Such expenses consist primarily of legal expenses, accounting fees, directors’ and officers’ insurance expense and board of directors’ related costs. The decrease is primarily due to our Advisor’s permanent waiver of certain reimbursable amounts due pursuant to the advisory agreement; such amounts were waived for the three months ended March 31, 2012 and totaled approximately $260,000. We expect general and administrative costs to increase in future periods as we make additional investments, but expect such expenses to decrease as a percentage of total revenues.
Depreciation and Amortization Expenses
Depreciation and amortization expenses for the three months ended March 31, 2012 were approximately $6.6 million, compared to approximately $4.9 million for the three months ended March 31, 2011. Depreciation expense consists primarily of depreciation on the buildings and site improvements at our properties. Amortization expense consists of the amortization of intangible assets resulting from our acquisitions. The increase in depreciation and amortization expenses is attributable to the increase in the number of self storage facilities we owned. We expect depreciation and amortization expenses to increase in future periods as we acquire additional operating facilities.
Property Acquisition Expenses
Property acquisition expenses for the three months ended March 31, 2012 were approximately $0.1 million, compared to approximately $1.8 million for the three months ended March 31, 2011. The decrease between 2011 and 2012 is due to us making no acquisitions during the three months ended March 31, 2012 compared to us making 16 acquisitions during the three months ended March 31, 2011. We expect that such costs will fluctuate in the future commensurate with our acquisition activity.
Interest Expense
Interest expense for the three months ended March 31, 2012 was approximately $4.6 million, compared to approximately $2.4 million for the three months ended March 31, 2011. The increase primarily relates to interest incurred on the Second Restated KeyBank Credit Facility, the KeyBank Bridge Loan, the ING Loan and other new debt incurred in 2011. We expect interest expense to increase in future periods as we acquire additional operating facilities through the issuance or assumption of secured debt.
Deferred Financing Amortization Expense
Deferred financing amortization expense for the three months ended March 31, 2012 was approximately $1.0 million compared to approximately $0.3 million for the three months ended March 31, 2011. The increase primarily relates to the amortization of deferred financing fees incurred on the Second Restated KeyBank Credit Facility, the KeyBank Bridge Loan, the ING Loan and other new debt incurred in 2011.
39
Table of Contents
Funds From Operations
Due to certain unique operating characteristics of real estate companies, the National Association of Real Estate Investment Trusts, or NAREIT, an industry trade group, has promulgated a measure known as funds from operations, or FFO, which we believe to be an appropriate supplemental measure to reflect the operating performance of a REIT. The use of FFO is recommended by the REIT industry as a supplemental performance measure. FFO is not equivalent to our net income (loss) as determined under GAAP.
We define FFO, a non-GAAP measure, consistent with the standards established by the White Paper on FFO approved by the Board of Governors of NAREIT, as revised in February 2004, or the White Paper. The White Paper defines FFO as net income (loss) computed in accordance with GAAP, excluding gains or losses from sales of property and asset impairment writedowns, plus depreciation and amortization, and after adjustments for unconsolidated partnerships and joint ventures. Adjustments for unconsolidated partnerships and joint ventures are calculated to reflect FFO. Our FFO calculation complies with NAREIT’s policy described above.
The historical accounting convention used for real estate assets requires straight-line depreciation of buildings and improvements, which implies that the value of real estate assets diminishes predictably over time. Diminution in value may occur if such assets are not adequately maintained or repaired and renovated as required by relevant circumstances or other measures necessary to maintain the assets are not undertaken. However, we believe that, since real estate values historically rise and fall with market conditions, including inflation, interest rates, the business cycle, unemployment and consumer spending, presentations of operating results for a REIT using historical accounting for depreciation may be less informative. In addition, in the determination of FFO, we believe it is appropriate to disregard impairment charges, as this is a fair value adjustment that is largely based on market fluctuations and assessments regarding general market conditions which can change over time. An asset will only be evaluated for impairment if certain impairment indications exist, and if the carrying, or book value, exceeds the total estimated undiscounted future cash flows (including net rental revenues, net proceeds on the sale of the property, and any other ancillary cash flows at a property or group level under GAAP) from such asset. Testing for impairment is a continuous process and is analyzed on a quarterly basis. Investors should note, however, that determinations of whether impairment charges have been incurred are based partly on anticipated operating performance, because estimated undiscounted future cash flows from a property, including estimated future net rental revenues, net proceeds on the sale of the property, and certain other ancillary cash flows, are taken into account in determining whether an impairment charge has been incurred. While impairment charges are excluded from the calculation of FFO as described above, investors are cautioned that due to the fact that impairments are based on estimated future undiscounted cash flows and that we intend to have a relatively limited term of our operations, it could be difficult to recover any impairment charges through the eventual sale of the property. To date, we have not recognized any impairments.
Historical accounting for real estate involves the use of GAAP. Any other method of accounting for real estate such as the fair value method cannot be construed to be any more accurate or relevant than the comparable methodologies of real estate valuation found in GAAP. Nevertheless, we believe that the use of FFO, which excludes the impact of real estate related depreciation and amortization and impairments, assists in providing a more complete understanding of our performance to investors and to our management, and when compared year over year, reflects the impact on our operations from trends in occupancy rates, rental rates, operating costs, general and administrative expenses, and interest costs, which may not be immediately apparent from net income (loss).
However, FFO or Modified FFO (“MFFO”), discussed below, should not be construed to be more relevant or accurate than the current GAAP methodology in calculating net income (loss) or in its applicability in evaluating our operating performance. The method utilized to evaluate the value and performance of real estate under GAAP should be considered a more relevant measure of operational performance and is, therefore, given more prominence than the non-GAAP FFO and MFFO measures and the adjustments to GAAP in calculating FFO and MFFO.
Changes in the accounting and reporting rules under GAAP that were put into effect and other changes to GAAP accounting for real estate subsequent to the establishment of NAREIT’s definition of FFO have prompted an increase in cash-settled expenses, specifically acquisition fees and expenses, as items that are expensed as operating expenses under GAAP. We believe these fees and expenses do not affect our overall long-term operating performance. Publicly registered, non-traded REITs typically have a significant amount of acquisition activity and are substantially more dynamic during their initial years of investment and operation. The purchase of properties, and the corresponding expenses associated with that process, is a key feature of our business plan in order to generate operational income and cash flow in order to make distributions to investors. While other start-up entities may also experience significant acquisition activity during their initial years, we believe that publicly registered, non-traded REITs are unique in that they typically have a limited life with targeted exit strategies within a relatively limited time frame after the acquisition activity ceases. As disclosed in the prospectus for our Offering, we will use the proceeds raised in our Offering to acquire properties, and we expect to begin the process of achieving a liquidity event (i.e., listing of our shares of common stock on a national securities exchange, a merger or sale, the sale of all or substantially all of our assets, or another similar transaction) within three to five years after the completion of our Offering, which is generally comparable to other publicly registered, non-traded REITs. Thus, we do not intend to continuously purchase assets and intend to have a limited life. The decision whether to engage in any liquidity event is in the sole discretion of our board of directors. Due to the above factors and other unique features of publicly registered, non-traded REITs, the Investment
40
Table of Contents
Program Association, or the IPA, an industry trade group, has standardized a measure known as modified funds from operations, or MFFO, which the IPA has recommended as a supplemental measure for publicly registered, non-traded REITs and which we believe to be another appropriate supplemental measure to reflect the operating performance of a publicly registered, non-traded REIT having the characteristics described above. MFFO is not equivalent to our net income (loss) as determined under GAAP, and MFFO may not be a useful measure of the impact of long-term operating performance on value if we do not ultimately engage in a liquidity event. We believe that, because MFFO excludes acquisition fees and expenses that affect our operations only in periods in which properties are acquired and that we consider more reflective of investing activities, as well as other non-operating items included in FFO, MFFO can provide, on a going-forward basis, an indication of the sustainability (that is, the capacity to continue to be maintained) of our operating performance after the period in which we are acquiring our properties and once our portfolio is in place. By providing MFFO, we believe we are presenting useful information that assists investors and analysts to better assess the sustainability of our operating performance after our offering has been completed and our properties have been acquired. We also believe that MFFO is a recognized measure of sustainable operating performance by the publicly registered, non-traded REIT industry. Further, we believe MFFO is useful in comparing the sustainability of our operating performance after our Offering and acquisitions are completed with the sustainability of the operating performance of other real estate companies that are not as involved in acquisition activities. Investors are cautioned that MFFO should only be used to assess the sustainability of our operating performance after our Offering has been completed and properties have been acquired, as it excludes acquisition fees and expenses that have a negative effect on our operating performance during the periods in which properties are acquired.
We define MFFO, a non-GAAP measure, consistent with the IPA’s Guideline 2010-01, Supplemental Performance Measure for Publicly Registered, Non-Listed REITs: Modified Funds from Operations (“the Practice Guideline”) issued by the IPA in November 2010. The Practice Guideline defines MFFO as FFO further adjusted for the following items included in the determination of GAAP net income (loss): acquisition fees and expenses; amounts relating to straight line rents and amortization of above or below intangible lease assets and liabilities; accretion of discounts and amortization of premiums on debt investments; non-recurring impairments of real estate related investments; mark-to-market adjustments included in net income; non-recurring gains or losses included in net income from the extinguishment or sale of debt, hedges, foreign exchange, derivatives or securities holdings where trading of such holdings is not a fundamental attribute of the business plan, unrealized gains or losses resulting from consolidation from, or deconsolidation to, equity accounting, and after adjustments for consolidated and unconsolidated partnerships and joint ventures, with such adjustments calculated to reflect MFFO on the same basis. The accretion of discounts and amortization of premiums on debt investments, unrealized gains and losses on hedges, foreign exchange, derivatives or securities holdings, unrealized gains and losses resulting from consolidations, as well as other listed cash flow adjustments are adjustments made to net income (loss) in calculating cash flows from operations and, in some cases, reflect gains or losses which are unrealized and may not ultimately be realized.
Our MFFO calculation complies with the IPA’s Practice Guideline described above. In calculating MFFO, we exclude acquisition related expenses, the amortization of fair value adjustments related to debt, gains or losses from debt defeasance, realized and unrealized gains and losses on foreign exchange holdings and the adjustments of such items related to noncontrolling interests. The other adjustments included in the IPA’s Practice Guideline are not applicable to us for the periods presented. Acquisition fees and expenses are paid in cash by us, and we have not set aside or put into escrow any specific amount of proceeds from our offering to be used to fund acquisition fees and expenses. We do not intend to fund acquisition fees and expenses in the future from operating revenues and cash flows, nor from the sale of properties and subsequent re-deployment of capital and concurrent incurring of acquisition fees and expenses. Acquisition fees and expenses include payments to our Advisor and third parties. Acquisition related expenses under GAAP are considered operating expenses and as expenses included in the determination of net income (loss) and income (loss) from continuing operations, both of which are performance measures under GAAP. All paid and accrued acquisition fees and expenses will have negative effects on returns to investors, the potential for future distributions, and cash flows generated by us, unless earnings from operations or net sales proceeds from the disposition of other properties are generated to cover the purchase price of the property, these fees and expenses and other costs related to such property. In the future, if we are not able to raise additional proceeds from our offering, this could result in us paying acquisition fees or reimbursing acquisition expenses due to our Advisor, or a portion thereof, with net proceeds from borrowed funds, operational earnings or cash flows, net proceeds from the sale of properties, or ancillary cash flows. As a result, the amount of proceeds available for investment and operations would be reduced, or we may incur additional interest expense as a result of borrowed funds.
Further, under GAAP, certain contemplated non-cash fair value and other non-cash adjustments are considered operating non-cash adjustments to net income (loss) in determining cash flows from operations. In addition, we view fair value adjustments of derivatives and the amortization of fair value adjustments related to debt as items which are unrealized and may not ultimately be realized or as items which are not reflective of on-going operations and are therefore typically adjusted for when assessing operating performance.
We use MFFO and the adjustments used to calculate it in order to evaluate our performance against other publicly registered, non-traded REITs which intend to have limited lives with short and defined acquisition periods and targeted exit strategies shortly thereafter. As noted above, MFFO may not be a useful measure of the impact of long-term operating performance if we do not continue to operate in this manner. We believe that our use of MFFO and the adjustments used to calculate it allow us to present our
41
Table of Contents
performance in a manner that reflects certain characteristics that are unique to publicly registered, non-traded REITs, such as their limited life, limited and defined acquisition period and targeted exit strategy, and hence that the use of such measures may be useful to investors. For example, acquisition fees and expenses are intended to be funded from the proceeds of our offering and other financing sources and not from operations. By excluding expensed acquisition fees and expenses, the use of MFFO provides information consistent with management’s analysis of the operating performance of the properties. Additionally, fair value adjustments, which are based on the impact of current market fluctuations and underlying assessments of general market conditions, but can also result from operational factors such as rental and occupancy rates, may not be directly related or attributable to our current operating performance. By excluding such charges that may reflect anticipated and unrealized gains or losses, we believe MFFO provides useful supplemental information.
Presentation of this information is intended to provide useful information to investors as they compare the operating performance of different REITs, although it should be noted that not all REITs calculate FFO and MFFO the same way, so comparisons with other REITs may not be meaningful. Furthermore, FFO and MFFO are not necessarily indicative of cash flow available to fund cash needs and should not be considered as an alternative to net income (loss) or income (loss) from continuing operations as an indication of our performance, as an alternative to cash flows from operations, which is an indication of our liquidity, or indicative of funds available to fund our cash needs including our ability to make distributions to our stockholders. FFO and MFFO should be reviewed in conjunction with other measurements as an indication of our performance. MFFO may be useful in assisting management and investors in assessing the sustainability of operating performance in future operating periods, and in particular, after the offering and acquisition stages are complete and net asset value is disclosed. FFO and MFFO are not useful measures in evaluating net asset value because impairments are taken into account in determining net asset value but not in determining FFO and MFFO.
Neither the SEC, NAREIT nor any other regulatory body has passed judgment on the acceptability of the adjustments that we use to calculate FFO or MFFO. In the future, the SEC, NAREIT or another regulatory body may decide to standardize the allowable adjustments across the publicly registered, non-traded REIT industry and we would have to adjust our calculation and characterization of FFO or MFFO.
42
Table of Contents
The following is a reconciliation of net income (loss), which is the most directly comparable GAAP financial measure, to FFO and MFFO for each of the periods presented below:
| Three Months Ended March 31, 2012 |
Three Months Ended March 31, 2011 |
|||||||
| Net loss attributable to Strategic Storage Trust, Inc. |
$ | (5,432,094 | ) | $ | (5,216,063 | ) | ||
| Add: |
||||||||
| Depreciation |
3,290,273 | 1,857,824 | ||||||
| Amortization of intangible assets |
3,228,452 | 3,050,925 | ||||||
| Deduct: |
||||||||
| Adjustment for noncontrolling interests(2) |
(92,745 | ) | (177,580 | ) | ||||
|
|
|
|
|
|||||
| FFO |
993,886 | (484,894 | ) | |||||
| Other Adjustments: |
||||||||
| Acquisition expenses(3) |
92,357 | 1,808,474 | ||||||
| Amortization of fair value adjustments of secured debt(4) |
104,340 | 94,490 | ||||||
| Realized and unrealized gains on foreign exchange holdings(5) |
(51,957 | ) | (51,022 | ) | ||||
| Debt defeasance costs (6) |
— | 49,750 | ||||||
| Adjustment for noncontrolling interests(2) |
(20,155 | ) | (14,354 | ) | ||||
|
|
|
|
|
|||||
|
MFFO(1) |
$ | 1,118,471 | $ | 1,402,444 | ||||
|
|
|
|
|
|||||
As discussed in Results of Operations, our net loss and MFFO for the three months ended March 31, 2012, have been significantly impacted by our acquisition of the Homeland Portfolio and additional debt we incurred to purchase such properties. The information below should be read in conjunction with the discussion regarding the Homeland Portfolio in Results of Operations.
| (1) | Changes in MFFO between the three months ended March 31, 2012 and 2011 include the following: |
| • | Total revenues less all property operating expenses were approximately $7.2 million for the three months ended March 31, 2012 compared to approximately $4.7 million for the three months ended March 31, 2011, thereby increasing MFFO by approximately $2.5 million. Such increase was primarily due to the acquisition of 46 properties in 2011 along with an increase in same store operating income of $0.4 million. |
| • | An improvement in MFFO of approximately $0.2 million due to a reduction in general and administrative expenses, primarily related to our Advisor’s permanent waiver of certain reimbursable amounts due pursuant to the advisory agreement; such amounts were waived for the three months ended March 31, 2012. |
| • | A decrease in MFFO of approximately $2.2 million due to increased interest expense, primarily related to interest incurred on the Second Restated KeyBank Credit Facility, the KeyBank Bridge Loan, the ING Loan and other new debt incurred in 2011. Of the increased expense, approximately $0.4 million relates to the KeyBank Bridge Loan, which, by its terms, will be repaid by August 31, 2012 and as such, this amount will not impact future results once the KeyBank Bridge Loan is repaid. |
| • | A decrease in MFFO of approximately $0.6 million due to increased amortization of deferred financing costs, which increased for principally the same reasons as interest expense. Of the increase, approximately $0.4 million related to the KeyBank Bridge Loan which by its terms will be repaid by August 31, 2012, and as such, this amount will not impact future results once the KeyBank Bridge Loan is repaid. |
| (2) | Relates to the noncontrolling interest in our consolidated joint venture and the noncontrolling interests in our Operating Partnership. The noncontrolling interest holder’s share of our consolidated venture’s real estate depreciation and amortization of intangible assets was $74,551 and $18,194, respectively, for the three months ended March 31, 2012 and $53,337 and $124,243, respectively, for the three months ended March 31, 2011. |
43
Table of Contents
| (3) | In evaluating investments in real estate, we differentiate the costs to acquire the investment from the operations derived from the investment. Such information would be comparable only for publicly registered, non-traded REITs that have generally completed their acquisition activity and have other similar operating characteristics. By excluding expensed acquisition related expenses, we believe MFFO provides useful supplemental information that is comparable for each type of real estate investment and is consistent with management’s analysis of the investing and operating performance of our properties. Acquisition fees and expenses include payments to our Advisor and third parties. Acquisition related expenses under GAAP are considered operating expenses and as expenses included in the determination of net income (loss) and income (loss) from continuing operations, both of which are performance measures under GAAP. All paid and accrued acquisition fees and expenses will have negative effects on returns to investors, the potential for future distributions, and cash flows generated by us, unless earnings from operations or net sales proceeds from the disposition of other properties are generated to cover the purchase price of the property, these fees and expenses and other costs related to such property. |
| (4) | This expense represents the difference between the stated interest rate and the estimated market interest rate on assumed notes or seller notes issued, as of the date of acquisition. Such amounts have been excluded from MFFO because we believe MFFO provides useful supplementary information by focusing on operating fundamentals, rather than events not related to our normal operations. We are responsible for managing interest rate risk and do not rely on another party to manage such risk. |
| (5) | These amounts primarily relate to transactions with our non-U.S. functional currency entities. The gains and losses are the result of fluctuations between the U.S. dollar and the Canadian dollar. Such amounts have been excluded from MFFO because we believe MFFO provides useful supplementary information by focusing on operating fundamentals, rather than events not related to our normal operations. We are responsible for managing hedge and foreign exchange risk and do not rely on another party to manage such risk. |
| (6) | We believe that adjusting for the gain or loss on extinguishment of debt provides useful information because such gain or loss on extinguishment of debt may not be reflective of on-going operations. |
Non-cash Items Included in Net Loss:
Provided below is additional information related to selected non-cash items included in net loss above, which may be helpful in assessing our operating results:
| • | Amortization of deferred financing costs of approximately $1.0 million and $0.3 million was recognized as interest expense for the three months ended March 31, 2012 and 2011, respectively. |
Cash Flows
A comparison of cash flows for operating, investing and financing activities for the three months ended March 31, 2012 and 2011 is as follows:
| Three Months Ended | ||||||||||||
| March 31, 2012 |
March 31, 2011 |
Change | ||||||||||
| Net cash flow provided by (used in): |
||||||||||||
| Operating activities |
$ | 1,975,969 | $ | (373,906 | ) | $ | 2,349,875 | |||||
| Investing activities |
(1,062,035 | ) | (35,561,182 | ) | 34,499,147 | |||||||
| Financing activities |
(1,934,781 | ) | 48,696,438 | (50,631,219 | ) | |||||||
Cash flows provided by (used in) operating activities for the three months ended March 31, 2012 and 2011 were approximately $2.0 million and ($0.4) million, respectively, an increase in cash provided by operations of approximately $2.4 million. The increase in cash provided is primarily the result of a favorable improvement in our net loss adjusted for depreciation and amortization of approximately $2.0 million.
Cash flows used in investing activities for the three months ended March 31, 2012 and 2011 were approximately $1.1 million and $35.6 million, respectively, a reduction in the use of cash of approximately $34.5 million. The reduction compared to the prior period primarily relates to the decreased amount spent on acquisitions in the current period as compared with the same period of the prior year.
44
Table of Contents
Cash flows provided by (used in) financing activities for the three months ended March 31, 2012 and 2011 were approximately ($1.9) million and $48.7 million, respectively, a reduction of approximately $50.6 million. The reduction in cash provided by financing activities over the prior period primarily relates to decreases in proceeds from the issuance of new debt and proceeds from the issuance of common stock.
Liquidity and Capital Resources
Short-Term Liquidity and Capital Resources
We generally expect that we will meet our short-term operating liquidity requirements from the combination of proceeds of the Offering, proceeds from secured or unsecured financing from banks or other lenders, net cash provided by property operations and advances from our Advisor which will be repaid, without interest, as funds are available after meeting our current liquidity requirements, subject to the limitations on reimbursement set forth in our Advisory Agreement with our Advisor. Per the Advisory Agreement, all advances from our Advisor shall be reimbursed no less frequently than monthly, although our Advisor has indicated that it may waive such a requirement on a month-by-month basis. The organization and offering costs associated with the Offering will initially be paid by us or our Advisor. Our Advisor must reimburse us within 60 days after the end of the month in which the Offering terminates to the extent we paid or reimbursed organization and offering costs (excluding sales commissions and dealer manager fees) in excess of 3.5% of the gross offering proceeds from the Primary Offering. Operating cash flows are expected to increase as properties are added to our portfolio.
Distribution Policy and Distributions
Our board of directors will determine the amount and timing of distributions to our stockholders and will base such determination on a number of factors, including funds available for payment of distributions, financial condition, capital expenditure requirements and annual distribution requirements needed to maintain our status as a REIT under the Code. Distributions will be paid to our stockholders as of the record date selected by our board of directors. We declare and pay distributions monthly based on daily declaration and record dates so that investors may be entitled to distributions immediately upon purchasing our shares. We expect to continue to regularly pay distributions unless our results of operations, our general financial condition, general economic conditions, or other factors inhibit us from doing so. Distributions will be authorized at the discretion of our board of directors, which will be directed, in substantial part, by its obligation to cause us to comply with the REIT requirements of the Code. The funds we receive from operations that are available for distribution may be affected by a number of factors, including the following:
| • | the amount of time required for us to invest the funds received in the offering; |
| • | our operating and interest expenses; |
| • | the amount of distributions or dividends received by us from our indirect real estate investments; |
| • | our ability to keep our properties occupied; |
| • | our ability to maintain or increase rental rates; |
| • | capital expenditures and reserves for such expenditures; |
| • | the issuance of additional shares; and |
| • | financings and refinancings. |
The following shows our distributions for the last four fiscal quarters and the sources of such distributions:
| Three Months Ended | ||||||||||||||||||||||||||
| March 31, 2012 |
December 31, 2011 |
September 30, 2011 |
June 30, 2011 |
|||||||||||||||||||||||
| Distributions paid in cash |
$3,499,185 | $3,398,255 | $3,205,887 | $3,015,369 | ||||||||||||||||||||||
| Distributions reinvested |
2,635,829 | 2,547,413 | 2,360,957 | 2,173,281 | ||||||||||||||||||||||
|
|
|
|
|
|
|
|
|
|||||||||||||||||||
| Total distributions |
$6,135,014 | $5,945,668 | $5,566,844 | $5,188,650 | ||||||||||||||||||||||
|
|
|
|
|
|
|
|
|
|||||||||||||||||||
| Source of distributions |
||||||||||||||||||||||||||
| Cash flows provided by operations |
$1,975,969 | 32.2% | $1,701,147 | 28.6% | $956,967 | 17.2% | $554,599 | 10.7% | ||||||||||||||||||
| Proceeds from issuance of common stock (including distributions reinvested) |
4,159,045 | 67.8% | 4,244,521 | 71.4% | 4,609,877 | 82.8% | 4,634,051 | 89.3% | ||||||||||||||||||
|
|
|
|
|
|
|
|
|
|||||||||||||||||||
| Total sources |
$6,135,014 | 100.0% | $5,945,668 | 100.0% | $5,566,844 | 100.0% | $5,188,650 | 100.0% | ||||||||||||||||||
|
|
|
|
|
|
|
|
|
|||||||||||||||||||
45
Table of Contents
Cash flows provided by (used in) operations for the three months ended March 31, 2012, December 31, 2011, September 30, 2011, June 30, 2011 and March 31, 2011 include approximately $0.1 million, $2.4 million, $1.6 million, $1.9 million and $1.8 million, respectively, of real estate acquisition related expenses expensed in accordance with GAAP. We consider the real estate acquisition related expenses to have been funded by proceeds from our ongoing public offering of shares of our common stock because the expenses were incurred to acquire our real estate investments.
During our Offering, when we may raise capital more quickly than we acquire income-producing assets, and for some period after our Offering, we may not be able to pay distributions from our cash flows from operations, in which case distributions may be paid in part from debt financing or from proceeds from the issuance of common stock.
From our inception through March 31, 2012, we paid cumulative distributions of approximately $48.8 million, as compared to cumulative FFO of approximately $(2.8) million. The payment of distributions from sources other than FFO may reduce the amount of proceeds available for investment and operations or cause us to incur additional interest expense as a result of borrowed funds.
Over the long-term, we expect that a greater percentage of our distributions will be paid from cash flows from operations. However, our operating performance cannot be accurately predicted and may deteriorate in the future due to numerous factors, including our ability to raise and invest capital at favorable yields, the financial performance of our investments in the current real estate and financial environment and the types and mix of investments in our portfolio. As a result, future distributions declared and paid may exceed cash flow from operations.
Indebtedness
As of March 31, 2012, we had approximately $323.3 million of outstanding consolidated indebtedness (excluding net unamortized debt discounts of approximately $1.0 million). The weighted average interest rate on our consolidated fixed rate indebtedness as of March 31, 2012 was approximately 5.7%. Future acquisitions may be partially funded by the assumption of existing loans. Additionally, certain future acquisitions may be partially funded by proceeds from the issuance of new promissory notes. Thus, if such acquisitions are completed, we expect our indebtedness to increase.
Long-Term Liquidity and Capital Resources
On a long-term basis, our principal demands for funds will be for property acquisitions, either directly or through equity interests, for the payment of operating expenses and distributions, and for the debt service on our outstanding indebtedness. Generally, cash needs for items, other than property acquisitions, will be met from operations and proceeds received from the Offering. However, there may be a delay between the sale of our shares and our purchase of properties that could result in a delay in the benefits to our stockholders, if any, of returns generated from our investment operations. Our Advisor will evaluate potential additional property acquisitions and engage in negotiations with sellers on our behalf. After a purchase contract is executed that contains specific terms, the property will not be purchased until the successful completion of due diligence, which includes, among other items, review of the title insurance commitment, an appraisal and an environmental analysis. In some instances, the proposed acquisition will require the negotiation of final binding agreements, which may include financing documents. During this period, we may decide to temporarily invest any unused proceeds from the Offering in certain investments that could yield lower returns than the properties. These lower returns may affect our ability to make distributions.
Potential future sources of capital include proceeds from the Offering, proceeds from secured or unsecured financings from banks or other lenders, proceeds from the sale of properties and undistributed funds from operations. If necessary, we may use financings or other sources of capital in the event of unforeseen significant capital expenditures. To the extent we are not able to secure additional financing in the form of a credit facility or other third party source of liquidity, we will be heavily dependent upon the proceeds of the Offering and income from operations in order to meet our long-term liquidity requirements and to fund our distributions.
Contractual Obligations
The following table summarizes our contractual obligations as of March 31, 2012:
| Payments due by period: | ||||||||||||||||||||
| Total | Less than 1 Year |
1-3 Years | 3- 5 Years | More than 5 Years |
||||||||||||||||
| Mortgage interest (1) |
$ | 89,801,854 | $ | 12,751,184 | $ | 27,730,757 | $ | 18,620,983 | $ | 30,698,930 | ||||||||||
| Mortgage principal (1)(2) |
323,277,121 | 58,366,439 | 75,125,242 | 74,785,877 | 114,999,563 | |||||||||||||||
| Operating leases |
3,335,481 | 99,225 | 265,703 | 277,830 | 2,692,723 | |||||||||||||||
| Total contractual obligations |
$ | 416,414,456 | $ | 71,216,848 | $ | 103,121,702 | $ | 93,684,690 | $ | 148,391,216 | ||||||||||
46
Table of Contents
| (1) | Interest expense was calculated based upon the contractual rates. The interest expense on variable rate debt was calculated based on the rate currently in effect. Debt denominated in foreign currency has been converted at the conversion rate in effect as of the end of the period. |
| (2) | Included in the 2012 principal payment requirements above is $19 million related to the Bridge Loan which matures on August 31, 2012, as described in Note 5 of the Notes to the Consolidated Financial Statements. Subsequent to March 31, 2012, we have made scheduled monthly principal payments totaling $4 million, which has reduced the amount outstanding on the Bridge Loan to $15 million as of April 30, 2012. We intend to continue to fund the required monthly principal payments on the Bridge Loan using proceeds from our Offering, cash on hand and cash flow from operations. |
Also included in the 2012 principal payment requirements above is $37 million related to the Second Restated KeyBank Credit Facility. The $37 million represents that portion of the Second Restated KeyBank Credit Facility, as described in Note 5 of the Notes to the Consolidated Financial Statements, which would be required to be repaid in 2012 if KeyBank is unable to successfully syndicate the loan to other lenders as described in Note 5 of the Notes to the Consolidated Financial Statements. If such successful syndication is not realized, we plan to refinance the portion of the Second Restated KeyBank Credit Facility related to the non-Homeland Portfolio on a long-term basis at favorable terms, the proceeds from which, along with proceeds from our Offering, will be used to reduce the outstanding balance of the Second Restated KeyBank Credit Facility in accordance with the terms of the agreement.
Off-Balance Sheet Arrangements
Except as disclosed in the Note 2 of the Notes to the Consolidated Financial Statements accompanying this report, we do not currently have any relationships with unconsolidated entities or financial partnerships. Such entities are often referred to as structured finance or special purposes entities, which typically are established for the purpose of facilitating off-balance sheet arrangements or other contractually narrow or limited purposes. Further, except as disclosed in the Notes to the Consolidated Financial Statements, we have not guaranteed any obligations of unconsolidated entities nor do we have any commitments or intent to provide funding to any such entities.
Subsequent Events
Please see Note 12 of the Notes to the Consolidated Financial Statements accompanying this report.
47
Table of Contents
| ITEM 3. | QUANTITATIVE AND QUALITATIVE DISCLOSURES ABOUT MARKET RISK |
Market risk includes risks that arise from changes in interest rates, foreign currency exchange rates, commodity prices, equity prices and other market changes that affect market sensitive instruments. In pursuing our business plan, we expect that the primary market risk to which we will be exposed is interest rate risk.
As of March 31, 2012, our debt consisted of approximately $212.2 million in fixed rate debt and approximately $111.1 million in variable rate debt (excluding net unamortized debt discounts of approximately $1.0 million). As of December 31, 2011, our debt consisted of approximately $217.4 million in fixed rate debt and approximately $113.7 million in variable rate debt. These instruments were entered into for other than trading purposes. Changes in interest rates have different impacts on the fixed and variable portions of our debt portfolio. A change in interest rates on the fixed portion of our debt portfolio impacts its fair value but has no impact on interest incurred or cash flows. A change in interest rates on the variable portion of our debt portfolio could impact the interest incurred and cash flows and its fair value. If the underlying rate of the related index on our variable rate debt were to increase or decrease by 100 basis points, the increase or decrease in interest expense (excluding variable rate date that was effectively fixed through an interest rate swap) would increase or decrease future earnings and cash flows by approximately $0.5 million annually.
Interest rate risk amounts were determined by considering the impact of hypothetical interest rates on our financial instruments. These analyses do not consider the effect of any change in overall economic activity that could occur. Further, in the event of a change of that magnitude, we may take actions to further mitigate our exposure to the change. However, due to the uncertainty of the specific actions that would be taken and their possible effects, these analyses assume no changes in our financial structure.
The following table summarizes annual debt maturities, average interest rates and estimated fair values on our outstanding debt as of March 31, 2012:
| Year Ending December 31, | ||||||||||||||||||||||||||||||||
| 2012 | 2013 | 2014 | 2015 | 2016 | Thereafter | Total | Fair Value | |||||||||||||||||||||||||
| Fixed rate debt |
$ | 2,210,289 | $ | 6,009,970 | $ | 14,198,243 | $ | 29,372,676 | $ | 45,413,201 | $ | 114,999,563 | $ | 212,203,942 | $ | 216,701,938 | ||||||||||||||||
| Average interest rate |
5.61 | % | 5.61 | % | 5.63 | % | 5.67 | % | 5.68 | % | 5.62 | % | — | — | ||||||||||||||||||
| Variable rate debt (1)(2) |
$ | 56,156,150 | $ | 6,810,559 | $ | 48,106,470 | — | — | — | $ | 111,073,179 | $ | 111,073,179 | |||||||||||||||||||
| Average interest rate |
5.01 | % | 4.79 | % | 4.76 | % | — | — | — | — | — | |||||||||||||||||||||
| (1) | Interest expense was calculated based upon the contractual rates. The interest expense on variable rate debt was calculated based on the rate currently in effect. Debt denominated in foreign currency has been converted at the conversion rate in effect as of the end of the period. |
| (2) | Included in the 2012 debt maturities above is $19 million related to the Bridge Loan which matures on August 31, 2012, as described in Note 5 of the Notes to the Consolidated Financial Statements. Subsequent to March 31, 2012, we have made scheduled monthly principal payments totaling $4 million, which has reduced the amount outstanding on the Bridge Loan to $15 million as of April 30, 2012. We intend to continue to fund the required monthly principal payments on the Bridge Loan using proceeds from our Offering, cash on hand and cash flow from operations. |
Also included in the 2012 debt maturities above is $37 million related to the Second Restated KeyBank Credit Facility. The $37 million represents that portion of the Second Restated KeyBank Credit Facility, as described in Note 5 of the Notes to the Consolidated Financial Statements, which would be required to be repaid in 2012 if KeyBank is unable to successfully syndicate the loan to other lenders as described in Note 5 of the Notes to the Consolidated Financial Statements. If such successful syndication is not realized, we plan to refinance the portion of the Second Restated KeyBank Credit Facility related to the non-Homeland Portfolio on a long-term basis at favorable terms, the proceeds from which, along with proceeds from our Offering, will be used to reduce the outstanding balance of the Second Restated KeyBank Credit Facility in accordance with the terms of the agreement.
In the future, we may be exposed to the effects of interest rate changes primarily as a result of borrowings used to maintain liquidity and fund acquisition, expansion, and financing of our real estate investment portfolio and operations. Our interest rate risk management objectives will be to limit the impact of interest rate changes on earnings and cash flows and to lower overall borrowing costs. To achieve our objectives, we may borrow at fixed rates or variable rates. We may also enter into derivative financial
48
Table of Contents
instruments such as interest rate swaps and caps in order to mitigate our interest rate risk on a related financial instrument or foreign currency hedges to mitigate our risk to foreign currency exposure. We will not enter into derivative or interest rate transactions for speculative purposes.
| ITEM 4. | CONTROLS AND PROCEDURES |
Disclosure Controls and Procedures
As of the end of the period covered by this report, management, including our chief executive officer and chief financial officer, evaluated the effectiveness of the design and operation of our disclosure controls and procedures. Based upon this evaluation, our chief executive officer and chief financial officer concluded that the disclosure controls and procedures were effective as of the end of the period covered by this report to ensure that information required to be disclosed in the reports we file and submit under the Exchange Act is recorded, processed, summarized and reported as and when required. Disclosure controls and procedures include, without limitation, controls and procedures designed to ensure that information required to be disclosed by us in the reports we file and submit under the Exchange Act is accumulated and communicated to our management, including our chief executive officer and our chief financial officer, as appropriate to allow timely decisions regarding required disclosure.
Internal Control Over Financial Reporting
There have been no changes in our internal control over financial reporting that occurred during the quarter ended March 31, 2012 that have materially affected, or are reasonably likely to materially affect, our internal control over financial reporting.
49
Table of Contents
| ITEM 1. | LEGAL PROCEEDINGS |
None.
| ITEM 1A. | RISK FACTORS |
The following should be read in conjunction with the risk factors set forth in our Annual Report on Form 10-K for the year ended December 31, 2011.
We may not calculate the net asset value per share for our shares annually, therefore, you may not be able to determine the net asset value of your shares on an ongoing basis during this offering.
On April 2, 2012, our board of directors approved a net asset valuation of $10.79 per share. We intend to use this net asset valuation as the estimated per share value of our shares until the next net asset valuation approved by our board of directors, which we expect to occur within the next two years. We will disclose this net asset value to stockholders in our filings with the SEC. We may not calculate the net asset value per share for our shares annually. Therefore, you may not be able to determine the net asset value of your shares on an ongoing basis during this offering. See “Investment by Tax-Exempt Entities and ERISA Considerations — Annual Valuation Requirement.”
In determining our estimated net asset value per share, we primarily relied upon a valuation of our portfolio of properties as of December 31, 2011. Valuations and appraisals of our properties are estimates of fair value and may not necessarily correspond to realizable value upon the sale of such properties, therefore our estimated net asset value per share may not reflect the amount that would be realized upon a sale of each of our properties.
For the purposes of calculating the estimated net asset value per share, an independent third party appraiser valued our properties as of December 31, 2011. The valuation methodologies used to value our properties involved certain subjective judgments. Ultimate realization of the value of an asset depends to a great extent on economic and other conditions beyond our control and the control of our advisor and independent appraiser. Further, valuations do not necessarily represent the price at which an asset would sell, since market prices of assets can only be determined by negotiation between a willing buyer and seller. Therefore, the valuations of our properties and our investments in real estate related assets may not correspond to the timely realizable value upon a sale of those assets. Because the price you will pay for shares in this offering are primarily based on the estimated net asset value per share, you may pay more than realizable value when you purchase your shares or receive less than realizable value for your investment when you sell your shares.
The offering price of our shares may not be indicative of the price at which our shares would trade if they were actively traded.
Our board of directors determined the offering price of our shares based upon a number of factors but primarily based on the estimated per share value of our shares determined by our board of directors. There are no established criteria for valuing issued or outstanding shares of companies like us. Therefore, our offering price may not be indicative of either the price at which our shares would trade if they were listed on a national exchange or actively traded by brokers or of the proceeds that a stockholder would receive if we were liquidated or dissolved and the proceeds were distributed to our stockholders.
Our share price is primarily based on the estimated per share value of our shares, but also based upon subjective judgments, assumptions and opinions by management, which may or may not turn out to be correct. Therefore, our share price may not reflect the precise amount that might be paid to you for your shares in a market transaction.
Our current share price is primarily based on our net asset value per share, which was based on an estimate of the value of our properties — consisting principally of illiquid commercial real estate — as of December 31, 2011. The valuation methodologies used by the independent appraiser retained by our board of directors to estimate the value of our wholly-owned self storage facilities as of December 31, 2011 involved subjective judgments, assumptions and opinions, which may or may not turn out to be correct. In addition, our board of directors based our share price primarily on the estimated net asset value per share which, although heavily reliant upon the independent appraisal, involved certain subjective judgments, assumptions and opinions of management. As a result, our share price may not reflect the precise amount that might be paid to for your shares in a market transaction.
We do not own or control the intellectual property rights to the “SmartStop® Self Storage” brand and other trademarks and intellectual property used by us in connection with our self storage facilities; therefore, we could potentially lose revenues and incur significant costs if we cease to operate under this brand.
50
Table of Contents
Strategic Storage Holdings, LLC, the parent company of our advisor and property manager, owns and controls the intellectual property rights to the “SmartStop® Self Storage” brand, the website www.smartstopselfstorage.com and other intellectual property currently being used by us in connection with our self storage properties. We are currently authorized to use this brand and other intellectual property pursuant to a license. In the event that we ever cease to operate under this brand, which has garnered substantial value due to its goodwill and reputation associated therewith, we may lose market share and customers, which could result in lost revenues. In addition, we could incur significant costs to change the signage and otherwise change our brand.
Our inability to increase revenue in our current lease-up properties could affect our ability to make distributions.
As of March 31, 2012, we owned several development and lease-up properties, including the Homeland Portfolio properties. Such properties are currently negatively impacting our results of operations and will continue to do so until the occupancy stabilizes. If several of these properties do not perform as expected, our results of operations and our ability to make distributions may be adversely affected.
| ITEM 2. | UNREGISTERED SALES OF EQUITY SECURITIES AND USE OF PROCEEDS |
| (a) | None. |
| (b) | On March 17, 2008, our Initial Offering (SEC File No. 333-146959) for a maximum of 110,000,000 shares of common stock, consisting of 100,000,000 shares for sale to the public and 10,000,000 shares for sale pursuant to our distribution reinvestment plan, was declared effective by the SEC. We terminated the Initial Offering on September 16, 2011, prior to the sale of all securities registered in the Initial Offering. On September 22, 2011, our Offering (SEC File No. 333-168905) for a maximum of 110,000,000 shares of common stock, consisting of 100,000,000 shares for sale to the public and 10,000,000 shares for sale pursuant to our distribution reinvestment plan, was declared effective by the SEC. As of March 31, 2012, we had issued approximately 31.8 million shares of common stock in our Initial Offering and Offering, raising gross offering proceeds of approximately $316 million. From this amount, we paid approximately $10.4 million in acquisition fees to our Advisor, approximately $29 million in selling commissions and dealer manager fees (of which approximately $23 million was reallowed to third party broker-dealers), and approximately $4.1 million in organization and offering costs to our Advisor. With the net offering proceeds and indebtedness, we acquired approximately $378 million in self storage facilities and made the other payments reflected under “Cash Flows from Financing Activities” in our consolidated statements of cash flows included in this report. |
| (c) | As noted in Notes 2 and 8 of the Notes to the Consolidated Financial Statements included in this report, and more fully described in our prospectus, as supplemented from time to time, our board of directors adopted a share redemption program on February 25, 2008, which was amended effective March 28, 2012, which enables our stockholders to have their shares redeemed by us, subject to the significant conditions and limitations described in our prospectus. Our share redemption program has no set termination date, but our ability to redeem shares under the program is limited as described in the prospectus. We have funded all redemptions using proceeds from the sale of shares pursuant to our distribution reinvestment plan. |
During the three months ended March 31, 2012, we redeemed approximately 92,000 shares of common stock for approximately $0.9 million ($9.65 per share). As of March 31, 2012, we had redemption requests for approximately 694,900 shares of common stock for approximately $6.6 million that, if honored in full, would have caused us to exceed the limits of the share redemption program. We honored such redemption requests, pursuant to the terms of the share redemption program, redeeming all death and disability redemption requests and approximately 80% of the other outstanding redemption requests. Such redemptions totaled approximately 568,800 shares for approximately $5.4 million ($9.57 per share) and were redeemed on April 30, 2012 and such amount was reclassified from redeemable common stock to accounts payable and accrued liabilities in the consolidated balance sheets as of March 31, 2012. As of March 31, 2012, we had approximately 126,000 shares that were requested for redemption, but could not be redeemed as it would have caused us to exceed the limits of the share redemption program. We treated the remainder of each redemption request as a request for redemption in the second quarter of 2012. Our board of directors may choose to amend, suspend or terminate our share redemption program upon 30 days’ written notice at any time.
During the three months ended March 31, 2012, we redeemed shares as follows:
| For the Quarter Ended(1) |
Total Number of
Shares Redeemed |
Average Price Paid per Share |
Total Number of Shares
Redeemed as Part of Publicly Announced Plans or Programs | |||||
| March 31, 2012 |
92,002 | $9.65 | 92,002 | |||||
| (1) | We redeem shares on a quarterly basis; shares are redeemed on the last business day of the first month of the respective quarter. |
51
Table of Contents
| ITEM 3. | DEFAULTS UPON SENIOR SECURITIES |
None.
| ITEM 4. | MINE SAFETY DISCLOSURES |
Not applicable.
| ITEM 5. | OTHER INFORMATION |
| (a) | During the first quarter of 2012, there was no information required to be disclosed in a report on Form 8-K which was not disclosed in a report on Form 8-K. |
| (b) | During the first quarter of 2012, there were no material changes to the procedures by which security holders may recommend nominees to our board of directors. |
| ITEM 6. | EXHIBITS |
The exhibits required to be filed with this report are set forth on the Exhibit Index hereto and incorporated by reference herein.
52
Table of Contents
EXHIBIT INDEX
The following exhibits are included in this report on Form 10-Q for the period ended March 31, 2012 (and are numbered in accordance with Item 601 of Regulation S-K).
| Exhibit No. |
Description | |
| 3.1 |
Second Articles of Amendment and Restatement of Strategic Storage Trust, Inc., incorporated by reference to Exhibit 3.1 to the Company’s Form 8-K filed on June 21, 2011, Commission File No. 000-53644 | |
| 3.2 |
Bylaws of Strategic Storage Trust, Inc., incorporated by reference to Exhibit 3.2 to Pre-Effective Amendment No. 3 to the Company’s Registration Statement on Form S-11, filed on March 7, 2008, Commission File No. 333-146959 | |
| 4.1 |
Form of Subscription Agreement and Subscription Agreement Signature Page, incorporated by reference to Appendix A to the Company’s Prospectus dated September 22, 2011, Commission File No. 333-168905 | |
| 31.1* |
Certification of Principal Executive Officer, pursuant to Section 302 of the Sarbanes-Oxley Act of 2002 | |
| 31.2* |
Certification of Principal Financial Officer, pursuant to Section 302 of the Sarbanes-Oxley Act of 2002 | |
| 32.1* |
Certification of Principal Executive Officer, pursuant to 18 U.S.C. Section 1350, as created by Section 906 of the Sarbanes-Oxley Act of 2002 | |
| 32.2* |
Certification of Principal Financial Officer, pursuant to 18 U.S.C. Section 1350, as created by Section 906 of the Sarbanes-Oxley Act of 2002 | |
| 101** |
The following Strategic Storage Trust, Inc. financial information for the quarter ended March 31, 2012, formatted in XBRL: (i) Consolidated Balance Sheets, (ii) Consolidated Statements of Operations, (iii) Consolidated Statements of Comprehensive Loss (iv) Consolidated Statement of Stockholders’ Equity, (v) Consolidated Statements of Cash Flows and (vi) the Notes to Consolidated Financial Statements. | |
| * | Filed herewith. |
| ** | Pursuant to Rule 406T of Regulation S-T, these interactive data files are deemed not filed or part of a registration statement or prospectus for purposes of Sections 11 or 12 of the Securities Act of 1933 or Section 18 of the Securities Exchange Act of 1934 and otherwise are not subject to liability under these sections. |
53
Table of Contents
SIGNATURES
Pursuant to the requirements of the Securities Exchange Act of 1934, the Registrant has duly caused this report to be signed on its behalf by the undersigned thereunto duly authorized.
| STRATEGIC STORAGE TRUST, INC. (Registrant) | ||||
| Dated: May 15, 2012 |
By: | /s/ Michael S. McClure | ||
| Michael S. McClure | ||||
| Executive Vice President, Chief Financial Officer and Treasurer | ||||
54