Attached files
| file | filename |
|---|---|
| 8-K - CURRENT REPORT - First Internet Bancorp | v345694_8k.htm |

First Internet Bancorp Annual Meeting of Shareholders May 20, 2013

Proposals
Proposal 1: Election of Directors

Proposal 2: Advisory Vote to Approve Executive Compensation
Proposal 3: Advisory Vote on Frequency of Advisory Votes to Approve Executive Compensation

Proposal 4: Approval of 2013 Equity Incentive Plan

Proposal 5: Ratification of Appointment of Independent Registered Public Accounting Firm

Voting

Safe Harbor Statement The following presentation may contain forward - looking statements with respect to the financial condition, results of operations, plans, objectives, future performance or business of the company. Forward - looking statements are generally identifiable by the use of words such as “believe,” “expect,” “anticipate,” “plan,” “intend,” “estimate,” “may,” “will,” “would,” “could,” “should” or other similar expressions. Forward - looking statements are not a guarantee of future performance or results, are based on information available at the time the statements are made and involve known and unknown risks, uncertainties and other factors that could cause actual results to differ materially from the information in the forward - looking statements. Factors that may cause such differences include: changes in interest rates; risks associated with the regulation of financial institutions and holding companies, including capital requirements and the costs of regulatory compliance; failures or interruptions in communications and information systems; general economic conditions and conditions in the lending markets; competition; the plans to grow commercial lending; the loss of key members of management and other matters discussed in the press release. For a further list and description of such risks and uncertainties, see our periodic reports filed with the U.S. Securities and Exchange Commission. We disclaim any intention or obligation to update or revise any forward - looking statements, whether as a result of new information, future events or otherwise, except as may be set forth in our periodic reports.

Better Banking • Single - bank holding company – First Internet Bank launched 1999 – The first state - chartered, FDIC - insured Internet bank • National consumer market served from a single location – Proven online retail banking and lending platform using best - of - breed technology backed by exceptional service – Powerful financial management tools and customer convenience • Local, regional, and select national commercial lending markets • Low cost delivery channel translates to customer value in the form of competitive rates and fees

Progress Full Year 2012 and First Quarter 2013 in Review

Highlights from 2012 and 1Q 2013 • Achieved record assets, deposits and profitability • Asset quality continued to be strong • Residential mortgage volume increased 109% over prior year • Increased overall lending portfolio with focus on CRE and C&I • Added key management: – Ed Roebuck as Chief Credit Officer – Kay Whitaker as Chief Financial Officer • Became an SEC reporting company and listed INBK stock on NASDAQ

Building Growth • Bolstered C&I lending and mortgage origination and support teams portfolios • Continued to build nationwide credit - tenant leasing portfolio • Partnered with BancAlliance for well - qualified, national C&I loan participation opportunities • Relocated corporate headquarters for greater efficiency • Purchased expansion facility in Fishers, IN

How We Compare • Non - traditional model • Key results snapshot for last five years – Return on Average Assets (ROAA) – Return on Average Equity (ROAE) – Net Interest Margin (NIM) – Texas Ratio Focused on Shareholders, Exceeding Peers Performance
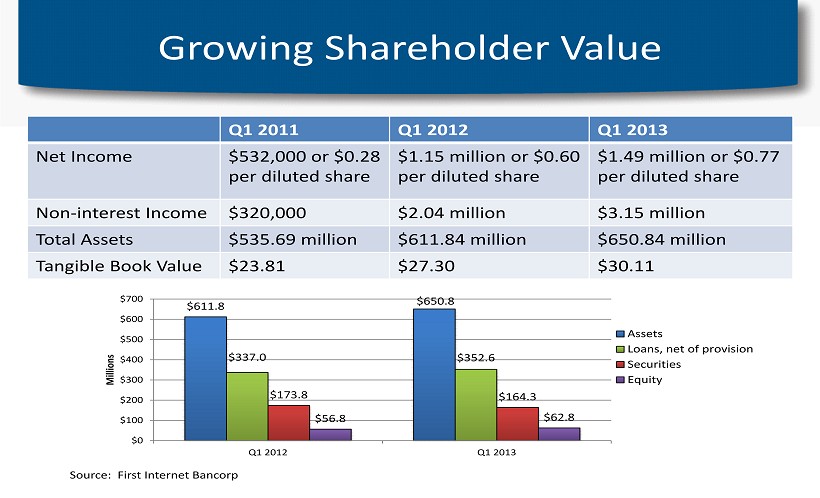
Growing Shareholder Value Source: First Internet Bancorp Q1 2011 Q1 2012 Q1 2013 Net Income $532,000 or $0.28 per diluted share $1.15 million or $0.60 per diluted share $1.49 million or $0.77 per diluted share Non - interest Income $320,000 $2.04 million $3.15 million Total Assets $535.69 million $611.84 million $650.84 million Tangible Book Value $23.81 $27.30 $30.11 $611.8 $650.8 $337.0 $352.6 $173.8 $164.3 $56.8 $62.8 $0 $100 $200 $300 $400 $500 $600 $700 Q1 2012 Q1 2013 Millions Assets Loans, net of provision Securities Equity

Improving Key Metrics Source: FFIEC Uniform Bank Performance Reports Peer Group data in this presentation represents FFIEC Peer Group 3: Insured commercial banks having assets between $300 million and $1 billion 0.00% 1.00% 2.00% 3.00% 4.00% 5.00% 2009 2010 2011 2012 Q1 2013 NIM -0.50% 0.00% 0.50% 1.00% 1.50% 2.00% 2.50% 2009 2010 2011 2012 Q1 2013 ROAA -10.00% -5.00% 0.00% 5.00% 10.00% 15.00% 2009 2010 2011 2012 Q1 2013 ROAE First Internet Bank Peer Group

Declining Cost of Funds • Continued reduction of cost of funds is expected to improve net interest margin • Lower cost structure means First Internet Bank can offer competitive deposit rates, which builds customer loyalty 0 0.5 1 1.5 2 2.5 3 3.5 2009 2010 2011 2012 Q1 2013 Cost of Funds Source: First Internet Bancorp

High Efficiency, Low Overhead • First Internet Bank continues to operate more efficiently than peers • Anticipated growth should produce future improvement Source: FFIEC Uniform Bank Performance Reports 0.00% 10.00% 20.00% 30.00% 40.00% 50.00% 60.00% 70.00% 80.00% 2009 2010 2011 2012 Q1 2013 Efficiency Ratio First Internet Bank Peer Group

0 0.5 1 1.5 2 2.5 3 3.5 4 4.5 5 2009 2010 2011 2012 Q1 2013 INBK Peer Group • Growing national mortgage origination business • 93 rd percentile within the bank’s peer group for fee income • Commercial treasury management s ervices r amping up Driving Non - Interest Income 0.00% 0.50% 1.00% 1.50% 2.00% 2.50% 2009 2010 2011 2012 Q1 2013 Non - Interest Income as a % of Average Assets First Internet Bank Peer Group Source: FFIEC Uniform Bank Performance Reports

Prudent Growth, Diversification, Asset Quality Strengths

0 0.5 1 1.5 2 2.5 3 3.5 4 4.5 5 2009 2010 2011 2012 Q1 2013 INBK Peer Group • First Internet Bank is growing assets faster than peers • No concentration in any single asset class Growth Rate Exceeds Peers Source: FFIEC Uniform Bank Performance Reports -4.00% 0.00% 4.00% 8.00% 12.00% 16.00% 20.00% 2009 2010 2011 2012 Q1 2013 Asset Growth First Internet Bank Peer Group

CRE and C&I Loan Growth $6.16 $6.98 $18.86 $64.43 $89.35 $0 $20 $40 $60 $80 $100 2009 2010 2011 2012 Q1 2013 Millions CRE $3.81 $4.83 $2.05 $13.19 $19.74 $0 $5 $10 $15 $20 $25 2009 2010 2011 2012 Q1 2013 C&I Source: First Internet Bancorp

Sales Residential RE Commercial RE Consumer Commercial Diversified Loan Portfolio • Commercial Real Estate represented 25% of the portfolio compared to 18% in 1Q 2012 • Commercial represented 6% of the portfolio compared to 2% in 1Q 2012 2013 Residential RE, $124,289,932 Commercial RE, $89,347,265 Consumer, $121,499,894 Commercial, $19,743,997 Residential RE, $134,332,289 Commercial RE, $61,406,173 Consumer, $137,066,848 Commercial, $5,920,527 Q1 2012 Loan Composition Q1 2013 Source: First Internet Bancorp

Diversified Deposit Base >50m 10m - 50m 5 - 10m 2 - 5m 1 - 2m <1m • First Internet Bank has a national presence, with deposit customers in every state Source: First Internet Bancorp

Strong Asset Quality, Declining Credit Costs $0 $2,000 $4,000 $6,000 $8,000 $10,000 $12,000 2009 2010 2011 2012 Q1 2013 (thousands) Non-performing Loans Other Real Estate Owned 0 0.5 1 1.5 2 2.5 3 3.5 2009 2010 2011 2012 Q1 2013 % of total loans NCO/Loans Loan Loss reserve/Loans • Asset quality results in a reduction in charge - offs and loan loss reserves Source: First Internet Bancorp

Enhancing Shareholder Value Our Mission

Our focus in 2013 and beyond: Growth, Earnings, Diversification • Generating more high quality assets, particularly in Commercial Real Estate and Commercial • Expanding national mortgage market share • Growing commercial deposits • Building and maintaining strong capital position • Exploring acquisition opportunities with a focus on asset originations and limited physical infrastructure

Share Price and Trading Volume Source: Yahoo! Finance 0 10,000 20,000 30,000 40,000 50,000 60,000 70,000 80,000 90,000 $0 $5 $10 $15 $20 $25 $30 $35 Price INBK Price (Adjusted Close) FIBP Price (Adjusted Close) INBK Volume FIBP Volume OTC NASDAQ

Share Price Compared to Market Source: Yahoo! Finance

INBK Share Price Upside Potential • Management believes stock valuation should appreciate as market recognizes financial performance, capital levels, credit quality and management capability • Increased trading volume on NASDAQ should provide greater liquidity for shareholders • Cash dividend initiated
Shareholder Communication • Please sign up for alerts to receive an email when First Internet Bancorp posts news: http://www.firstinternetbancorp.com/register/

Thank you for your continued support!