Attached files
| file | filename |
|---|---|
| 8-K - CURRENT REPORT - Wendy's Co | d533109d8k.htm |
 ©
2013 Oldemark LLC
First Quarter 2013
First Quarter 2013
Earnings Conference Call
Earnings Conference Call
May 8, 2013
May 8, 2013
Exhibit 99.1 |
 ©
2013 Oldemark LLC
JOHN BARKER
JOHN BARKER
Chief Communications
Chief Communications
Officer
Officer
2 |
 Today’s Agenda
CEO Overview
Emil Brolick
Financial Update
Steve Hare
Q&A
3 |
 4
Forward-Looking Statements and Non-GAAP Financial Measures
Forward-Looking Statements and Non-GAAP Financial Measures
This presentation, and certain information that management may discuss in connection with
this presentation, contains certain statements that are not historical
facts, including information concerning possible or assumed future results of our
operations. Those statements constitute “forward-looking statements” within the meaning of
the Private Securities Litigation Reform Act of 1995 (The “Reform Act”). For
all forward-looking statements, we claim the protection of the safe harbor for
forward-looking statements contained in the Reform Act.
Many important factors could affect our future results and could cause those results to
differ materially from those expressed in or implied by our forward-looking
statements. Such factors, all of which are difficult or impossible to predict
accurately, and many of which are beyond our control, include but are not limited to those identified under
the caption “Forward-Looking Statements” in our news release issued on May
8, 2013 and in the “Special Note Regarding Forward-Looking Statements and
Projections” and “Risk Factors” sections of our most recent Form 10-K /
Form 10-Qs.
In addition, this presentation and certain information management may
discuss in connection with this presentation reference non-GAAP financial
measures, such as adjusted earnings before interest, taxes, depreciation and
amortization, or adjusted EBITDA, and adjusted earnings per share. Adjusted EBITDA and
adjusted earnings per share exclude certain expenses, net of certain benefits.
Reconciliations of non-GAAP financial measures to the most directly comparable
GAAP financial measures are provided in the Appendix to this presentation, and are included in
our news release issued on May 8, 2013 and posted on www.aboutwendys.com.
|
 ©
2013 Oldemark LLC
EMIL BROLICK
EMIL BROLICK
President & CEO
President & CEO
5 |
 Adjusted
EBITDA* $77.3 mil
vs.
$63.9 mil
Adjusted EPS*
$0.03
vs.
$0.01
Company-Operated
1.0%
vs. 0.8%
SSS
6
Q1 2013 Highlights
Q1 2013 Highlights
2013
2012
*See reconciliation of Adjusted EBITDA and Adjusted EPS in the appendix.
|
 ©
2013 Oldemark LLC
Adjusted EBITDA
Adjusted EBITDA
$350 to $360 million
$350 to $360 million
Reaffirm
Reaffirm
Adjusted EPS
Adjusted EPS
$0.20 to $0.22
$0.20 to $0.22
Raising
Raising
2013 OUTLOOK:
2013 OUTLOOK:
7 |
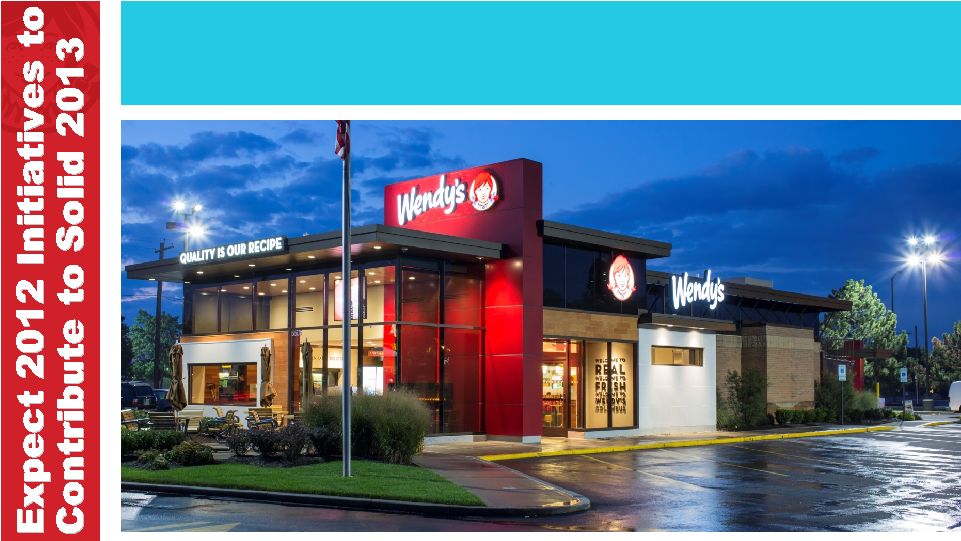
 Expect
2012 Expect 2012
Initiatives to
Initiatives to
Contribute to
Contribute to
Solid 2013
Solid 2013
8 |
 Right
Price Right Size Menu Development Right Price Right Size Menu Development
9 |
 Image
Activation Beginning to Support SSS Image Activation Beginning to Support SSS
and Accelerate Re-imaging
and Accelerate Re-imaging
Opened 48 Tier I Reimages
Completed Tier II & III
Design Work
10 |
 Reduction in Number of Restaurants
Serving Breakfast
Serving Breakfast
Negative Impact on SSS
Positive Impact on EBITDA
11 |
 Ongoing
Cost Reduction Ongoing Cost Reduction
G&A Management & Efficiencies
Reduction in Beverage Costs
Packaging Optimization
RFPs with Purchasing Co-op
12 |
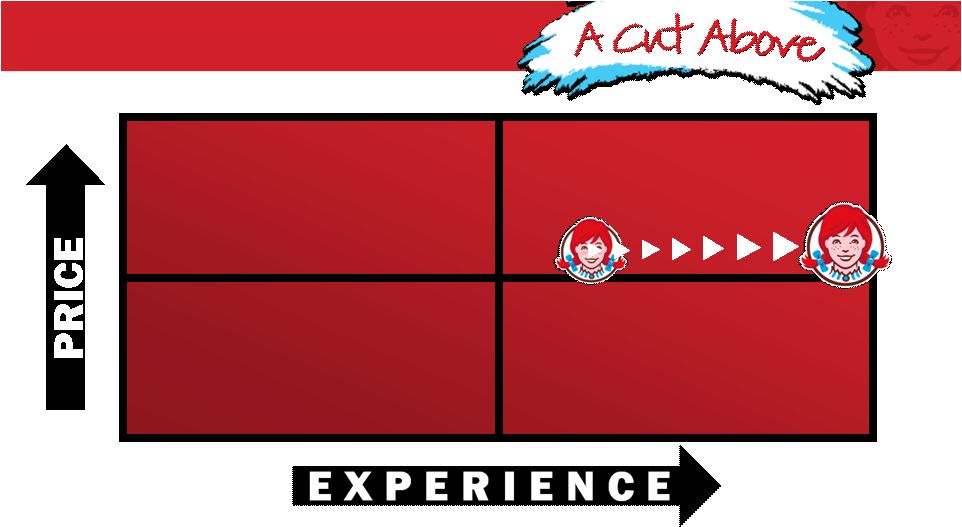 HIGH
LOW
FUNCTIONAL
EMOTIONAL
BRAND VISION…
BRAND VISION…
13
COMPETITOR
A
COMPETITOR
B
NEW QSRs |
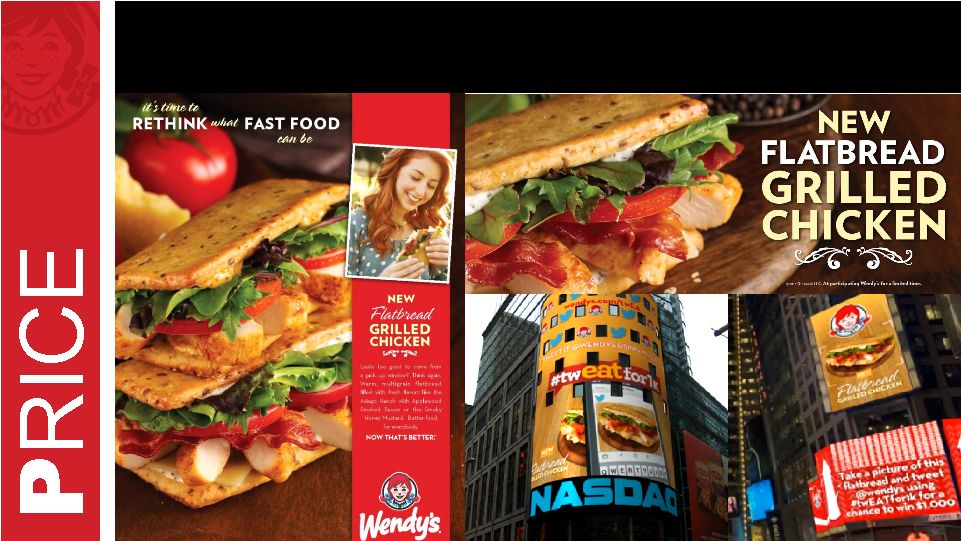
 PRICE
PRICE
New QSR Quality at QSR Price
New QSR Quality at QSR Price
PRODUCT
PRODUCT
Play a different game …
Play a different game …
Superior
Superior
perceived quality, competitive price
perceived quality, competitive price
PEOPLE
PEOPLE
5-Star Performers
5-Star Performers
PERFORMANCE
PERFORMANCE
Keeping the brand promise
Keeping the brand promise
PROMOTION
PROMOTION
Strategically driven, tactically brilliant
Strategically driven, tactically brilliant
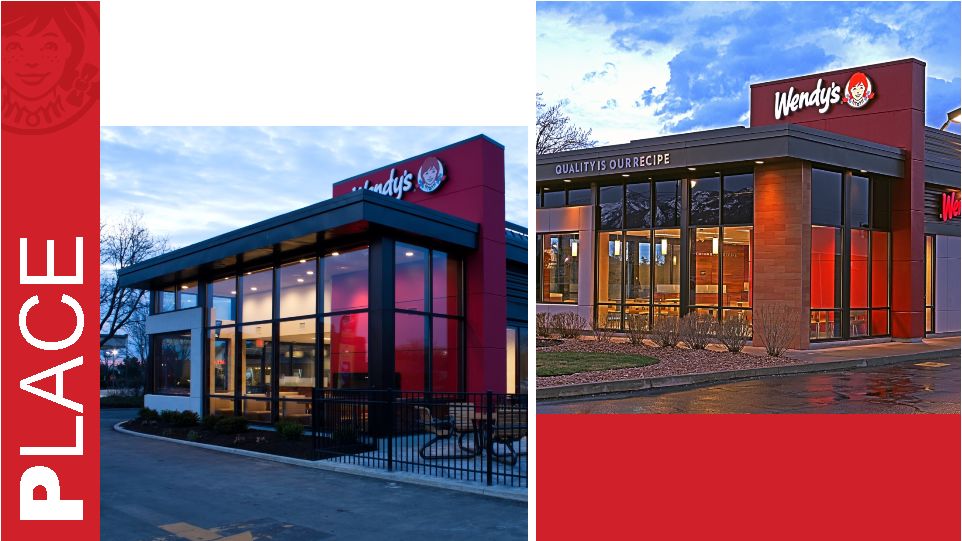
PLACE
PLACE
The complete brand experience
The complete brand experience
14
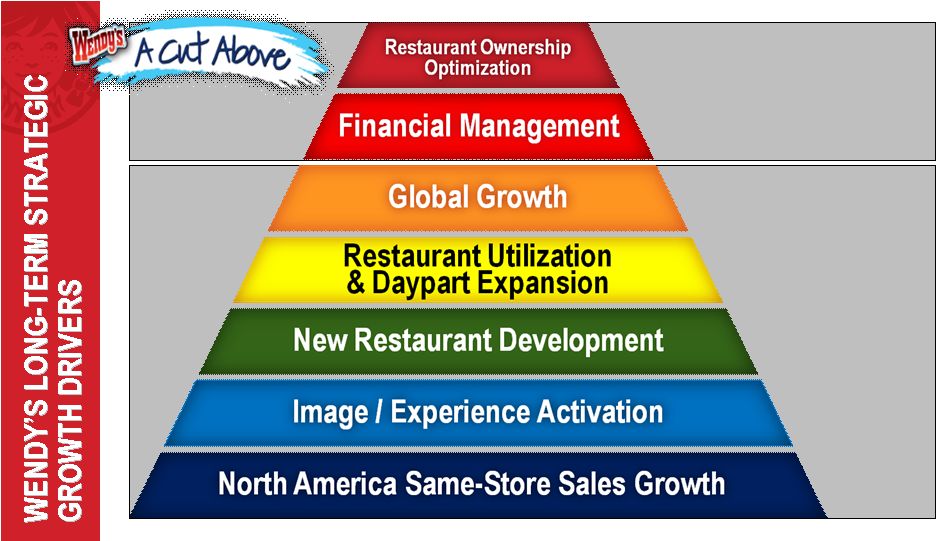
Enabling Profitable Growth
Enabling Profitable Growth
THE RECIPE TO WIN
THE RECIPE TO WIN |
 NEW QSR
QUALITY AT QSR PRICE 15 |
 PLAYING A
DIFFERENT
GAME
16 |
 PREMIUM
PRICE / VALUE
BUILD BIG BRAND, DRIVE TRAFFIC
17 |
  2013 Tier II
Columbus, OH
Columbus, OH
2013 Tier III
2013 Tier III
Salt Lake City
Salt Lake City
18 |
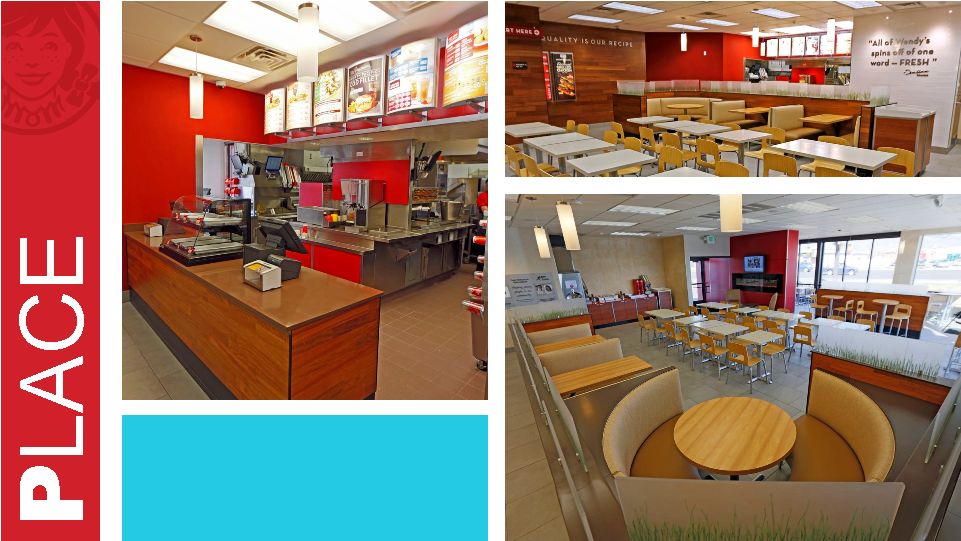 19
Tier III
Tier III
Interior
Interior |
 20
Core Organic
Growth
Strategies
Shareholder
Value-Enhancing
Initiatives |
 Todd
Penegor to Become Chief Financial Officer
September 1, 2013
CFO Steve Hare to Retire
from Wendy’s
21 |
 ©
2013 Oldemark LLC
STEVE HARE
STEVE HARE
Chief Financial Officer
Chief Financial Officer
22 |
   23
Wendy’s Q1 2013 Highlights
Wendy’s Q1 2013 Highlights
Company
Restaurant Margin +100bps
Q1 2013 12.8%
Q1 2012 11.8%
Company
Restaurant Margin +100bps
Q1 2013 12.8%
Q1 2012 11.8%
February
March (local)
January
Q1 2013 North America
Same-Store Sales
1-Year
2-Year
Company-Operated 1.0%
1.8%
Franchise
0.6% 1.3% |
 24
Q1 2013 Financial Summary
Q1 2013 Financial Summary
Q1
2013
Q1
2012
$
Change
%
Change
Sales
530.7
$
519.9
$
10.8
$
2.1%
Franchise revenues
73.0
73.3
(0.3)
-0.4%
Total revenues
603.7
$
593.2
$
10.5
$
1.8%
Adjusted EBITDA*
77.3
$
63.9
$
13.4
$
21.0%
Adjusted EPS*
0.03
$
0.01
$
0.02
$
200.0%
($ in millions except per share amounts)
(Unaudited)
*See reconciliation of Adjusted EBITDA and Adjusted EPS in the appendix.
|
 Adjusted
Income and Special Items Adjusted Income and Special Items
25
*See reconciliation of Adjusted Income and Adjusted EPS in the appendix.
(In Thousands Except Per Share Amounts)
(Unaudited)
Per share
Per share
Adjusted income and adjusted earnings per share*
13,101
$
0.03
$
3,347
$
0.01
$
(Less) plus:
Depreciation of assets that will be replaced as part of the Image Activation initiative
(9,068)
(0.02)
-
-
Facilities relocation costs and other transactions
(1,900)
(0.00)
(3,808)
(0.01)
Impairment of long-lived assets
-
-
(2,783)
(0.01)
Gain on sale of investment, net
-
-
17,978
0.05
Total adjustments
(10,968)
(0.02)
11,387
0.03
Net income
2,133
0.01
14,734
0.04
Net income attributable to noncontrolling interests
-
-
(2,384)
(0.01)
Net income and earnings per share attributable to The Wendy's Company
2,133
$
0.01
$
12,350
$
0.03
$
First Quarter
2013
2012 |
 26
2013 Image Activation Depreciation
2013 Image Activation Depreciation
Assets replaced are depreciated from the beginning of the year
until closure for construction
Q1
Q2
Q3
Q4
2013
# of reopenings
3
24
44
29
100
# of restaurants
depreciated
100
73
29
-
100
% of IA depreciation
adjustment
~65%
~25%
~10%
0%
$20M to
$25M |
 27
Q1 2013 Cash Flow Highlights
Q1 2013 Cash Flow Highlights
($ in millions)
(unaudited)
Cash flow from operations
32.6
$
Capital expenditures
40.0
Beginning cash balance
453.4
$
Change in cash
(24.7)
Ending cash balance
428.7
$
Q1 2013 |
 28
Selected Balance Sheet Highlights
Selected Balance Sheet Highlights
($ in millions)
(unaudited)
Cash
429
$
Senior Debt
1,419
$
Capital Leases and Other Debt
37
Total Debt
1,456
$
TTM Adjusted EBITDA*
347
$
Total Debt / TTM Adjusted EBITDA*
4.2x
Net Debt / TTM Adjusted EBITDA*
3.0x
March 31, 2013
*See reconciliation of Adjusted EBITDA in the appendix. |
  29
•Refinancing
of $350M of the $1,119M senior secured Term Loan B into
a new senior secured Term Loan A
•Repricing of
the remaining Term Loan B balance of approximately $769M by reducing
the interest rate margin and floor •Extension of the maturity of the $200M revolving credit facility
by one year
2013 Debt Refinancing Expected to Save
2013 Debt Refinancing Expected to Save
~$20 million in Annualized Interest Expense
~$20 million in Annualized Interest Expense
$50M
$50M
Annualized Net Interest Expense Savings
Annualized Net Interest Expense Savings
vs. 2011 from 2012 and 2013 Refinancings
vs. 2011 from 2012 and 2013 Refinancings |
 Image
Activation Results* Image Activation Results*
Year 1 average sales
lift exceeded 25%
Sales sustaining at
~20% vs. pre-remodel
volumes
2011
10 concept reimages
Average sales lift
exceeding 25%
since re-opening
Sales sustaining at
~18% vs. pre-remodel
volumes
2012
48 Tier I reimages
* Results exclude 2 non-comparable restaurants in 2011 and 5 non-comparable
restaurants in 2012. 30 |
  Image
Activation Designs Expanding Image Activation Designs Expanding
Franchise Restaurant
San Antonio, TX
International
Restaurants
714 Third Ave
June 2013
New Build
650 Broadway
June 2013
Reimage
85 Nassau St
July 2013
Reimage
Elmsford
August 2013
Reimage
NY
Openings
31 |
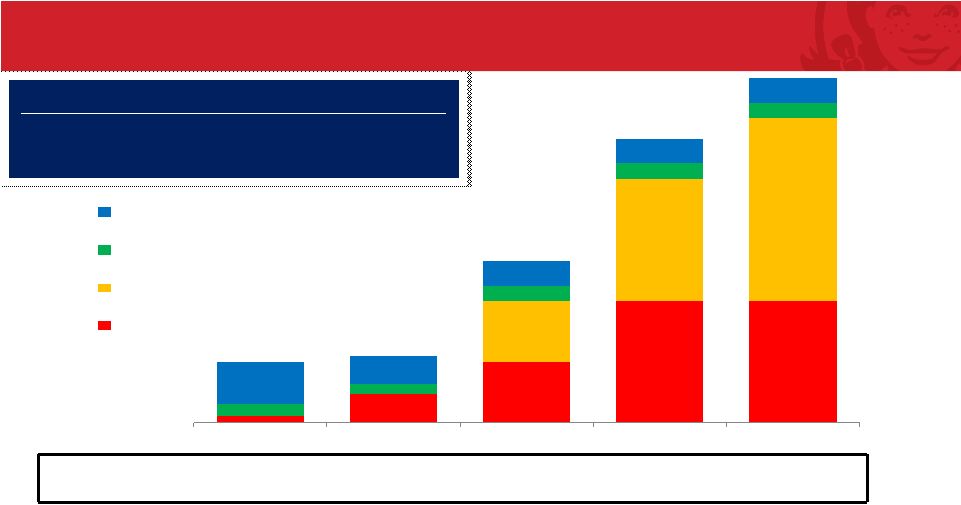 Image
Activation Multi-Year Growth Plan Image Activation Multi-Year Growth
Plan 32
10
48
100
200
200
100
200
300
20
16
25
25
25
69
45
40
40
40
2011
2012
2013
2014
2015
Fr. New
Co. New
Fr. Reimage
Co. Reimage
Cumulative
IA Restaurants
10
76
301
766
1,331
Image Activation Progress by Year-End 2015:
•50% of Company
restaurants •1 out
of 5 restaurants in the Wendy’s System
Note: New Company restaurants were Image Activation building design beginning
in 2012; 2 of 45 new Franchise restaurants were Image Activation in
2012. Estimates based on Company’s current outlook. |
       Strong Free
Cash Flow & Balance Sheet Strong Free Cash Flow & Balance Sheet
33
Accelerating Investment in
Image Activation:
Expect $440 to $500 million 2013 to 2015*
RETURN CAPITAL TO SHAREHOLDERS
RETURN CAPITAL TO SHAREHOLDERS
* Estimates based on
Company’s current outlook.
$100 million share repurchase program
authorized through 12/29/13
Current dividend yield of 2.7%
(based on share price as of 5/3/13)
CORE GROWTH PRIORITY
CORE GROWTH PRIORITY |
   2013 and
Long-Term Earnings Outlook 2013 and Long-Term Earnings Outlook
Adjusted EBITDA:
$350 to $360 million,
5% to 8% increase vs. 2012
Adjusted EPS:
$0.20 to $0.22,
18% to 29% increase vs.
2012
Average annual
Adjusted EBITDA and
Adjusted EPS
growth rates in
high-single-digit to low-
double-digit range
2013
Long-Term
Estimates based on Company’s current outlook.
34 |
 ©
2013 Oldemark LLC
JOHN BARKER
JOHN BARKER
Chief Communications
Chief Communications
Officer
Officer
35 |
 2013
Events May 23:
Annual Stockholder Meeting
June:
Begin Image Activation Market Visits with Investors
Aug. 7:
Second Quarter Earnings Release & Conference Call
36
Investor Relations Calendar
Investor Relations Calendar |
 Q&A
Q&A
37 |
 Appendix
38 |
 Reconciliation of Adjusted EBITDA to Net Income
Attributable to The Wendy's Company
(In Thousands)
(Unaudited)
2013
2012
Adjusted EBITDA
77,299
$
63,881
$
Less:
Depreciation and amortization
(51,797)
(32,311)
Impairment of long-lived assets
-
(4,511)
Facilities relocation costs and other transactions
(3,038)
(6,143)
Operating profit
22,464
20,916
Interest expense
(20,964)
(28,235)
Other expense, net and investment income, net
(2,271)
28,931
(Loss) income before income taxes and noncontrolling interests
(771)
21,612
Benefit from (provision for) income taxes
2,904
(6,878)
Net income
2,133
14,734
Net income attributable to noncontrolling interests
-
(2,384)
Net income attributable to The Wendy's Company
2,133
$
12,350
$
First Quarter
39 |
 40
Reconciliation of Adjusted Income and Adjusted Earnings Per Share to
Net Income and Earnings Per Share Attributable to The Wendy's Company
(In Thousands Except Per Share Amounts)
(Unaudited)
Per share
Per share
Adjusted income and adjusted earnings per share
13,101
$
0.03
$
3,347
$
0.01
$
(Less) plus:
Depreciation of assets that will be replaced as part of the Image Activation initiative
(9,068)
(0.02)
-
-
Facilities relocation costs and other transactions
(1,900)
(0.00)
(3,808)
(0.01)
Impairment of long-lived assets
-
-
(2,783)
(0.01)
Gain on sale of investment, net
-
-
17,978
0.05
Total adjustments
(10,968)
(0.02)
11,387
0.03
Net income
2,133
0.01
14,734
0.04
Net income attributable to noncontrolling interests
-
-
(2,384)
(0.01)
Net income and earnings per share attributable to The Wendy's Company
2,133
$
0.01
$
12,350
$
0.03
$
First Quarter
2013
2012 |