

| Consolidated Balance Sheets |
|
|
|
|
| (unaudited) |
|
|
|
|
| |
|
March 31, |
|
September 30, |
| ASSETS |
|
2013 |
|
2012 |
| Real Estate Investments: |
|
|
|
|
| Land |
|
$ 92,470,414 |
|
$ 88,559,914 |
| Buildings and Improvements |
|
499,445,482 |
|
457,557,443 |
| Total Real Estate Investments |
|
591,915,896 |
|
546,117,357 |
| Accumulated Depreciation |
|
(84,620,330) |
|
(78,230,873) |
| Net Real Estate Investments |
|
507,295,566 |
|
467,886,484 |
| |
|
|
|
|
| Real Estate Held for Sale |
|
- |
|
1,080,940 |
| Cash and Cash Equivalents |
|
20,130,455 |
|
24,650,858 |
| Securities Available for Sale at Fair Value |
|
52,264,390 |
|
61,685,173 |
| Tenant and Other Receivables |
|
3,068,710 |
|
1,116,825 |
| Deferred Rent Receivable |
|
2,937,695 |
|
2,214,501 |
| Loans Receivable, net |
|
76,695 |
|
87,916 |
| Prepaid Expenses |
|
3,448,316 |
|
1,428,454 |
| Financing Costs, net of Accumulated Amortization of |
|
|
|
|
| $2,747,413 and $2,546,806, respectively |
|
3,568,398 |
|
3,213,762 |
| Lease Costs, net of Accumulated Amortization of |
|
|
|
|
| $1,213,305 and $1,156,699, respectively |
|
2,046,158 |
|
1,518,780 |
| Intangible Assets, net of Accumulated Amortization of |
|
|
|
|
| $7,530,104 and $6,731,014, respectively |
|
7,485,936 |
|
7,635,026 |
| Other Assets |
|
2,450,801 |
|
1,988,983 |
| TOTAL ASSETS |
|
$ 604,773,120 |
|
$ 574,507,702 |
| |
|
|
|
|
| LIABILITIES AND SHAREHOLDERS' EQUITY |
|
|
|
|
| Liabilities: |
|
|
|
|
| Mortgage Notes Payable |
|
$ 251,352,627 |
|
$ 237,943,911 |
| Subordinated Convertible Debentures |
|
-0- |
|
8,615,000 |
| Loans Payable |
|
17,200,000 |
|
5,200,000 |
| Accounts Payable and Accrued Expenses |
|
3,590,366 |
|
3,881,769 |
| Other Liabilities |
|
4,730,004 |
|
3,179,883 |
| Total Liabilities |
|
276,872,997 |
|
258,820,563 |
| |
|
|
|
|
| COMMITMENTS AND CONTINGENCIES |
|
|
|
|
| |
|
|
|
|
| Shareholders' Equity: |
|
|
|
|
| Series A - 7.625% Cumulative Redeemable Preferred Stock, |
|
|
|
|
| $0.01 Par Value Per Share: 2,139,750 Shares Authorized, Issued and |
|
|
|
|
| Outstanding as of March 31, 2013 and September 30, 2012 |
|
53,493,750 |
|
53,493,750 |
| Series B - 7.875% Cumulative Redeemable Preferred Stock, |
|
|
|
|
| $0.01 Par Value Per Share: 2,300,000 Shares Authorized, Issued and |
|
|
|
|
| Outstanding as of March 31, 2013 and September 30, 2012 |
|
57,500,000 |
|
57,500,000 |
| Common Stock – $0.01 Par Value Per Share: 67,700,000 Shares Authorized |
|
|
|
|
| as of March 31, 2013 and 42,205,458 and 40,696,692 Shares Issued and |
|
|
|
|
| Outstanding as of March 31, 2013 and September 30, 2012, respectively |
|
422,055 |
|
406,967 |
| Excess Stock – $0.01 Par Value per share: 5,000,000 Shares |
|
|
|
|
| Authorized; No Shares Issued or Outstanding |
|
- |
|
- |
| Additional Paid-In Capital |
|
210,561,738 |
|
198,902,485 |
| Accumulated Other Comprehensive Income |
|
5,922,580 |
|
5,383,937 |
| Undistributed Income |
|
- |
|
- |
| Total Shareholders' Equity |
|
327,900,123 |
|
315,687,139 |
| TOTAL LIABILITIES & SHAREHOLDERS' EQUITY |
|
$ 604,773,120 |
|
$ 574,507,702 |
| |
|
|
|
|
Second Quarter FY 2013 Supplemental
of Monmouth Real Estate Investment Corp. Page 3 of 19
|
Consolidated Statements of Operations |
|
|
|
|
|
|
|
|
| (unaudited) |
|
|
|
|
|
|
|
|
| |
Three Months Ended |
|
Six Months Ended |
|
| |
3/31/2013 |
|
3/31/2012 |
|
3/31/2013 |
|
3/31/2012 |
|
| INCOME: |
|
|
|
|
|
|
|
|
| Rental Revenue |
$11,738,407 |
|
$10,691,955 |
|
$23,047,661 |
|
$21,349,581 |
|
| Reimbursement Revenue |
1,567,802 |
|
1,875,848 |
|
3,086,038 |
|
3,455,688 |
|
| Lease Termination Income |
-0- |
|
3,222,283 |
|
690,730 |
|
3,222,283 |
|
| TOTAL INCOME |
13,306,209 |
|
15,790,086 |
|
26,824,429 |
|
28,027,552 |
|
| |
|
|
|
|
|
|
|
|
| EXPENSES: |
|
|
|
|
|
|
|
|
| Real Estate Taxes |
1,117,948 |
|
1,675,693 |
|
2,281,462 |
|
3,100,296 |
|
| Operating Expenses |
967,176 |
|
605,502 |
|
1,493,800 |
|
1,270,329 |
|
| General & Administrative Expense |
944,352 |
|
926,267 |
|
2,239,408 |
|
1,941,500 |
|
| Acquisition Costs |
-0- |
|
261,382 |
|
385,862 |
|
565,724 |
|
| Depreciation |
3,268,393 |
|
2,810,470 |
|
6,389,457 |
|
5,576,986 |
|
| Amortization of Lease Costs and Intangible Assets |
477,852 |
|
413,123 |
|
970,716 |
|
801,518 |
|
| TOTAL EXPENSES |
6,775,721 |
|
6,692,437 |
|
13,760,705 |
|
13,256,353 |
|
| |
|
|
|
|
|
|
|
|
| |
|
|
|
|
|
|
|
|
| OTHER INCOME (EXPENSE): |
|
|
|
|
|
|
|
|
| Interest and Dividend Income |
1,004,964 |
|
892,506 |
|
2,128,025 |
|
1,841,832 |
|
| Gain on Securities Transactions, net |
3,802,704 |
|
2,209,257 |
|
5,913,472 |
|
4,997,715 |
|
| Interest Expense |
(3,842,634) |
|
(3,779,879) |
|
(7,718,306) |
|
(7,633,597) |
|
| Amortization of Financing Costs |
(152,095) |
|
(115,259) |
|
(332,885) |
|
(355,321) |
|
| TOTAL OTHER INCOME (EXPENSE) |
812,939 |
|
(793,375) |
|
(9,694) |
|
(1,149,371) |
|
| |
|
|
|
|
|
|
|
|
| |
|
|
|
|
|
|
|
|
| INCOME FROM CONTINUING OPERATIONS |
7,343,427 |
|
8,304,274 |
|
13,054,030 |
|
13,621,828 |
|
| |
|
|
|
|
|
|
|
|
| INCOME (LOSS) FROM DISCONTINUED OPERATIONS |
300,484 |
|
(44,242) |
|
296,458 |
|
4,227 |
|
| |
|
|
|
|
|
|
|
|
| NET INCOME |
7,643,911 |
|
8,260,032 |
|
13,350,488 |
|
13,626,055 |
|
| |
|
|
|
|
|
|
|
|
| Less: Preferred Dividend |
2,151,758 |
|
1,019,805 |
|
4,303,516 |
|
2,039,610 |
|
| |
|
|
|
|
|
|
|
|
| NET INCOME ATTRIBUTABLE TO |
|
|
|
|
|
|
|
|
| COMMON SHAREHOLDERS |
$5,492,153 |
|
$7,240,227 |
|
$9,046,972 |
|
$11,586,445 |
|
| |
|
|
|
|
|
|
|
|
| |
|
|
|
|
|
|
|
|
Second Quarter FY 2013 Supplemental
of Monmouth Real Estate Investment Corp. Page 4 of 19
|
FFO, Core FFO, AFFO, NOI and EBIDTA Reconciliations |
|
|
|
|
|
|
|
| (unaudited) |
|
|
|
|
|
|
|
| |
|
Three Months Ended |
|
Six Months Ended |
| |
|
3/31/2013 |
|
3/31/2012 |
|
3/31/2013 |
|
3/31/2012 |
| Revenues |
|
|
|
|
|
|
|
| |
Rental Revenue |
$11,738,407 |
|
$10,691,955 |
|
$23,047,661 |
|
$21,349,581 |
| |
Reimbursement Revenue |
1,567,802 |
|
1,875,848 |
|
3,086,038 |
|
3,455,688 |
| |
Total Revenue |
13,306,209 |
|
12,567,803 |
|
26,133,699 |
|
24,805,269 |
| |
|
|
|
|
|
|
|
|
| Expenses |
|
|
|
|
|
|
|
| |
Real Estate Taxes |
1,117,948 |
|
1,675,693 |
|
2,281,462 |
|
3,100,296 |
| |
Operating Expenses |
967,176 |
|
605,502 |
|
1,493,800 |
|
1,270,329 |
| |
Total Expenses |
2,085,124 |
|
2,281,195 |
|
3,775,262 |
|
4,370,625 |
| |
|
|
|
|
|
|
|
|
| Net Operating Income - NOI |
11,221,085 |
|
10,286,608 |
|
22,358,437 |
|
20,434,644 |
| |
|
|
|
|
|
|
|
|
| |
Lease Termination Income |
- |
|
3,222,283 |
|
690,730 |
|
3,222,283 |
| |
Interest and Dividend Income |
1,004,964 |
|
892,506 |
|
2,128,025 |
|
1,841,832 |
| |
Net Operating Income (Loss) from Discontinued Operations |
(45,310) |
|
(24,595) |
|
(36,493) |
|
51,234 |
| |
General & Administrative Expense |
(944,352) |
|
(926,267) |
|
(2,239,408) |
|
(1,941,500) |
| |
|
|
|
|
|
|
|
|
| |
|
|
|
|
|
|
|
|
| EBITDA |
11,236,387 |
|
13,450,535 |
|
22,901,291 |
|
23,608,493 |
| |
|
|
|
|
|
|
|
|
| |
Interest Expense |
(3,842,634) |
|
(3,779,879) |
|
(7,718,306) |
|
(7,633,597) |
| |
Gain on Securities Transactions, net |
3,802,704 |
|
2,209,257 |
|
5,913,472 |
|
4,997,715 |
| |
Acquisition Costs |
- |
|
(261,382) |
|
(385,862) |
|
(565,724) |
| |
Preferred Dividend |
(2,151,758) |
|
(1,019,805) |
|
(4,303,516) |
|
(2,039,610) |
| |
Other Amortization |
(245,244) |
|
(206,463) |
|
(534,195) |
|
(517,028) |
| |
|
|
|
|
|
|
|
|
| Funds From Operations - FFO |
8,799,455 |
|
10,392,263 |
|
15,872,884 |
|
17,850,249 |
| |
|
|
|
|
|
|
|
|
| |
Depreciation Expense (including discontinued operations) |
(3,268,393) |
|
(2,830,117) |
|
(6,402,300) |
|
(5,615,773) |
| |
Income (Loss) on Sale of Investment Property |
345,794 |
|
- |
|
345,794 |
|
(8,220) |
| |
Amortization of In-Place Lease Intangible Assets |
(384,703) |
|
(321,919) |
|
(769,406) |
|
(639,811) |
| |
|
|
|
|
|
|
|
|
| Net Income Attributable to Common Shareholders |
5,492,153 |
|
7,240,227 |
|
9,046,972 |
|
11,586,445 |
| |
|
|
|
|
|
|
|
|
| |
|
|
|
|
|
|
|
|
| Funds From Operations - FFO |
8,799,455 |
|
10,392,263 |
|
15,872,884 |
|
17,850,249 |
| |
|
|
|
|
|
|
|
|
| |
Acquisition Costs |
- |
|
261,382 |
|
385,862 |
|
565,724 |
| |
|
|
|
|
|
|
|
|
| Core Funds From Operations - Core FFO |
8,799,455 |
|
10,653,645 |
|
16,258,746 |
|
18,415,973 |
| |
|
|
|
|
|
|
|
|
| |
Gain on Securities Transactions, net |
(3,802,704) |
|
(2,209,257) |
|
(5,913,472) |
|
(4,997,715) |
| |
Stock Compensation Expense |
81,562 |
|
62,373 |
|
161,089 |
|
126,696 |
| |
Other Amortization |
245,244 |
|
206,463 |
|
534,195 |
|
517,028 |
| |
Straight-lined Rents |
(575,202) |
|
(69,437) |
|
(723,195) |
|
(98,462) |
| |
Recurring Capital Expenditures |
(140,164) |
|
(97,132) |
|
(176,804) |
|
(258,520) |
| |
|
|
|
|
|
|
|
|
| Adjusted Funds From Operations - AFFO |
4,608,191 |
|
8,546,655 |
|
10,140,559 |
|
13,705,000 |
| |
|
|
|
|
|
|
|
|
| EBITDA |
11,236,387 |
|
13,450,535 |
|
22,901,291 |
|
23,608,493 |
| |
|
|
|
|
|
|
|
|
| |
Interest Expense |
(3,842,634) |
|
(3,779,879) |
|
(7,718,306) |
|
(7,633,597) |
| |
Preferred Dividend |
(2,151,758) |
|
(1,019,805) |
|
(4,303,516) |
|
(2,039,610) |
| |
Stock Compensation Expense |
81,562 |
|
62,373 |
|
161,089 |
|
126,696 |
| |
Straight-lined Rents |
(575,202) |
|
(69,437) |
|
(723,195) |
|
(98,462) |
| |
Recurring Capital Expenditures |
(140,164) |
|
(97,132) |
|
(176,804) |
|
(258,520) |
| |
|
|
|
|
|
|
|
|
| Adjusted Funds From Operations - AFFO |
$4,608,191 |
|
$8,546,655 |
|
$10,140,559 |
|
$13,705,000 |
| |
|
|
|
|
|
|
|
|
|
|
Second Quarter FY 2013 Supplemental
of Monmouth Real Estate Investment Corp. Page 5 of 19
|
Financial Highlights |
|
|
|
|
|
|
|
| (unaudited) |
|
|
|
|
|
|
|
| |
|
Three Months Ended |
|
Six Months Ended |
| |
|
3/31/2013 |
|
3/31/2012 |
|
3/31/2013 |
|
3/31/2012 |
| |
|
|
|
|
|
|
|
|
| Weighted Average Shares Outstanding |
|
|
|
|
|
|
|
| |
Basic |
41,770,762 |
|
39,883,133 |
|
41,331,860 |
|
38,631,103 |
| |
Diluted |
41,989,449 |
|
40,043,673 |
|
41,545,266 |
|
38,749,864 |
| |
|
|
|
|
|
|
|
|
| Net Operating Income - NOI |
$11,221,085 |
|
$10,286,608 |
|
$22,358,437 |
|
$20,434,644 |
| |
|
|
|
|
|
|
|
|
| |
Basic |
$0.27 |
|
$0.26 |
|
$0.54 |
|
$0.53 |
| |
Diluted |
0.27 |
|
0.26 |
|
0.54 |
|
0.53 |
|
Net Income Attributable to Common Shareholders |
$5,492,153 |
|
$7,240,227 |
|
$9,046,972 |
|
$11,586,445 |
| |
|
|
|
|
|
|
|
|
| |
Basic |
$0.13 |
|
$0.18 |
|
$0.22 |
|
$0.30 |
| |
Diluted |
0.13 |
|
0.18 |
|
0.22 |
|
0.30 |
| |
|
|
|
|
|
|
|
|
| Funds From Operations - FFO |
$8,799,455 |
|
$10,392,263 |
|
$15,872,884 |
|
$17,850,249 |
| |
|
|
|
|
|
|
|
|
| |
Basic |
$0.21 |
|
$0.26 |
|
$0.38 |
|
$0.46 |
| |
Diluted |
0.21 |
|
0.26 |
|
0.38 |
|
0.46 |
| |
|
|
|
|
|
|
|
|
| Core Funds From Operations - Core FFO |
$8,799,455 |
|
$10,653,645 |
|
$16,258,746 |
|
$18,415,973 |
| |
|
|
|
|
|
|
|
|
| |
Basic |
$0.21 |
|
$0.27 |
|
$0.39 |
|
$0.48 |
| |
Diluted |
0.21 |
|
0.27 |
|
0.39 |
|
0.48 |
| |
|
|
|
|
|
|
|
|
| Core FFO Excluding Gains on Securities Transactions, net |
$4,996,751 |
|
$8,444,388 |
|
$10,345,274 |
|
$13,418,258 |
| |
|
|
|
|
|
|
|
|
| |
Basic |
$0.12 |
|
$0.21 |
|
$0.25 |
|
$0.35 |
| |
Diluted |
0.12 |
|
0.21 |
|
0.25 |
|
0.35 |
| |
|
|
|
|
|
|
|
|
| Adjusted Funds From Operations - AFFO |
$4,608,191 |
|
$8,546,655 |
|
$10,140,559 |
|
$13,705,000 |
| |
|
|
|
|
|
|
|
|
| |
Basic |
$0.11 |
|
$0.21 |
|
$0.25 |
|
$0.35 |
| |
Diluted |
0.11 |
|
0.21 |
|
0.24 |
|
0.35 |
| |
|
|
|
|
|
|
|
| AFFO Excluding Lease Termination Income, net |
$4,608,191 |
|
$5,324,372 |
|
$9,449,829 |
|
$10,482,717 |
| |
|
|
|
|
|
|
|
|
| |
Basic |
$0.11 |
|
$0.13 |
|
$0.23 |
|
$0.27 |
| |
Diluted |
0.11 |
|
0.13 |
|
0.23 |
|
0.27 |
| |
|
|
|
|
|
|
|
|
| Dividends Declared per Common Share |
$0.15 |
|
$0.15 |
|
$0.30 |
|
$0.30 |
| |
|
|
|
|
|
|
|
|
|
|
|
|
|
|
Second Quarter FY 2013 Supplemental
of Monmouth Real Estate Investment Corp. Page 6 of 19
| Consolidated Statements of Cash Flows |
|
|
|
|
| (unaudited) |
|
|
|
|
| |
|
Six Months Ended |
| |
|
3/31/2013 |
|
3/31/2012 |
| CASH FLOWS FROM OPERATING ACTIVITIES |
|
|
|
|
| Net Income |
|
$13,350,488 |
|
$13,626,055 |
| Noncash Items Included in Net Income: |
|
|
|
|
| Depreciation |
|
6,402,300 |
|
5,615,773 |
| Amortization |
|
1,310,852 |
|
1,156,839 |
| Stock Compensation Expense |
|
161,089 |
|
126,696 |
| (Gain) on Securities Transactions, net |
|
(5,913,472) |
|
(4,997,715) |
| (Gain) Loss on Sale of Investment Property |
|
(345,794) |
|
8,220 |
| Changes In: |
|
|
|
|
| Tenant, Deferred Rent and Other Receivables |
|
(2,626,339) |
|
(406,291) |
| Prepaid Expenses |
|
(2,019,862) |
|
(717,706) |
| Other Assets and Lease Costs |
|
71,457 |
|
(174,042) |
| Accounts Payable, Accrued Expenses and Other Liabilities |
|
1,298,984 |
|
1,682,424 |
| NET CASH PROVIDED BY OPERATING ACTIVITIES |
|
11,689,703 |
|
15,920,253 |
| |
|
|
|
|
| CASH FLOWS FROM INVESTING ACTIVITIES |
|
|
|
|
| Purchase of Real Estate and Intangible Assets, net of deposits |
|
(42,363,385) |
|
(50,810,600) |
| Capital and Land Site Improvements |
|
(3,741,423) |
|
(1,672,864) |
| Proceeds on Sale of Investment Property, net |
|
1,413,891 |
|
2,553,507 |
| Deposits on Acquisition of Real Estate |
|
(1,800,000) |
|
(1,000,000) |
| Proceeds from Sale of Securities Available for Sale |
|
25,178,027 |
|
19,248,938 |
| Purchase of Securities Available for Sale |
|
(9,305,129) |
|
(11,826,052) |
| Collections on Loans Receivable |
|
11,221 |
|
68,069 |
| NET CASH USED IN INVESTING ACTIVITIES |
|
(30,606,798) |
|
(43,439,002) |
| |
|
|
|
|
| CASH FLOWS FROM FINANCING ACTIVITIES |
|
|
|
|
| Net Proceeds from (Repayments to) Loans Payable |
|
12,000,000 |
|
(8,360,950) |
| Repurchase of Subordinated Convertible Debentures |
|
(5,115,000) |
|
(125,000) |
| Proceeds from Mortgage Notes Payable |
|
35,000,000 |
|
49,233,000 |
| Principal Payments on Mortgage Notes Payable |
|
(21,591,284) |
|
(22,007,314) |
| Financing Costs Paid on Debt |
|
(519,521) |
|
(1,302,805) |
| Repayment of Employee Loan |
|
-0- |
|
688,724 |
| Net Distributions to Noncontrolling Interests |
|
(40,266) |
|
(40,267) |
| Proceeds from the Exercise of Stock Options |
|
-0- |
|
771,593 |
| Proceeds from Registered Direct Placement of Common Stock, |
|
|
|
|
| net of Offering Costs |
|
-0- |
|
16,189,700 |
| Proceeds from Issuance of Common Stock in the DRIP, net of Reinvestments |
|
8,160,817 |
|
10,074,648 |
| Preferred Dividends Paid |
|
(4,303,516) |
|
(2,039,610) |
| Common Dividends Paid, net of Reinvestments |
|
(9,194,538) |
|
(10,383,521) |
| NET CASH PROVIDED BY FINANCING ACTIVITIES |
|
14,396,692 |
|
32,698,198 |
| |
|
|
|
|
| NET INCREASE (DECREASE) IN CASH AND CASH EQUIVALENTS |
|
(4,520,403) |
|
5,179,449 |
| CASH AND CASH EQUIVALENTS - BEGINNING OF PERIOD |
|
24,650,858 |
|
6,376,808 |
| CASH AND CASH EQUIVALENTS - END OF PERIOD |
|
$20,130,455 |
|
$11,556,257 |
Second Quarter FY 2013 Supplemental
of Monmouth Real Estate Investment Corp. Page 7 of 19
|
Capital Structure and Leverage Ratios |
|
|
|
|
|
|
| (unaudited) |
|
|
|
|
|
|
| |
|
As of 3/31/2013 |
|
As of 3/31/2012 |
|
As of 9/30/2012 |
| Mortgage Notes Payable |
|
$251,352,627 |
|
$233,639,856 |
|
$237,943,911 |
| Loans Payable |
|
17,200,000 |
|
13,700,000 |
|
5,200,000 |
| Subordinated Convertible Debentures |
|
- |
|
8,790,000 |
|
8,615,000 |
| |
Total Debt |
|
268,552,627 |
|
256,129,856 |
|
251,758,911 |
| |
|
|
|
|
|
|
|
| Series A - 7.625% Cumulative Redeemable Preferred Stock |
|
53,493,750 |
|
53,493,750 |
|
53,493,750 |
| Series B - 7.875% Cumulative Redeemable Preferred Stock |
|
57,500,000 |
|
- |
|
57,500,000 |
| |
Total Preferred Stock |
|
110,993,750 |
|
53,493,750 |
|
110,993,750 |
| |
|
|
|
|
|
|
|
| Common Stock, Paid-in-Capital & Other |
|
216,906,373 |
|
212,339,117 |
|
204,693,389 |
| |
Total Shareholders' Equity |
|
327,900,123 |
|
265,832,867 |
|
315,687,139 |
| |
Total Book Capitalization |
|
596,452,750 |
|
521,962,723 |
|
567,446,050 |
| |
Accumulated Depreciation |
|
84,620,330 |
|
73,493,533 |
|
78,230,873 |
| |
Total Undepreciated Book Capitalization |
|
$681,073,080 |
|
$595,456,256 |
|
$645,676,923 |
| Shares Outstanding |
|
42,205,458 |
|
40,222,375 |
|
40,696,692 |
| Market Price Per Share |
|
$11.15 |
|
$9.74 |
|
$11.19 |
| Equity Market Capitalization |
|
$470,590,857 |
|
$391,765,933 |
|
$455,395,983 |
| Total Debt |
|
268,552,627 |
|
256,129,856 |
|
251,758,911 |
| Total Preferred Stock |
|
110,993,750 |
|
53,493,750 |
|
110,993,750 |
| |
Total Market Capitalization |
|
$850,137,234 |
|
$701,389,539 |
|
$818,148,644 |
| Total Debt |
|
$268,552,627 |
|
$256,129,856 |
|
$251,758,911 |
| less: Cash and Cash Equivalents |
|
20,130,455 |
|
11,556,257 |
|
24,650,858 |
| |
Net Debt |
|
$248,422,172 |
|
$244,573,599 |
|
$227,108,053 |
| Net Debt / Undepreciated Book Capitalization |
|
36.5% |
|
41.1% |
|
35.2% |
| Net Debt / Total Market Capitalization |
|
29.3% |
|
34.9% |
|
27.8% |
| Net Debt + Preferred / Total Market Capitalization |
|
42.3% |
|
42.5% |
|
41.3% |
| |
|
|
|
|
|
| |
|
|
Three Months Ended |
|
Fiscal Year Ended |
| |
|
|
3/31/2013 |
|
3/31/2012 |
|
9/30/2012 |
| Net Income |
|
$7,643,911 |
|
$8,260,032 |
|
$18,684,495 |
| plus: Depreciation & Amortization (includes Discontinued Operations) |
3,898,340 |
|
3,358,499 |
|
13,910,385 |
| plus: Interest Expense |
|
3,842,634 |
|
3,779,879 |
|
15,352,499 |
| plus: Acquisition Costs |
|
- |
|
261,382 |
|
667,799 |
| less: Gain On Securities Transactions, net |
|
(3,802,704) |
|
(2,209,257) |
|
(6,044,065) |
| less: (Loss) on Sale of Investment Property |
|
(345,794) |
|
- |
|
- |
| |
EBITDA |
|
$11,236,387 |
|
$13,450,535 |
|
$42,571,113 |
| Interest Expense |
|
$3,842,634 |
|
$3,779,879 |
|
$15,352,499 |
| Preferred Dividends Paid |
|
2,151,758 |
|
1,019,805 |
|
5,135,782 |
| |
Total Fixed Charges |
|
$5,994,392 |
|
$4,799,684 |
|
$20,488,281 |
| Interest Coverage |
|
2.9 x |
|
3.6 x |
|
2.8 x |
| Fixed Charge Coverage |
|
1.9 x |
|
2.8 x |
|
2.1 x |
| Total Debt |
|
$268,552,627 |
|
$256,129,856 |
|
$251,758,911 |
| Annualized EBITDA |
|
44,945,548 |
|
53,802,140 |
|
42,571,113 |
| Total Debt / EBITDA |
|
6.0 x |
|
4.8 x |
|
5.9 x |
Second Quarter FY 2013 Supplemental
of Monmouth Real Estate Investment Corp. Page 8 of 19
| |
|
|
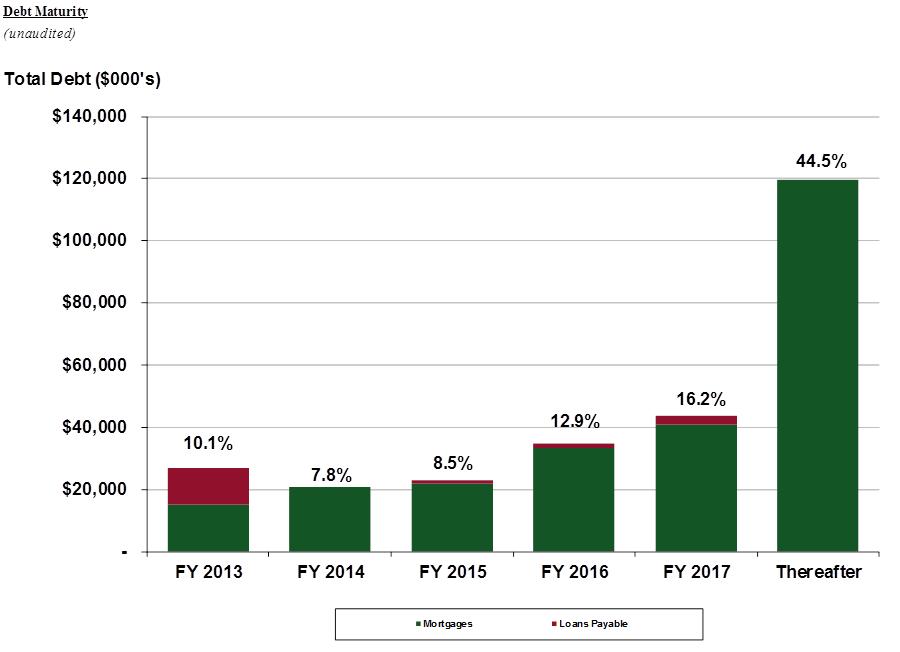
Loans |
|
% of |
| FY Year |
|
Mortgages |
Payable (1) |
Total |
Total |
| |
|
|
|
|
|
| 2013 |
|
15,016,820 |
12,000,000 |
27,016,820 |
10.1% |
| 2014 |
|
20,818,049 |
- |
20,818,049 |
7.8% |
| 2015 |
|
21,835,789 |
1,012,039 |
22,847,828 |
8.5% |
| 2016 |
|
33,400,263 |
1,270,162 |
34,670,425 |
12.9% |
| 2017 |
|
40,721,489 |
2,917,799 |
43,639,288 |
16.2% |
| Thereafter |
|
119,560,217 |
- |
119,560,217 |
44.5% |
| |
|
|
|
|
|
| Total as of 3/31/2013 |
|
$251,352,627 |
$17,200,000 |
$268,552,627 |
100.0% |
| |
|
|
|
|
|
|
Second Quarter FY 2013 Supplemental
of Monmouth Real Estate Investment Corp. Page 9 of 19
| Property Table by Tenant |
|
|
|
|
|
|
|
|
|
|
|
|
| (unaudited) |
|
|
|
Occupied |
|
|
|
|
|
|
|
|
| |
|
Property |
Square |
Square |
% of Total |
Annual |
% of Total |
Rent Per |
|
Undepreciated |
|
Mortgage |
| Tenant |
|
Count |
Footage |
Footage |
Sq. Ft. |
Rent |
Ann. Rent |
Sq. Ft. Occup. |
|
Cost |
|
Balance |
| |
|
|
|
|
|
|
|
|
|
|
|
|
| |
|
|
|
|
|
|
|
|
|
|
|
|
| FedEx Ground |
|
22 |
2,358,295 |
2,358,295 |
25.7% |
$17,765,000 |
37.5% |
$7.53 |
|
$215,046,507 |
|
$92,136,205 |
| FedEx Express |
|
14 |
973,413 |
973,413 |
10.6% |
5,451,000 |
11.5% |
5.60 |
|
70,346,990 |
|
25,905,216 |
| FedEx Supply Chain Services |
|
1 |
449,900 |
449,900 |
4.9% |
1,305,000 |
2.8% |
2.90 |
|
14,600,000 |
|
9,154,332 |
| Total FedEx |
|
37 |
3,781,608 |
3,781,608 |
41.3% |
24,521,000 |
51.7% |
6.48 |
|
299,993,497 |
|
127,195,753 |
| |
|
|
|
|
|
|
|
|
|
|
|
|
| Milwauke Tool |
|
1 |
615,305 |
615,305 |
6.7% |
1,923,000 |
4.1% |
3.13 |
|
27,368,816 |
|
17,018,351 |
| Woodstream |
|
1 |
388,671 |
256,000 |
2.8% |
896,000 |
1.9% |
3.50 |
|
13,116,870 |
|
2,646,926 |
| CBOCS Distribution, Inc. |
|
1 |
381,240 |
381,240 |
4.2% |
1,381,000 |
2.9% |
3.62 |
|
14,215,126 |
|
8,287,882 |
| Best Buy Warehousing Logistics, Inc. |
|
1 |
368,060 |
368,060 |
4.0% |
1,595,000 |
3.4% |
4.33 |
|
19,600,000 |
|
12,167,250 |
| Coca Cola / Western Container |
|
2 |
323,358 |
323,358 |
3.5% |
1,566,000 |
3.3% |
4.84 |
|
18,839,339 |
|
9,881,137 |
| Norton McNaughton of Squire, Inc. |
|
1 |
306,000 |
306,000 |
3.3% |
1,389,000 |
2.9% |
4.54 |
|
12,972,474 |
|
6,674,881 |
| Various |
|
2 |
265,480 |
230,605 |
2.5% |
907,000 |
1.9% |
3.93 |
|
4,407,744 |
|
- |
| Carrier Sales |
|
2 |
244,317 |
244,317 |
2.7% |
1,853,000 |
3.9% |
7.58 |
|
22,451,041 |
|
11,606,376 |
| Anda Pharmaceuticals, Inc |
|
1 |
234,660 |
234,660 |
2.6% |
1,182,000 |
2.5% |
5.04 |
|
14,550,000 |
|
10,571,407 |
| Caterpillar Logistics Services, Inc. |
|
1 |
218,120 |
218,120 |
2.4% |
1,169,000 |
2.5% |
5.36 |
|
14,868,857 |
|
8,036,374 |
| Anheuser-Busch, Inc. |
|
1 |
184,800 |
184,800 |
2.0% |
778,000 |
1.6% |
4.21 |
|
12,386,675 |
|
3,321,353 |
| Carlisle Tire & Wheel Company |
|
1 |
179,280 |
179,280 |
2.0% |
728,000 |
1.5% |
4.06 |
|
7,025,401 |
|
1,988,419 |
| Home Depot USA, Inc. |
|
1 |
171,200 |
171,200 |
1.9% |
889,000 |
1.9% |
5.19 |
|
11,298,367 |
|
- |
| Kellogg Company |
|
3 |
170,279 |
170,279 |
1.9% |
1,061,000 |
2.2% |
6.23 |
|
11,834,916 |
|
3,472,522 |
| Maidenform, Inc. |
|
1 |
148,000 |
148,000 |
1.6% |
444,000 |
0.9% |
3.00 |
|
4,870,749 |
|
3,354,210 |
| H.E.P. Direct |
|
1 |
106,507 |
106,507 |
1.2% |
288,000 |
0.6% |
2.70 |
|
6,913,986 |
|
- |
| Pittsburgh Glass Works |
|
1 |
102,135 |
102,135 |
1.1% |
427,000 |
0.9% |
4.18 |
|
3,900,602 |
|
- |
| National Oilwell |
|
1 |
91,295 |
91,295 |
1.0% |
733,000 |
1.5% |
8.03 |
|
8,080,828 |
|
4,435,044 |
| Joseph T. Ryerson |
|
1 |
89,052 |
89,052 |
1.0% |
506,000 |
1.1% |
5.68 |
|
6,867,596 |
|
1,941,705 |
| DHL |
|
1 |
83,000 |
83,000 |
0.9% |
639,000 |
1.3% |
7.70 |
|
6,815,697 |
|
3,493,991 |
| Sherwin-Williams Company |
|
2 |
78,887 |
78,887 |
0.9% |
631,000 |
1.3% |
8.00 |
|
7,103,762 |
|
1,912,857 |
| RGH Enterprises Inc. |
|
1 |
75,000 |
75,000 |
0.8% |
579,000 |
1.2% |
7.72 |
|
5,525,600 |
|
4,115,250 |
| Tampa Bay Grand Prix |
|
1 |
68,385 |
68,385 |
0.7% |
262,000 |
0.6% |
3.83 |
|
5,616,874 |
|
2,476,121 |
| Macy’s East, Inc. |
|
1 |
59,400 |
59,400 |
0.6% |
230,000 |
0.5% |
3.87 |
|
4,838,592 |
|
2,380,519 |
| Siemens |
|
1 |
51,130 |
51,130 |
0.6% |
456,000 |
1.0% |
8.92 |
|
4,416,000 |
|
2,930,259 |
| Keystone Automotive |
|
1 |
36,270 |
36,270 |
0.4% |
136,000 |
0.3% |
3.75 |
|
2,161,895 |
|
- |
| Graybar Electric Company |
|
1 |
26,340 |
26,340 |
0.3% |
109,000 |
0.2% |
4.14 |
|
1,850,794 |
|
- |
| Tenant Total as of 3/31/2013 |
|
70 |
8,847,779 |
8,680,233 |
94.7% |
$47,278,000 |
99.7% |
$5.45 |
|
$573,892,098 |
|
$249,908,587 |
| |
|
|
|
|
|
|
|
|
|
|
|
|
| Vacant |
|
3 |
317,625 |
- |
5.3% |
119,000 (A) |
0.3% |
0.53 |
|
17,991,447 |
|
1,444,040 |
| |
|
|
|
|
|
|
|
|
|
|
|
|
| Total as of 3/31/2013 |
|
73 |
9,165,404 |
8,680,233 |
100.0% |
$47,397,000 |
100.0% |
$5.46 |
|
$591,883,545 (B) |
|
$251,352,627 |
| |
|
|
|
|
|
|
|
|
|
|
|
|
| (A) | Includes rental revenue from properties during Fiscal 2013 prior to becoming vacant. |
| (B) | Does not include $32,351 of vacant land and corporate office leasehold improvements not associated
with a specific tenant. |
Second Quarter FY 2013 Supplemental
of Monmouth Real Estate Investment Corp. Page 10 of 19
|
Property Table by State |
|
|
|
|
|
|
|
|
|
|
|
|
| (unaudited) |
|
|
|
|
|
|
|
|
|
|
|
|
| |
|
Property |
Square |
Occupied Square |
% of Total |
Annual |
% of Total |
Rent Per |
|
Undepreciated |
|
Mortgage |
| State |
|
Count |
Footage |
Footage |
Sq. Ft. |
Rent |
Ann. Rent |
Sq. Ft. Occup. |
|
Cost |
|
Balance |
| |
|
|
|
|
|
|
|
|
|
|
|
|
| Mississippi |
|
4 |
912,305 |
912,305 |
10.0% |
$3,354,000 |
7.1% |
$3.68 |
|
$45,247,611 |
|
$27,589,757 |
| Tennessee |
|
3 |
891,777 |
891,777 |
9.7% |
2,998,000 |
6.3% |
3.36 |
|
33,614,166 |
|
19,720,680 |
| Florida |
|
9 |
784,677 |
784,677 |
8.6% |
5,081,000 |
10.7% |
6.48 |
|
67,116,257 |
|
33,201,414 |
| Illinois |
|
7 |
720,439 |
720,439 |
7.9% |
4,705,000 |
9.9% |
6.53 |
|
61,161,692 |
|
11,761,158 |
| Ohio |
|
5 |
684,762 |
684,762 |
7.5% |
3,629,000 |
7.7% |
5.30 |
|
43,906,299 |
|
25,365,907 |
| Missouri |
|
4 |
654,073 |
423,202 |
7.1% |
1,673,000 |
3.5% |
3.95 |
|
29,110,344 |
|
5,344,226 |
| Texas |
|
6 |
629,895 |
629,895 |
6.9% |
4,659,000 |
9.8% |
7.40 |
|
54,757,073 |
|
32,030,004 |
| South Carolina |
|
3 |
510,560 |
510,560 |
5.6% |
3,088,000 |
6.5% |
6.05 |
|
33,413,400 |
|
12,305,944 |
| Michigan |
|
3 |
437,417 |
437,417 |
4.8% |
2,847,000 |
6.0% |
6.51 |
|
37,365,647 |
|
22,347,582 |
| North Carolina |
|
3 |
414,507 |
254,507 |
4.5% |
779,000 |
1.6% |
3.06 |
|
17,274,557 |
|
4,798,251 |
| Georgia |
|
3 |
307,662 |
307,662 |
3.4% |
1,767,000 |
3.7% |
5.74 |
|
22,124,663 |
|
10,528,469 |
| Virginia |
|
4 |
303,863 |
303,863 |
3.3% |
1,815,000 |
3.8% |
5.97 |
|
23,588,938 |
|
5,321,616 |
| Arizona |
|
1 |
283,358 |
283,358 |
3.1% |
1,234,000 |
2.6% |
4.35 |
|
15,159,496 |
|
7,781,031 |
| New York |
|
3 |
230,381 |
230,381 |
2.5% |
1,898,000 |
4.0% |
8.24 |
|
20,148,376 |
|
5,411,422 |
| Kansas |
|
2 |
219,280 |
219,280 |
2.4% |
1,060,000 |
2.2% |
4.83 |
|
10,705,244 |
|
4,088,527 |
| Pennsylvania |
|
1 |
201,342 |
201,342 |
2.2% |
595,000 |
1.3% |
2.96 |
|
3,031,531 |
|
- |
| Maryland |
|
1 |
144,523 |
144,523 |
1.6% |
1,426,000 |
3.0% |
9.87 |
|
14,386,784 |
|
7,268,589 |
| Wisconsin |
|
1 |
139,564 |
139,564 |
1.5% |
901,000 |
1.9% |
6.46 |
|
9,373,672 |
|
1,368,371 |
| Colorado |
|
2 |
138,235 |
138,235 |
1.5% |
1,208,000 |
2.5% |
8.74 |
|
13,549,167 |
|
4,234,814 |
| New Jersey |
|
2 |
123,538 |
88,663 |
1.3% |
542,000 |
1.1% |
6.11 |
|
6,214,805 |
|
2,380,519 |
| Oklahoma |
|
1 |
119,912 |
119,912 |
1.3% |
706,000 |
1.5% |
5.89 |
|
9,437,733 |
|
5,933,699 |
| Nebraska |
|
1 |
89,115 |
89,115 |
1.0% |
454,000 |
1.0% |
5.09 |
|
5,732,599 |
|
360,063 |
| Alabama |
|
1 |
73,712 |
73,712 |
0.8% |
412,000 |
0.9% |
5.59 |
|
4,748,646 |
|
1,435,364 |
| Minnesota |
|
1 |
59,425 |
- |
0.6% |
72,000 |
0.2% |
- |
|
5,157,126 |
|
- |
| Connecticut |
|
1 |
54,812 |
54,812 |
0.6% |
358,000 |
0.8% |
6.53 |
|
3,395,824 |
|
775,220 |
| Iowa |
|
1 |
36,270 |
36,270 |
0.4% |
136,000 |
0.3% |
3.75 |
|
2,161,895 |
|
- |
| |
|
|
|
|
|
|
|
|
|
|
|
|
| Total as of 3/31/2013 |
|
73 |
9,165,404 |
8,680,233 |
100.0% |
$47,397,000 |
100.0% |
$5.46 |
|
$591,883,545 |
|
$251,352,627 |
| |
|
|
|
|
|
|
|
|
|
|
|
|
|
Second Quarter FY 2013 Supplemental
of Monmouth Real Estate Investment Corp. Page 11 of 19
| Lease Expirations |
|
|
|
|
|
|
|
|
|
|
|
|
| (unaudited) |
|
|
|
|
|
|
|
|
|
|
|
|
| |
|
Property |
Square |
% of Total |
Annual |
% of Total |
Rent Per |
Lease Exp. |
|
Undepreciated |
|
Mortgage |
| Fiscal Year |
|
Count |
Footage |
Sq. Ft. |
Rent |
Ann. Rent |
Sq. Ft. Occup. |
Term |
|
Cost |
|
Balance |
| |
|
|
|
|
|
|
|
|
|
|
|
|
| 2014 |
|
5 |
348,612 |
3.8% |
1,525,000 |
3.2% |
4.37 |
0.9 Yrs |
|
18,273,882 |
|
6,509,951 |
| 2015 |
|
7 |
836,256 |
9.1% |
4,300,000 |
9.1% |
5.14 |
2.1 Yrs |
|
47,485,773 |
|
13,867,646 |
| 2016 |
|
2 |
244,800 |
2.7% |
1,082,000 |
2.3% |
4.42 |
3.2 Yrs |
|
17,097,717 |
|
4,774,514 |
| 2017 |
|
15 |
1,974,950 |
21.5% |
11,287,000 |
23.8% |
6.13 |
4.1 Yrs |
|
145,796,266 |
|
57,732,558 |
| 2018 |
|
11 |
1,005,328 |
11.0% |
6,350,000 |
13.4% |
6.32 |
5.1 Yrs |
|
76,680,756 |
|
28,805,569 |
| 2019 |
|
8 |
1,196,114 |
13.1% |
7,345,000 |
15.5% |
6.14 |
6.1 Yrs |
|
86,252,433 |
|
38,468,373 |
| 2020 |
|
1 |
68,385 |
0.7% |
262,000 |
0.6% |
3.83 |
7.5 Yrs |
|
5,616,874 |
|
2,476,121 |
| 2021 |
|
4 |
271,768 |
3.0% |
1,752,000 |
3.7% |
6.45 |
8.4 Yrs |
|
20,341,956 |
|
12,189,050 |
| 2022 |
|
8 |
1,237,238 |
13.5% |
7,058,000 |
14.9% |
5.70 |
9.0 Yrs |
|
84,375,807 |
|
53,703,710 |
| 2023 |
|
4 |
862,106 |
9.4% |
3,105,000 |
6.6% |
3.60 |
10.1 Yrs |
|
42,075,165 |
|
20,906,291 |
| 2024 |
|
3 |
536,742 |
5.9% |
2,305,000 |
4.9% |
4.29 |
11.1 Yrs |
|
25,487,725 |
|
10,474,804 |
| |
|
|
|
|
|
|
|
|
|
|
|
|
| Various |
|
2 |
265,480 |
2.9% |
907,000 |
1.9% |
3.93 |
- |
|
4,407,744 |
|
- |
| Vacant |
|
3 |
317,625 |
3.5% |
119,000 |
0.3% |
- |
- |
|
17,991,447 |
|
1,444,040 |
| |
|
|
|
|
|
|
|
|
|
|
|
|
| Total as of 3/31/2013 |
|
73 |
9,165,404 |
100.0% |
$47,397,000 |
100.0% |
$5.46 |
6.1 Yrs |
|
$591,883,545 |
|
$251,352,627 |
| |
|
|
|
|
|
|
|
|
|
|
|
|
Second Quarter FY 2013 Supplemental
of Monmouth Real Estate Investment Corp. Page 12 of 19
| Property Table |
|
|
|
|
|
|
|
|
|
|
|
|
|
|
| (unaudited) |
|
|
|
|
|
|
|
|
|
|
|
|
|
|
| |
|
|
|
|
|
Fiscal Year |
|
Square |
Annual |
Rent Per |
Lease Exp. |
|
Undepreciated |
|
Mortgage |
|
| No |
Tenant |
City |
State |
|
Acquisition |
Occup. |
Footage |
Rent |
Sq. Ft. Occup. |
Term |
|
Cost |
|
Balance |
|
| |
|
|
|
|
|
|
|
|
|
|
|
|
|
|
|
| 1 |
Milwauke Tool |
Olive Branch |
MS |
|
2013 |
100.0% |
615,305 |
$1,923,000 |
$3.13 |
10.1 Yrs |
|
$27,368,816 |
|
$17,018,351 |
|
| 2 |
FedEx Supply Chain Services, Inc. |
Memphis |
TN |
|
2010 |
100.0% |
449,900 |
1,305,000 |
2.90 |
6.2 Yrs |
|
14,600,000 |
|
9,154,332 |
|
| 3 |
Woodstream |
St. Joseph |
MO |
|
2001 |
65.9% |
388,671 |
896,000 |
3.50 |
4.5 Yrs |
|
13,116,870 |
|
2,646,926 |
|
| 4 |
CBOCS Distribution, Inc. |
Lebanon |
TN |
|
2011 |
100.0% |
381,240 |
1,381,000 |
3.62 |
11.3 Yrs |
|
14,215,126 |
|
8,287,882 |
|
| 5 |
Best Buy Warehousing Logistics, Inc. |
Streetsboro |
OH |
|
2012 |
100.0% |
368,060 |
1,595,000 |
4.33 |
8.8 Yrs |
|
19,600,000 |
|
12,167,250 |
|
| 6 |
Norton McNaughton of Squire, Inc. |
Hanahan |
SC |
|
2005 |
100.0% |
306,000 |
1,389,000 |
4.54 |
2.1 Yrs |
|
12,972,474 |
|
6,674,881 |
|
| 7 |
Various |
Monaca |
PA |
|
1997 |
100.0% |
201,342 |
595,000 |
2.96 |
na |
|
3,031,531 |
|
- |
|
| 8 |
Western Container Corp |
Tolleson |
AZ |
|
2003 |
100.0% |
283,358 |
1,234,000 |
4.35 |
4.1 Yrs |
|
15,159,496 |
|
7,781,031 |
|
| 9 |
Anda Pharmaceuticals, Inc |
Olive Branch |
MS |
|
2012 |
100.0% |
234,660 |
1,182,000 |
5.04 |
9.2 Yrs |
|
14,550,000 |
|
10,571,407 |
|
| 10 |
Caterpillar Logistics Services, Inc. |
Griffin |
GA |
|
2006 |
100.0% |
218,120 |
1,169,000 |
5.36 |
3.7 Yrs |
|
14,868,857 |
|
8,036,374 |
|
| 11 |
FedEx Ground Package System, Inc. |
Orion |
MI |
|
2007 |
100.0% |
193,479 |
1,285,000 |
6.64 |
4.3 Yrs |
|
19,182,035 |
|
10,245,219 |
|
| 12 |
Anheuser-Busch, Inc. |
Granite City |
IL |
|
2001 |
100.0% |
184,800 |
778,000 |
4.21 |
3.2 Yrs |
|
12,386,675 |
|
3,321,353 |
|
| 13 |
Carrier Sales |
Dallas |
TX |
|
2010 |
100.0% |
184,317 |
1,549,000 |
8.40 |
5.8 Yrs |
|
17,740,000 |
|
10,153,215 |
|
| 14 |
Carlisle Tire & Wheel Company |
Edwardsville |
KS |
|
2003 |
100.0% |
179,280 |
728,000 |
4.06 |
5.2 Yrs |
|
7,025,401 |
|
1,988,419 |
|
| 15 |
Fedex Ground Package System. Inc |
Livonia |
MI |
|
2013 |
100.0% |
172,005 |
1,192,000 |
6.93 |
9.0 Yrs |
|
13,700,000 |
|
9,376,990 |
|
| 16 |
Home Depot USA, Inc. |
Montgomery |
IL |
|
2007 |
100.0% |
171,200 |
889,000 |
5.19 |
2.2 Yrs |
|
11,298,367 |
|
- |
|
| 17 |
FedEx Ground Package System, Inc. |
Tampa |
FL |
|
2004 |
100.0% |
170,779 |
1,412,000 |
8.27 |
5.8 Yrs |
|
17,723,825 |
|
8,845,677 |
|
| 18 |
Vacant |
Monroe |
NC |
|
2001 |
- |
160,000 |
47,000 |
na |
- |
|
5,489,822 |
|
1,444,041 |
|
| 19 |
Maidenform, Inc. |
Fayetteville |
NC |
|
1997 |
100.0% |
148,000 |
444,000 |
3.00 |
0.8 Yrs |
|
4,870,749 |
|
3,354,210 |
|
| 20 |
FedEx Ground Package System, Inc. |
Beltsville |
MD |
|
2001 |
100.0% |
144,523 |
1,426,000 |
9.87 |
5.3 Yrs |
|
14,386,784 |
|
7,268,589 |
|
| 21 |
FedEx Ground Package System, Inc. |
Cudahy |
WI |
|
2001 |
100.0% |
139,564 |
901,000 |
6.46 |
4.3 Yrs |
|
9,373,672 |
|
1,368,371 |
|
| 22 |
FedEx Ground Package System, Inc. |
Wheeling |
IL |
|
2007 |
100.0% |
123,000 |
1,386,000 |
11.27 |
4.2 Yrs |
|
18,537,652 |
|
4,585,244 |
|
| 23 |
FedEx Ground Package System, Inc. |
Oklahoma City |
OK |
|
2012 |
100.0% |
119,912 |
706,000 |
5.89 |
9.0 Yrs |
|
9,437,733 |
|
5,933,699 |
|
| 24 |
FedEx Ground Package System, Inc. |
Edinburg |
TX |
|
2011 |
100.0% |
113,582 |
598,000 |
5.26 |
8.4 Yrs |
|
7,414,000 |
|
4,437,390 |
|
| 25 |
FedEx Corporation |
Richmond |
VA |
|
2007 |
100.0% |
112,799 |
543,000 |
4.81 |
10.1 Yrs |
|
7,718,163 |
|
- |
|
| 26 |
FedEx Ground Package System, Inc. |
Ft. Mill |
SC |
|
2010 |
100.0% |
112,784 |
1,024,000 |
9.08 |
6.5 Yrs |
|
12,834,256 |
|
3,666,346 |
|
| 27 |
FedEx Corporation |
Orlando |
FL |
|
2008 |
100.0% |
110,638 |
666,000 |
6.02 |
4.7 Yrs |
|
8,492,904 |
|
5,080,426 |
|
| 28 |
H.E.P. Direct |
Winston-Salem |
NC |
|
2002 |
100.0% |
106,507 |
288,000 |
2.70 |
4.8 Yrs |
|
6,913,986 |
|
- |
|
| 29 |
FedEx Ground Package System, Inc. |
Cheektowaga |
NY |
|
2007 |
100.0% |
104,981 |
966,000 |
9.20 |
6.4 Yrs |
|
10,932,057 |
|
1,296,172 |
|
| 30 |
FedEx Ground Package System, Inc. |
West Chester Twp |
OH |
|
2000 |
100.0% |
103,818 |
518,000 |
4.99 |
10.4 Yrs |
|
5,061,253 |
|
2,824,987 |
|
| 31 |
Fedex Ground Package System. Inc |
Waco |
TX |
|
2012 |
100.0% |
102,594 |
659,000 |
6.42 |
9.2 Yrs |
|
8,733,000 |
|
5,668,706 |
|
| 32 |
Pittsburgh Glass Works |
O' Fallon |
MO |
|
1994 |
100.0% |
102,135 |
427,000 |
4.18 |
2.2 Yrs |
|
3,900,602 |
|
- |
|
| 33 |
Vacant |
Liberty |
MO |
|
1998 |
- |
98,200 |
- |
na |
- |
|
7,344,498 |
|
- |
|
| 34 |
FedEx Corporation |
Jacksonville |
FL |
|
1999 |
100.0% |
95,883 |
524,000 |
5.46 |
6.2 Yrs |
|
6,155,500 |
|
2,422,371 |
|
| 35 |
FedEx Corporation |
Tampa |
FL |
|
2006 |
100.0% |
95,662 |
603,000 |
6.30 |
4.5 Yrs |
|
7,565,717 |
|
4,658,580 |
|
| 36 |
FedEx Ground Package System, Inc. |
El Paso |
TX |
|
2007 |
100.0% |
91,854 |
668,000 |
7.27 |
2.5 Yrs |
|
8,024,745 |
|
4,409,469 |
|
| 37 |
FedEx Ground Package System, Inc. |
Hanahan |
SC |
|
2005 |
100.0% |
91,776 |
675,000 |
7.35 |
5.3 Yrs |
|
7,606,670 |
|
1,964,717 |
|
| 38 |
National Oilwell |
Houston |
TX |
|
2010 |
100.0% |
91,295 |
733,000 |
8.03 |
9.5 Yrs |
|
8,080,828 |
|
4,435,044 |
|
| 39 |
FedEx Corporation |
Omaha |
NE |
|
1999 |
100.0% |
89,115 |
454,000 |
5.09 |
10.6 Yrs |
|
5,732,599 |
|
360,063 |
|
| 40 |
FedEx Ground Package System, Inc. |
Cocoa |
FL |
|
2008 |
100.0% |
89,101 |
739,000 |
8.29 |
3.6 Yrs |
|
10,521,455 |
|
6,037,408 |
|
| 41 |
Joseph T. Ryerson |
Elgin |
IL |
|
2002 |
100.0% |
89,052 |
506,000 |
5.68 |
3.8 Yrs |
|
6,867,596 |
|
1,941,705 |
|
| 42 |
FedEx Ground Package System, Inc. |
Ft. Myers |
FL |
|
2003 |
100.0% |
87,500 |
416,000 |
4.75 |
1.6 Yrs |
|
4,977,449 |
|
- |
|
| 43 |
DHL |
Roanoke |
VA |
|
2007 |
100.0% |
83,000 |
639,000 |
7.70 |
3.7 Yrs |
|
6,815,697 |
|
3,493,991 |
|
| 44 |
FedEx Corporation |
Bedford Heights |
OH |
|
2007 |
100.0% |
82,269 |
415,000 |
5.04 |
5.4 Yrs |
|
6,620,313 |
|
3,261,689 |
|
| 45 |
FedEx Ground Package System, Inc. |
Richfield |
OH |
|
2006 |
100.0% |
79,485 |
645,000 |
8.11 |
3.6 Yrs |
|
8,208,733 |
|
4,181,723 |
|
| 46 |
RGH Enterprises Inc. |
Halfmoon |
NY |
|
2012 |
100.0% |
75,000 |
579,000 |
7.72 |
8.7 Yrs |
|
5,525,600 |
|
4,115,250 |
|
| 47 |
FedEx Ground Package System, Inc. |
Huntsville |
AL |
|
2005 |
100.0% |
73,712 |
412,000 |
5.59 |
9.4 Yrs |
|
4,748,646 |
|
1,435,364 |
|
| 48 |
FedEx Corporation |
Schaumburg |
IL |
|
1997 |
100.0% |
73,500 |
515,000 |
7.01 |
4.0 Yrs |
|
4,967,639 |
|
- |
|
| |
|
|
|
|
|
|
|
|
|
|
|
|
|
|
|
|
|
|
|
|
|
|
|
|
|
|
|
|
|
Second Quarter FY 2013 Supplemental
of Monmouth Real Estate Investment Corp. Page 13 of 19
| Property Table |
|
|
|
|
|
|
|
|
|
|
|
|
|
|
| (unaudited) |
|
|
|
|
|
|
|
|
|
|
|
|
|
|
| |
|
|
|
|
Fiscal Year |
|
Square |
Annual |
Rent Per |
Lease Exp. |
|
Undepreciated |
|
Mortgage |
|
| No |
Tenant |
City |
State |
|
Acquisition |
Occup. |
Footage |
Rent |
Sq. Ft. Occup. |
Term |
|
Cost |
|
Balance |
|
| |
|
|
|
|
|
|
|
|
|
|
|
|
|
|
|
| 49 |
FedEx Corporation |
Romulus |
MI |
|
1998 |
100.0% |
71,933 |
$370,000 |
$5.14 |
8.2 Yrs |
|
$4,483,613 |
|
$2,725,373 |
|
| 50 |
FedEx Ground Package System, Inc. |
Denver |
CO |
|
2005 |
100.0% |
69,865 |
564,000 |
8.07 |
5.3 Yrs |
|
6,354,051 |
|
2,017,357 |
|
| 51 |
Tampa Bay Grand Prix |
Tampa |
FL |
|
2007 |
100.0% |
68,385 |
262,000 |
3.83 |
7.5 Yrs |
|
5,616,874 |
|
2,476,121 |
|
| 52 |
FedEx Ground Package System, Inc. |
Colorado Springs |
CO |
|
2006 |
100.0% |
68,370 |
644,000 |
9.42 |
5.5 Yrs |
|
7,195,115 |
|
2,217,457 |
|
| 53 |
Sherwin-Williams Company |
Rockford |
IL |
|
2011 |
100.0% |
66,387 |
470,000 |
7.08 |
10.8 Yrs |
|
5,540,000 |
|
1,826,860 |
|
| 54 |
Kellogg Sales Company |
Kansas City |
MO |
|
2007 |
100.0% |
65,067 |
350,000 |
5.38 |
2.3 Yrs |
|
4,748,374 |
|
2,697,299 |
|
| 55 |
Various |
Somerset |
NJ |
|
1970 |
45.6% |
64,138 |
312,000 |
10.66 |
na |
|
1,376,213 |
|
- |
|
| 56 |
FedEx Corporation |
Chattanooga |
TN |
|
2007 |
100.0% |
60,637 |
312,000 |
5.15 |
4.6 Yrs |
|
4,799,040 |
|
2,278,466 |
|
| 57 |
Carrier Sales |
Richmond |
VA |
|
2001 |
100.0% |
60,000 |
304,000 |
5.07 |
3.2 Yrs |
|
4,711,041 |
|
1,453,161 |
|
| 58 |
Vacant |
White Bear Lake |
MN |
|
2007 |
- |
59,425 |
72,000 |
na |
- |
|
5,157,126 |
|
- |
|
| 59 |
Macy’s East, Inc. |
Carlstadt |
NJ |
|
2007 |
100.0% |
59,400 |
230,000 |
3.87 |
1.0 Yrs |
|
4,838,592 |
|
2,380,519 |
|
| 60 |
FedEx Ground Package System, Inc. |
Augusta |
GA |
|
2005 |
100.0% |
59,358 |
477,000 |
8.04 |
5.3 Yrs |
|
5,328,874 |
|
1,429,142 |
|
| 61 |
Keebler Company |
Newington |
CT |
|
2001 |
100.0% |
54,812 |
358,000 |
6.53 |
0.9 Yrs |
|
3,395,824 |
|
775,220 |
|
| 62 |
Siemens |
Lebanon |
OH |
|
2012 |
100.0% |
51,130 |
456,000 |
8.92 |
6.1 Yrs |
|
4,416,000 |
|
2,930,259 |
|
| 63 |
Keebler Company |
Orangeburg |
NY |
|
1993 |
100.0% |
50,400 |
353,000 |
7.00 |
0.9 Yrs |
|
3,690,718 |
|
- |
|
| 64 |
FedEx Corporation |
Charlottesville |
VA |
|
1999 |
100.0% |
48,064 |
329,000 |
6.85 |
4.4 Yrs |
|
4,344,037 |
|
374,464 |
|
| 65 |
FedEx Ground Package System, Inc. |
Corpus Christi |
TX |
|
2012 |
100.0% |
46,253 |
452,000 |
9.77 |
8.4 Yrs |
|
4,764,500 |
|
2,926,180 |
|
| 66 |
Coca Cola Enterprises, Inc. |
Topeka |
KS |
|
2009 |
100.0% |
40,000 |
332,000 |
8.30 |
8.5 Yrs |
|
3,679,843 |
|
2,100,108 |
|
| 67 |
Keystone Automotive |
Urbandale |
IA |
|
1994 |
100.0% |
36,270 |
136,000 |
3.75 |
4.0 Yrs |
|
2,161,895 |
|
- |
|
| 68 |
FedEx Corporation |
Richland |
MS |
|
1994 |
100.0% |
36,000 |
140,000 |
3.89 |
1.0 Yrs |
|
1,478,000 |
|
- |
|
| 69 |
FedEx Corporation |
Punta Gorda |
FL |
|
2007 |
100.0% |
34,624 |
304,000 |
8.78 |
4.3 Yrs |
|
4,104,915 |
|
2,381,522 |
|
| 70 |
FedEx Corporation |
Lakeland |
FL |
|
2007 |
100.0% |
32,105 |
155,000 |
4.83 |
4.7 Yrs |
|
1,957,618 |
|
1,299,308 |
|
| 71 |
FedEx Corporation |
Augusta |
GA |
|
2007 |
100.0% |
30,184 |
121,000 |
4.01 |
9.7 Yrs |
|
1,926,932 |
|
1,062,954 |
|
| 72 |
Graybar Electric Company |
Jackson |
MS |
|
1993 |
100.0% |
26,340 |
109,000 |
4.14 |
6.3 Yrs |
|
1,850,794 |
|
- |
|
| 73 |
Sherwin-Williams Company |
Burr Ridge |
IL |
|
1997 |
100.0% |
12,500 |
161,000 |
12.88 |
1.6 Yrs |
|
1,563,765 |
|
85,995 |
|
| |
Total as of 3/31/2013 |
|
|
|
|
94.7% |
9,165,404 |
$47,397,000 |
$5.46 |
6.1 Yrs |
|
$591,883,545 |
|
$251,352,627 |
|
| |
|
|
|
|
|
|
|
|
|
|
|
|
|
|
|
|
|
|
|
|
|
|
|
|
|
|
|
|
|
Second Quarter FY 2013 Supplemental
of Monmouth Real Estate Investment Corp. Page 14 of 19

| Definitions |
|
| |
|
|
|
|
|
|
|
|
|
|
| Investors and analysts following the real estate industry utilize funds from operations ("FFO"), Core adjusted funds from operations ("Core FFO"), net operating income ("NOI"), earnings before interest, taxes, depreciation and amortization ("EBITDA") and adjusted funds from operations ("AFFO"), variously defined, as supplemental performance measures. While the Company believes net income available to common stockholders, as defined by accounting principles generally accepted in the United States of America (US GAAP), is the most appropriate measure, it considers NOI, EBITDA, FFO, Core FFO and AFFO, given their wide use by and relevance to investors and analysts, appropriate supplemental performance measures. FFO, reflecting the assumption that real estate asset values rise or fall with market conditions, principally adjusts for the effects of US GAAP depreciation and amortization of real estate assets. Core FFO reflects the same assumptions as FFO except that is also adjusts for the effects of acquisition costs. NOI provides a measure of rental operations, and does not factor in depreciation and amortization and non-property specific expenses such as general and administrative expenses. EBITDA provides a tool to further evaluate the ability to incur and service debt and to fund dividends and other cash needs. AFFO provides a tool to further evaluate the ability to fund dividends. In addition, NOI, EBITDA, FFO, Core FFO and AFFO are commonly used in various ratios, pricing multiples and yields and returns and valuation of calculations used to measure financial position, performance and value. |
|
| |
| |
| |
| |
| |
| |
| |
| |
| |
|
|
|
|
|
|
|
|
|
|
| As used herein, the Company calculates FFO, as defined by The National Association of Real Estate Investment Trusts (NAREIT), to be equal to net income (loss) applicable to common shareholders, as defined by US GAAP, excluding extraordinary items as defined under US GAAP, gains or losses from sales of previously depreciated real estate assets, impairment charges related to depreciable real estate assets, plus certain non-cash items such as real estate asset depreciation and amortization. FFO includes gains and losses realized on securities investments. |
|
| |
| |
|
|
|
|
|
|
|
|
|
|
| Core FFO is calculated as FFO plus acquisition costs. |
|
|
|
|
|
|
|
| |
|
|
|
|
|
|
|
|
|
|
| NOI is calculated as recurring revenues of the Company, minus property expenses such as real estate taxes, repairs and maintenance, property management, utilities, insurance and other expenses. NOI excludes realized gains (losses) on securities transactions. |
|
| |
| |
|
|
|
|
|
|
|
|
|
|
| EBITDA is calculated as NOI less general and administrative expenses and less NOI from discontinued operations plus interest and dividend income. EBITDA excludes realized gains (losses) on securities transactions and interest expense. |
|
| |
| |
|
|
|
|
|
|
|
|
|
|
| AFFO is calculated as EBITDA minus US GAAP interest expense, minus preferred stock dividends, minus recurring capital expenditures and straight-line rents plus stock option expense. AFFO excludes realized gains (losses) on securities transactions. |
|
| |
NOI, EBITDA, FFO, Core FFO and AFFO do not represent cash generated from operating activities in accordance with US GAAP and are not necessarily indicative of cash available to fund cash needs, including the repayment of principal on debt and payment of dividends and distributions. NOI, EBITDA, FFO Core FFO and
AFFO should not be considered as substitutes for net income applicable to common shareholders (calculated in accordance with US GAAP) as a measure of results of operations or cash flows (calculated in accordance with US GAAP) as a measure of liquidity. NOI, EBITDA, FFO, Core FFO and AFFO as currently calculated by the Company may not be comparable to similarly titled, but variously calculated, measures of other REITs. |
|
| |
| |
| |
| |
Second Quarter FY 2013 Supplemental
of Monmouth Real Estate Investment Corp. Page 15 of 19
FOR IMMEDIATE RELEASE May 8, 2013
Contact: Susan
Jordan
732-577-9996
MONMOUTH REAL ESTATE INVESTMENT
CORPORATION
REPORTS 2nd QUARTER 2013 FINANCIAL
RESULTS FOR THE PERIOD ENDED MARCH 31, 2013
FREEHOLD, NJ,
May 8, 2013........ Monmouth Real Estate Investment Corporation (NYSE/MNR) reported Core Funds from Operations (Core FFO) for the
three months ended March 31, 2013 of $8,799,000 or $0.21 per diluted share versus $10,654,000 or $0.27 per diluted share for the
three months ended March 31, 2012. Core FFO for the prior year period included $3,222,000 or $0.08 per share in non-recurring lease
termination fees. Excluding the effect of these fees, Core FFO for the three months ended March 31, 2012 was $7,432,000 or $0.19
per diluted share.
A summary of significant financial information
for the three and six months ended March 31, 2013 and 2012 is as follows:
| |
|
Three Months Ended
March 31, |
| |
|
2013 |
|
2012 |
| Rental Revenue |
$ |
11,738,000 |
$ |
10,692,000 |
| Reimbursement Revenue |
$ |
1,568,000 |
$ |
1,876,000 |
| Lease Termination Income |
$ |
-0- |
$ |
3,222,000 |
| Total Expenses |
$ |
6,776,000 |
$ |
6,692,000 |
| Interest and Dividend Income |
$ |
1,005,000 |
$ |
893,000 |
| Gain on Securities Transactions, net |
$ |
3,803,000 |
$ |
2,209,000 |
|
Income from Continuing Operations
Income (Loss) from Discontinued Operations |
$
$ |
7,343,000
300,000 |
$
$ |
8,304,000
(44,000) |
| Net Income Attributable to Common Shareholders |
$ |
5,492,000 |
$ |
7,240,000 |
|
Net Income Attributable to Common Shareholders
Per Common Share |
$ |
0.13 |
$ |
0.18 |
| Core FFO (1) |
$ |
8,799,000 |
$ |
10,654,000 |
| Core FFO per Common Share (1) |
$ |
0.21 |
$ |
0.27 |
| Core FFO Excluding Lease Termination Fees (1) |
$ |
8,799,000 |
$ |
7,432,000 |
| Core FFO Excluding Lease Termination Fees per Common Share (1) |
$ |
0.21 |
$ |
0.19 |
| Weighted Avg. Diluted Common Shares Outstanding |
|
41,989,000 |
|
40,044,000 |
(continued on next page)
Second Quarter FY 2013 Supplemental of
Monmouth Real Estate Investment Corp. Page 16 of 19
| |
|
Six Months Ended
March 31, |
| |
|
2013 |
|
2012 |
| Rental Revenue |
$ |
23,048,000 |
$ |
21,350,000 |
| Reimbursement Revenue |
$ |
3,086,000 |
$ |
3,456,000 |
| Lease Termination Income |
$ |
691,000 |
$ |
3,222,000 |
| Total Expenses |
$ |
13,761,000 |
$ |
13,256,000 |
| Interest and Dividend Income |
$ |
2,128,000 |
$ |
1,842,000 |
| Gain on Securities Transactions, net |
$ |
5,913,000 |
$ |
4,998,000 |
|
Income from Continuing Operations
Income (Loss) from Discontinued Operations |
$
$ |
13,054,000
296,000 |
$
$ |
13,622,000
4,000 |
| Net Income Attributable to Common Shareholders |
$ |
9,047,000 |
$ |
11,586,000 |
|
Net Income Attributable to Common Shareholders
Per Common Share |
$ |
0.22 |
$ |
0.30 |
| Core FFO (1) |
$ |
16,259,000 |
$ |
18,416,000 |
| Core FFO per Common Share (1) |
$ |
0.39 |
$ |
0.48 |
| Core FFO Excluding Lease Termination Fees (1) |
$ |
15,568,000 |
$ |
15,194,000 |
| Core FFO Excluding Lease Termination Fees per Common Share (1) |
$ |
0.37 |
$ |
0.39 |
| Weighted Avg. Diluted Common Shares Outstanding |
|
41,545,000 |
|
38,750,000 |
A summary of significant
balance sheet information as of March 31, 2013 and September 30, 2012 is as follows:
| |
|
March 31, 2013 |
|
September 30,
2012 |
| Net Real Estate Investments |
$ |
507,296,000 |
$ |
467,886,000 |
| Securities Available for Sale |
$ |
52,264,000 |
$ |
61,685,000 |
| Total Assets |
$ |
604,773,000 |
$ |
574,508,000 |
| Mortgage Notes Payable |
$ |
251,353,000 |
$ |
237,944,000 |
| Subordinated Convertible Debentures |
$ |
-0- |
$ |
8,615,000 |
| Loans Payable |
$ |
17,200,000 |
$ |
5,200,000 |
| Total Shareholders’ Equity |
$ |
327,900,000 |
$ |
315,687,000 |
Michael P. Landy,
President, commented on the results of the second quarter of fiscal year 2013, “The recent quarter represented continued
progress across multiple fronts. Our occupancy rate improved by 100 basis points and to 95% compared to occupancy of 94% reported
in the December 2012 quarter. Our portfolio wide average lease maturity improved to 6.1 years from 6.0 years in the prior December
quarter. We have now secured lease renewals on 93% of the 897,000 square feet in leases set to expire this fiscal year. We have
$96 million in new acquisitions under contract representing 1.4 million square feet in new industrial build-to-suit properties
secured by investment grade tenants on leases of 10 years or greater. These acquisitions are expected to close in the second half
of fiscal 2013 and during fiscal 2014. Our REIT securities portfolio continued to perform well generating $3.8
million in realized gains during the second quarter and $5.9 million in gains realized thus far in fiscal 2013. At quarter
end we had an additional $5.9 million in unrealized gains on our REIT securities investments. We are very pleased with our latest
results and look forward to continuing to execute our growth strategy of investing in net-leased industrial properties on long-term
leases to investment grade tenants.”
(continued on next
page)
Second Quarter FY 2013 Supplemental of
Monmouth Real Estate Investment Corp. Page 17 of 19
Monmouth Real Estate
Investment Corporation will host its Second Quarter 2013 Financial Results Webcast and Conference Call. Senior management will
discuss the results, current market conditions and future outlook on Thursday, May 9, 2013 at 10:00 a.m. Eastern Time.
The Company’s
second quarter financial results being released herein will be available on the Company’s website at www.mreic.com in the
“Financial Information and Filings” section.
To participate in the Webcast,
select the microphone icon at the top of the homepage on the Company’s website at www.mreic.com.
Interested parties can also participate via conference call by calling toll free 888-317-6016 (domestically) or 412-317-6016
(internationally).
The replay of the
conference call will be available at 12:00 p.m. Eastern Time on Thursday, May 9, 2013. It will be available until June 30, 2013,
and can be accessed by dialing toll free 877-344-7529 (domestically) and 412-317-0088 (internationally) and entering the passcode
10025487. A transcript of the call and the webcast replay will be available at the Company’s website, www.mreic.com.
Formed in 1968,
Monmouth Real Estate Investment Corporation is a publicly-owned real estate investment trust specializing in net-leased industrial
properties subject to long-term leases primarily to investment grade tenants. The Company is a fully integrated and self-managed
real estate company, whose property portfolio consists of seventy-two industrial properties and one shopping center located in
twenty-six states. In addition, the Company owns a portfolio of REIT securities.
Certain statements
included in this press release which are not historical facts may be deemed forward-looking statements within the meaning of the
Private Securities Litigation Reform Act of 1995. Any such forward-looking statements are based on the Company’s current
expectations and involve various risks and uncertainties. Although the Company believes the expectations reflected in any forward-looking
statements are based on reasonable assumptions, the Company can provide no assurance those expectations will be achieved. The risks
and uncertainties that could cause actual results or events to differ materially from expectations are contained in the Company’s
annual report on Form 10-K and described from time to time in the Company’s other filings with the SEC. The Company undertakes
no obligation to publicly update or revise any forward-looking statements whether as a result of new information, future events,
or otherwise.
(continued on next page)
Second Quarter FY 2013 Supplemental
of Monmouth Real Estate Investment Corp. Page 18 of 19
Notes:
(1) Non-US GAAP Information: FFO is defined
by the National Association of Real Estate Investment Trusts ("NAREIT") as net income applicable to common shareholders,
excluding gains or losses from sales of depreciable assets, plus real estate-related depreciation and amortization. Core FFO is
defined as FFO plus acquisition costs. FFO per diluted common share is defined as FFO divided by weighted average diluted common
shares outstanding. FFO and Core FFO per diluted common share should be considered as supplemental measures of operating performance
used by real estate investment trusts (REITs). FFO and Core FFO per diluted common share exclude historical cost depreciation as
an expense and may facilitate the comparison of REITs which have different cost basis. The items excluded from FFO and Core FFO
per diluted common share are significant components in understanding the Company’s financial performance.
FFO and Core FFO per diluted common share
(A) do not represent cash flow from operations as defined by accounting principles generally accepted in the United States of America;
(B) should not be considered as an alternative to net income as a measure of operating performance or to cash flows from operating,
investing and financing activities; and (C) are not alternatives to cash flow as a measure of liquidity. FFO and Core FFO per diluted
common share, as calculated by the Company, may not be comparable to similarly titled measures reported by other REITs.
The Company’s
FFO and Core FFO for the three and six months ended March 31, 2013 and 2012 are calculated as follows:
| |
Three Months Ended |
|
Six Months Ended |
| |
3/31/2013 |
|
3/31/2012 |
|
3/31/2013 |
|
3/31/2012 |
| |
|
|
|
|
|
|
|
| Net Income Attributable to Common Shareholders |
$5,492,000 |
|
$7,240,000 |
|
$9,047,000 |
|
$11,586,000 |
| Depreciation Expense |
3,268,000 |
|
2,830,000 |
|
6,402,000 |
|
5,616,000 |
| Amortization of Lease Intangible Assets |
385,000 |
|
322,000 |
|
770,000 |
|
640,000 |
| (Gain) Loss on Sales of Depreciated Assets |
(346,000) |
|
-0- |
|
(346,000) |
|
8,000 |
| FFO Attributable to Common Shareholders |
$8,799,000 |
|
$10,392,000 |
|
$15,873,000 |
|
$17,850,000 |
| Acquisition Costs |
-0- |
|
262,000 |
|
386,000 |
|
566,000 |
| Core FFO Attributable to Common Shareholders |
$8,799,000 |
|
$10,654,000 |
|
$16,259,000 |
|
$18,416,000 |
The following are
the cash flows provided (used) by operating, investing and financing activities for the six months ended March 31, 2013 and 2012:
| |
2013 |
|
2012 |
| |
|
|
|
| Operating Activities |
$11,690,000 |
|
$15,920,000 |
| Investing Activities |
(30,607,000) |
|
(43,439,000) |
| Financing Activities |
14,397,000 |
|
32,698,000 |
# # # # #
Second Quarter FY 2013 Supplemental
of Monmouth Real Estate Investment Corp. Page 19 of 19