Attached files
| file | filename |
|---|---|
| 8-K - FORM 8-K - SB ONE BANCORP | v342646_8k.htm |

1

2 FORWARD - LOOKING STATEMENT This confidential presentation, and the oral presentation that supplements it, have been developed by Sussex Bancorp (“Sussex” or the “Company”), were prepared exclusively for the benefit and internal use of the recipient and are not an offer or the solicitation of an offer to buy securities. Neither this presentation, nor the oral presentation that supplements it, nor any of their contents, may be used, reproduced, disseminated, quoted or referred to for any other purpose, in whole or in part, without the prior written consent of the Company. Some of the statements contained in this presentation are “forward - looking statements” within the meaning of the Section 27A of the Securities Act of 1933, as amended, and Section 21E of the Securities Exchange Act of 1934, as amended. When used in this presentation, words such as “may,” “plan,” “contemplate,” “anticipate,” “believe,” “intend,” “continue,” “expect,” “project,” “predict,” “estimate,” “target,” “could,” “is likely,” “should,” “would,” “will,” or similar expressions are intended to identify “forward - looking statements” within the meaning of the Private Securities Litigation Reform Act of 1995. You are cautioned not to place undue reliance on any forward - looking statements, which speak only as of the date made. These statements may relate to the Company’s future financial performance, strategic plans or objectives, revenue, expense or earnings projections, or other financial items. By their nature, these statements are subject to numerous uncertainties that could cause actual results to differ materially from those anticipated in the statements. Factors that could cause actual results to differ materially from the results anticipated or projected include, but are not limited to, the following: ( i ) competition in the industry and markets in which the Company operates; (ii) levels of non - performing assets; (iii) changes in general interest rates; (iv) loan demand; (v) rapid changes in technology affecting the financial services industry; (vi) real estate values; (vii) changes in government regulation; and (viii) general economic and business conditions. This presentation includes certain non - GAAP financial measures intended to supplement, not substitute for, comparable GAAP measures. Reconciliations of non - GAAP financial measures to GAAP financial measures are provided at the end of the presentation. You are urged to consider carefully the comparable GAAP measures and the reconciliations to those measures provided.

▪ Looking back over the last three years ▪ Resolving legacy problem assets ▪ Building our business ▪ Financial overview ▪ Building shareholder value 3
Looking back over the last three years ▪ Resolving problem assets ▪ Introduced new cultures (customer, employee and risk management) ▪ New business model (strategic plan) ▪ Expanded and enhanced operations infrastructure, capabilities, capacity and efficiency ▪ Stock price and market cap has almost doubled 4
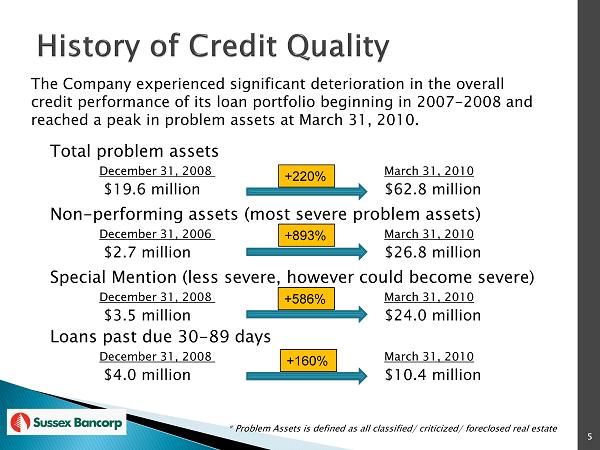
The Company experienced significant deterioration in the overall credit performance of its loan portfolio beginning in 2007 - 2008 and reached a peak in problem assets at March 31, 2010. Total problem assets December 31, 2008 March 31, 2010 $19.6 million $62.8 million Non - performing assets (most severe problem assets) December 31, 2006 March 31, 2010 $2.7 million $26.8 million Special Mention (less severe, however could become severe) December 31, 2008 March 31, 2010 $3.5 million $24.0 million Loans past due 30 - 89 days December 31, 2008 March 31, 2010 $4.0 million $10.4 million * Problem Assets is defined as all classified / criticized/ foreclosed real estate +220% +893% +586% +160% 5
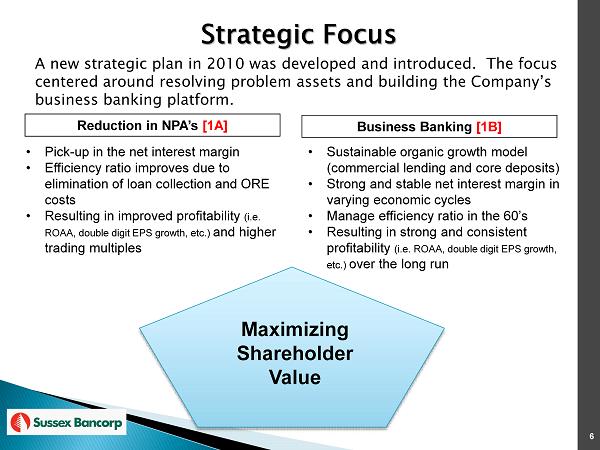
Strategic Focus A new strategic plan in 2010 was developed and introduced. The focus centered around resolving problem assets and building the Company’s business banking platform. 6 Business Banking [ 1B] Reduction in NPA’s [1A] • Sustainable organic growth model (commercial lending and core deposits) • Strong and stable net interest margin in varying economic cycles • Manage efficiency ratio in the 60’s • Resulting in strong and consistent profitability ( i.e. ROAA, double digit EPS growth, etc.) over the long run • Pick - up in the net interest margin • Efficiency ratio improves due to elimination of loan collection and ORE costs • Resulting in improved profitability ( i.e. ROAA, double digit EPS growth, etc.) and higher trading multiples Maximizing Shareholder Value
7
8 ▪ Credit quality resolution plan ▪ Improved core competencies: ▪ Chief Credit Officer ▪ Added workout officers ▪ Established Special Assets Division (“SAD”) ▪ Weekly meetings with executives to discuss strategies and updates ▪ Identified and segmented problem assets ▪ Evaluated all strategic options, including bulk sales ▪ Developed individual and macro plans to slow and resolve problem assets
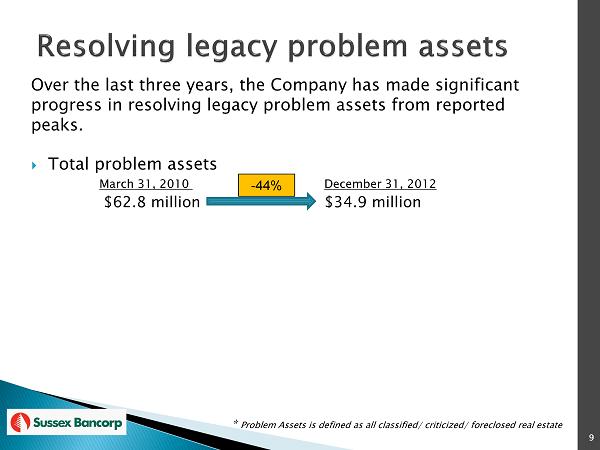
Over the last three years, the Company has made significant progress in resolving legacy problem assets from reported peaks. Total problem assets March 31, 2010 December 31 , 2012 $62.8 million $34.9 million * Problem Assets is defined as all classified / criticized/ foreclosed real estate - 44% 9

10 Overall problems assets down 44% from March 2010 At December 31, 2012, the top 25 Problem Loan Relationships account for approximately 80% of total problem loans.
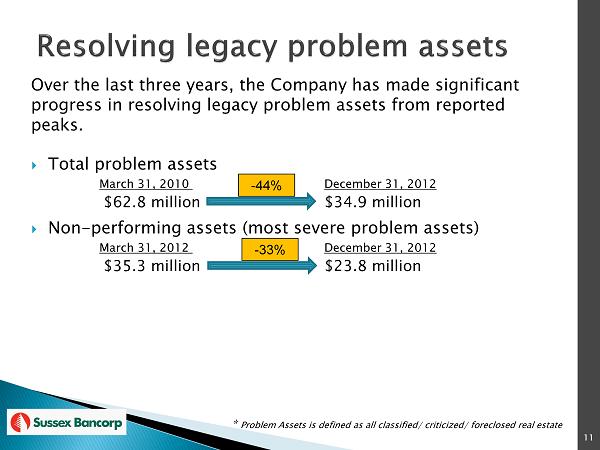
Over the last three years, the Company has made significant progress in resolving legacy problem assets from reported peaks. Total problem assets March 31, 2010 December 31 , 2012 $62.8 million $34.9 million Non - performing assets (most severe problem assets) March 31, 2012 December 31, 2012 $35.3 million $23.8 million * Problem Assets is defined as all classified / criticized/ foreclosed real estate - 44% - 33% 11
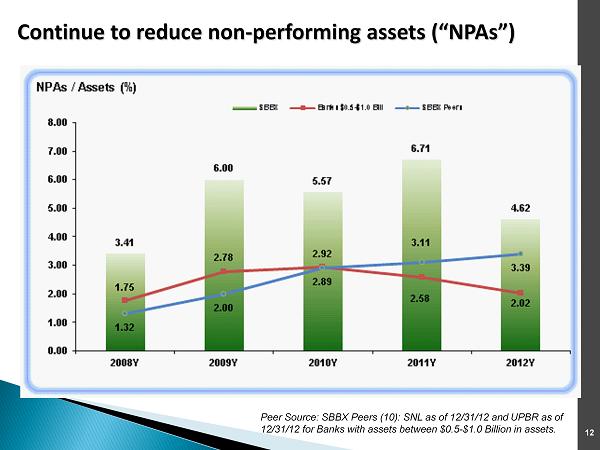
12 Continue to reduce non - performing assets (“NPAs”) Peer Source: SBBX Peers (10): SNL as of 12/31/12 and UPBR as of 12/31/12 for Banks with assets between $0.5 - $1.0 Billion in assets.

Over the last three years, the Company has made significant progress in resolving legacy problem assets from reported peaks. Total problem assets March 31, 2010 December 31 , 2012 $62.8 million $34.9 million Non - performing assets (most severe problem assets) March 31, 2012 December 31, 2012 $35.3 million $23.8 million Special Mention (less severe, however, could become severe) September 30, 2010 December 31, 2012 $26.4 million $5.2 million Loans past due 30 - 89 days September 30, 2010 December 31, 2012 $12.1 million $2.8 million * Problem Assets is defined as all classified / criticized/ foreclosed real estate - 44% - 33% - 80% - 77% 13

14 CREDIT QUALITY FACTS ▪ The Company’s NPAs at December 31, 2012, amounted to $24 million, or 4.6% of total assets. ▪ The Company’s top 10 NPAs total $13.2 million, or 56% of total NPA’s. ▪ Our short term goal is to achieve NPAs to assets of 2.5% in 2013 by reducing our NPA’s by $11 million. ▪ NPA focus and strategies are beginning to shift from resolving non - accrual loans to disposing foreclosed real estate. ▪ Increased investor interest and activity for the Company’s foreclosed real estate assets.
15
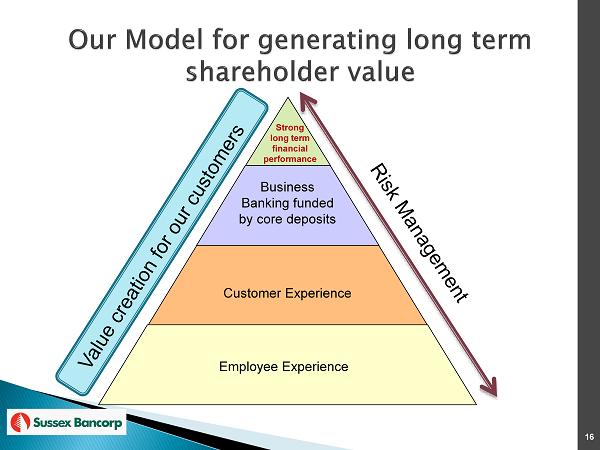
Employee Experience Customer Experience Business Banking funded by core deposits Strong long term financial performance 16
1. Commercial Lending 2. Retail banking 3. Tri - state Insurance 17

Building Our Business through: ▪ Enhanced the Customer and Employee experiences ; ▪ An experienced Board, leadership and management team; ▪ Sound risk management and core competencies; ▪ Continue to strengthen infrastructure and improve business processes to be more effective and efficient ; ▪ Capitalizing on our business development capabilities and strengths; and ▪ Expanding into target markets . 18

▪ The credit culture and enhanced credit administration process ▪ Chief credit officer and chief lender that have a combined 54 years of proven experience. ▪ Added to lending capabilities and capacity. The average lending experience of each of the loan officers is 23 years. ▪ Reorganized loan operations department with the addition of experienced staff. ▪ Identified and established key centers of influence in the markets we serve. ▪ Opened a Commercial Loan Production Office in Bergen County. 19
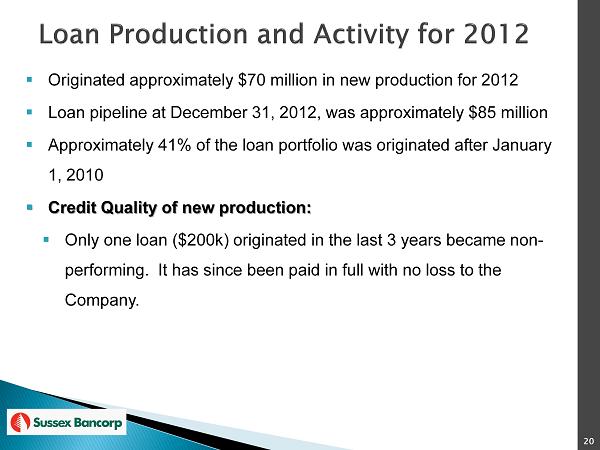
20 ▪ Originated approximately $70 million in new production for 2012 ▪ Loan pipeline at December 31, 2012, was approximately $85 million ▪ Approximately 41% of the loan portfolio was originated after January 1, 2010 ▪ Credit Quality of new production: ▪ Only one loan ($200k) originated in the last 3 years became non - performing. It has since been paid in full with no loss to the Company.
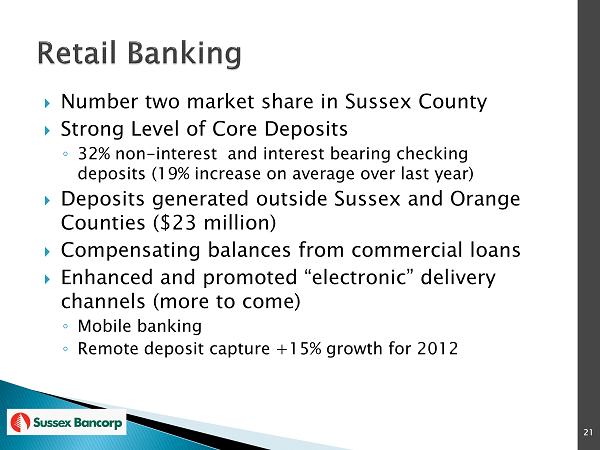
Number two market share in Sussex County Strong Level of Core Deposits ◦ 32% non - interest and interest bearing checking deposits (19% increase on average over last year) Deposits generated outside Sussex and Orange Counties ($23 million) Compensating balances from commercial loans Enhanced and promoted “electronic” delivery channels (more to come) ◦ Mobile banking ◦ Remote deposit capture +15% growth for 2012 21
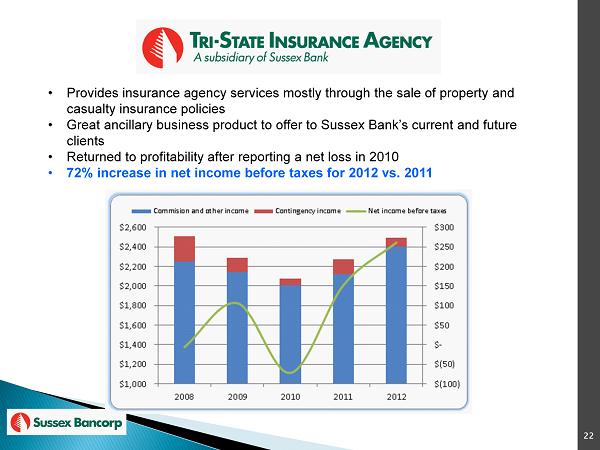
22 • Provides insurance agency services mostly through the sale of property and casualty insurance policies • Great ancillary business product to offer to Sussex Bank’s current and future clients • Returned to profitability after reporting a net loss in 2010 • 72% increase in net income before taxes for 2012 vs. 2011

23

24

Last 3 years, NPA’s adversely impacted the margin by 30bps Continued pressure on margin as a result of duration of low interest environment 25 Source: SNL
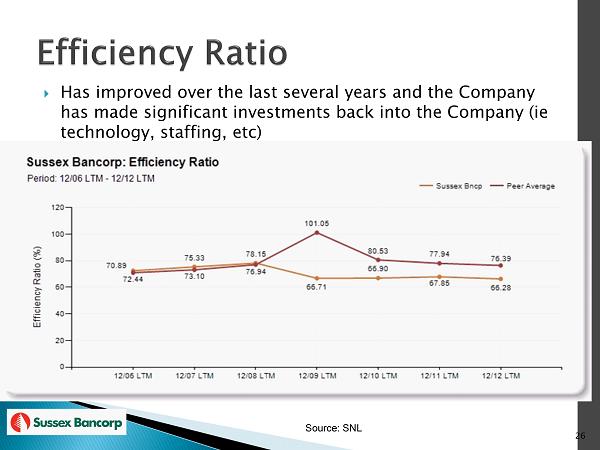
Has improved over the last several years and the Company has made significant investments back into the Company ( ie technology, staffing, etc ) 26 Source: SNL

Normalizing credit quality costs (‘09 - ’12), adjusted ROA would approximate between .70% to .90% 27 Source: SNL
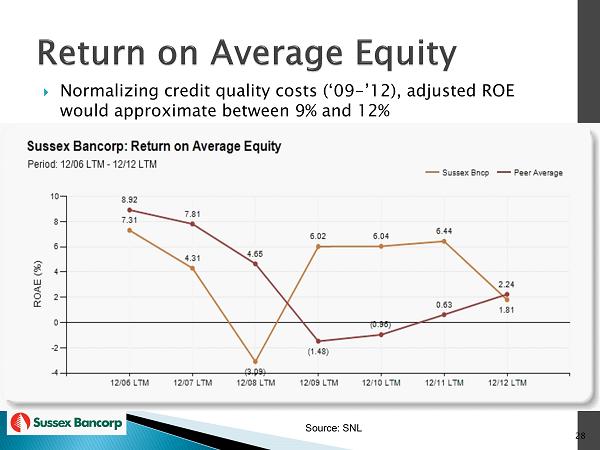
Normalizing credit quality costs (‘09 - ’12), adjusted ROE would approximate between 9% and 12% 28 Source: SNL
29
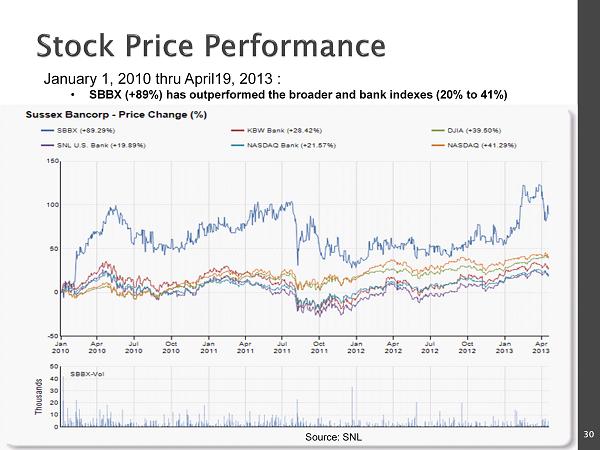
30 January 1, 2010 thru April19, 2013 : • SBBX (+89%) has outperformed the broader and bank indexes (20% to 41%) Source: SNL
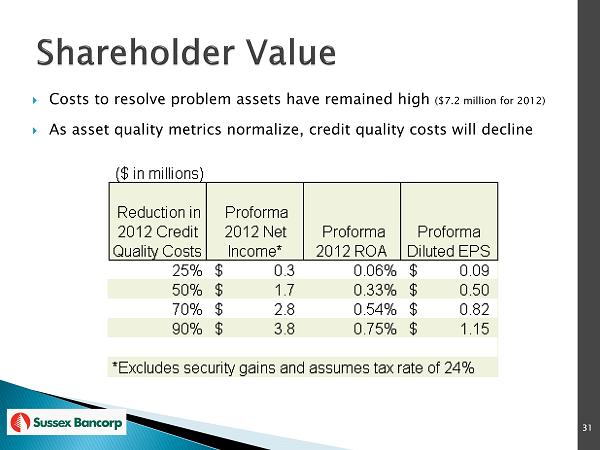
31 Costs to resolve problem assets have remained high ($7.2 million for 2012) As asset quality metrics normalize, credit quality costs will decline

Reducing the level of NPA’s is critical to increase stock price to peer levels A stronger stock valuation would also avail the Company to strategic growth opportunities including raising additional capital or mergers. Today our stock price to tangible book is approx . 0.6 Announced rights offering in early April. 32 (a) Source - Case Study: “Building Shareholder Value: What buyers will pay for.” by Wesley A. Brown, Managing Director, St. Charles Capital, LLC. The study included 10 years of financial data from bank mergers (2,332 bank mergers since 2000). Public Banks >$100 million in Assets and an average daily trade over 1,000. (b) Stock priced used $7.49 (c) Inferred stock price does not take into consideration impact of proposed Rights Offering.
Problem assets: ◦ We are approaching the end of the tunnel ◦ Problem asset costs expected to remain elevated in the short run as final resolutions are executed to get us to normalized levels We are building o ur business ◦ Expanding our market penetration ◦ Commercial loan production ◦ Core deposit growth ◦ Fee based businesses: Insurance Rights offering to facilitate growth initiatives and the acceleration of resolving problem assets Building shareholder value 33

34

35