Attached files
| file | filename |
|---|---|
| 8-K - 8-K - PROVIDENT FINANCIAL SERVICES INC | d526424d8k.htm |
| EX-99.1 - EX-99.1 - PROVIDENT FINANCIAL SERVICES INC | d526424dex991.htm |
 1
Annual Meeting
Annual Meeting
of Stockholders
of Stockholders
April 25, 2013
April 25, 2013
Exhibit 99.2 |
 Certain
statements contained herein are "forward-looking statements" within the meaning of Section 27A of the Securities
Act of 1933 and Section 21E of the Securities Exchange Act of 1934. Such forward-looking
statements may be identified by reference to a future period or periods, or by the use of
forward-looking terminology, such as "may," "will," "believe,"
"expect,"
"estimate,"
"anticipate,"
"continue,"
or
similar
terms
or
variations
on
those
terms,
or
the
negative
of
those
terms. Forward-looking statements are subject to numerous risks and uncertainties,
including, but not limited to, those related to the economic environment, particularly in
the market areas in which Provident Financial Services, Inc. (the “Company”)
operates, competitive products and pricing, fiscal and monetary policies of the U.S. Government, changes in
government regulations affecting financial institutions, including regulatory fees and capital
requirements, changes in prevailing interest rates, acquisitions and the integration of
acquired businesses, credit risk management, asset-liability management, the
financial and securities markets and the availability of and costs associated with sources of liquidity.
The Company cautions readers not to place undue reliance on any such forward-looking
statements, which speak only as of the
date
made.
The
Company
also
advises
readers
that
the
factors
listed
above
could
affect
the
Company's
financial
performance and could cause the Company's actual results for future periods to differ materially
from any opinions or statements expressed with respect to future periods in any current
statements. The Company does not undertake and specifically declines any obligation to
publicly release the result of any revisions which may be made to any forward- looking
statements to reflect events or circumstances after the date of such statements or to reflect the occurrence of
anticipated or unanticipated events.
A detailed discussion of factors that could affect our results is included in our SEC filings,
including the “Risk Factors” section of our Annual Report on Form 10-K for
the year ended December 31, 2012. 2
Forward Looking Statements |
 Superior
Markets Consistent Performance
Valuable Deposit Franchise
Proven Asset Generator
Capable Risk Manager
Shareholder Focused
3
Why PFS? |
 New
Jersey’s oldest state chartered bank Over 75 branch offices
Wealth Management and Trust Administration Services
Well capitalized under current regulatory standards
Ten year history of quarterly cash dividends to stockholders
No TARP
No dilutive stock offerings
No bulk NPA sales or debt restructurings
4
Company Highlights |
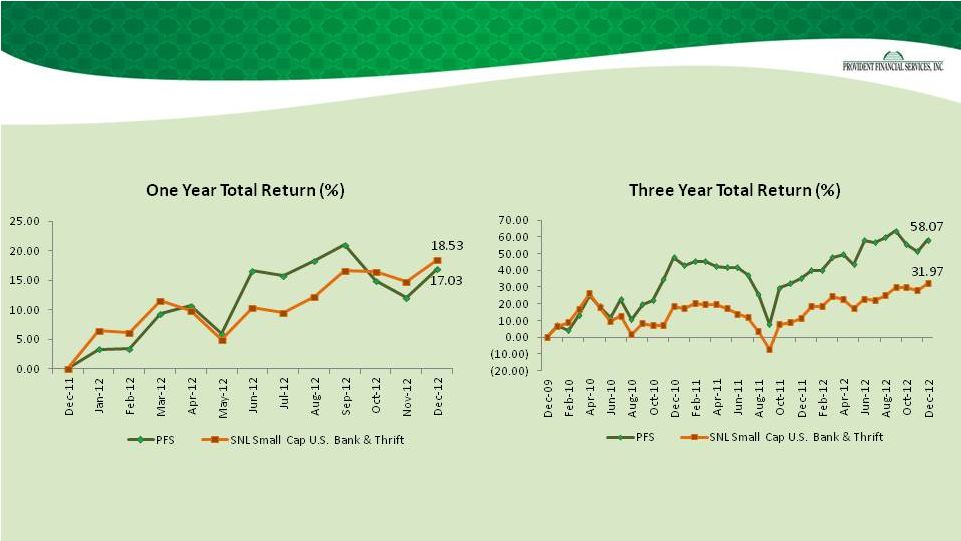 5
Total Return |
 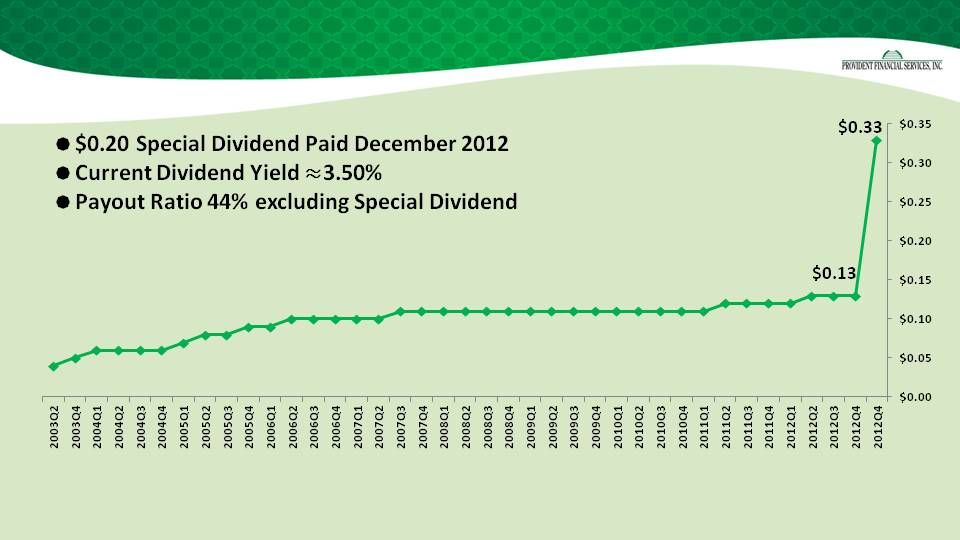 6
Dividend History |
 7
2012: A Record Setting Year
2012
Change vs. 2011
Total Assets
$7.3 B
$186 M
2.6%
Loans
$4.9 B
$251 M
5.4%
Total Deposits
$5.4 B
$272 M
5.3%
Non-Interest Bearing Deposits
$864 M
$166 M
24.0% |
 8
2012: A Record Setting Year
2012
Change vs. 2011
Net Income
$67 M
$10 M
17.3%
EPS
$1.18
$0.17
16.8%
ROAA
0.94%
0.11%
13.3%
ROATE
10.88%
1.07%
10.9% |
 9
*Excludes impact of $152.5 million of Goodwill impairment in 2009.
A Longer View: Structural Gains
2012
2009
Net Interest Margin
3.38%
3.06%
Loans/Deposits
90.4%
89.5%
Net Revenues
$261M
$212M
Provision for Loan Losses
$16M
$30M
Net Income
$67M
$31M* |
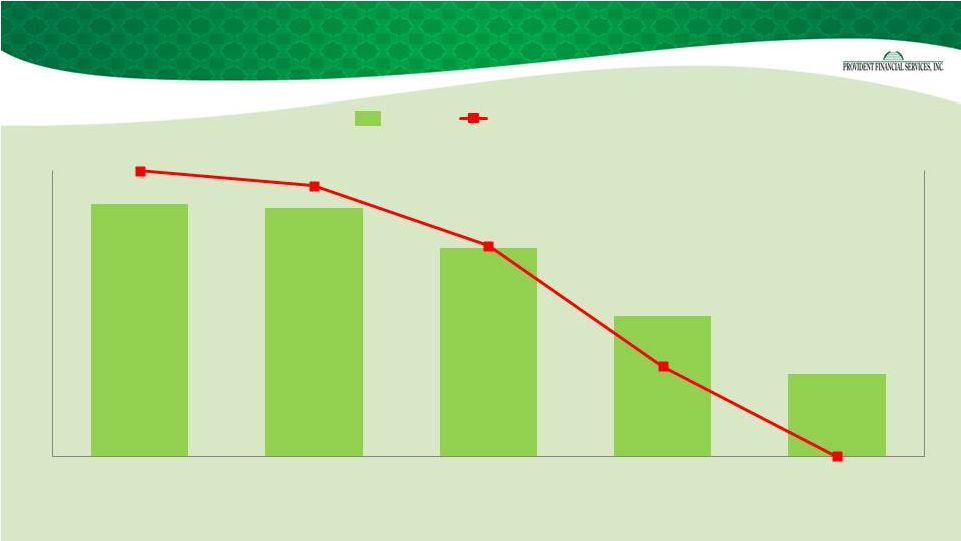 10
Asset Quality 5 Quarter Trend
$135,351
$134,783
$129,141
$119,586
$111,463
1.91%
1.89%
1.81%
1.65%
1.53%
4 Q 2011
1 Q 2012
2 Q 2012
3 Q 2012
4 Q 2012
NPAs
NPAs/Assets |
 $6.8 B
$7.3 B
11
A Longer View: Structural Gains
64%
25%
11%
2009
67%
23%
10%
2012
Loans
Investments
Other
Asset Composition |
 12
A Longer View: Structural Gains
Loan Composition
Commercial
$2.3B
53%
Consumer
$2.1B
47%
2009
Commercial
$3.1B
62%
Consumer
$1.8B
38%
2012 |
 Total Loans:
$4.9 Billion Average Loan Yield: 4.58%
13
Loan Portfolio –
12/31/12
1-4
Residential
26%
CRE
27%
Multi-family
15%
Construction
2%
Consumer
12%
C&I
18% |
 14
A Longer View: Structural Gains
Funding / Earning Assets
47%
8%
25%
16%
2009
55%
13%
15%
12%
2012
Interest Bearing
Core Deposits
Non
-Interest
Bearing Deposits
Time Deposits
Borrowings |
 15
* Not meaningful
Provident
Consolidated
Bank
PFS
Tangible Common Equity
*
9.00%
Tier 1 Leverage
7.80%
8.93%
Tier 1 Risk-Based Capital
11.08%
12.68%
Total Risk-Based Capital
12.33%
13.93%
Capital Ratios –
12/31/12 |
 16
Capital flexibility
Recent additions to lending teams in Middle Market /
Consumer / Healthcare / CRE
Technology enhancements
Sandy stimulus
Accelerating economic recovery
Opportunities |
 17
COMMITMENT
YOU CAN COUNT ON. |