Attached files
| file | filename |
|---|---|
| 8-K - FORM 8-K - HANCOCK WHITNEY CORP | d526683d8k.htm |
Exhibit 99.1

For Immediate Release
April 25, 2013
For More Information
Trisha Voltz Carlson
SVP, Investor Relations Manager
504.299.5208
trisha.carlson@hancockbank.com
Hancock reports first quarter 2013 financial results
Announces $50 million efficiency and process improvement initiative
GULFPORT, Miss. (April 25, 2013) — Hancock Holding Company (Nasdaq: HBHC) today announced financial results for the first quarter of 2013. Net income for the first quarter of 2013 was $48.6 million, or $.56 per diluted common share, compared to $47.0 million, or $.54, in the fourth quarter of 2012. Net income was $18.5 million, or $.21 per diluted common share, in the first quarter of 2012. Pre-tax earnings for the first quarter of 2013 and fourth quarter of 2012 included no merger-related costs. The first quarter of 2012 included pre-tax merger-related costs of $33.9 million.
Included in the Company’s first quarter of 2013 results are:
| • | Approximately $7.5 million pre-tax, or $.06 per diluted common share, of higher than expected loan accretion income related to cash collected on zero carrying value acquired loan pools. |
| • | Approximately $6.6 million pre-tax, or $.05 per diluted common share, of net loan loss provision taken on the FDIC covered portfolio. |
| • | Approximately $1.1 million, or $.01 per diluted common share, of one-time tax benefits related to specific tax credits. |
Due to continued rate pressure on earning assets and other economic headwinds impacting overall revenue, management expects near term earnings to remain flat to slightly down from current levels.
Management expects these pressures and headwinds will continue into the foreseeable future. Therefore, as part of its ongoing planning process, management reviewed its long-term strategic plan to determine the most effective and efficient way of operating the consolidated organization. As part of this review, it was determined that certain areas of the Company needed to be right-sized or retooled, and as a result management is announcing today an efficiency and process improvement initiative designed to reduce overall annual expense levels by $50 million.
- 1 -
Hancock reports first quarter 2013 financial results
April 25, 2013
“While it is appropriate to look back on the past year and recognize our associates’ hard work in completing the core systems conversion and achieving our merger cost synergies, we must now focus on Hancock’s future as one strong combined company,” said Hancock’s President and Chief Executive Officer Carl J. Chaney. “During this new phase of our long-term strategic planning process, it became apparent that we can no longer operate under the model of being all things to all people. We recognize that in order to overcome the challenges of both current and expected future operating environments we must make strategic decisions that could involve a change of direction in certain markets. These changes include improving the Company’s profitability through short-term efficiency improvements and longer-term process improvement and re-engineering efforts. Our efforts will include reviews of both front and back office areas, a review of the current branch network, as well as a review of business models across our footprint. The Company is committed to reducing non-interest expense over the next 7 quarters, and we expect to achieve 50% of our targeted reduction by the end of the first quarter of 2014 and the remainder by the end of the fourth quarter of 2014. When fully implemented, our annualized non-interest expense will be $50 million lower than the annualized level of non-interest expense for 2013 using our first quarter of 2013 results as a base. With these expense reductions and a combination of revenue improvement and balance sheet growth, we have set a long-term sustainable efficiency ratio target of 57% to 59% beginning in 2016.”
Management expects to incur certain one-time costs such as severance, professional fees and lease buyouts in implementing the efficiency initiative, although the scale of such costs cannot currently be estimated with certainty.
Return on average assets (ROA) was 1.03% for the first quarter of 2013 and 0.99% for the fourth quarter of 2012. ROA was 0.39% in the first quarter a year ago. Operating ROA was 1.03% in the first quarter of 2013 compared to 0.98% and 0.85% in the fourth and first quarters of 2012, respectively.
The Company’s pre-tax, pre-provision profit (PTPP) for the first quarter of 2013 was $77.3 million compared to $89.2 million in the fourth quarter of 2012 and $69.2 million in the first quarter of 2012. PTPP is total revenue (TE) less non-interest expense and excludes merger-related costs and securities transactions gains or losses. Included in the financial tables is a reconciliation of net income to PTPP.
Operating income for the first quarter of 2013 was $48.6 million or $.56 per diluted common share, compared to $46.6 million, or $.54, in the fourth quarter of 2012. Operating income was $40.5 million, or $.47, in the first quarter of 2012. We define operating income as net income excluding tax-effected merger-related costs and securities transactions gains or losses. Included in the financial tables is a reconciliation of net income to operating income.
- 2 -
Hancock reports first quarter 2013 financial results
April 25, 2013
Highlights & Key Operating Items from Hancock’s First Quarter Results
Total assets were $19.1 billion at March 31, 2013, a decrease of $400 million from December 31, 2012. The decrease is partly related to the seasonal and short-term nature of certain balance sheet items. These items are detailed below.
Loans
Total loans at March 31, 2013 were $11.5 billion, down $95 million, or less than 1%, from December 31, 2012. Excluding the FDIC-covered portfolio, which declined approximately $39 million during the first quarter, total loans were down $56 million linked-quarter. Half of the overall decline was in commercial real estate-related credits, with the balance related to consumer loans.
Underlying new loan activity was solid across many markets in the Company’s footprint, especially Houston, Florida and Louisiana. The largest component of new activity was in the commercial and industrial (C&I) portfolio, with additional support from commercial real estate lending activity on properties used by smaller C&I customers. The Company’s energy portfolio, a subset of C&I loans, totaled $960 million as of March 31, 2013, up $55 million from December 31, 2012. Overall, the C&I portfolio was essentially stable during the first quarter of 2013, as new activity was offset by expected reductions in balances owed by some larger seasonal borrowers and other normal activity in the customer base.
For the first quarter of 2013, average total loans were $11.5 billion, virtually unchanged from the fourth quarter of 2012.
Based on current levels of activity, management expects some success in achieving net loan growth in future quarters.
Deposits
Total deposits at March 31, 2013 were $15.3 billion, down $491 million, or 3%, from December 31, 2012. Average deposits for the first quarter of 2013 were $15.3 billion, up $181 million, or 1%, from the fourth quarter of 2012.
As noted last quarter, DDA and public fund deposits typically reflect higher balances at year-end with subsequent reductions beginning in the first quarter. Noninterest-bearing demand deposits (DDAs) totaled $5.4 billion at March 31, 2013, down $206 million, or 4%, compared to December 31, 2012. DDAs comprised 36% of total period-end deposits at March 31, 2013 and December 31, 2012. Interest-bearing public fund deposits totaled $1.5 billion at March 31, 2013, down $51 million, or 3%, from year-end 2012.
Time deposits (CDs) totaled $2.3 billion at March 31, 2013, down $213 million, or 9%, from December 31, 2012. During the first quarter, approximately $600 million of time deposits matured at an average rate of .37%, of which approximately $343 million renewed at an average cost of .14%. Included in first quarter maturities are $100 million of brokered CDs with a cost of .50%. As noted last quarter, in November of 2012, the Company issued $200 million in brokered CDs as a temporary liquidity source related to the year-end expiration of the FDIC Transaction Account Guarantee (TAG) Program. Half of the brokered deposits matured in February of this year with the other half scheduled to mature in May.
- 3 -
Hancock reports first quarter 2013 financial results
April 25, 2013
Asset Quality
Non-performing assets (NPAs), which exclude loans that were credit impaired at the time of the Whitney and People’s First acquisitions, totaled $229 million at March 31, 2013, down $27 million from $256 million at December 31, 2012. Non-performing assets as a percent of total loans, foreclosed and surplus real estate (ORE) and other foreclosed assets was 1.98% at March 31, 2013, compared to 2.19% at December 31, 2012. The decrease in overall NPAs during the first quarter reflects a net reduction of $22.4 million in ORE properties during the first quarter and a $4.4 million reduction in non-performing loans.
The Company’s total allowance for loan losses was $137.8 million at March 31, 2013, compared to $136.2 million at December 31, 2012. The ratio of the allowance to period-end loans was 1.20% at March 31, 2013, up slightly from 1.18% at year-end 2012. The allowance maintained on the originated portion of the loan portfolio totaled $75.5 million, or 1.02% of related loans, at March 31, 2013, down from $78.8 million, or 1.11%, at December 31, 2012. The allowance on originated loans decreased $3.3 million, primarily due to charge-offs taken against impaired loan reserves. Additionally, the movement of problem credits into impaired status slowed during the first quarter reflecting in part the impact of the bulk sale strategy executed in the fourth quarter of 2012. The allowance ratio for originated loans is expected to decline as the proportion of this portfolio representing new, high quality business grows, other factors held constant.
As detailed last quarter, at the end of 2012 the Company completed a bulk sale of loans with a net book value of approximately $40 million. The sale added approximately $13.7 million to the provision for loan losses, and approximately $16.2 million to net charge-offs in the fourth quarter of 2012.
Net charge-offs from the non-covered loan portfolio were $6.6 million, or .23% of average total loans on an annualized basis in the first quarter of 2013 compared to $28.0 million, or .97% of average total loans in the fourth quarter of 2012. Excluding the impact of the bulk sale, non-covered net charge-offs for the fourth quarter of 2012, were $11.8 million, or .41% of average total loans. The $5.2 million reduction in net charge-offs in the first quarter of 2013 compared to the fourth quarter of 2012 (excluding the impact of the bulk loan sale) reflects both a lower level of gross charge-offs and a higher than normal level of recoveries. Management does not expect this higher level of recoveries to continue.
Hancock recorded a total provision for loan losses for the first quarter of 2013 of $9.6 million, down from $28.1 million in the fourth quarter of 2012. Excluding the impact of the bulk sale noted above, provision expense for the fourth quarter of 2012 was $14.4 million. The provision for non-covered loans was $3.0 million in the first quarter of 2013, compared to $14.2 million in the fourth quarter of 2012, excluding the impact of the bulk sale. This decrease mainly reflects the lower level of non-covered net charge-offs noted above and the impact from the slowdown in newly identified impaired loans noted above. Management does not expect to maintain this lower level of non-covered provision in the near term.
- 4 -
Hancock reports first quarter 2013 financial results
April 25, 2013
During the first quarter of 2013 the Company recorded an $8.5 million impairment on certain pools of covered loans, with a related increase of $1.9 million in the Company’s FDIC loss share receivable. Approximately $6.5 million of the impairment relates to changes in the estimated timing of cash flows. The remaining $2.0 million reflects increased credit losses and is largely offset by additional expected FDIC loss share claims. The net provision from the covered portfolio was $6.6 million in the first quarter of 2013 compared to $.2 million for the fourth quarter of 2012.
Net Interest Income
Net interest income (TE) for the first quarter of 2013 was $176.7 million, down $6.1 million from the fourth quarter of 2012. Average earning assets were $16.5 billion in the first quarter of 2013, up $272 million from the fourth quarter of 2012. Approximately $3.0 million of the decline was related to having 2 fewer days in the first quarter of 2013 compared to the fourth quarter of 2012.
The net interest margin (TE) was 4.32% for the first quarter of 2013, down 16 basis points (bps) from 4.48% in the fourth quarter of 2012. The core margin of 3.41% (reported net interest income (TE) excluding total net purchase accounting adjustments, annualized, as a percent of total earning assets) compressed approximately 20bps during the first quarter, mainly from a decline in the core yield on the loan portfolio of 15bps. The margin was favorably impacted during the quarter by the investment of approximately $1.0 billion of excess liquidity earning 25bps into securities yielding approximately 1.65%. The majority of the transactions were completed in late February 2013, with a full quarter’s impact from the change in mix to be reflected in second quarter results.
The reported margin was also impacted in the first quarter of 2013 by approximately $7.5 million of higher than expected loan accretion related to significant cash collections on certain acquired loan pools with zero carrying value. As noted previously, changes in activity related to prepayments and payoffs in the acquired portfolio can cause quarterly accretion levels to be volatile.
As earning assets continue to reprice at lower rates, and with little opportunity to further lower funding costs, management expects 5-10 bps of compression in the core margin in the near term. All else equal, and adjusting for the volatility noted above related to loan accretion, management also anticipates compression in the reported margin of 10-20 bps in the near term.
Included in the slide presentation referenced below, is additional information on expected future levels of purchase accounting adjustments.
- 5 -
Hancock reports first quarter 2013 financial results
April 25, 2013
Non-interest Income
Non-interest income totaled $60.2 million for the first quarter of 2013, down $4.7 million, or 7%, from the fourth quarter of 2012. Included in the fourth quarter of 2012 was $.6 million of securities transaction gains.
Service charges on deposits totaled $19.0 million for the first quarter of 2013, down $1.2 million from $20.2 million in the fourth quarter of 2012. The linked-quarter decline reflects the impact of one less business day and higher average personal deposit account balances in the first quarter, with higher seasonal holiday activity in the fourth quarter of 2012.
Fees from secondary mortgage operations totaled $4.4 million for the first quarter of 2013, down $.8 million, or 15%, linked-quarter. The decrease reflects a slowdown in the volume of mortgage production during the first quarter of 2013.
Linked-quarter changes in trust, insurance, and investment and annuity fees reflect the volatility and seasonality of those lines of business.
Non-interest Expense & Taxes
Non-interest expense for the first quarter of 2013 totaled $159.6 million, up $1.7 million, or 1%, from the fourth quarter of 2012.
Total personnel expense was $87.9 million in the first quarter of 2013, up slightly from $87.4 million in the fourth quarter of 2012. Other non-interest expense totaled $46.5 million for the first quarter of 2013, up $1.4 million from the fourth quarter of 2012. The increase in both line items, reflect, in part, beginning of the year seasonality in certain categories.
Amortization of intangibles totaled $7.6 million during the first quarter of 2013 compared to $7.7 million in the fourth quarter of 2012.
The effective income tax rate for the first quarter of 2013 was 25%, up from 20% in the fourth quarter of 2012. The linked-quarter increase is mainly related to additional new markets tax credits and historical rehabilitation tax credits that lowered the rate for the fourth quarter of 2012. As noted earlier, an additional tax credit also impacted the overall tax rate for the first quarter of 2013. Management expects the effective tax rate to approximate 26-28% in 2013. The effective income tax rate continues to be less than the statutory rate of 35%, due primarily to tax-exempt income and tax credits.
Capital
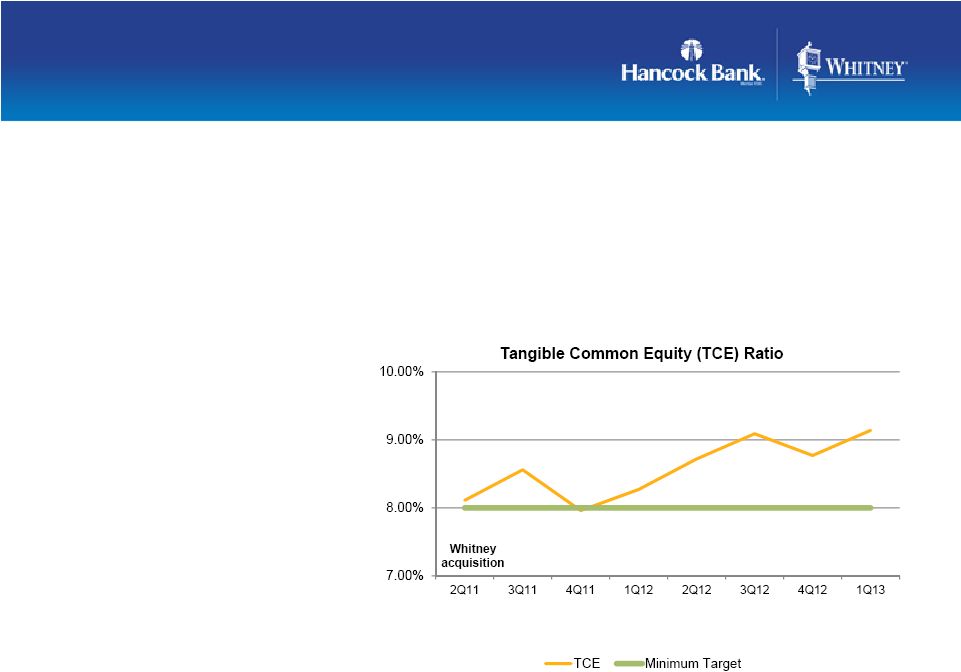
Common shareholders’ equity totaled $2.5 billion at March 31, 2013, up almost $24 million from year-end 2012. The Company continued to build its strong capital base, and the tangible common equity (TCE) ratio improved 37bps to 9.14% at March 31, 2013. Management continues to review strategic opportunities presented by Hancock’s strong capital position, including stock buybacks, organic growth, acquisitions or increased dividends. Additional capital ratios are included in the financial tables.
- 6 -
Hancock reports first quarter 2013 financial results
April 25, 2013
Conference Call and Slide Presentation
Management will host a conference call for analysts and investors at 9:00 a.m. Central Time Friday, April 26, 2013 to review the results. A live listen-only webcast of the call will be available under the Investor Relations section of Hancock’s website at www.hancockbank.com. A slide presentation related to first quarter results is also posted as part of the webcast link. To participate in the Q&A portion of the call, dial (877) 564-1219 or (973) 638-3429. An audio archive of the conference call will be available under the Investor Relations section of our website. A replay of the call will also be available through May 2, 2013 by dialing (855) 859-2056 or (404) 537-3406, passcode 32358400.
About Hancock Holding Company
Hancock Holding Company, the parent company of Hancock Bank and Whitney Bank, operates across a Gulf south corridor comprising south Mississippi; southern and central Alabama; southern Louisiana; the northern, central, and Panhandle regions of Florida; and Houston, Texas. The Hancock Holding Company family of financial services companies also includes Hancock Investment Services, Inc.; Hancock Insurance Agency and Whitney Insurance Agency, Inc.; corporate trust offices in Gulfport and Jackson, Mississippi, New Orleans and Baton Rouge, Louisiana, and Orlando, Florida; and Harrison Finance Company. Additional information is available at www.hancockbank.com and www.whitneybank.com.
Forward-Looking Statements
This news release contains “forward-looking statements” within the meaning of section 27A of the Securities Act of 1933, as amended, and section 21E of the Securities Exchange Act of 1934, as amended, and we intend such forward-looking statements to be covered by the safe harbor provisions therein and are including this statement for purposes of invoking these safe-harbor provisions. Forward-looking statements provide projections of results of operations or of financial condition or state other forward-looking information, such as expectations about future conditions and descriptions of plans and strategies for the future.
Forward-looking statements that we may make include, but may not be limited to, comments with respect to future levels of economic activity in our markets, loan growth, deposit trends, credit quality trends, future sales of nonperforming assets, net interest margin trends, future expense levels and the ability to achieve reductions in non-interest expense or other cost savings, projected tax rates, future profitability, improvements in expense to revenue (efficiency) ratio, purchase accounting impacts such as accretion levels, the impact of the branch rationalization process, and the financial impact of regulatory requirements.
Hancock’s ability to accurately project results or predict the effects of future plans or strategies is inherently limited. Although Hancock believes that the expectations reflected in its forward-looking statements are based on reasonable assumptions, actual results and performance could differ materially from those set forth in the forward-looking statements. Factors that could cause actual results to differ from those expressed in Hancock’s forward-looking statements include, but are not limited to, those risk factors outlined in Hancock’s public filings with the Securities and Exchange Commission, which are available at the SEC’s internet site (http://www.sec.gov).
You are cautioned not to place undue reliance on these forward-looking statements. Hancock does not intend, and undertakes no obligation, to update or revise any forward-looking statements, whether as a result of differences in actual results, changes in assumptions or changes in other factors affecting such statements, except as required by law.
- 7 -
Hancock Holding Company
Financial Highlights
(amounts in thousands, except per share data and FTE headcount)
(unaudited)
| Three Months Ended | ||||||||||||
| 3/31/2013 | 12/31/2012 | 3/31/2012 | ||||||||||
| Per Common Share Data |
||||||||||||
| Earnings per share: |
||||||||||||
| Basic |
$ | 0.56 | $ | 0.55 | $ | 0.22 | ||||||
| Diluted |
$ | 0.56 | $ | 0.54 | $ | 0.21 | ||||||
| Operating earnings per share: (a) |
||||||||||||
| Basic |
$ | 0.56 | $ | 0.54 | $ | 0.48 | ||||||
| Diluted |
$ | 0.56 | $ | 0.54 | $ | 0.47 | ||||||
| Cash dividends per share |
$ | 0.24 | $ | 0.24 | $ | 0.24 | ||||||
| Book value per share (period-end) |
$ | 29.18 | $ | 28.91 | $ | 28.02 | ||||||
| Tangible book value per share (period-end) |
$ | 19.67 | $ | 19.27 | $ | 17.99 | ||||||
| Weighted average number of shares: |
||||||||||||
| Basic |
84,871 | 84,798 | 84,741 | |||||||||
| Diluted |
84,972 | 85,777 | 85,442 | |||||||||
| Period-end number of shares |
84,882 | 84,848 | 84,770 | |||||||||
| Market data: |
||||||||||||
| High sales price |
$ | 33.59 | $ | 32.50 | $ | 36.73 | ||||||
| Low sales price |
$ | 29.37 | $ | 29.47 | $ | 31.56 | ||||||
| Period end closing price |
$ | 30.92 | $ | 31.73 | $ | 35.51 | ||||||
| Trading volume |
29,469 | 20,910 | 32,423 | |||||||||
| Other Period-end Data |
||||||||||||
| FTE headcount |
4,197 | 4,235 | 4,752 | |||||||||
| Tangible common equity |
$ | 1,669,435 | $ | 1,634,833 | $ | 1,524,985 | ||||||
| Tier I capital |
$ | 1,708,878 | $ | 1,666,042 | $ | 1,513,485 | ||||||
| Goodwill |
$ | 625,675 | $ | 628,877 | $ | 647,216 | ||||||
| Amortizing intangibles |
$ | 181,853 | $ | 189,409 | $ | 202,772 | ||||||
| Performance Ratios |
||||||||||||
| Return on average assets |
1.03 | % | 0.99 | % | 0.39 | % | ||||||
| Return on average assets (operating) (a) |
1.03 | % | 0.98 | % | 0.85 | % | ||||||
| Return on average common equity |
8.05 | % | 7.67 | % | 3.13 | % | ||||||
| Return on average common equity (operating) (a) |
8.05 | % | 7.60 | % | 6.86 | % | ||||||
| Return on average tangible common equity |
12.04 | % | 11.58 | % | 4.91 | % | ||||||
| Return on average tangible common equity (operating) (a) |
12.04 | % | 11.48 | % | 10.76 | % | ||||||
| Tangible common equity ratio |
9.14 | % | 8.77 | % | 8.27 | % | ||||||
| Earning asset yield (TE) |
4.60 | % | 4.76 | % | 4.81 | % | ||||||
| Total cost of funds |
0.28 | % | 0.28 | % | 0.38 | % | ||||||
| Net interest margin (TE) |
4.32 | % | 4.48 | % | 4.43 | % | ||||||
| Efficiency ratio (b) |
64.17 | % | 60.78 | % | 67.81 | % | ||||||
| Allowance for loan losses as a percent of period-end loans |
1.20 | % | 1.18 | % | 1.28 | % | ||||||
| Allowance for loan losses to non-performing loans + accruing loans 90 days past due |
87.34 | % | 81.40 | % | 105.37 | % | ||||||
| Average loan/deposit ratio |
75.30 | % | 76.29 | % | 73.10 | % | ||||||
| Noninterest income excluding securities transactions as a percent of total revenue (TE) |
25.40 | % | 26.02 | % | 25.54 | % | ||||||
| (a) | Excludes tax-effected merger related expenses and securities transactions. Management believes that this is a useful financial measure because it enables investors to assess ongoing operations. |
| (b) | Efficiency ratio is defined as noninterest expense as a percent of total revenue (TE) before amortization of purchased intangibles, securities transactions, and merger related expenses. |
- 8 -
Hancock Holding Company
Financial Highlights
(amounts in thousands)
(unaudited)
| Three Months Ended | ||||||||||||
| 3/31/2013 | 12/31/2012 | 3/31/2012 | ||||||||||
| Asset Quality Information |
||||||||||||
| Non-accrual loans (c) |
$ | 115,289 | $ | 121,837 | $ | 111,378 | ||||||
| Restructured loans (d) |
34,390 | 32,215 | 19,926 | |||||||||
|
|
|
|
|
|
|
|||||||
| Total non-performing loans |
149,679 | 154,052 | 131,304 | |||||||||
| ORE and foreclosed assets |
79,627 | 102,072 | 156,332 | |||||||||
|
|
|
|
|
|
|
|||||||
| Total non-performing assets |
$ | 229,306 | $ | 256,124 | $ | 287,636 | ||||||
|
|
|
|
|
|
|
|||||||
| Non-performing assets as a percent of loans, ORE and foreclosed assets |
1.98 | % | 2.19 | % | 2.55 | % | ||||||
| Accruing loans 90 days past due (c) |
$ | 8,076 | $ | 13,244 | $ | 3,780 | ||||||
| Accruing loans 90 days past due as a percent of loans |
0.07 | % | 0.11 | % | 0.03 | % | ||||||
| Non-performing assets + accruing loans 90 days past due to loans, ORE and foreclosed assets |
2.05 | % | 2.31 | % | 2.58 | % | ||||||
| Net charge-offs - non-covered |
$ | 6,633 | $ | 28,038 | $ | 7,054 | ||||||
| Net charge-offs - covered |
3,222 | 3,230 | 16,429 | |||||||||
| Net charge-offs - non-covered as a percent of average loans |
0.23 | % | 0.97 | % | 0.25 | % | ||||||
| Allowance for loan losses |
$ | 137,777 | $ | 136,171 | $ | 142,337 | ||||||
| Allowance for loan losses as a percent of period-end loans |
1.20 | % | 1.18 | % | 1.28 | % | ||||||
| Allowance for loan losses to non-performing loans + accruing loans 90 days past due |
87.34 | % | 81.40 | % | 105.37 | % | ||||||
| Provision for loan losses |
$ | 9,578 | $ | 28,051 | $ | 10,015 | ||||||
| Allowance for Loan Losses |
||||||||||||
| Beginning Balance |
$ | 136,171 | $ | 135,591 | $ | 124,881 | ||||||
| Provision for loan losses before FDIC benefit - covered loans |
8,484 | 3,996 | 32,552 | |||||||||
| Benefit attributable to FDIC loss share agreement |
(1,883 | ) | (3,797 | ) | (30,924 | ) | ||||||
| Provision for loan losses - non-covered loans (e) |
2,977 | 27,852 | 8,387 | |||||||||
|
|
|
|
|
|
|
|||||||
| Net provision for loan losses |
9,578 | 28,051 | 10,015 | |||||||||
|
|
|
|
|
|
|
|||||||
| Increase in FDIC loss share receivable |
1,883 | 3,797 | 30,924 | |||||||||
| Charge-offs - non-covered (e) |
11,237 | 30,172 | 13,186 | |||||||||
| Recoveries - non-covered |
(4,604 | ) | (2,134 | ) | (6,132 | ) | ||||||
| Net charge-offs - covered |
3,222 | 3,230 | 16,429 | |||||||||
|
|
|
|
|
|
|
|||||||
| Net charge-offs |
9,855 | 31,268 | 23,483 | |||||||||
|
|
|
|
|
|
|
|||||||
| Ending Balance |
$ | 137,777 | $ | 136,171 | $ | 142,337 | ||||||
|
|
|
|
|
|
|
|||||||
| Net Charge-off Information |
||||||||||||
| Net charge-offs - non-covered: |
||||||||||||
| Commercial/real estate loans |
$ | 4,304 | $ | 23,090 | $ | 4,278 | ||||||
| Residential mortgage loans |
(352 | ) | 1,372 | 721 | ||||||||
| Consumer loans |
2,681 | 3,576 | 2,055 | |||||||||
|
|
|
|
|
|
|
|||||||
| Total net charge-offs - non-covered |
$ | 6,633 | $ | 28,038 | $ | 7,054 | ||||||
|
|
|
|
|
|
|
|||||||
| Average loans: |
||||||||||||
| Commercial/real estate loans |
$ | 8,277,057 | $ | 8,262,736 | $ | 8,017,691 | ||||||
| Residential mortgage loans |
1,626,629 | 1,613,919 | 1,549,131 | |||||||||
| Consumer loans |
1,626,242 | 1,667,134 | 1,626,052 | |||||||||
|
|
|
|
|
|
|
|||||||
| Total average loans |
$ | 11,529,928 | $ | 11,543,789 | $ | 11,192,874 | ||||||
|
|
|
|
|
|
|
|||||||
| Net charge-offs - non-covered to average loans: |
||||||||||||
| Commercial/real estate loans |
0.21 | % | 1.11 | % | 0.21 | % | ||||||
| Residential mortgage loans |
(0.09 | )% | 0.34 | % | 0.19 | % | ||||||
| Consumer loans |
0.67 | % | 0.85 | % | 0.51 | % | ||||||
|
|
|
|
|
|
|
|||||||
| Total net charge-offs - non-covered to average loans |
0.23 | % | 0.97 | % | 0.25 | % | ||||||
|
|
|
|
|
|
|
|||||||
| (c) | Non-accrual loans and accruing loans past due 90 days or more do not include acquired credit-impaired loans which were written down to fair value upon acquisition and accrete interest income over the remaining life of the loan. |
| (d) | Included in restructured loans are $21.1 million, $15.8 million, and $5.2 million in non-accrual loans at 3/31/13, 12/31/12, and 3/31/12, respectively. Total excludes acquired credit-impaired loans. |
| (e) | In fourth quarter 2012, net charge-offs related to the bulk loan sale in December 2012 were approximately $16.2 million with an estimated impact on the provision of $13.7 million. |
- 9 -
Hancock Holding Company
Financial Highlights
(amounts in thousands)
(unaudited)
| Three Months Ended | ||||||||||||
| 3/31/2013 | 12/31/2012 | 3/31/2012 | ||||||||||
| Income Statement |
||||||||||||
| Interest income |
$ | 185,272 | $ | 191,140 | $ | 191,716 | ||||||
| Interest income (TE) |
187,998 | 194,075 | 194,665 | |||||||||
| Interest expense |
11,257 | 11,275 | 15,428 | |||||||||
|
|
|
|
|
|
|
|||||||
| Net interest income (TE) |
176,741 | 182,800 | 179,237 | |||||||||
| Provision for loan losses |
9,578 | 28,051 | 10,015 | |||||||||
| Noninterest income excluding |
||||||||||||
| securities transactions |
60,187 | 64,308 | 61,494 | |||||||||
| Securities transactions gains/(losses) |
— | 623 | 12 | |||||||||
| Noninterest expense |
159,602 | 157,920 | 205,463 | |||||||||
|
|
|
|
|
|
|
|||||||
| Income before income taxes |
65,022 | 58,825 | 22,316 | |||||||||
| Income tax expense |
16,446 | 11,866 | 3,821 | |||||||||
| Net income |
$ | 48,576 | $ | 46,959 | $ | 18,495 | ||||||
|
|
|
|
|
|
|
|||||||
| Merger-related expenses |
— | — | 33,913 | |||||||||
| Securities transactions gains/(losses) |
— | 623 | 12 | |||||||||
| Taxes on adjustments |
— | (218 | ) | 11,865 | ||||||||
|
|
|
|
|
|
|
|||||||
| Operating income (f) |
$ | 48,576 | $ | 46,554 | $ | 40,531 | ||||||
|
|
|
|
|
|
|
|||||||
| Difference between interest income and interest income (TE) |
$ | 2,726 | $ | 2,935 | $ | 2,949 | ||||||
| Provision for loan losses |
9,578 | 28,051 | 10,015 | |||||||||
| Merger-related expenses |
— | — | 33,913 | |||||||||
| Less securities transactions gains/(losses) |
— | 623 | 12 | |||||||||
| Income tax expense |
16,446 | 11,866 | 3,821 | |||||||||
|
|
|
|
|
|
|
|||||||
| Pre-tax, pre-provision profit (PTPP) (g) |
$ | 77,326 | $ | 89,188 | $ | 69,181 | ||||||
|
|
|
|
|
|
|
|||||||
| Noninterest Income and Noninterest Expense |
||||||||||||
| Service charges on deposit accounts |
$ | 19,015 | $ | 20,232 | $ | 16,274 | ||||||
| Trust fees |
8,692 | 8,273 | 8,738 | |||||||||
| Bank card fees |
7,483 | 7,591 | 8,464 | |||||||||
| Insurance fees |
3,994 | 3,588 | 3,477 | |||||||||
| Investment & annuity fees |
4,577 | 4,743 | 4,415 | |||||||||
| ATM fees |
3,575 | 3,935 | 4,334 | |||||||||
| Secondary mortgage market operations |
4,383 | 5,160 | 4,002 | |||||||||
| Other income |
8,468 | 10,786 | 11,790 | |||||||||
|
|
|
|
|
|
|
|||||||
| Noninterest income excluding securities transactions |
$ | 60,187 | $ | 64,308 | $ | 61,494 | ||||||
| Securities transactions gains/(losses) |
— | 623 | 12 | |||||||||
|
|
|
|
|
|
|
|||||||
| Total noninterest income including securities transactions |
$ | 60,187 | $ | 64,931 | $ | 61,506 | ||||||
|
|
|
|
|
|
|
|||||||
| Personnel expense |
$ | 87,927 | $ | 87,358 | $ | 91,871 | ||||||
| Occupancy expense (net) |
12,326 | 12,683 | 14,401 | |||||||||
| Equipment expense |
5,301 | 5,051 | 5,877 | |||||||||
| Other operating expense |
46,493 | 45,098 | 51,097 | |||||||||
| Amortization of intangibles |
7,555 | 7,730 | 8,304 | |||||||||
| Merger-related expenses |
— | — | 33,913 | |||||||||
|
|
|
|
|
|
|
|||||||
| Total noninterest expense |
$ | 159,602 | $ | 157,920 | $ | 205,463 | ||||||
|
|
|
|
|
|
|
|||||||
| (f) | Net income less tax-effected merger costs and securities gains/losses. Management believes that this is a useful financial measure because it enables investors to assess ongoing operations. |
| (g) | Pre-tax pre-provision profit (PTPP) is total revenue less noninterest expense, merger items, and securities transactions. Management believes that PTPP profit is a useful financial measure because it enables investors and others to assess the Company’s ability to generate capital to cover credit losses through a credit cycle. |
- 10 -
Hancock Holding Company
Financial Highlights
(amounts in thousands)
(unaudited)
| Three Months Ended | ||||||||||||
| 3/31/2013 | 12/31/2012 | 3/31/2012 | ||||||||||
| Period-end Balance Sheet |
||||||||||||
| Commercial non-real estate loans |
$ | 4,425,286 | $ | 4,433,288 | $ | 3,754,592 | ||||||
| Construction and land development loans |
992,820 | 989,306 | 1,285,214 | |||||||||
| Commercial real estate loans |
2,873,403 | 2,923,094 | 2,952,569 | |||||||||
| Residential mortgage loans |
1,587,519 | 1,577,944 | 1,511,349 | |||||||||
| Consumer loans |
1,603,734 | 1,654,170 | 1,626,549 | |||||||||
|
|
|
|
|
|
|
|||||||
| Total loans |
11,482,762 | 11,577,802 | 11,130,273 | |||||||||
|
|
|
|
|
|
|
|||||||
| Loans held for sale |
34,813 | 50,605 | 42,484 | |||||||||
| Securities |
4,662,279 | 3,716,460 | 4,393,845 | |||||||||
| Short-term investments |
475,677 | 1,500,188 | 1,008,505 | |||||||||
|
|
|
|
|
|
|
|||||||
| Earning assets |
16,655,531 | 16,845,055 | 16,575,107 | |||||||||
|
|
|
|
|
|
|
|||||||
| Allowance for loan losses |
(137,777 | ) | (136,171 | ) | (142,337 | ) | ||||||
| Other assets |
2,546,369 | 2,755,601 | 2,858,327 | |||||||||
|
|
|
|
|
|
|
|||||||
| Total assets |
$ | 19,064,123 | $ | 19,464,485 | $ | 19,291,097 | ||||||
|
|
|
|
|
|
|
|||||||
| Noninterest bearing deposits |
$ | 5,418,463 | $ | 5,624,127 | $ | 5,242,973 | ||||||
| Interest bearing transaction and savings deposits |
6,017,735 | 6,038,003 | 5,995,622 | |||||||||
| Interest bearing public fund deposits |
1,528,790 | 1,580,260 | 1,543,867 | |||||||||
| Time deposits |
2,288,363 | 2,501,798 | 2,650,305 | |||||||||
|
|
|
|
|
|
|
|||||||
| Total interest bearing deposits |
9,834,888 | 10,120,061 | 10,189,794 | |||||||||
|
|
|
|
|
|
|
|||||||
| Total deposits |
15,253,351 | 15,744,188 | 15,432,767 | |||||||||
| Other borrowed funds |
1,116,457 | 1,035,722 | 1,210,561 | |||||||||
| Other liabilities |
217,215 | 231,297 | 272,566 | |||||||||
| Common shareholders’ equity |
2,477,100 | 2,453,278 | 2,375,203 | |||||||||
|
|
|
|
|
|
|
|||||||
| Total liabilities & common equity |
$ | 19,064,123 | $ | 19,464,485 | $ | 19,291,097 | ||||||
|
|
|
|
|
|
|
|||||||
| Capital Ratios |
||||||||||||
| Common shareholders’ equity |
$ | 2,477,100 | $ | 2,453,278 | $ | 2,375,203 | ||||||
| Tier 1 capital (h) |
1,708,878 | 1,666,042 | 1,513,485 | |||||||||
| Tangible common equity ratio |
9.14 | % | 8.77 | % | 8.27 | % | ||||||
| Common equity (period-end) as a percent of total assets (period-end) |
12.99 | % | 12.60 | % | 12.31 | % | ||||||
| Leverage (Tier 1) ratio (h) |
9.37 | % | 9.10 | % | 8.18 | % | ||||||
| Tier 1 risk-based capital ratio (h) |
13.03 | % | 12.65 | % | 11.52 | % | ||||||
| Total risk-based capital ratio (h) |
14.69 | % | 14.28 | % | 13.76 | % | ||||||
| (h) | estimated for most recent period-end |
- 11 -
Hancock Holding Company
Financial Highlights
(amounts in thousands)
(unaudited)
| Three Months Ended | ||||||||||||
| 3/31/2013 | 12/31/2012 | 3/31/2012 | ||||||||||
| Average Balance Sheet |
||||||||||||
| Commercial non-real estate loans |
$ | 4,406,207 | $ | 4,316,455 | $ | 3,780,412 | ||||||
| Construction and land development loans |
975,301 | 1,035,401 | 1,267,192 | |||||||||
| Commercial real estate loans |
2,895,549 | 2,910,880 | 2,970,087 | |||||||||
| Residential mortgage loans |
1,626,629 | 1,613,919 | 1,549,131 | |||||||||
| Consumer loans |
1,626,242 | 1,667,134 | 1,626,052 | |||||||||
|
|
|
|
|
|
|
|||||||
| Total loans (i) |
11,529,928 | 11,543,789 | 11,192,874 | |||||||||
|
|
|
|
|
|
|
|||||||
| Securities (j) |
3,929,255 | 3,732,815 | 4,194,483 | |||||||||
| Short-term investments |
1,058,519 | 969,037 | 852,843 | |||||||||
|
|
|
|
|
|
|
|||||||
| Earning assets |
16,517,702 | 16,245,641 | 16,240,200 | |||||||||
|
|
|
|
|
|
|
|||||||
| Allowance for loan losses |
(137,110 | ) | (136,254 | ) | (125,072 | ) | ||||||
| Other assets |
2,772,059 | 2,855,565 | 3,078,392 | |||||||||
|
|
|
|
|
|
|
|||||||
| Total assets |
$ | 19,152,651 | $ | 18,964,952 | $ | 19,193,520 | ||||||
|
|
|
|
|
|
|
|||||||
| Noninterest bearing deposits |
$ | 5,314,648 | $ | 5,420,081 | $ | 5,359,504 | ||||||
| Interest bearing transaction and savings deposits |
5,982,345 | 5,930,964 | 5,625,963 | |||||||||
| Interest bearing public fund deposits |
1,608,925 | 1,332,163 | 1,531,110 | |||||||||
| Time deposits |
2,406,772 | 2,448,694 | 2,795,935 | |||||||||
|
|
|
|
|
|
|
|||||||
| Total interest bearing deposits |
9,998,042 | 9,711,821 | 9,953,008 | |||||||||
|
|
|
|
|
|
|
|||||||
| Total deposits |
15,312,690 | 15,131,902 | 15,312,512 | |||||||||
| Other borrowed funds |
1,160,110 | 1,168,771 | 1,237,849 | |||||||||
| Other liabilities |
231,841 | 229,100 | 268,255 | |||||||||
| Common shareholders’ equity |
2,448,010 | 2,435,179 | 2,374,904 | |||||||||
|
|
|
|
|
|
|
|||||||
| Total liabilities & common equity |
$ | 19,152,651 | $ | 18,964,952 | $ | 19,193,520 | ||||||
|
|
|
|
|
|
|
|||||||
| (i) | Includes loans held for sale |
| (j) | Average securities does not include unrealized holding gains/losses on available for sale securities. |
- 12 -
Hancock Holding Company
Financial Highlights
(amounts in thousands)
(unaudited)
| Supplemental Asset Quality Information (excluding covered assets and acquired loans)k |
3/31/2013 | 12/31/2012 | 3/31/2012 | |||||||||
| Non-accrual loans (l) (m) |
$ | 82,194 | $ | 87,651 | $ | 100,192 | ||||||
| Restructured loans (n) |
28,689 | 27,451 | 19,926 | |||||||||
|
|
|
|
|
|
|
|||||||
| Total non-performing loans |
110,883 | 115,102 | 120,118 | |||||||||
| ORE and foreclosed assets (o) |
55,545 | 75,771 | 107,804 | |||||||||
|
|
|
|
|
|
|
|||||||
| Total non-performing assets |
$ | 166,428 | $ | 190,873 | $ | 227,922 | ||||||
|
|
|
|
|
|
|
|||||||
| Non-performing assets as a percent of loans, ORE and foreclosed assets |
2.24 | % | 2.66 | % | 4.10 | % | ||||||
| Accruing loans 90 days past due |
$ | 6,113 | $ | 7,737 | $ | 2,524 | ||||||
| Accruing loans 90 days past due as a percent of loans |
0.08 | % | 0.11 | % | 0.05 | % | ||||||
| Non-performing assets + accruing loans 90 days past due to loans, ORE and foreclosed assets |
2.32 | % | 2.77 | % | 4.15 | % | ||||||
| Allowance for loan losses (p) (q) |
$ | 75,466 | $ | 78,774 | $ | 84,578 | ||||||
| Allowance for loan losses as a percent of period-end loans |
1.02 | % | 1.11 | % | 1.55 | % | ||||||
| Allowance for loan losses to nonperforming loans + accruing loans 90 days past due |
64.50 | % | 64.13 | % | 68.96 | % | ||||||
| (k) | Covered and acquired credit impaired loans are considered performing due to the application of the accretion method under acquisition accounting. Acquired loans are recorded at fair value with no allowance brought forward in accordance with acquisition accounting. Certain acquired loans and foreclosed assets are also covered under FDIC loss sharing agreements, which provide considerable protection against credit risk. Due to the protection of loss sharing agreements and impact of acquisition accounting, management has excluded acquired loans and covered assets from this table to provide for improved comparability to prior periods and better perspective into asset quality trends. |
| (l) | Excludes acquired covered loans not accounted for under the accretion method of $4,221, $4,100, and $9,377. |
| (m) | Excludes non-covered acquired performing loans at fair value of $28,874, $30,087, and $1,809. |
| (n) | Excludes non-covered acquired performing loans at fair value of $5,701, $4,764, and $0. |
| (o) | Excludes covered foreclosed assets of $24,082, $26,301, and $48,528. |
| (p) | Excludes allowance for loan losses recorded on covered acquired loans of $61,868, $56,609, and $57,759. |
| (q) | Excludes allowance for loan losses recorded on non-covered acquired-performing loans of $443, $788 and $0. |
| 12/31/2013 | ||||||||||||||||
| Originated Loans |
Acquired Loans (r) |
Covered Loans (s) |
Total | |||||||||||||
| Commercial non-real estate loans |
$ | 2,713,385 | $ | 1,690,643 | $ | 29,260 | $ | 4,433,288 | ||||||||
| Construction and land development loans |
665,673 | 295,151 | 28,482 | 989,306 | ||||||||||||
| Commercial real estate loans |
1,548,402 | 1,279,546 | 95,146 | 2,923,094 | ||||||||||||
| Residential mortgage loans |
827,985 | 486,444 | 263,515 | 1,577,944 | ||||||||||||
| Consumer loans |
1,351,776 | 202,974 | 99,420 | 1,654,170 | ||||||||||||
|
|
|
|
|
|
|
|
|
|||||||||
| Total loans |
$ | 7,107,221 | $ | 3,954,758 | $ | 515,823 | $ | 11,577,802 | ||||||||
|
|
|
|
|
|
|
|
|
|||||||||
| Change in loan balance from previous quarter |
$ | 526,027 | ($ | 342,764 | ) | ($ | 39,909 | ) | $ | 143,354 | ||||||
|
|
|
|
|
|
|
|
|
|||||||||
| 3/31/2013 | ||||||||||||||||
| Originated Loans |
Acquired Loans (r) |
Covered Loans (s) |
Total | |||||||||||||
| Commercial non-real estate loans |
$ | 2,900,855 | $ | 1,500,137 | $ | 24,294 | $ | 4,425,286 | ||||||||
| Construction and land development loans |
697,989 | 269,727 | 25,104 | 992,820 | ||||||||||||
| Commercial real estate loans |
1,562,383 | 1,226,854 | 84,166 | 2,873,403 | ||||||||||||
| Residential mortgage loans |
886,232 | 449,500 | 251,787 | 1,587,519 | ||||||||||||
| Consumer loans |
1,331,477 | 180,632 | 91,625 | 1,603,734 | ||||||||||||
|
|
|
|
|
|
|
|
|
|||||||||
| Total loans |
$ | 7,378,936 | $ | 3,626,850 | $ | 476,976 | $ | 11,482,762 | ||||||||
|
|
|
|
|
|
|
|
|
|||||||||
| Change in loan balance from previous quarter |
$ | 271,715 | ($ | 327,908 | ) | ($ | 38,847 | ) | ($ | 95,040 | ) | |||||
|
|
|
|
|
|
|
|
|
|||||||||
| (r) | Loans which have been acquired and no allowance brought forward in accordance with acquisition accounting. |
| (s) | Loans which are covered by loss sharing agreements with the FDIC providing considerable protection against credit risk. |
- 13 -
Hancock Holding Company
Average Balance and Net Interest Margin Summary
(amounts in thousands)
(unaudited)
| Three Months Ended | ||||||||||||||||||||||||||||||||||||
| 3/31/2013 | 12/31/2012 | 3/31/2012 | ||||||||||||||||||||||||||||||||||
| Interest | Volume | Rate | Interest | Volume | Rate | Interest | Volume | Rate | ||||||||||||||||||||||||||||
| Average Earning Assets |
||||||||||||||||||||||||||||||||||||
| Commercial & real estate loans (TE) |
$ | 113,296 | $ | 8,277,057 | 5.55 | % | $ | 113,004 | $ | 8,262,736 | 5.44 | % | $ | 112,509 | $ | 8,017,691 | 5.64 | % | ||||||||||||||||||
| Residential mortgage loans |
25,680 | 1,626,629 | 6.31 | % | 27,998 | 1,613,919 | 6.94 | % | 26,422 | 1,549,131 | 6.82 | % | ||||||||||||||||||||||||
| Consumer loans |
26,501 | 1,626,242 | 6.61 | % | 28,593 | 1,667,134 | 6.82 | % | 28,562 | 1,626,052 | 7.05 | % | ||||||||||||||||||||||||
| Loan fees & late charges |
568 | — | 0.00 | % | 3,098 | — | 0.00 | % | 799 | — | 0.00 | % | ||||||||||||||||||||||||
|
|
|
|
|
|
|
|
|
|
|
|
|
|
|
|
|
|
|
|||||||||||||||||||
| Total loans (TE) |
166,045 | 11,529,928 | 5.83 | % | 172,693 | 11,543,789 | 5.95 | % | 168,292 | 11,192,874 | 6.04 | % | ||||||||||||||||||||||||
| US Treasury securities |
2 | 150 | 4.68 | % | 2 | 150 | 4.65 | % | 2 | 150 | 4.67 | % | ||||||||||||||||||||||||
| US agency securities |
15 | 5,429 | 1.09 | % | 49 | 18,165 | 1.08 | % | 1,262 | 219,287 | 2.30 | % | ||||||||||||||||||||||||
| CMOs |
7,091 | 1,534,840 | 1.85 | % | 7,204 | 1,577,165 | 1.83 | % | 6,783 | 1,361,132 | 1.99 | % | ||||||||||||||||||||||||
| Mortgage backed securities |
11,605 | 2,163,544 | 2.15 | % | 10,475 | 1,891,704 | 2.22 | % | 14,406 | 2,321,703 | 2.48 | % | ||||||||||||||||||||||||
| Municipals (TE) |
2,554 | 216,974 | 4.71 | % | 2,942 | 238,733 | 4.93 | % | 3,267 | 284,113 | 4.60 | % | ||||||||||||||||||||||||
| Other securities |
41 | 8,318 | 1.96 | % | 94 | 6,898 | 5.43 | % | 126 | 8,098 | 6.21 | % | ||||||||||||||||||||||||
|
|
|
|
|
|
|
|
|
|
|
|
|
|
|
|
|
|
|
|||||||||||||||||||
| Total securities (TE) (t) |
21,308 | 3,929,255 | 2.17 | % | 20,766 | 3,732,815 | 2.21 | % | 25,846 | 4,194,483 | 2.46 | % | ||||||||||||||||||||||||
| Total short-term investments |
645 | 1,058,519 | 0.25 | % | 616 | 969,037 | 0.25 | % | 527 | 852,843 | 0.25 | % | ||||||||||||||||||||||||
| Average earning assets yield (TE) |
$ | 187,998 | $ | 16,517,702 | 4.60 | % | $ | 194,075 | $ | 16,245,641 | 4.76 | % | $ | 194,665 | $ | 16,240,200 | 4.81 | % | ||||||||||||||||||
| Interest-bearing Liabilities |
||||||||||||||||||||||||||||||||||||
| Interest-bearing transaction and savings deposits |
$ | 1,659 | $ | 5,982,345 | 0.11 | % | $ | 1,719 | $ | 5,930,964 | 0.12 | % | $ | 2,181 | $ | 5,625,963 | 0.16 | % | ||||||||||||||||||
| Time deposits |
4,086 | 2,406,772 | 0.69 | % | 4,507 | 2,448,694 | 0.73 | % | 6,889 | 2,795,935 | 0.99 | % | ||||||||||||||||||||||||
| Public Funds |
1,000 | 1,608,925 | 0.25 | % | 861 | 1,332,163 | 0.26 | % | 1,192 | 1,531,110 | 0.31 | % | ||||||||||||||||||||||||
|
|
|
|
|
|
|
|
|
|
|
|
|
|
|
|
|
|
|
|||||||||||||||||||
| Total interest bearing deposits |
6,745 | 9,998,042 | 0.27 | % | 7,087 | 9,711,821 | 0.29 | % | 10,262 | 9,953,008 | 0.41 | % | ||||||||||||||||||||||||
| Total borrowings |
4,512 | 1,160,110 | 1.58 | % | 4,188 | 1,168,771 | 1.43 | % | 5,166 | 1,237,849 | 1.68 | % | ||||||||||||||||||||||||
| Total interest bearing liabilities cost |
$ | 11,257 | $ | 11,158,152 | 0.41 | % | $ | 11,275 | $ | 10,880,592 | 0.41 | % | $ | 15,428 | $ | 11,190,857 | 0.55 | % | ||||||||||||||||||
| Net interest-free funding sources |
5,359,550 | 5,365,049 | 5,049,343 | |||||||||||||||||||||||||||||||||
| Total Cost of Funds |
$ | 11,257 | $ | 16,517,702 | 0.28 | % | $ | 11,275 | $ | 16,245,641 | 0.28 | % | $ | 15,428 | $ | 16,240,200 | 0.38 | % | ||||||||||||||||||
| Net Interest Spread (TE) |
$ | 176,741 | 4.19 | % | $ | 182,800 | 4.35 | % | $ | 179,237 | 4.26 | % | ||||||||||||||||||||||||
| Net Interest Margin (TE) |
$ | 176,741 | $ | 16,517,702 | 4.32 | % | $ | 182,800 | $ | 16,245,641 | 4.48 | % | $ | 179,237 | $ | 16,240,200 | 4.43 | % | ||||||||||||||||||
| (t) | Average securities does not include unrealized holding gains/losses on available for sale securities. |
- 14 -
 First Quarter 2013
Financial Results
April 25, 2013
First Quarter 2013
Financial Results
April 25, 2013 |
 Forward-Looking
Statements
Forward-Looking
Statements
Certain of the statements or information included in this presentation
may constitute forward-looking statements.
Forward-looking statements include projections of revenue, costs, results of operations or
financial condition or statements regarding future market conditions or
our potential plans and strategies for the future.
Forward-looking statements that we may make include, but may not be limited to, comments
with respect to future levels of economic activity in our
markets, loan growth, deposit trends, credit quality
trends, future sales of nonperforming assets, net interest margin
trends, future expense levels and the ability to achieve
reductions in non-interest expense or other cost savings, projected tax rates, future
profitability, improvements in expense to revenue (efficiency) ratio,
purchase accounting impacts such as accretion levels, the impact
of the branch rationalization process, and the financial impact of regulatory
requirements. Hancock’s ability to accurately project
results or predict the effects of future plans or strategies is
inherently limited. We believe that the expectations
reflected or implied by any forward-looking statements are based on
reasonable assumptions, but actual results and performance could
differ materially from those set forth in
the forward-looking statements. Factors that could cause
actual results or outcomes to differ from those expressed in the
Company's forward-looking statements include, but are not limited to, those outlined in
Hancock's SEC filings, including the “Risk Factors”
section of the Company’s 10-K for the year ended
December 31, 2012 and most recent form 10-Q.
Hancock undertakes no obligation to update or revise any
forward-looking statements, and you are cautioned not to
place undue reliance on such forward-looking statements. 2
|
 First Quarter 2013
Results
First Quarter 2013
Results
* A reconciliation of net income to operating income and pre-tax,
pre-provision income is included in the appendix. **
Noninterest
expense
as
a
percent
of
total
revenue
(TE)
before
amortization
of
purchased
intangibles,
securities
transactions
and
merger
expenses.
($s in millions; except per share data)
1Q13
4Q12
change
Net Income
$48.6
$47.0
+3%
Earnings Per Share (diluted)
$.56
$.54
+4%
Return on Assets
1.03%
.99%
+4bps
Return on Tangible Common Equity
12.04%
11.58%
+46bps
Operating Income*
$48.6
$46.6
+4%
Operating E.P.S. (diluted)*
$.56
$.54
+4%
Return on Assets (operating)*
1.03%
.98%
+5bps
Pre-Tax, Pre-Provision Income*
$77.3
$89.2
-13%
Net Interest Margin
4.32%
4.48%
-16bps
Net Charge-offs non-covered
0.23%
0.97%
-74bps
Tangible Common Equity
9.14%
8.77%
+37bps
Efficiency Ratio**
64.17%
60.78%
+339bps
3 |
 •
Net income $48.6 million or $.56 per diluted common share
•
Included in the Company’s first quarter of 2013 results are:
•
Approximately $7.5 million pre-tax, or $.06 per diluted common
share, of higher than expected loan accretion related to cash
collected on zero carrying value acquired loan pools. As noted
previously, changes in activity related to prepayments and payoffs in
the acquired portfolio can cause quarterly accretion levels to
be volatile. •
Approximately $6.6 million pre-tax, or $.05 per diluted common
share, of net loan loss provision taken on the FDIC covered
portfolio. •
Approximately $1.1 million, or $.01 per diluted common share, of
one-time tax benefits related to
specific tax credits.
•
ROA 1.03%
•
Improved asset quality metrics
•
Balance sheet decline related mainly to seasonal trends in deposits and
loan demand •
Revenue challenges continue
•
Expenses in line with guidance
•
Continued to build strong capital levels
First Quarter 2013
First Quarter 2013
Summary
Summary
4 |
 Efficiency & Process
Improvement Initiative
Improvement Initiative
•
Announced an efficiency and process improvement initiative
•
Part of the Company’s updated long-term Strategic Plan
•
Most effective way of operating the consolidated organization
Short-term efficiency improvements
Long-term process improvement
•
Committed to reducing non-interest expense in future years by
$50 million compared to annualized 2013 expense
•
Designed to reduce overall annual expense levels over the
next 7 quarters
50% attainment by 1Q14
100% attainment by 4Q14
•
Will include reviews of front and back office areas as well as branch
network and current business models
•
Longer-term sustainable efficiency ratio target of 57%-59%
set for 2016
•
Expect to incur one-time costs in implementing the initiative
5
$s in millions
1Q13 non-interest
expense
$160
Annualized 1Q13
non-interest expense
$640
1Q14 non-interest
expense projection
$153
4Q14 non-interest
expense projection
$147 |
 Growth Continues In C&I
Portfolio, Energy Lending
Portfolio, Energy Lending
•
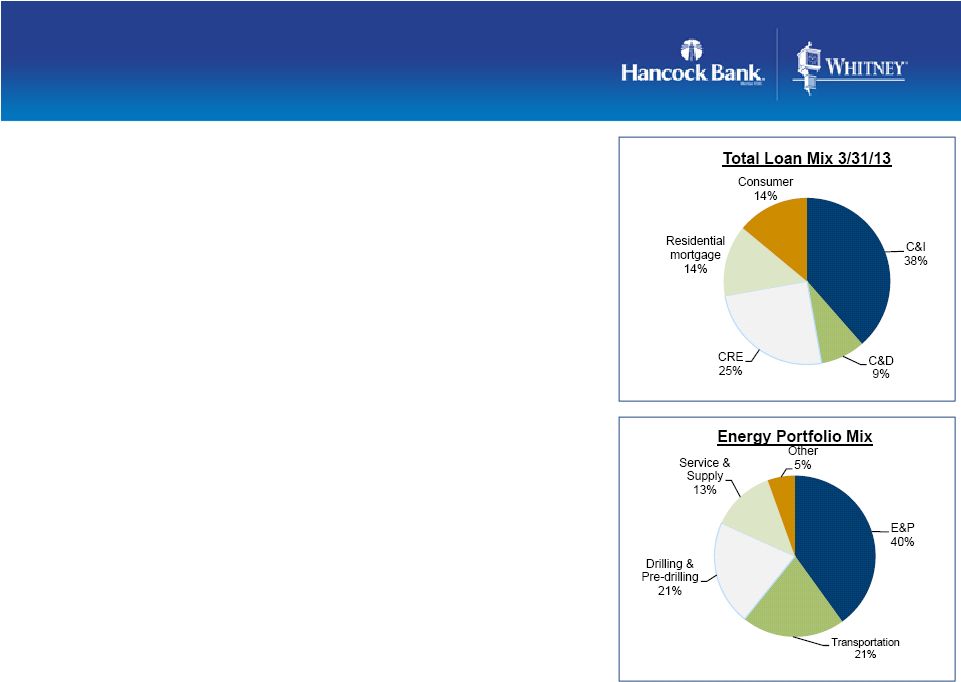
Total loans $11.5B; down $95 million, or less than 1%
linked-quarter
•
Seasonal reductions in demand from some C&I customers
in the first quarter
•
New loan activity in many markets across the footprint,
especially Houston, Florida and Louisiana
•
Loans outstanding to oil & gas industry customers totaled
$960 million, or approximately 8% of total loans, at
March 31, 2013
•
Based on current levels of activity, management expects
some success in achieving net loan growth in future
quarters.
Period-end balances. As of March 31, 2013
6 |
 Strong Core Deposit
Funding
Funding
•
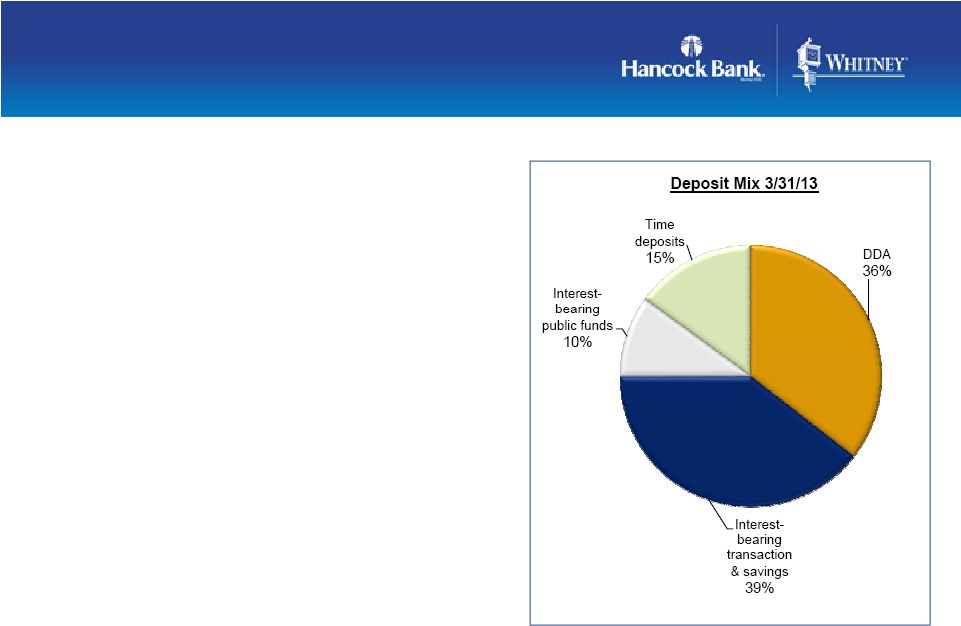
Total deposits $15.3 billion, down
approximately $500 million linked-quarter
•
Decrease related mainly to seasonal trends
and maturity of $100 million of brokered
CDs
•
Funding mix remained strong
–
Noninterest-bearing demand deposits (DDA) comprised
36% of total period-end deposits
–
Shift continued from CDs to no or low cost deposits
–
Cost of funds 28bps
•
Approximately $1.6B in CDs maturing over
the next 4 quarters at average rate of .38%
Period-end balances. As of March 31, 2013
7 |
 Net Interest Margin Impacted By
Earning Asset Repricing
Earning Asset Repricing
•
Reported net interest margin (NIM) 4.32%, down 16bps
linked-quarter •
Core NIM compressed 20bps
–
Increase
in
net
purchase
accounting
adjustments,
mainly
from
the
Whitney
transaction,
positively impacted net interest income and NIM
–
Continued repricing of earning assets causing NIM compression
–
Average rate on new loans booked in 1Q13
in the range of 3.0%-3.5%
–
New securities purchased in 1Q13 at an
average rate of 1.68%
•
As earning assets continue to reprice
at lower rates, and with a diminished
opportunity to significantly lower funding
costs, compression of 5-10 bps in the core margin
is expected in the near term
•
All else equal, and adjusting for the volatility
related to loan accretion, compression of the
reported margin of 10-20 bps is
anticipated in the near term
As of March 31, 2013
8
Core
NIM
=
reported
net
interest
income
(TE)
excluding
total
net
purchase
accounting
adjustments, annualized, as a percent of total earning assets
|
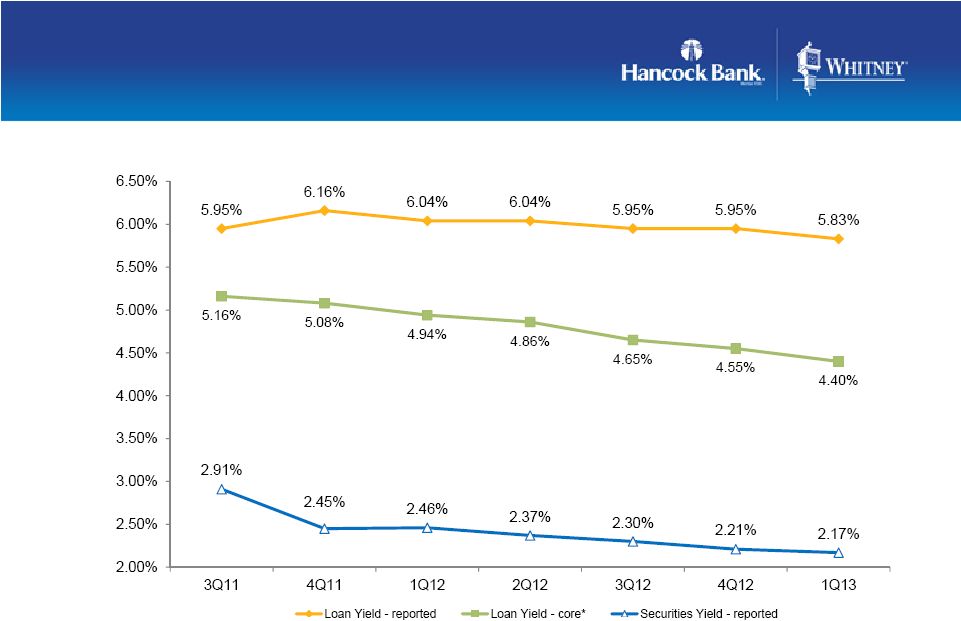 Core NIM Compression Related
to Lower Earning Asset Yields
to Lower Earning Asset Yields
9
*Core loan yields exclude purchase accounting accretion
|
 Whitney Portfolio Continues
Solid Performance
Solid Performance
•
FAS 91 mark accreted into earnings over the life of the portfolio
•
Credit impaired mark available for charge-offs; if not needed for
charge-offs then accreted into income
•
Quarterly reviews of accretion levels and portfolio performance will
impact reported margin 10
$s in millions
Credit
Impaired
(SOP 03-3)
Performing
(FAS 91)
Total
Whitney loan mark at acquisition
(as adjusted in 4Q11)
$284
$187
$471
Acquired portfolio loan balances at acquisition
$818
$6,101
$6,919
Discount at acquisition
34.7%
3.1%
6.8%
Remaining Whitney loan mark at 3/31/13
$188
$68
$255
Remaining acquired portfolio loan balances at
3/31/13
$317
$3,565
$3,882
Acquired loan charge-offs from acquisition thru
3/31/13
$27
$6
$33
Discount at 3/31/13
59.2%
1.9%
6.6%
As of March 31, 2013 |
 Peoples First Loan Mark Used
For Charge-Offs
For Charge-Offs
•
FDIC covered loan portfolio
•
Entire loan mark available for charge-offs; if not needed for
charge-offs then accreted into income
•
Quarterly reviews of accretion levels and portfolio performance will
impact reported margin •
FDIC loss share receivable totaled $153 million at March 31, 2013
Balance reflects the total amount expected to be collected from the
FDIC 11
$s in millions
Credit Impaired
(SOP 03-3)
Peoples First loan mark at acquisition (12/2009)
$509
Charge-offs from acquisition thru 3/31/13
$387
Accretion since acquisition date
$71
Remaining loan mark at 3/31/13
$91
Impairment reserve at 3/31/13
$62
Remaining acquired portfolio loan balances at 3/31/13
$568
Discount & allowance at 3/31/13
26.9%
As of March 31, 2013 |
 Efficiency Improvements Will Offset Loss
of Purchase Accounting Adjustments
of Purchase Accounting Adjustments
•
Net
purchase
accounting
adjustments
will
be
‘sizeable’
part
of
earnings
for
the
next
few
years
•
Post
2015,
diminishing
levels
of
purchase
accounting
adjustments
also
expected
•
Revenue includes loan accretion, securities amortization, CD
accretion •
Amortization of intangibles mainly related to the Whitney
acquisition 12
$s in millions
Impact of Purchase Accounting Adjustments and Efficiency Initiative
2012-2015 (2013-2015 projections will be updated
quarterly; subject to volatility) |
 Working To Enhance
Fee Growth
Fee Growth
•
Noninterest income totaled $60.2 million, down $4.7 million
linked-quarter •
4Q12 includes $.6 million of securities gains
•
Service charges on deposits totaled $19.0 million, down $1.2 million
from the fourth quarter of 2012.
•
The linked-quarter decline reflects:
•
One less business day in the first quarter
•
Higher average balances in the first quarter
•
Higher year-end seasonal holiday activity in the fourth
quarter •
Fees from secondary mortgage operations totaled $4.4 million, down $.8
million linked-quarter
•
Decrease reflects a slowdown in the volume of mortgage production
during the quarter •
Linked-quarter changes in trust, insurance, and investment and
annuity fees reflect the volatility and seasonality of those
lines of business 13
As of March 31, 2013 |
 Long-Term Efficiency
Ratio Target Set
Ratio Target Set
•
Non-interest
expense
totaled
$159.6
million,
up
$1.7
million,
or
1%,
from
4Q12
–
Amortization of intangibles totaled $7.6million
–
Long-term target: 57%-59% for 2016
** Noninterest expense as a percent of total revenue (TE) before
amortization
of purchased intangibles, sub debt redemption costs, securities
transactions and merger expenses
14
As of March 31, 2013
•
Personnel expense increased $.6 million
•
Other operating expense totaled $46.5 million, up $1.4 million from
4Q12 •
Increases are related, in part, to beginning of the year seasonality in
certain categories •
Efficiency ratio 64%** |
 •
Provision for loan losses was $9.6 million, down $18.5 million from
4Q12 •
4Q12 includes $13.7 million related to the bulk loan sale
•
1Q13 includes $6.6 million impact from FDIC-covered loan
portfolio •
1Q13
includes
$3.0
million
for
the
non-covered
loan
portfolio
•
Linked-quarter decrease related to a lower level of non-covered
charge-offs and the impact of a slowdown in newly identified
impaired loans •
Do not expect to maintain lower level of non-covered provision in
the near term •
Non-covered net charge-offs totaled $6.6 million, or
0.23% •
4Q12 included $16.2 million related to the bulk loan sale
•
Linked-quarter decrease reflects a lower level of gross
charge-offs and a higher than normal level of recoveries •
Do not expect to maintain higher level of recoveries in the near
term
•
Allowance for loan losses/loans 1.20%
•
Excluding the impact of the Whitney acquired loans and FDIC covered
loans, allowance for loan losses was 1.02%
Improved Asset Quality Metrics
Improved Asset Quality Metrics
15
As of March 31, 2013 |
 •
Nonperforming assets totaled $229 million, a decrease of $27 million
linked-quarter
•
Nonaccrual loans down $6.5 million
•
Restructured
loans
increased
$2.1
million
•
ORE and foreclosed assets down $22.4 million
•
Management will continue to
evaluate the costs and benefits of
NPL and ORE sale
opportunities as part of its
normal credit risk management
process
Improved Asset Quality Metrics
Improved Asset Quality Metrics
16
Excludes covered portfolio and gross of the Whitney loan mark
As of March 31, 2013 |
 •
TCE
ratio
9.14%
at
March
31,
2013
•
Expect to continue to build capital in the near term
•
Will
continue
to
look
for
opportunities
to
deploy
excess
capital
and
liquidity
in
the best interest of the Company and its shareholders
•
Will evaluate:
•
Stock buyback
•
Organic growth
•
M&A
•
Increased dividends
Solid Capital Levels
Solid Capital Levels
17
As of March 31, 2013 |
 Appendix
18 |
 Non-GAAP
Reconciliation
Non-GAAP
Non-GAAP
Reconciliation
Reconciliation
19
(a) Net income less tax-effected merger costs, debt early redemption costs, and securities
gains/losses. Management believes that this is a useful financial measure because it
enables investors to assess ongoing operations. (b) Pre-tax pre-provision
profit (PTPP) is total revenue less noninterest expense, merger items, and securities transactions. Management believes that PTPP profit is a useful
financial measure because it enables investors and others to assess the Company’s ability
to generate capital to cover credit losses through a credit cycle. (amounts in thousands)
(unaudited)
3/31/2013
12/31/2012
3/31/2012
Income Statement
Interest income
$185,272
$191,140
$191,716
Interest income (TE)
187,998
194,075
194,665
Interest expense
11,257
11,275
15,428
Net interest income (TE)
176,741
182,800
179,237
Provision for loan losses
9,578
28,051
10,015
Noninterest income excluding
securities transactions
60,187
64,308
61,494
Securities transactions gains/(losses)
-
623
12
Noninterest expense
159,602
157,920
205,463
Income before income taxes
65,022
58,825
22,316
Income tax expense
16,446
11,866
3,821
Net income
$48,576
$46,959
$18,495
Merger-related expenses
-
-
33,913
Securities transactions gains/(losses)
-
623
12
Taxes on adjustments
-
(218)
11,865
Operating income (a)
$48,576
$46,554
$40,531
Difference between interest income and interest income (TE)
$2,726
$2,935
$2,949
Provision for loan losses
9,578
28,051
10,015
Merger-related expenses
-
-
33,913
Less securities transactions gains/(losses)
-
623
12
Income tax expense
16,446
11,866
3,821
Pre-tax, pre-provision profit (PTPP) (b)
$77,326
$89,188
$69,181
Three Months Ended |
 First Quarter 2013
Financial Results
April 25, 2013
First Quarter 2013
Financial Results
April 25, 2013 |