Attached files
| file | filename |
|---|---|
| 8-K - FORM 8-K - GAIN Capital Holdings, Inc. | d524532d8k.htm |
| EX-99.3 - EX-99.3 - GAIN Capital Holdings, Inc. | d524532dex993.htm |
| EX-99.1 - EX-99.1 - GAIN Capital Holdings, Inc. | d524532dex991.htm |
 GFT
Acquisition Announcement & Q1 2013 Preliminary Results
April 2013
Exhibit 99.2 |
 Safe
Harbor Statement 2
Forward-Looking Statements
The forward-looking statements contained herein include, without
limitation, statements relating to GAIN Capital’s and/or Global Futures &
Forex, Ltd.’s (“GFT”) expectations regarding the
opportunities and strengths of the combined company created by the proposed business
combination, anticipated cost and revenue synergies, the strategic
rationale for the proposed business combination, including expectations
regarding product offerings, growth opportunities, value creation, and
financial strength, and the timing of the closing. All forward looking
statements are based upon current expectations and beliefs and various
assumptions. There can be no assurance that GAIN Capital or GFT
will realize these expectations or that these beliefs will prove
correct. In addition, a variety of important factors could cause results to differ
materially from such statements. These factors are noted throughout
GAIN Capital’s annual report on Form 10-K, as filed with the
Securities and Exchange Commission on March 18, 2013, and include, but
are not limited to, the actions of both current and potential new
competitors, fluctuations in market trading volumes, financial market
volatility, evolving industry regulations, including changes in
regulation of the futures companies, errors or malfunctions in GAIN
Capital’s systems or technology, rapid changes in technology, effects of
inflation, customer trading patterns, the success of our products and
service offerings, our ability to continue to innovate and meet the
demands of our customers for new or enhanced products, our ability to
successfully integrate assets and companies we have acquired, our
ability to effectively compete in the futures industry, changes in tax
policy or accounting rules, fluctuations in foreign exchange rates and
commodity prices, adverse changes or volatility in interest rates, as
well as general economic, business, credit and financial market
conditions, internationally or nationally, and our ability to continue
paying a quarterly dividend in light of future financial performance and
financing needs. The forward-looking statements included
herein represent GAIN Capital’s views as of the date of this release. GAIN
Capital undertakes no obligation to revise or update publicly any
forward-looking statement for any reason unless required by law.
Non-GAAP Financial Measures
EBITDA is a non-GAAP financial measure that represents our
historical and pro forma earnings before interest, taxes, depreciation,
amortization and non-recurring expenses. This non-GAAP
financial measure has certain limitations, including that it does not have a
standardized meaning and, therefore, our definition may be different
from similar non-GAAP financial measures used by other companies
and/or analysts. Thus, it may be more difficult to compare our
financial performance to that of other companies. We believe our reporting of
EBITDA assists investors in evaluating our historical and expected
operating performance. However, because EBITDA is not a measure of
financial performance calculated in accordance with GAAP, such measure
should be considered in addition to, but not as a substitute for,
other measures of our financial performance reported in accordance with
GAAP, such as net income. |
 ACQUISITION OF
GLOBAL FUTURES & FOREX, LTD
3
Glenn Stevens, CEO |
 Transaction Highlights
•
GAIN has signed a definitive agreement for the acquisition of Global Futures &
Forex, LTD (“GFT”)
•
The acquisition significantly enhances GAIN’s scale and position as an
industry leader with diverse revenue streams and product offerings
–
Large scale
•
Combined
2013
run-rate
revenue
(1)
:
$329mm
•
Pro forma client assets: ~$650mm
•
Pro forma FY 2012 volume: $4.6 trillion
–
Broader product offering
•
Total of 12,500 financial markets
•
OTC FX, CFDs, binary options, spread betting, FX options, exchange-traded
futures and options –
Diversified revenue streams
•
Expanded partner-based business
•
New institutional revenue stream from GFT’s Sales Trader business
•
Total commission-based business rises to 22% of revenue
•
Complementary technology and product functionality
•
Operating expense synergies of $35mm-$45mm
•
Regulatory capital synergies
4
(1)
Based on preliminary Q1 2013 results. |
 GFT
Overview •
Company Overview
–
Founded in 1997 and offers retail customers FX, CFDs, spread betting, binaries and
FX options
–
Headquarters in Grand Rapids, Michigan with offices located in London, Singapore,
Tokyo and Sydney
–
Customers
principally
trade
via
GFT’s
proprietary
Dealbook
360
platform
•
Customers & Operations
–
Over $190mm in customer assets
–
FY 2012 volume: $1.3 trillion
–
>75% of retail customer volume sourced through partners
–
Sales Trader (institutional-like) business generates 40% of total volume
•
Transaction discussions began immediately following GFT’s transfer of its
U.S. customer assets to GAIN in December 2012
5 |
 Financial
Summary of Transaction •
Net purchase price: $27.8mm
–
Represents
0.3x
FY 2012
revenue
and
1.7x
adjusted
pro
forma
FY 2012
EBITDA
(1)
–
Net cash on hand: $80.0mm
(2)
–
Total purchase price: $107.8mm
•
Transaction structure
–
GAIN equity: ~4.9mm shares
–
Cash: $40.0mm
–
Sr. Secured Note: $40.0mm
•
8.0% annual interest, payable quarterly
•
$1.5mm minimum quarterly amortization
•
Synergies
–
$35mm -
$45mm of estimated expense synergies
–
Additional regulatory capital synergies expected through the combination of
existing entities •
GAIN
expects
the
transaction
to
be
accretive
to
2H
2013
earnings
and
significantly accretive to FY
2014 earnings
•
Expected to close transaction in early Q3 2013
6
(1)
Assumes mid-point of $35mm-$45mm of expected year 1 synergies achieved.
A reconciliation of FY 2012 EBITDA to pro forma FY 2012
EBITDA is available in the appendix to this presentation.
(2)
As of March 31, 2013. |
 Strategic
Rationale •
Provides GAIN with significant scale with customer assets of ~$650mm, run-rate
revenue
of
$329mm,
run-rate
pro
forma
EBITDA
(1)
of
$77mm
and
approximately
140,000 customer accounts
•
Broadens
offering
to
include
over
12,500
products,
including
FX,
CFDs,
spread
betting, binaries, FX options and exchange-traded futures & options
•
Significantly expands partner-based business with GFT’s existing
relationships •
New institutional-like revenue stream with low fixed cost base from GFT’s
rapidly expanding Sales Trader business
•
Complementary technology and product functionality to existing GAIN
platforms •
Expands global footprint in key markets, including Continental Europe and S.E.
Asia •
Opportunity to take advantage of major synergies from overlapping operations
–
Estimated first-year operating synergies of $35mm-$45mm
–
Potential capital synergies
7
(1)
Pro Forma EBITDA assumes $40mm of estimated synergies achieved based on
mid-point of assumed year 1 synergies of $35mm-$45mm. |
 Synergies
•
As a result of the combination, GAIN expects to generate $35mm-$45mm of
incremental run-rate EBITDA
•
Operating synergies will be realized through:
–
Consolidation of redundant functions and office locations
–
Combined selling and marketing efforts
–
Reduced product and software development costs as a result of combinations of
platforms and back offices
–
Reduced data and communications, professional fees and other expenses as a result
of combination
•
Modest expense savings expected to be achieved in FY 2013
–
Full integration expected to be completed in 2014
•
Potential capital synergies as a result of overlapping regulatory requirements and
the freeing-up of a portion of collateral posted with trading
partners 8 |
 Benefits
for GAIN •
Immediate scale increase
–
Combination enhances scale and positioning in the global OTC market
–
Substantially increases GAIN’s key financial, trading and client
metrics –
Greater ability to withstand potential regulatory changes and market
volatility •
Significant operating synergies
–
Expected to be accretive to 2H 2013 earnings
–
Potential to realize approximately $35mm-$45mm of cost savings via
first-year synergies –
Potential to capitalize on additional operating and capital synergies
•
Diversifies revenue streams
–
Significant
expansion
of
CFDs
and
spread
betting
products
–
Institutionally-focused Sales Trader team complements and augments existing
institutional services and GTX platform
–
Enhances GAIN’s indirect distribution network by leveraging GFT’s skill
and experience in servicing large brokerage partners
•
Transaction enhances GAIN’s status as a successful industry
consolidator 9 |
 Transaction Benefits for Clients
•
Maintain quality of trading experience
•
Best of breed trading platforms, research and tools
•
Superior pricing and execution through combination of GAIN and GFT’s risk
management expertise
•
Robust multi-product offering which includes FX, CFDs, spread betting,
binaries, FX options and exchange traded futures and options
•
Enhanced access for clients in Europe, Asia and the Middle East
•
Financial strength and stability of combined company
10 |
 Pro
Forma GAIN Financials •
Both companies have seen a
significant rebound in financial and
operating performance in Q1 2013
11
(1)
EBITDA
is
a
non-GAAP
financial
measure
that
represents
earnings
before
interest,
taxes,
depreciation,
amortization
and
non-recurring
expenses.
A reconciliation of net income to EBITDA is available in the appendix to this
presentation. (2)
Pro forma EBITDA assumes $40mm of estimated synergies achieved based on
mid-point of assumed year 1 synergies of $35mm-$45mm. (3)
Pro forma EBITDA assumes $10mm of estimated Q1 synergies achieved based on
mid-point of assumed year 1 synergies of $35mm-$45mm. (4)
Assumes transaction closes in early Q3 2013.
(5)
FY 2013 EBITDA range assumes $20mm of estimated synergies achieved.
•
Based on FY Q1 2013 results and
the synergies available via the
transaction, GAIN believes that the
combined company will demonstrate
strong profitability in FY 2013
•
Both GAIN and GFT experienced a
decline in financial results during FY
2012, primarily due to the decline in
volatility and trading volume in the FX
market
($ in millions)
Q1 2013 Run-Rate
FY 2013 Range
(4)(5)
Revenue
$329
$230 -
$260
EBITDA
77
35 -
55
EBITDA Margin %
23%
15% -
21%
($ in millions)
Fiscal Year Ended December 31, 2012
GAIN
GFT
PF GAIN
Revenue
$151.4
$97.8
$249.2
EBITDA
(1)(2)
11.1
(23.4)
27.7
EBITDA Margin %
7%
NM
11%
($ in millions)
Quarter Ended March 31, 2013
GAIN
GFT
PF GAIN
Revenue
$49.8
$32.5
$82.3
EBITDA
(1)(3)
7.5
1.8
19.3
EBITDA Margin %
15%
6%
23%
Key Balance Sheet Data & Operating Metrics
Client Assets
$456.9
$192.2
$649.1
Funded Accounts
100,020
39,690
139,710
Y-o-Y Q1 Revenue Growth
50%
34% |
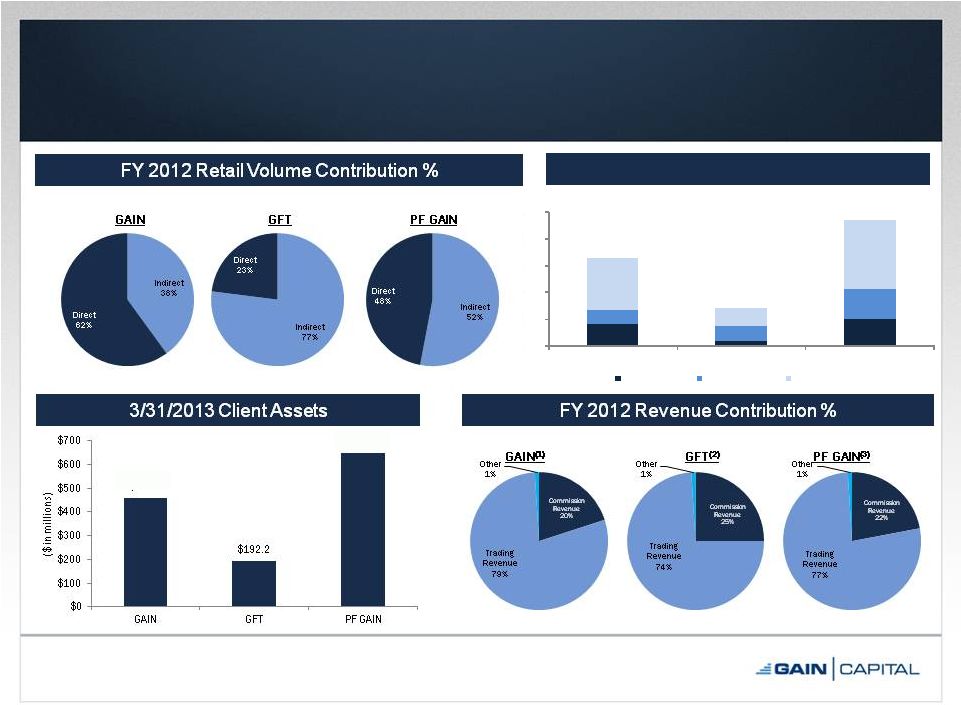 Pro
Forma Financial & Operating Metrics 12
(1)
Commission revenue represents PF 2012 to include full-year impact of OEC
acquisition. (2)
Commission revenue represents revenue from Sales Trader clients.
(3)
Commission
revenue
represents
revenue
from
Sales
Trader
clients,
GTX
and
full-year
impact
of
OEC
acquisition.
$0.8
$0.2
$1.0
$0.5
$0.6
$1.1
$2.0
$0.5
$2.5
$3.3
$1.3
$4.6
$0.0
$1.0
$2.0
$3.0
$4.0
$5.0
GAIN
GFT
PF GAIN
Retail -
Direct
Retail -
Indirect
Institutional
$649.1
$456.9
FY 2012 Trading Volume ($ in billions) |
 Q1 2013
PRELIMINARY HIGHLIGHTS Glenn Stevens, CEO
13 |
 14
•
Financials
–
Revenue: $49.8mm (50% year-over-year growth)
–
EBITDA
(1)
: $7.5mm (15% margin)
–
Net Income: $4.3mm
–
EPS: $0.11
•
Operating Metrics
–
Total trading volume: $1.3 trillion (+55%)
•
Retail volume: $433.9bn (+13%)
•
Institutional volume: $887.8bn (+90%)
–
Futures DARTs: 13,238
–
Client assets: $456.9mm (+40%)
–
Funded accounts: 100,020 (+36%)
Q1 2013 Preliminary Highlights
(Comparisons are referenced to Q1 2012)
(1) EBITDA is a non-GAAP financial measure that represents our earnings
before interest, taxes, depreciation, amortization and non-recurring expenses. |
 RESPONSE TO FXCM’S
UNSOLICITED TAKEOVER ATTEMPT
Glenn Stevens, CEO
15 |
 16
•
GAIN Capital received an unsolicited proposal dated April 8, 2013 from FXCM to
acquire GAIN for 0.3996 shares of FXCM Class A common stock for each share
of GAIN common stock •
GAIN’s
Board
of
Directors
conducted
a
thorough
review
of
the
proposal
with
the
assistance
of
its
financial and legal advisors
•
The Board determined that the sale of GAIN to FXCM on the terms proposed would not
be in the best interests of GAIN’s shareholders
•
The Board therefore unanimously rejected the proposal and reaffirmed its
commitment to GAIN’s strategic plan
•
The Board’s rejection of FXCM’s takeover proposal is based on the
following conclusions: –
The proposal does not properly value GAIN or the synergies in a combination of the
companies
–
The Board believes that GAIN’s stock has been undervalued in the public
markets –
The proposal is an opportunistic attempt by FXCM to capitalize on the nearly 40%
increase in FXCM’s stock price over the last five months and acquire
GAIN at a below-market premium while GAIN is trading near its
all-time lows –
GAIN’s
first
quarter
results
and
the
highly
strategic
and
synergistic
acquisition
of
GFT
demonstrate the value that the Board believes can be created through the execution
of the Company’s strategic plan
GAIN Capital Rejects FXCM’s Opportunistic
Takeover Proposal |
 17
•
Over the course of the last several months, GAIN’s common stock price has
declined from nearly $5.00
per
share
to
approximately
$4.27
per
share,
due
in
part
to
GAIN’s
disappointing
full
year
and fourth quarter 2012 amid challenging market conditions
•
Over this same period, FXCM’s common stock price increased by approximately
40%, from less than $9.00 per share to more than $14.00 per share as FXCM
has realized the benefit of consolidating its investment in FX market
making firm, Lucid Markets, into its results •
Both
GAIN
and
FXCM
benefitted
from
improved
market
conditions
in
1Q13;
FXCM
has
publicly
announced monthly volumes while GAIN disclosed preliminary results today
•
At no point in 2013 prior to the public declaration of FXCM’s proposal to
acquire GAIN did FXCM or its advisors contact GAIN to indicate their
interest in a merger or acquisition transaction between FXCM and GAIN
•
On April 8, 2013, FXCM publicly announced an unsolicited proposal to acquire GAIN
for 0.3996 shares of FXCM Class A common stock for each share of GAIN
common stock •
The following day, GAIN issued a press release acknowledging receipt of the
proposal and stating the Board would consider the proposal, as well as a
range of options to build shareholder value Recent Events
|
 18
•
FXCM stated that it believes that GAIN’s EBITDA contribution, including
synergies, will be between $35 million and $55 million in 2014 and $50
million and $70 million in 2015
–
GAIN believes that these projections underestimate GAIN’s EBITDA before
synergies and / or the synergies available in a combination of the
companies –
FXCM’s offer represents only approximately 3x to 4x FXCM’s estimate of
GAIN’s EBITDA contribution, including GAIN’s cash balance
•
GAIN is successfully executing an organic growth strategy focused on
diversifying its retail product offering and institutional services, as well as
pursuing targeted, synergistic acquisitions
The Proposal Does Not Properly Value GAIN or
Synergies |
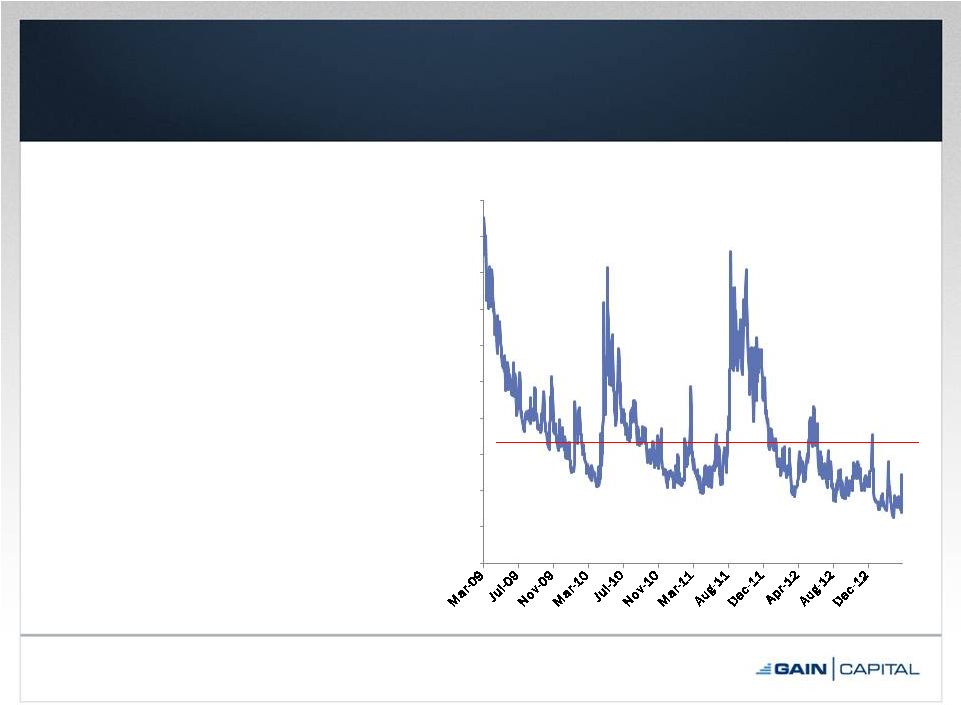 19
•
Volatility and FX trading volume metrics
are the primary drivers of GAIN’s
business and fell to multi-year lows in
2012
–
This has had a substantial negative
impact on GAIN’s financial results,
stock price and valuation
•
During 2012, GAIN took measures to
reduce expenses, bolster the product
offering and the scale of its retail
business, grow its institutional platform
and expand into exchange-based
products
•
Together with higher levels of volatility
and trading volume in early 2013, these
initiatives have positioned GAIN for
substantially improved growth and
profitability, as evidenced by its strong
first quarter results
GAIN’s Stock Has Been Undervalued in the
Public Markets
Source: S&P CapitalIQ as of 4/19/13.
Average: 22.4
5
10
15
20
25
30
35
40
45
50
55
CVIX Volatility Index |
 •
FXCM is attempting to capitalize on the recent substantial increase in its stock
price and use its highly-valued stock as a currency to acquire GAIN at
a time when GAIN is trading near its all-time low
20
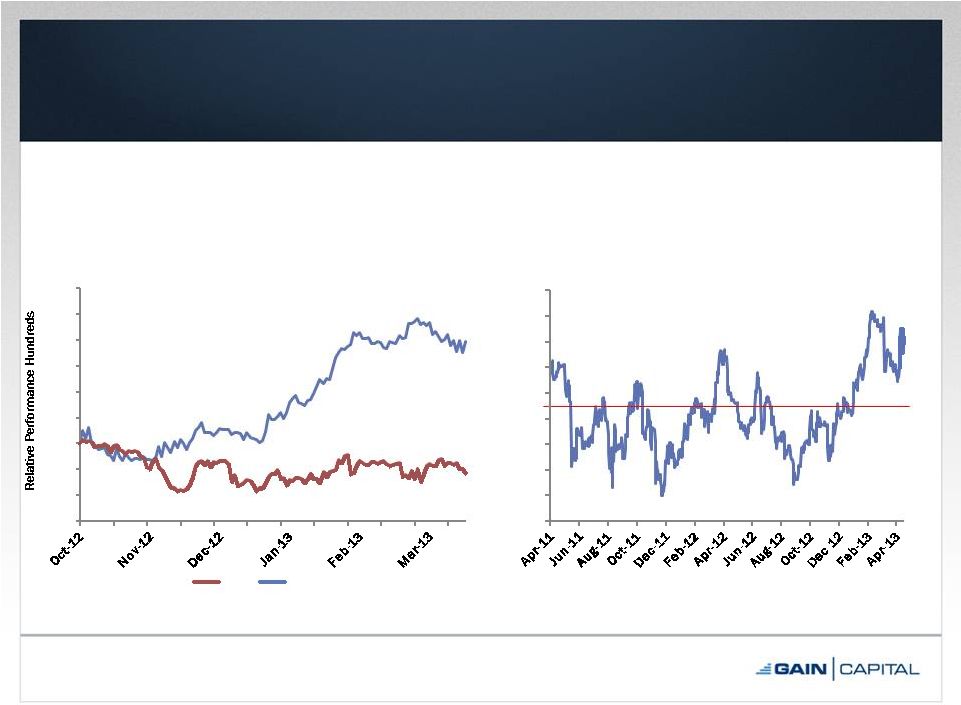
FXCM’s Takeover Attempt is Opportunistic
Source: S&P CapitalIQ as of 4/8/13.
Source: S&P CapitalIQ.
70%
80%
90%
100%
110%
120%
130%
140%
150%
160%
FXCM and GAIN Recent Relative Stock Price Performance
GAIN
FXCM
8.0x
9.0x
10.0x
11.0x
12.0x
13.0x
14.0x
15.0x
16.0x
17.0x
FXCM NTM Price-to-Earnings Ratio Over Last Two Years
39.0%
(11.6%)
15.1x
Average: 12.2x
Current Multiple 24%
Premium to Average |
 21
•
FXCM’s proposed exchange ratio is well-below the exchange ratio prior to
the recent increase in FXCM’s stock price and decrease in GAIN’s
stock price FXCM’s Takeover Attempt is Opportunistic
FXCM Proposed Exchange Ratio: 0.40x
Source: Share price metrics from CapitalIQ as of 4/8/13.
Average Exchange Ratio: 0.52x
Average Exchange Ratio with 40% Control Premium: 0.73x
0.20x
0.30x
0.40x
0.50x
0.60x
0.70x
0.80x
Historical Exchange Ratio since GAIN’s IPO |
 22
•
We believe that GAIN is strongly positioned to create value for our common
stockholders through our core strengths and growth strategies:
–
Innovative technology
–
Strong brand recognition in the OTC market
–
Global OTC market opportunity
–
State-of-the-art institutional platform
–
Diversifying product offerings, target markets and revenue streams
–
Strategic and synergistic acquisitions
–
Management of costs in response to the market environment
–
Return of capital through dividends and buybacks
•
Our strong first quarter results demonstrate our ability to create revenue and
earnings growth through the execution of our organic strategy
•
The acquisition of GFT demonstrates our ability to drive industry consolidation to
create additional shareholder value
•
We will act in the best interests of our shareholders and will carefully review
every opportunity to maximize long-term shareholder value
GAIN and its Board of Directors Are Committed
to Our Shareholders Interests |
 CLOSING
REMARKS Glenn Stevens, CEO
23 |
 Transaction Highlights
•
GAIN has signed a definitive agreement for the acquisition of Global Futures &
Forex, LTD (“GFT”)
•
The acquisition significantly enhances GAIN’s scale and position as an
industry leader with diverse revenue streams and product offerings
–
Large scale
•
Combined
2013
run-rate
revenue
(1)
:
$329mm
•
Pro forma client assets: ~$650mm
•
Pro forma FY 2012 volume: $4.6 trillion
–
Broader product offering
•
Total of 12,500 financial markets
•
OTC FX, CFDs, binary options, spread betting, FX options, exchange-traded
futures and options –
Diversified revenue streams
•
Expanded partner-based business
•
New
institutional
revenue
stream
from
GFT’s
Sales
Trader
business
•
Total commission-based business rises to 22% of revenue
•
Complementary technology and product functionality
•
Operating expense synergies of $35mm-$45mm
•
Regulatory capital synergies
24
(1)
Based on preliminary Q1 2013 results. |
 Closing
Remarks •
Transformative acquisition of GFT will create market-leading
company with scale and diversity of revenues and products to drive
further growth
•
Improved
1Q13
results
show
GAIN
is
well
positioned
to
capitalize
on
higher volatility
•
GAIN’s Board believes that these factors will create greater
shareholder value than FXCM proposal
25 |
 APPENDIX
26 |
 EBITDA
& Margin Reconciliation 27
(1)
Non-recurring expenses relating to cost savings effected in 2Q 2012.
(2)
EBITDA margin is calculated as EBITDA divided by net revenue (ex. interest
expense). (3)
Assumes $10mm of estimated Q1 synergies achieved based on mid-point of assumed
year 1 synergies of $35mm-$45mm. ($ in millions)
FYE December 31, 2012
3 Months Ended March 31, 2013
Gain
GFT
Gain
GFT
Net revenue
151.4
$
97.8
$
49.8
$
32.5
$
Interest expense
0.4
-
0.1
-
Net revenue (ex. interest expense)
151.8
$
97.8
$
49.9
$
32.5
$
Net income / (loss)
2.6
$
(32.7)
$
4.3
$
(2.4)
$
Depreciation and amortization
4.9
9.5
1.6
2.2
Purchased intangible amortization
4.1
-
0.6
-
Interest expense
0.4
-
0.1
-
Restructuring
(1)
0.6
-
-
-
Income tax expense / (benefit)
(1.5)
(0.2)
0.9
2.0
EBITDA
11.1
$
(23.4)
$
7.5
$
1.8
$
EBITDA Margin %
(2)
7%
NM
15%
6%
($ in millions)
3 Months Ended March 31, 2013
Gain
GFT
Synergies
(3)
PF GAIN
Net revenue (ex. interest expense)
49.9
$
32.5
$
-
$
82.4
$
EBITDA
7.5
1.8
10.0
19.3
EBITDA Margin %
15%
6%
NM
23%
Net revenue
$
49.8 32.5
$
-
$
82.3
$
Interest expense
0.1
-
-
0.1
(2) |
 GFT Pro
Forma EBITDA Reconciliation 28
(1)
Assumes mid-point of $35mm-$45mm of expected year 1 synergies
achieved. ($ in millions)
GFT
FY 2012 EBITDA
(23.4)
$
Plus: Synergies
(1)
40.0
FY 2012 Pro Forma EBITDA
16.6
$
Net Purchase Price
27.8
$
FY 2012 Adjusted EBITDA
16.6
FY 2012 Pro Forma EBITDA Multiple
1.7x |
 GFT
Acquisition Announcement & Q1 2013 Preliminary Results
April 2013 |