Attached files
| file | filename |
|---|---|
| 8-K - 8-K - Altisource Portfolio Solutions S.A. | a13-10821_18k.htm |
Exhibit 99.1
|
|
Lenders Presentation April 25, 2013 |
|
|
Forward Looking Statements/Non-GAAP Measures This presentation and the accompanying earnings release contains forward-looking statements. These statements may be identified by words such as “anticipate,” “intend,” “expect,” “may,” “could,” “should,” “would,” “plan,” “estimate,” “seek,” “believe” and similar expressions. We caution that forward-looking statements are qualified to certain risks and uncertainties that could cause actual results and events to differ materially from what is contemplated by the forward-looking statements. Factors which could cause actual results to differ materially from these forward looking statements may include, without limitation, general economic conditions, conditions in the markets in which Altisource™ is engaged, behavior of customers, suppliers and/or competitors, technological developments and regulatory rules. In addition, financial risks such as currency movements, liquidity and credit risks could influence future results. The foregoing list of factors should not be construed as exhaustive. Altisource™ disclaims any intention or obligation to publicly update or revise any forward-looking statements, whether as a result of new information, future events or otherwise. Altisource management utilizes certain non-GAAP measures such as earnings before interest, taxes, depreciation and amortization, or EBITDA, as a key metric in evaluating its financial performance. EBITDA should be considered in addition to, rather than as a substitute for, income before income taxes, net income attributable to Altisource and cash flows from operations. This non-GAAP measure is presented as supplemental information and reconciled to net income attributable to Altisource in the Appendix |
|
|
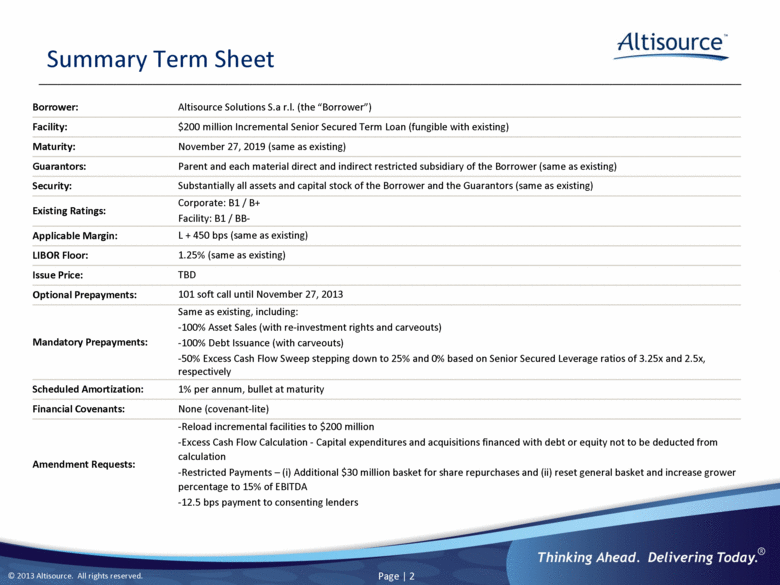
Summary Term Sheet Borrower: Altisource Solutions S.a r.l. (the “Borrower”) Facility: $200 million Incremental Senior Secured Term Loan (fungible with existing) Maturity: November 27, 2019 (same as existing) Guarantors: Parent and each material direct and indirect restricted subsidiary of the Borrower (same as existing) Security: Substantially all assets and capital stock of the Borrower and the Guarantors (same as existing) Existing Ratings: Corporate: B1 / B+ Facility: B1 / BB- Applicable Margin: L + 450 bps (same as existing) LIBOR Floor: 1.25% (same as existing) Issue Price: TBD Optional Prepayments: 101 soft call until November 27, 2013 Mandatory Prepayments: Same as existing, including: -100% Asset Sales (with re-investment rights and carveouts) -100% Debt Issuance (with carveouts) -50% Excess Cash Flow Sweep stepping down to 25% and 0% based on Senior Secured Leverage ratios of 3.25x and 2.5x, respectively Scheduled Amortization: 1% per annum, bullet at maturity Financial Covenants: None (covenant-lite) Amendment Requests: - Reload incremental facilities to $200 million-Excess Cash Flow Calculation - Capital expenditures and acquisitions financed with debt or equity not to be deducted from calculation-Restricted Payments – (i) Additional $30 million basket for share repurchases and (ii) reset general basket and increase grower percentage to 15% of EBITDA - 12.5 bps payment to consenting lenders |
|
|
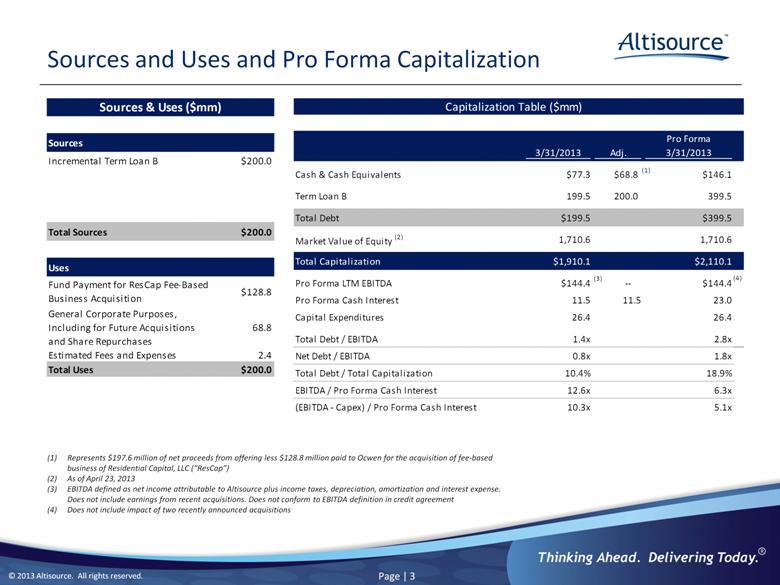
Sources and Uses and Pro Forma Capitalization (1) Represents $197.6 million of net proceeds from offering less $128.8 million paid to Ocwen for the acquisition of fee-based business of Residential Capital, LLC (“ResCap”) (2) As of April 23, 2013 (3) EBITDA defined as net income attributable to Altisource plus income taxes, depreciation, amortization and interest expense. Does not include earnings from recent acquisitions. Does not conform to EBITDA definition in credit agreement (4) Does not include impact of two recently announced acquisitions Capitalization Table ($mm) Pro Forma 3/31/2013 Adj. 3/31/2013 Cash & Cash Equivalents $77.3 $68.8 $146.1 Term Loan B 199.5 200.0 399.5 Total Debt $199.5 $399.5 Market Value of Equity (2) 1,710.6 1,710.6 Total Capitalization $1,910.1 $2,110.1 Pro Forma LTM EBITDA $144.4 -- $144.4 Pro Forma Cash Interest 11.5 11.5 23.0 Capital Expenditures 26.4 26.4 Total Debt / EBITDA 1.4x 2.8x Net Debt / EBITDA 0.8x 1.8x Total Debt / Total Capitalization 10.4% 18.9% EBITDA / Pro Forma Cash Interest 12.6x 6.3x (EBITDA - Capex) / Pro Forma Cash Interest 10.3x 5.1x (1) (3) (4) Sources & Uses ($mm) Sources Incremental Term Loan B $200.0 Total sources $200.0 Uses Fund Payment for ResCap Fee-Based Business Acquisition $128.8 General Corporate Purposes, Including for Future Acquisitions and Share Repurchases 68.8 Estimated Fees and Expenses 2.4 Total Uses $200.0 |
|
|
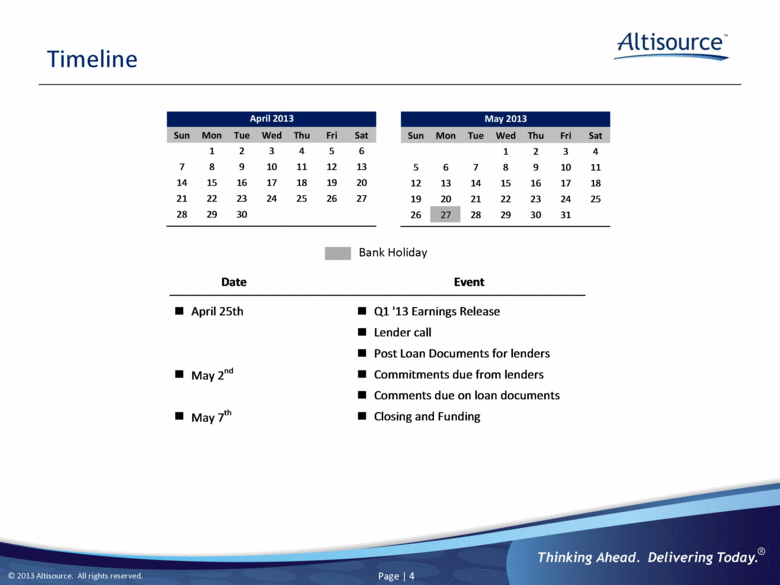
Timeline Bank Holiday April 2013 Sun Mon Tue Wed Thu Fri Sat 1 2 3 4 5 6 7 8 9 10 11 12 13 14 15 16 17 18 19 20 21 22 23 24 25 26 27 28 29 30 Date Event April 25th Q1 '13 Earnings Release Lender call Post Loan Documents for lenders May 2nd Commitments due from lenders Comments due on loan documents May 7th Closing and Funding May 2013 Sun Mon Tue Wed Thu Fri Sat 1 2 3 4 5 6 7 8 9 10 11 12 13 14 15 16 17 18 19 20 21 22 23 24 25 26 27 28 29 30 31 |
|
|
Management Presenters William B. Shepro, Chief Executive Officer Mark F. Kearns, Chief Accounting Officer |
|
|
Company Overview |
|
|
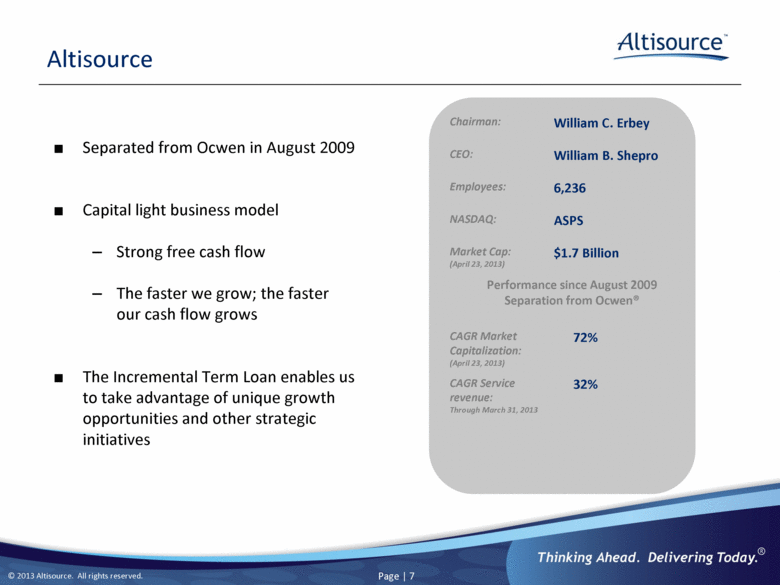
Chairman: William C. Erbey CEO: William B. Shepro Employees: 6,236 NASDAQ: ASPS Market Cap: (April 23, 2013) $1.7 Billion Performance since August 2009 Separation from Ocwen® CAGR Market Capitalization: (April 23, 2013) 72% CAGR Service revenue: Through March 31, 2013 32% Altisource Separated from Ocwen in August 2009 Capital light business model Strong free cash flow The faster we grow; the faster our cash flow grows The Incremental Term Loan enables us to take advantage of unique growth opportunities and other strategic initiatives |
|
|
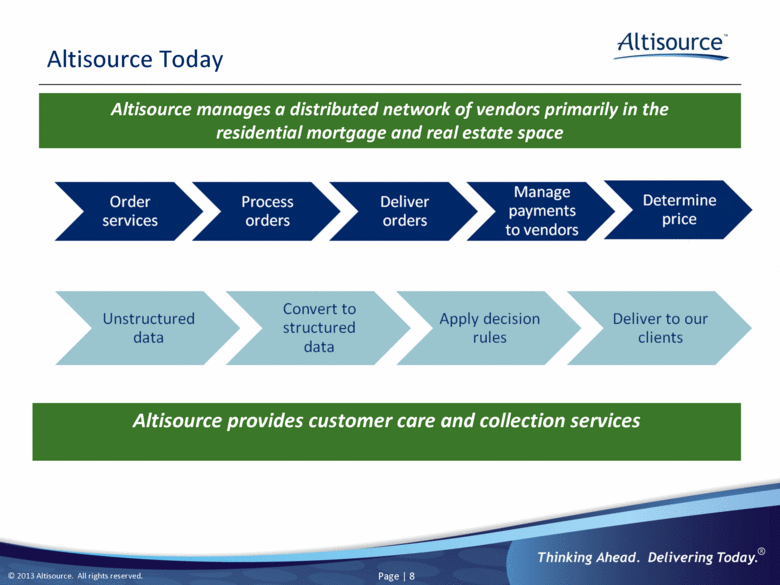
Altisource Today Altisource manages a distributed network of vendors primarily in the residential mortgage and real estate space Altisource provides customer care and collection services Order Services Procoess orders Deliver orders Manage payments to vendors Determine price Unstructured data Convert to structured data Apply decision rules Deliver to our clients |
|
|
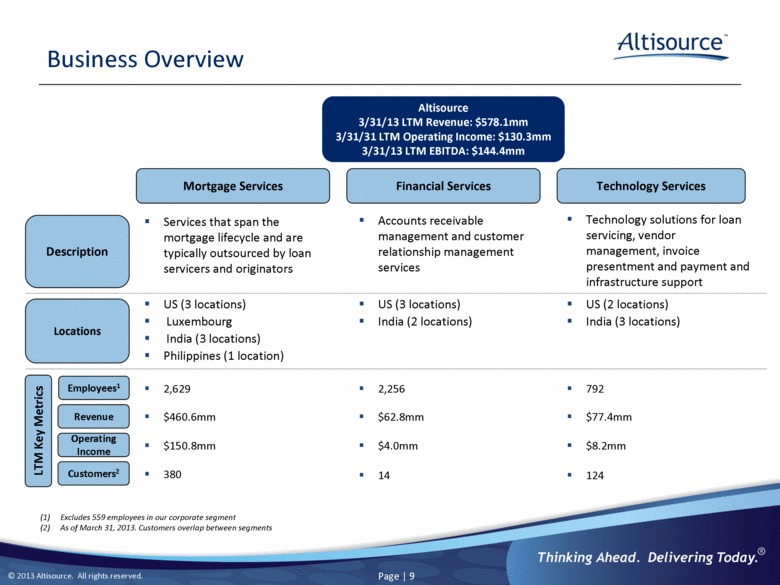
Business Overview (1) Excludes 559 employees in our corporate segment (2) As of March 31, 2013. Customers overlap between segments Services that span the mortgage lifecycle and are typically outsourced by loan servicers and originators Accounts receivable management and customer relationship management services Technology solutions for loan servicing, vendor management, invoice presentment and payment and infrastructure support US (3 locations) Luxembourg India (3 locations) Philippines (1 location) 2,629 2,256 792 $460.6mm $62.8mm $77.4mm $150.8mm $4.0mm $8.2mm Technology Services Mortgage Services Altisource 3/31/13 LTM Revenue: $578.1mm 3/31/31 LTM Operating Income: $130.3mm 3/31/13 LTM EBITDA: $144.4mm Financial Services Description Locations Employees1 LTM Key Metrics Revenue Operating Income Customers2 14 124 380 US (3 locations) India (2 locations) US (2 locations) India (3 locations) |
|
|
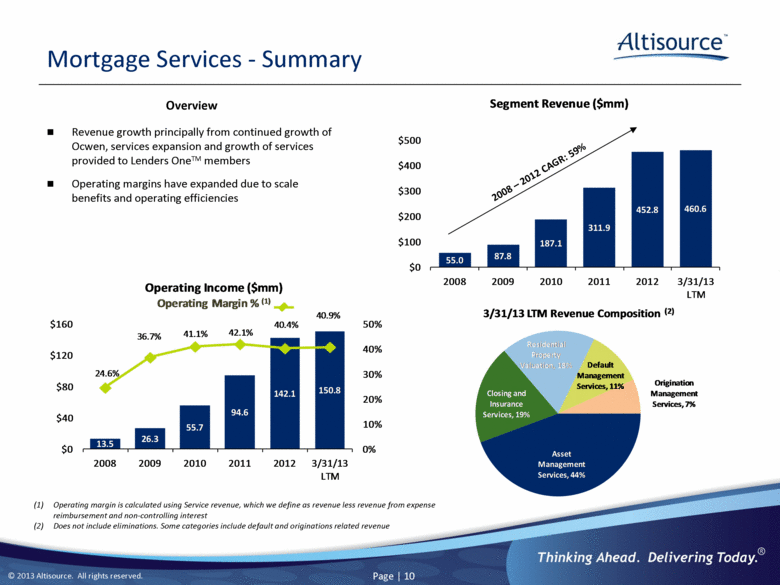
Mortgage Services - Summary Revenue growth principally from continued growth of Ocwen, services expansion and growth of services provided to Lenders OneTM members Operating margins have expanded due to scale benefits and operating efficiencies Overview 2008 – 2012 CAGR: 59% Operating margin is calculated using Service revenue, which we define as revenue less revenue from expense reimbursement and non-controlling interest Does not include eliminations. Some categories include default and originations related revenue 13.5 26.3 55.7 94.6 142.1 150.8 24.6% 36.7% 41.1% 42.1% 40.4% 40.9% 0% 10% 20% 30% 40% 50% $0 $40 $80 $120 $160 2008 2009 2010 2011 2012 3/31/13 LTM Operating Income ($mm) Operating Margin % (1) Asset Management Services, 44% Closing and Insurance Services, 19% Residential Property Valuation, 18% Default Management Services, 11% Origination Management Services, 7% 3/31/13 LTM Revenue Composition (2) Segment Revenue ($mm) $500 $400 $300 $200 $100 $0 55.0 87.8 187.1 311.9 452.8 460.6 2008- 2012 CAGR: 59% 2008 2009 2010 2011 2012 3/31/13 LTM |
|
|
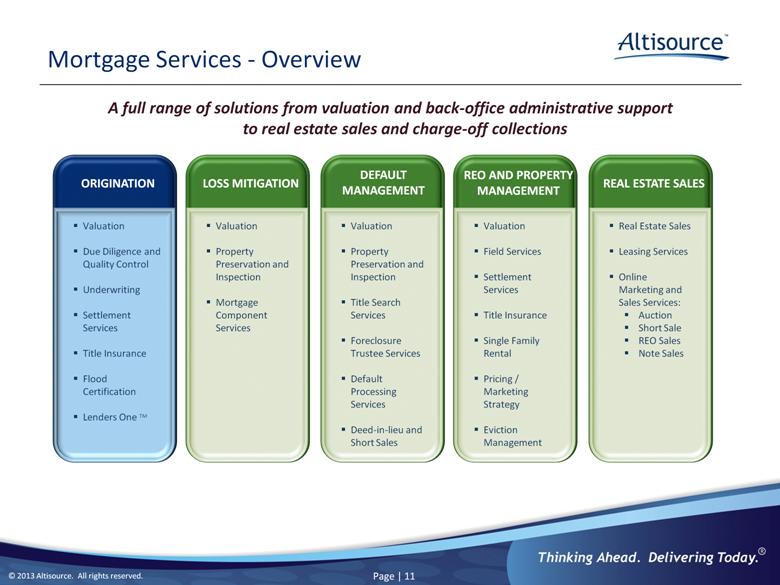
Mortgage Services - Overview A full range of solutions from valuation and back-office administrative support to real estate sales and charge-off collections Valuation Due Diligence and Quality Control Underwriting Settlement Services Title Insurance Flood Certification Lenders One TM ORIGINATION Valuation Property Preservation and Inspection Mortgage Component Services LOSS MITIGATION Valuation Property Preservation and Inspection Title Search Services Foreclosure Trustee Services Default Processing Services Deed-in-lieu and Short Sales DEFAULT MANAGEMENT Valuation Field Services Settlement Services Title Insurance Single Family Rental Pricing / Marketing Strategy Eviction Management REO AND PROPERTY MANAGEMENT Real Estate Sales Leasing Services Online Marketing and Sales Services: Auction Short Sale REO Sales Note Sales REAL ESTATE SALES |
|
|
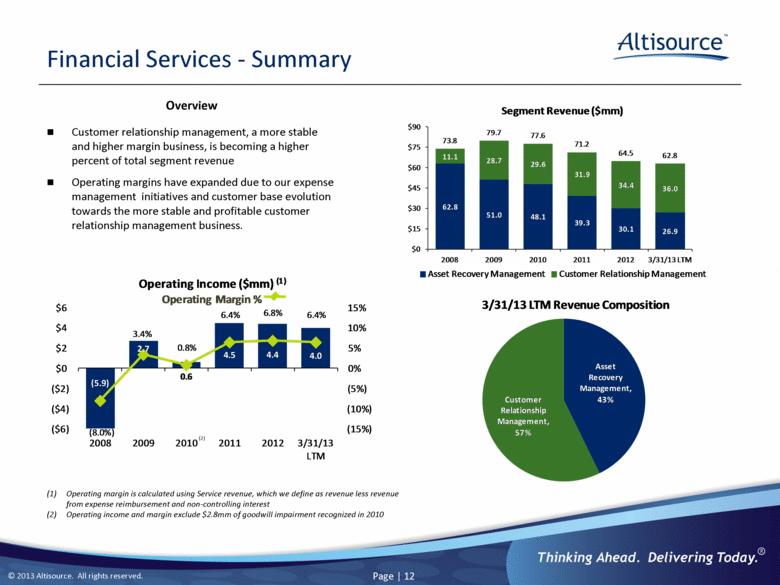
Operating margin is calculated using Service revenue, which we define as revenue less revenue from expense reimbursement and non-controlling interest Operating income and margin exclude $2.8mm of goodwill impairment recognized in 2010 Financial Services - Summary Customer relationship management, a more stable and higher margin business, is becoming a higher percent of total segment revenue Operating margins have expanded due to our expense management initiatives and customer base evolution towards the more stable and profitable customer relationship management business. Overview (2) 62.8 51.0 48.1 39.3 30.1 26.9 11.1 28.7 29.6 31.9 34.4 36.0 73.8 79.7 77.6 71.2 64.5 62.8 $0 $15 $30 $45 $60 $75 $90 2008 2009 2010 2011 2012 3/31/13 LTM Segment Revenue ($mm) Asset Recovery Management Customer Relationship Management Asset Recovery Management, 43% Customer Relationship Management, 57% 3/31/13 LTM Revenue Composition Operating Income ($mm) (1) Operating Margin % $6 $4 $2 $0 ($2) ($4) ($6) (5.9) (8.0%) 2.7 3.4% 0.6 0.8% 4.5 6.4% 4.4 6.8% 6.4% 4.0 15% 10% 5% 0% (5%) 0% (5%) (10%) (15%) 2008 2009 2010(2) 2011 2012 3/31/13 LTM |
|
|
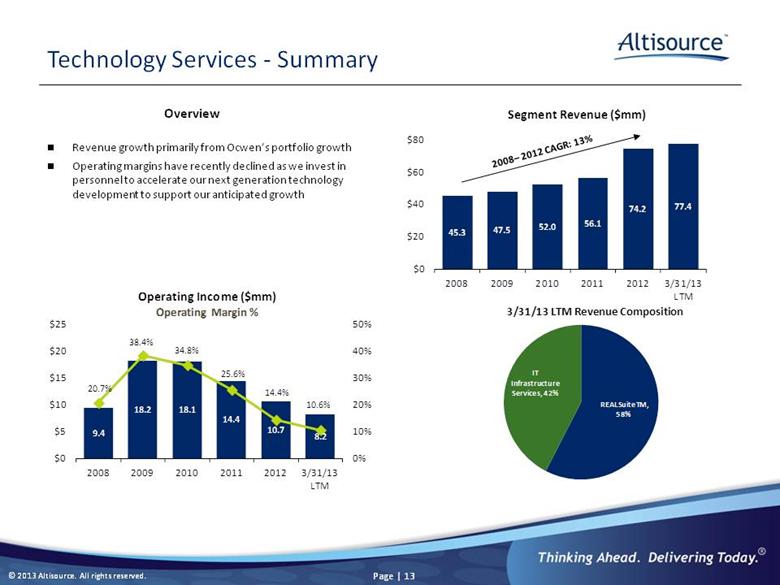
Technology Services - Summary Revenue growth primarily from Ocwen’s portfolio growth Operating margins have recently declined as we invest in personnel to accelerate our next generation technology development to support our anticipated growth 2008– 2012 CAGR: 13% Overview 45.3 47.5 52.0 56.1 74.2 77.4 $0 $20 $40 $60 $80 2008 2009 2010 2011 2012 3/31/13 LTM Segment Revenue ($mm) 56% 9.4 18.2 18.1 14.4 10.7 8.2 20.7% 38.4% 34.8% 25.6% 14.4% 10.6% 0% 10% 20% 30% 40% 50% $0 $5 $10 $15 $20 $25 2008 2009 2010 2011 2012 3/31/13 LTM Operating Income ($mm) Operating Margin % REALSuiteTM, 58% IT Infrastructure Services, 42% 3/31/13 LTM Revenue Composition Service Revenue from Originations ($ millions) Customers with Signed Services Agreement (3) N $12 $10 $8 $6 $4 $2 $0 30 52 67 71 80 99 108 128 158 165 180 150 120 90 60 30 0 Q4’10 Q1’11 Q2’11 Q3’11 Q4’11 Q1’12 Q2’12 Q3’12 Q4’12 Q1’13 |
|
|
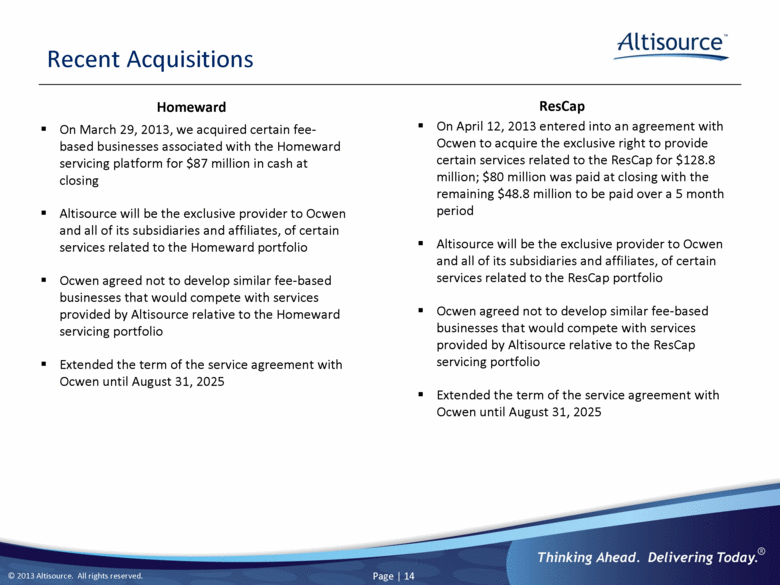
Recent Acquisitions Homeward ResCap On March 29, 2013, we acquired certain fee-based businesses associated with the Homeward servicing platform for $87 million in cash at closing Altisource will be the exclusive provider to Ocwen and all of its subsidiaries and affiliates, of certain services related to the Homeward portfolio Ocwen agreed not to develop similar fee-based businesses that would compete with services provided by Altisource relative to the Homeward servicing portfolio Extended the term of the service agreement with Ocwen until August 31, 2025 On April 12, 2013 entered into an agreement with Ocwen to acquire the exclusive right to provide certain services related to the ResCap for $128.8 million; $80 million was paid at closing with the remaining $48.8 million to be paid over a 5 month period Altisource will be the exclusive provider to Ocwen and all of its subsidiaries and affiliates, of certain services related to the ResCap portfolio Ocwen agreed not to develop similar fee-based businesses that would compete with services provided by Altisource relative to the ResCap servicing portfolio Extended the term of the service agreement with Ocwen until August 31, 2025 |
|
|
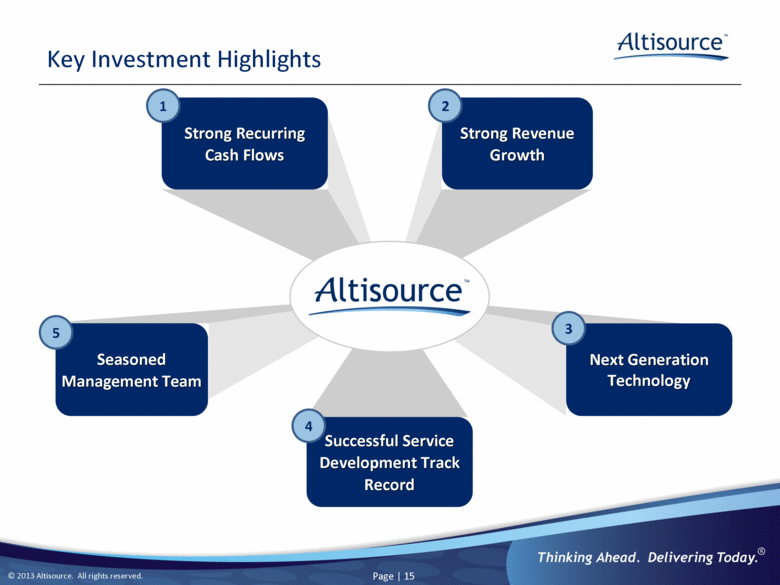
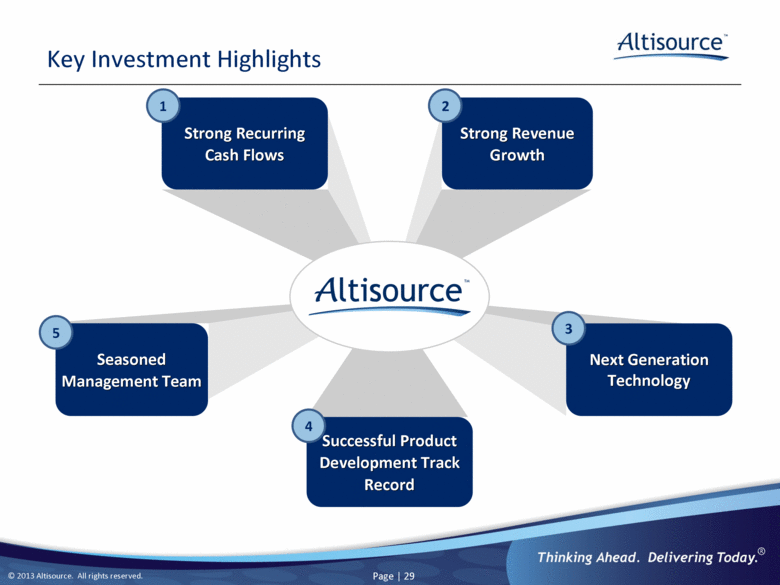
Key Investment Highlights Successful Service Development Track Record Strong Recurring Cash Flows Seasoned Management Team Next Generation Technology Strong Revenue Growth 1 2 3 4 5 |
|
|
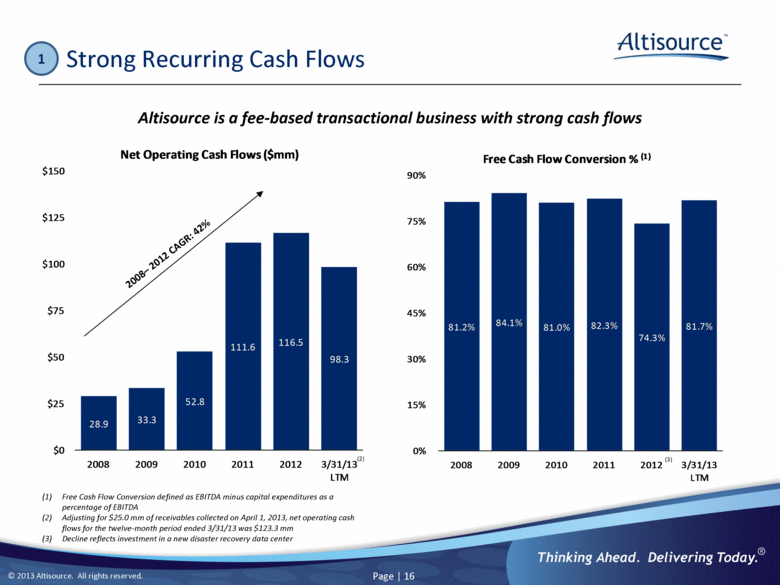
Strong Recurring Cash Flows Altisource is a fee-based transactional business with strong cash flows 2008– 2012 CAGR: 42% 1 Free Cash Flow Conversion defined as EBITDA minus capital expenditures as a percentage of EBITDA Adjusting for $25.0 mm of receivables collected on April 1, 2013, net operating cash flows for the twelve-month period ended 3/31/13 was $123.3 mm Decline reflects investment in a new disaster recovery data center (3) (2) 28.9 33.3 52.8 111.6 116.5 98.3 $0 $25 $50 $75 $100 $125 $150 2008 2009 2010 2011 2012 3/31/13 LTM Net Operating Cash Flows ($mm) 81.2% 84.1% 81.0% 82.3% 74.3% 81.7% 0% 15% 30% 45% 60% 75% 90% 2008 2009 2010 2011 2012 3/31/13 LTM Free Cash Flow Conversion % (1) |
|
|
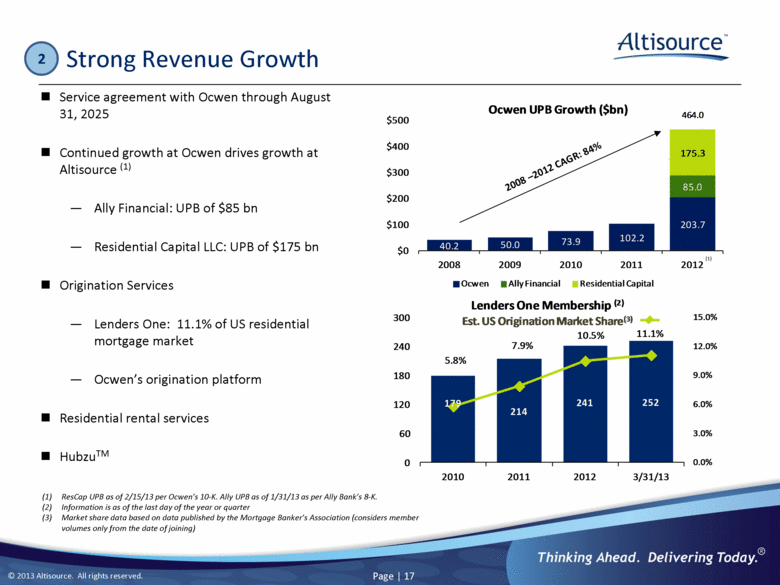
Service agreement with Ocwen through August 31, 2025 Continued growth at Ocwen drives growth at Altisource (1) Ally Financial: UPB of $85 bn Residential Capital LLC: UPB of $175 bn Origination Services Lenders One: 11.1% of US residential mortgage market Ocwen’s origination platform Residential rental services HubzuTM Strong Revenue Growth 2 (1) ResCap UPB as of 2/15/13 per Ocwen’s 10-K. Ally UPB as of 1/31/13 as per Ally Bank’s 8-K. (2) Information is as of the last day of the year or quarter (3) Market share data based on data published by the Mortgage Banker’s Association (considers member volumes only from the date of joining) 2008 –2012 CAGR: 84% (1) 179 214 241 252 5.8% 7.9% 10.5% 11.1% 0.0% 3.0% 6.0% 9.0% 12.0% 15.0% 0 60 120 180 240 300 2010 2011 2012 3/31/13 Lenders One Membership (2) Est. US Origination Market Share (3) 40.2 50.0 73.9 102.2 203.7 85.0 175.3 464.0 $0 $100 $200 $300 $400 $500 2008 2009 2010 2011 2012 Ocwen UPB Growth ($bn) Ocwen Ally Financial Residential Capital |
|
|
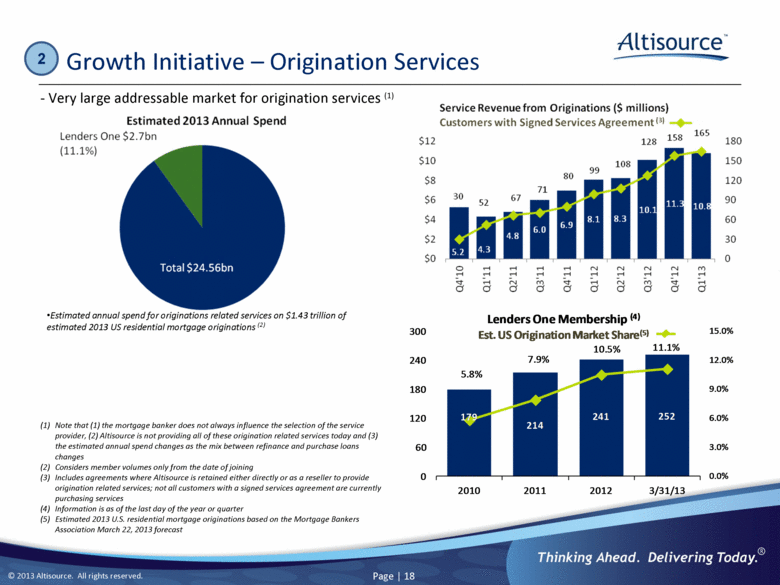
Note that (1) the mortgage banker does not always influence the selection of the service provider, (2) Altisource is not providing all of these origination related services today and (3) the estimated annual spend changes as the mix between refinance and purchase loans changes Considers member volumes only from the date of joining Includes agreements where Altisource is retained either directly or as a reseller to provide origination related services; not all customers with a signed services agreement are currently purchasing services Information is as of the last day of the year or quarter Estimated 2013 U.S. residential mortgage originations based on the Mortgage Bankers Association March 22, 2013 forecast Growth Initiative – Origination Services Total $28.8bn - Very large addressable market for origination services (1) Estimated annual spend for originations related services on $1.43 trillion of estimated 2013 US residential mortgage originations (2) 2 179 214 241 252 5.8% 7.9% 10.5% 11.1% 0.0% 3.0% 6.0% 9.0% 12.0% 15.0% 0 60 120 180 240 300 2010 2011 2012 3/31/13 Lenders One Membership (4) Est. US Origination Market Share (5) |
|
|
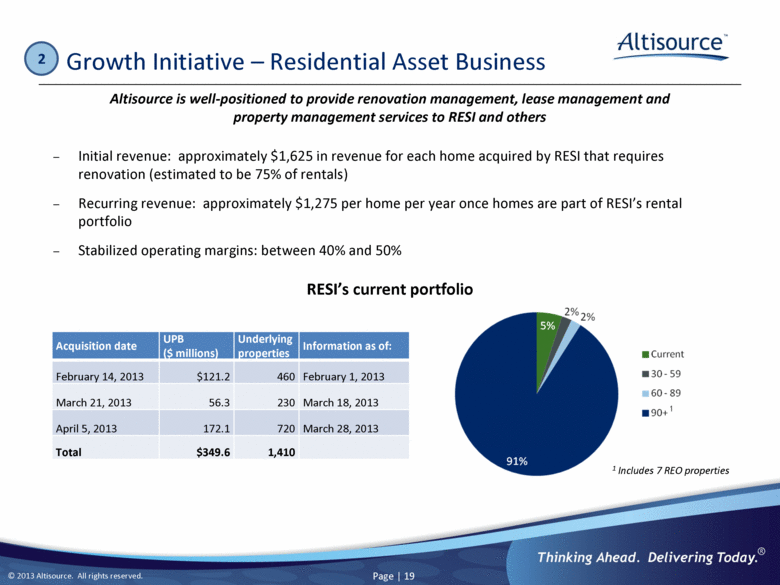
Growth Initiative – Residential Asset Business 2 Initial revenue: approximately $1,625 in revenue for each home acquired by RESI that requires renovation (estimated to be 75% of rentals) Recurring revenue: approximately $1,275 per home per year once homes are part of RESI’s rental portfolio Stabilized operating margins: between 40% and 50% RESI’s current portfolio Acquisition date UPB ($ millions) Underlying properties Information as of: February 14, 2013 $121.2 460 February 1, 2013 March 21, 2013 56.3 230 March 18, 2013 April 5, 2013 172.1 720 March 28, 2013 Total $349.6 1,410 1 Includes 7 REO properties Altisource is well-positioned to provide renovation management, lease management and property management services to RESI and others 5% 2% 2% 91% Current 30-59 60-89 90+ 1 |
|
|
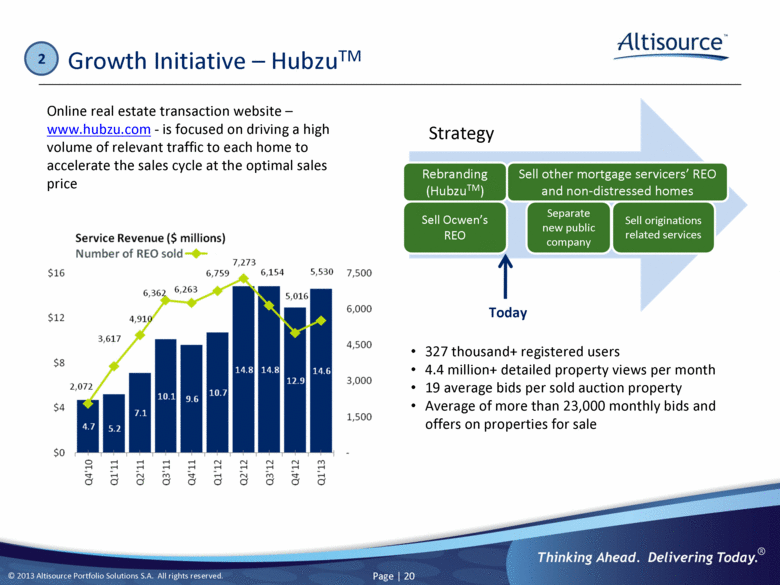
Growth Initiative – HubzuTM Strategy Today Online real estate transaction website – www.hubzu.com - is focused on driving a high volume of relevant traffic to each home to accelerate the sales cycle at the optimal sales price Rebranding (HubzuTM) Sell other mortgage servicers’ REO and non-distressed homes Sell Ocwen’s REO Separate new public company Sell originations related services 327 thousand+ registered users 4.4 million+ detailed property views per month 19 average bids per sold auction property Average of more than 23,000 monthly bids and offers on properties for sale 2 Service Revenue ($ millions) Number of REO sold R $16 $12 $8 $4 $0 2,072 3,617 4,910 6,362 6,263 6,759 7,273 6,154 5,016 5,530 7,500 6,000 4,500 3,000 1,500 Q4’10 Q1’11 Q2’11 Q3’11 Q4’11 Q1’12 Q2’12 Q3’12 Q4’12 Q1’13 |
|
|
Next Generation Technology 3 Extensible, scalable and secure technology platform drives services delivery and innovation Next generation technology supports the essence of what Altisource does: manages a distributed network of vendors processes the work delivers the product to our clients pays the vendors collects receivables Allows Altisource to operate in a much more efficient and effective manner, increasing margins for Altisource and our clients Supports Altisource’s growth |
|
|
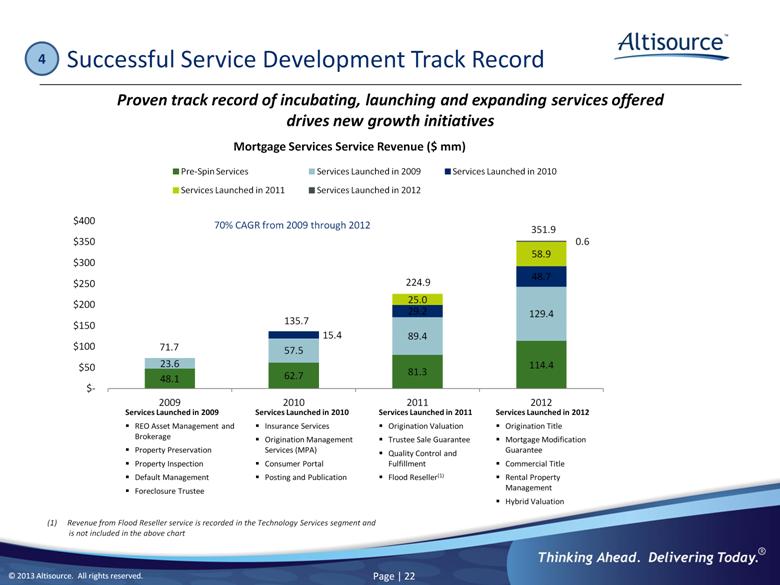
Proven track record of incubating, launching and expanding services offered drives new growth initiatives Successful Service Development Track Record 4 Services Launched in 2009 REO Asset Management and Brokerage Property Preservation Property Inspection Default Management Foreclosure Trustee Services Launched in 2010 Insurance Services Origination Management Services (MPA) Consumer Portal Posting and Publication Services Launched in 2011 Origination Valuation Trustee Sale Guarantee Quality Control and Fulfillment Flood Reseller(1) Revenue from Flood Reseller service is recorded in the Technology Services segment and is not included in the above chart Services Launched in 2012 Origination Title Mortgage Modification Guarantee Commercial Title Rental Property Management Hybrid Valuation 70% CAGR from 2009 through 2012 |
|
|
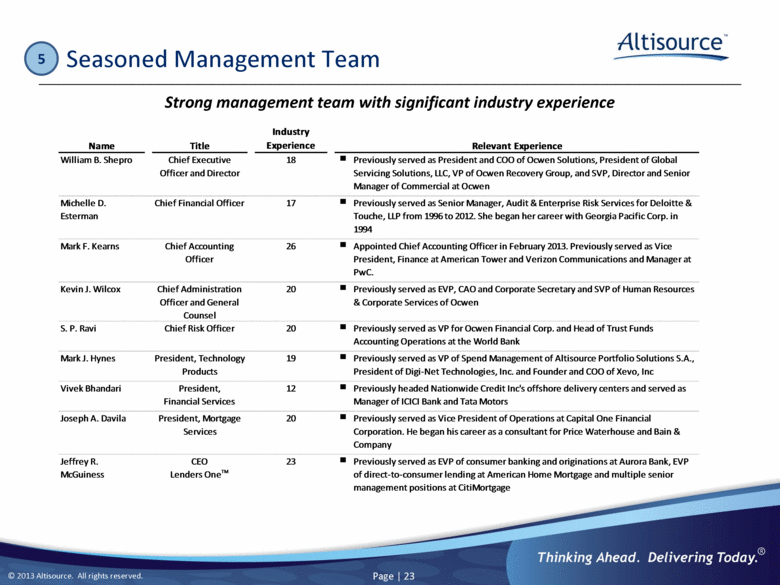
Seasoned Management Team 5 Strong management team with significant industry experience Name Title Industry Experience Relevant Experience William B. Shepro Chief Executive Officer and Director 18 Previously served as President and COO of Ocwen Solutions, President of Global Servicing Solutions, LLC, VP of Ocwen Recovery Group, and SVP, Director and Senior Manager of Commercial at Ocwen Michelle D. Esterman Chief Financial Officer 17 Previously served as Senior Manager, Audit & Enterprise Risk Services for Deloitte & Touche, LLP from 1996 to 2012. She began her career with Georgia Pacific Corp. in 1994 Mark F. Kearns Chief Accounting Officer 26 Appointed Chief Accounting Officer in February 2013. Previously served as Vice President, Finance at American Tower and Verizon Communications and Manager at PwC. Kevin J. Wilcox Chief Administration Officer and General Counsel 20 Previously served as EVP, CAO and Corporate Secretary and SVP of Human Resources & Corporate Services of Ocwen S. P. Ravi Chief Risk Officer 20 Previously served as VP for Ocwen Financial Corp. and Head of Trust Funds Accounting Operations at the World Bank Mark J. Hynes President, Technology Products 19 Previously served as VP of Spend Management of Altisource Portfolio Solutions S.A., President of Digi-Net Technologies, Inc. and Founder and COO of Xevo, Inc Vivek Bhandari President, Financial Services 12 Previously headed Nationwide Credit Inc's offshore delivery centers and served as Manager of ICICI Bank and Tata Motors Joseph A. Davila President, Mortgage Services 20 Previously served as Vice President of Operations at Capital One Financial Corporation. He began his career as a consultant for Price Waterhouse and Bain & Company Jeffrey R. McGuiness CEO Lenders One TM 23 Previously served as EVP of consumer banking and originations at Aurora Bank, EVP of direct-to-consumer lending at American Home Mortgage and multiple senior management positions at CitiMortgage |
|
|
Financial Performance |
|
|
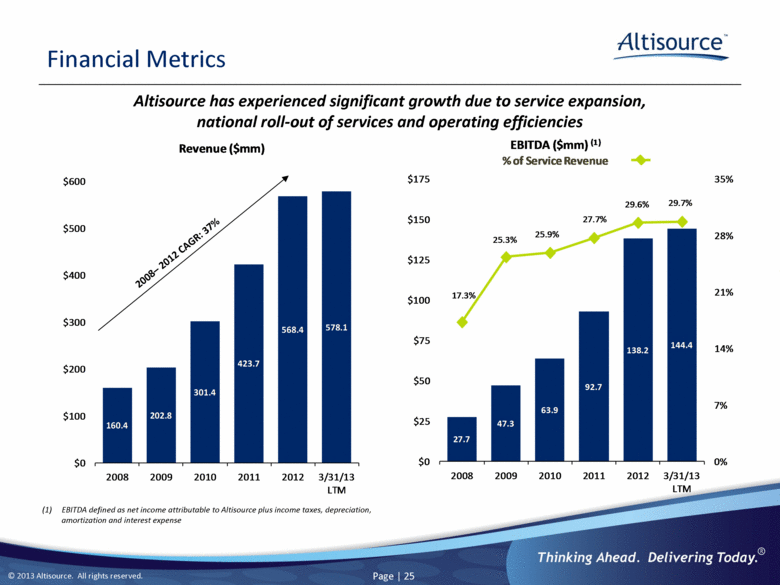
Financial Metrics 2008– 2012 CAGR: 37% Altisource has experienced significant growth due to service expansion, national roll-out of services and operating efficiencies (1) EBITDA defined as net income attributable to Altisource plus income taxes, depreciation, amortization and interest expense 160.4 202.8 301.4 423.7 568.4 578.1 $0 $100 $200 $300 $400 $500 $600 2008 2009 2010 2011 2012 3/31/13 LTM Revenue ($mm) 27.7 47.3 63.9 92.7 138.2 144.4 17.3% 25.3% 25.9% 27.7% 29.6% 29.7% 0% 7% 14% 21% 28% 35% $0 $25 $50 $75 $100 $125 $150 $175 2008 2009 2010 2011 2012 3/31/13 LTM EBITDA ($mm) (1) % of Service Revenue |
|
|
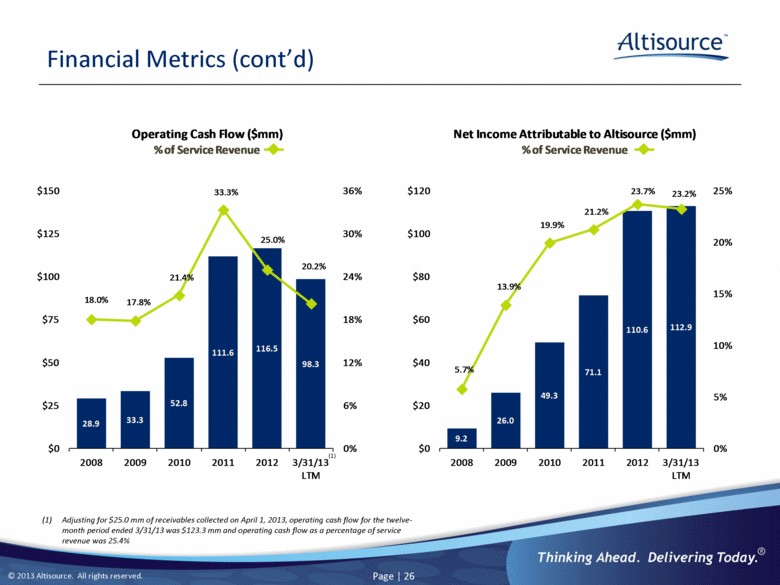
Financial Metrics (cont’d) Adjusting for $25.0 mm of receivables collected on April 1, 2013, operating cash flow for the twelve-month period ended 3/31/13 was $123.3 mm and operating cash flow as a percentage of service revenue was 25.4% (1) 9.2 26.0 49.3 71.1 110.6 112.9 5.7% 13.9% 19.9% 21.2% 23.7% 23.2% 0% 5% 10% 15% 20% 25% $0 $20 $40 $60 $80 $100 $120 2008 2009 2010 2011 2012 3/31/13 LTM Net Income Attributable to Altisource ($mm) % of Service Revenue 28.9 33.3 52.8 111.6 116.5 98.3 18.0% 17.8% 21.4% 33.3% 25.0% 20.2% 0% 6% 12% 18% 24% 30% 36% $0 $25 $50 $75 $100 $125 $150 2008 2009 2010 2011 2012 3/31/13 LTM Operating Cash Flow ($mm) % of Service Revenue |
|
|
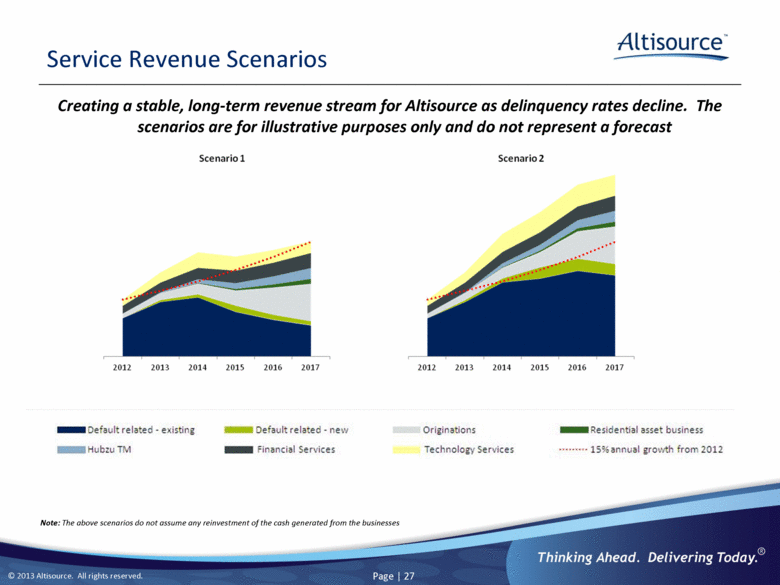
Service Revenue Scenarios Note: The above scenarios do not assume any reinvestment of the cash generated from the businesses Creating a stable, long-term revenue stream for Altisource as delinquency rates decline. The scenarios are for illustrative purposes only and do not represent a forecast Scenario 1 Scenario 2 2012 2013 2014 2015 2016 2017 Scenario 2 2012 2013 2014 2015 2016 2017 Default related - existing Default related - new Originations Residential asset business Hubzu TM Financial Services Technology Services 15% annual growth from 2012 |
|
|
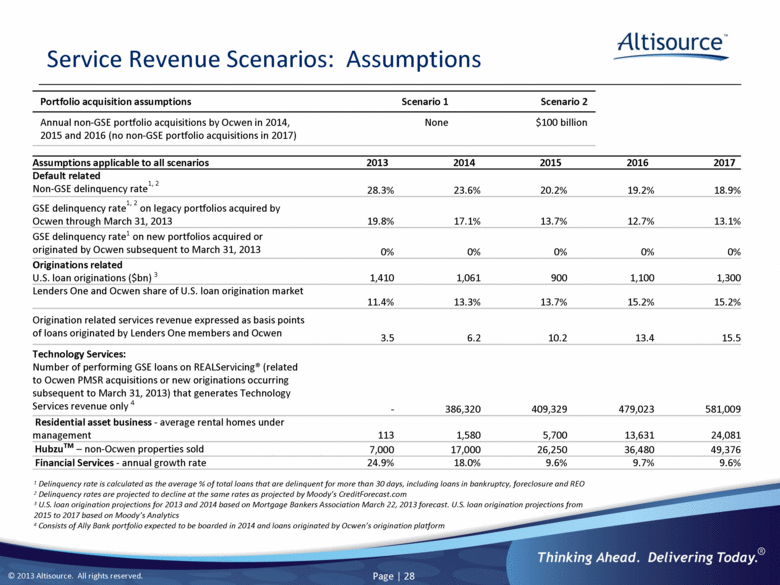
Service Revenue Scenarios: Assumptions Portfolio acquisition assumptions Scenario 1 Scenario 2 Annual non-GSE portfolio acquisitions by Ocwen in 2014, 2015 and 2016 (no non-GSE portfolio acquisitions in 2017) None $100 billion 1 Delinquency rate is calculated as the average % of total loans that are delinquent for more than 30 days, including loans in bankruptcy, foreclosure and REO 2 Delinquency rates are projected to decline at the same rates as projected by Moody’s CreditForecast.com 3 U.S. loan origination projections for 2013 and 2014 based on Mortgage Bankers Association March 22, 2013 forecast. U.S. loan origination projections from 2015 to 2017 based on Moody’s Analytics 4 Consists of Ally Bank portfolio expected to be boarded in 2014 and loans originated by Ocwen’s origination platform Assumptions applicable to all scenarios 2013 2014 2015 2016 2017 Default related Non-GSE delinquency rate1, 2 28.3% 23.6% 20.2% 19.2% 18.9% GSE delinquency rate1, 2 on legacy portfolios acquired by Ocwen through March 31, 2013 19.8% 17.1% 13.7% 12.7% 13.1% GSE delinquency rate1 on new portfolios acquired or originated by Ocwen subsequent to March 31, 2013 0% 0% 0% 0% 0% Originations related U.S. loan originations ($bn) 3 1,410 1,061 900 1,100 1,300 Lenders One and Ocwen share of U.S. loan origination market 11.4% 13.3% 13.7% 15.2% 15.2% Origination related services revenue expressed as basis points of loans originated by Lenders One members and Ocwen 3.5 6.2 10.2 13.4 15.5 Technology Services: Number of performing GSE loans on REALServicing® (related to Ocwen PMSR acquisitions or new originations occurring subsequent to March 31, 2013) that generates Technology Services revenue only 4 - 386,320 409,329 479,023 581,009 Residential asset business - average rental homes under management 113 1,580 5,700 13,631 24,081 HubzuTM – non-Ocwen properties sold 7,000 17,000 26,250 36,480 49,376 Financial Services - annual growth rate 24.9% 18.0% 9.6% 9.7% 9.6% |
|
|
Key Investment Highlights Successful Product Development Track Record Strong Recurring Cash Flows Seasoned Management Team Next Generation Technology Strong Revenue Growth 1 2 3 4 5 |
|
|
Appendix |
|
|
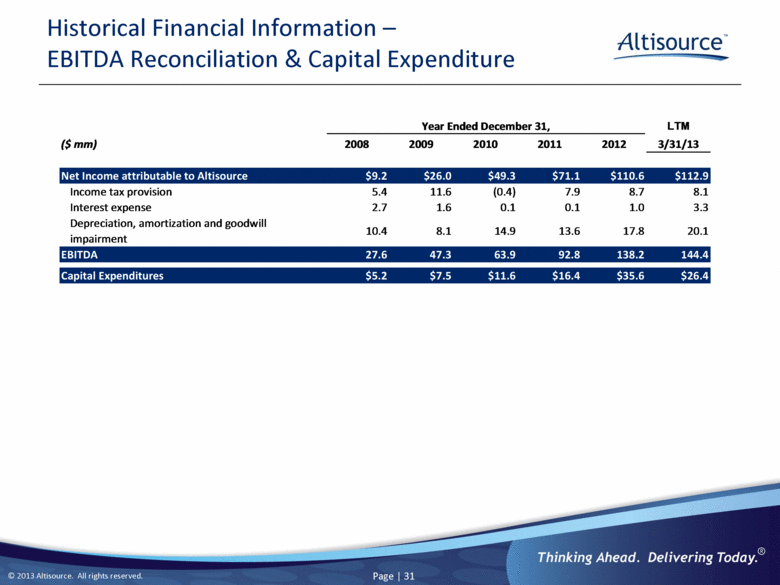
Historical Financial Information – EBITDA Reconciliation & Capital Expenditure Year Ended December 31, LTM ($ mm) 2008 2009 2010 2011 2012 3/31/13 Net Income attributable to Altisource $9.2 $26.0 $49.3 $71.1 $110.6 $112.9 Income tax provision 5.4 11.6 (0.4) 7.9 8.7 8.1 Interest expense 2.7 1.6 0.1 0.1 1.0 3.3 Depreciation, amortization and goodwill impairment 10.4 8.1 14.9 13.6 17.8 20.1 EBITDA 27.6 47.3 63.9 92.8 138.2 144.4 Capital Expenditures $5.2 $7.5 $11.6 $16.4 $35.6 $26.4 |
|
|
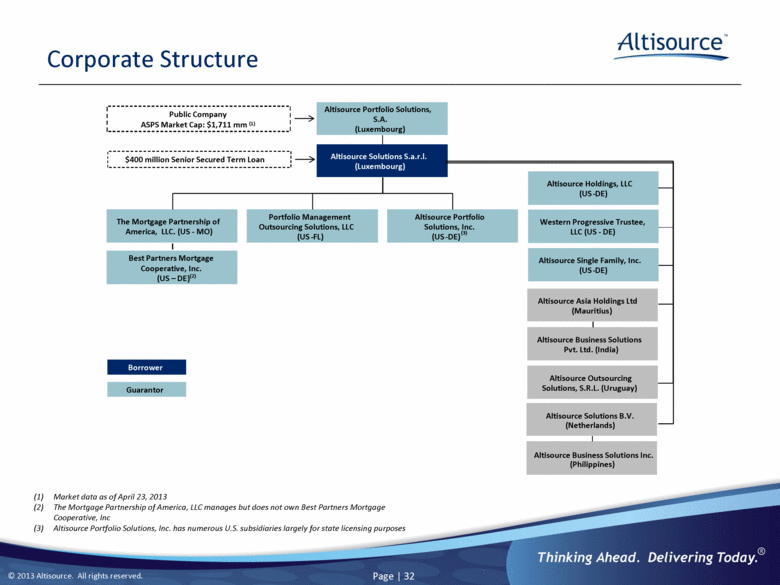
Corporate Structure (1) Market data as of April 23, 2013 (2) The Mortgage Partnership of America, LLC manages but does not own Best Partners Mortgage Cooperative, Inc (3) Altisource Portfolio Solutions, Inc. has numerous U.S. subsidiaries largely for state licensing purposes Altisource Portfolio Solutions, S.A. (Luxembourg) The Mortgage Partnership of America, LLC. (US - MO) Portfolio Management Outsourcing Solutions, LLC (US - FL) Altisource Portfolio Solutions, Inc. (US - DE) (3) Altisource Holdings, LLC (US - DE) Western Progressive Trustee, LLC (US - DE) Altisource Asset Management Corporation (US -VI) Altisource Residential Corporations Altisource Solutions S.a.r.l. (Luxembourg) Borrower Guarantor $400 million Senior Secured Term Loan Altisource Single Family, Inc. (US - DE) To Be Spun Off Public Company ASPS Market Cap: $1,711 mm (1) Altisource Asia Holdings Ltd (Mauritius) Altisource Business Solutions Pvt. Ltd. (India) Altisource Outsourcing Solutions, S.R.L. (Uruguay) Altisource Solutions B.V. (Netherlands) Altisource Business Solutions Inc. (Philippines) Best Partners Mortgage Cooperative, Inc. (US – DE) (2) |