Attached files
| file | filename |
|---|---|
| 8-K - 8-K - TRANSATLANTIC PETROLEUM LTD. | d505348d8k.htm |
| EX-99.1 - EX-99.1 - TRANSATLANTIC PETROLEUM LTD. | d505348dex991.htm |
 4Q12
Preliminary Financial and
Operations Review
March 19, 2013
Exhibit 99.2 |
 Forward Looking
Statements Outlooks,
projections,
estimates,
targets,
and
business
plans
in
this
presentation
or
any
related
subsequent
discussions
are
forward-looking
statements.
Actual
future results, including TransAtlantic Petroleum Ltd.’s own production growth and mix;
financial results; the amount and mix of capital expenditures; resource additions
and
recoveries;
finding
and
development
costs;
project
and
drilling
plans,
timing,
costs,
and
capacities;
revenue
enhancements
and
cost
efficiencies;
industry margins; margin enhancements and integration benefits; and the impact of technology
could differ materially due to a number of factors. These include market
prices
for
natural
gas,
natural
gas
liquids
and
oil
products;
estimates
of
reserves
and
economic
assumptions;
the
ability
to
produce
and
transport
natural
gas,
natural
gas
liquids
and
oil;
the
results
of
exploration
and
development
drilling
and
related
activities;
economic
conditions
in
the
countries
and
provinces
in
which
we
carry
on
business,
especially
economic
slowdowns;
actions
by
governmental
authorities,
receipt
of
required
approvals,
increases
in
taxes,
legislative
and regulatory initiatives relating to fracture stimulation activities, changes in
environmental and other regulations, and renegotiations of contracts; political
uncertainty, including actions by insurgent groups or other conflict; the negotiation and
closing of material contracts; shortages of drilling rigs, equipment or oilfield
services;
and
other
factors
discussed
here
and
under
the
heading
“Risk
Factors"
in
our
Annual
Report
on
Form
10-K
for
the
year
ended
December
31,
2011 and our Quarterly Report on Form 10-Q for the quarters ended March 31, 2012, June 30,
2012 and September 30, 2012 available at our website at
www.transatlanticpetroleum.com
and
www.sec.gov.
See
also
TransAtlantic’s
2011
audited
financial
statements
and
the
accompanying
management
discussion
and analysis. Forward-looking statements are based on management’s knowledge and
reasonable expectations on the date hereof, and we assume no duty to update these
statements as of any future date. The information set forth in this presentation does
not constitute an offer, solicitation or recommendation to sell or an offer to buy any securities of the
Company. The information published herein is provided for informational purposes only. The
Company makes no representation that the information and opinions
expressed
herein
are
accurate,
complete
or
current.
The
information
contained
herein
is
current
as
of
the
date
hereof,
but
may
become
outdated
or
subsequently may change. Nothing contained herein constitutes financial, legal, tax, or other
advice. The SEC has generally permitted oil and gas companies, in their filings with the
SEC, to disclose only proved reserves that a company has demonstrated by actual
production or conclusive formation tests to be economically and legally producible under existing economic and operating conditions. We may use the
terms
“estimated
ultimate
recovery,”
“EUR,”
“probable,”
“possible,”
and
“non-proven”
reserves,
“prospective
resources”
or
“upside”
or
other
descriptions
of
volumes
of
resources
or
reserves
potentially
recoverable
through
additional
drilling
or
recovery
techniques
that
the
SEC’s
guidelines
may
prohibit
us
from
including in filings with the SEC. These estimates are by their nature more speculative than
estimates of proved reserves and accordingly are subject to substantially greater risk
of being actually realized by the Company. There is no certainty that any portion of estimated prospective resources will be discovered.
If discovered, there is no certainty that it will be commercially viable to produce any
portion of the estimated prospective resources. BOE
is
derived
by
converting
natural
gas
to
oil
in
the
ratio
of
six
thousand
cubic
feet
(Mcf)
of
natural
gas
to
one
barrel
(bbl)
of
oil.
Boe
may
be
misleading,
particularly if used in isolation. A BOE conversion ratio of 6 Mcf: 1 bbl is based on an
energy equivalency conversion method primarily applicable at the burner tip and does
not represent a value equivalency at the wellhead. 2 |
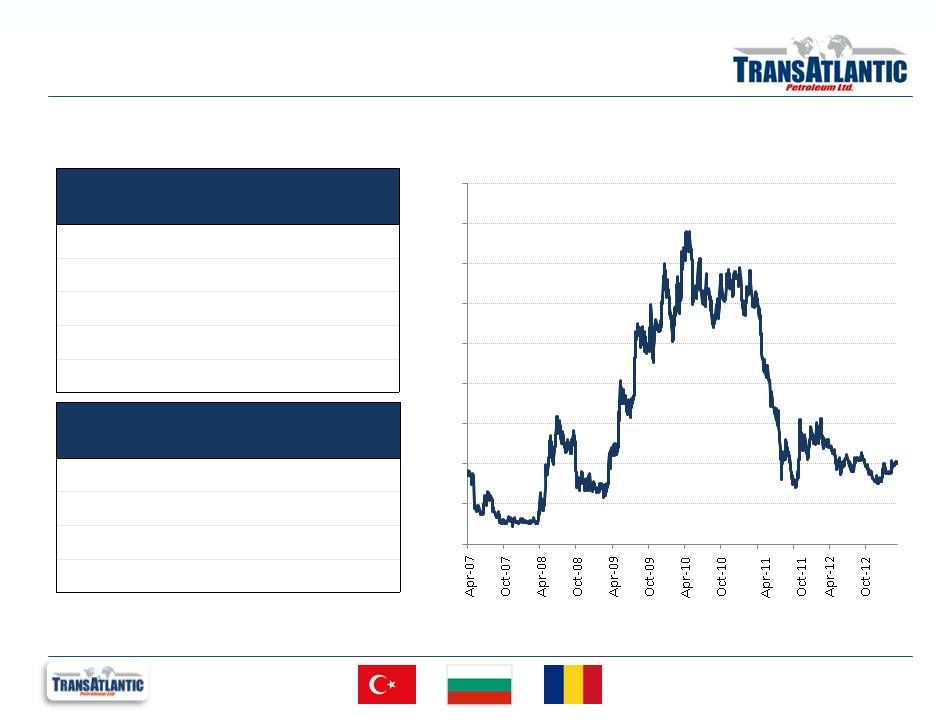 Company
Overview TransAtlantic Petroleum Ltd. is an international energy company engaged in the
acquisition, development, exploration, and production of crude oil and natural gas in
Turkey, Bulgaria and Romania. 3
NYSE-AMEX:
Toronto:
TAT
TNP
Share
Price
(1)
:
$1.01
Market Cap
(1)
:
$372.6 million
Enterprise Value
(1)
:
$390.6 million
Proved Reserves
(2)
:
11.6 MMboe
SEC PV10
(3)
:
$511.0 million
(1)
Priced as of market close on 3/15/2013.
(2)
Reflects DeGoyler and MacNaughton (“D&M”) reserve report, effective 12/31/2012
based on $108.30/barrel and $8.94/Mcf. (3)
Please see slide 25 for a reconciliation of our PV10 to our standardized measure.
Executive Management
Chairman & CEO:
N. Malone Mitchell, 3rd
President:
Ian J. Delahunty
VP, CFO:
Wil F. Saqueton
VP, Legal:
Jeffrey S. Mecom
$0.00
$0.50
$1.00
$1.50
$2.00
$2.50
$3.00
$3.50
$4.00
$4.50 |
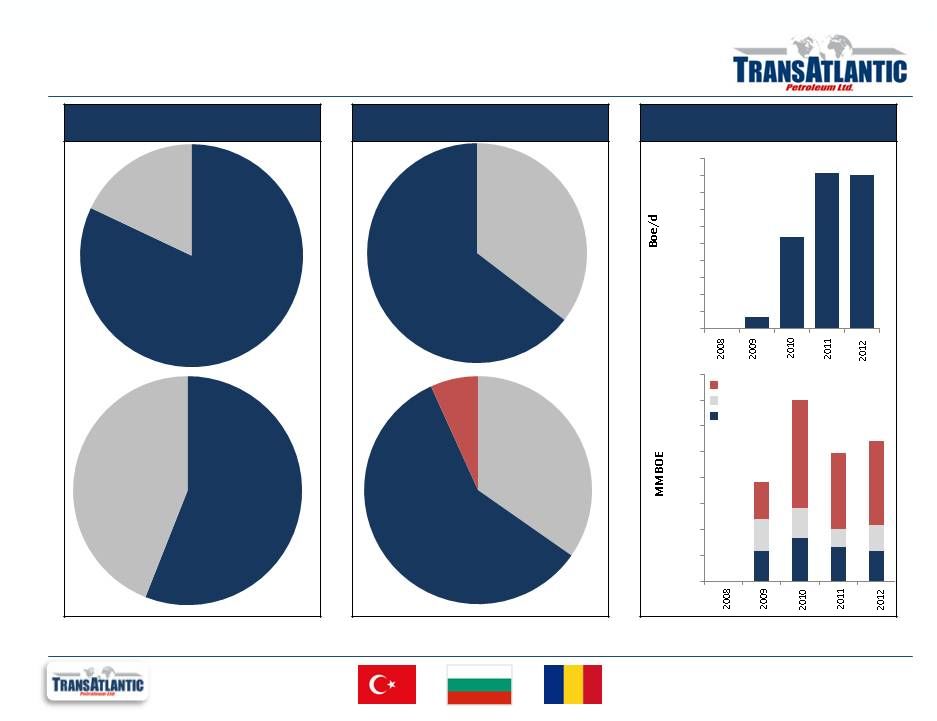 Asset
Characteristics 4
(1)
Reflects DeGolyer and MacNaughton (“D&M”) reserve report, effective 12/31/2012
based on $108.30/barrel and $8.94/Mcf. BOE conversions are calculated by the Company.
Natural
Gas
18%
Oil
82%
Undeveloped
44%
Developed
56%
Oil
65%
Natural
Gas
35%
Selmo
59%
Thrace
35%
Other
7%
Growth Profile
5,000
Reserve
Profile
4Q12 Production
Profile
(1)
0
10
20
30
40
50
60
70
Possible
Probable
Proved
0
500
1,000
1,500
2,000
2,500
3,000
3,500
4,000
4,500
(1)
80 |
 Delayed
10-K 5
As
announced
in
our
Press
Release
yesterday,
TransAtlantic
needs
additional
time
to
file
our
2012
Form
10-K, and we have filed Form 12b-25 which provides an additional 15 days to file our
Form 10-K •
Time extension is due to prior period errors that relate to the allocation of well costs to
our depletion schedule
during
the
years
2009
through
2011,
which
result
in
the
understatement
of
depletion
expense
recorded
on
the
Company’s
financials
for
the
years
2009
through
2012.
Note
that
depletion
expense
is
a
non-cash item.
•
We
are
working
with
our
independent
registered
public
accounting
firm
to
evaluate
the
impact
of
these
prior
period errors on both the current and prior period financial statements.
•
Management and the Board of Directors have already initiated a process to hire a third party
accounting consultant to assist and supplement the in-house accounting staff with a
thorough review of all prior period accounting and documentation.
|
 Preliminary 4Q12
Financials 6
•
Until we file the 10-K, we can only provide limited financial information
•
We expect fourth quarter Net Loss from Continuing Operations to be between $20 to $25
million •
The fourth quarter included exploration, abandonment and impairment charges of approximately
$24 million largely driven by dry holes on several high risk exploration wells
including Konak-1 ($9.5mm) and Durukoy-1 ($6.3mm) and impairment of value on
several of our unproved property licenses ($7.7mm)
•
We expect fourth quarter Adjusted EBITDAX from Continuing Operations to be between $22 to $24
million •
As of December 31, 2012
•
Cash balance of $14.8 million
•
Long-term debt of $32.8 million
•
No short-term debt
•
Credit facility availability of $26.9 million |
 2013 CapEx and
Operating Plan 7
$131 Million Capital Budget
•
Within current cash flow, cash on hand, and credit availability.
•
Accelerate with consummation of a joint venture
Southeast Turkey
•
Drill horizontal wells to increase productivity.
•
Expand 2012 discoveries (Goksu, Bahar, and Alibey).
•
Drill off-structure to evaluate resource play prospectivity.
•
3D seismic of Molla blocks (Bahar, Goksu, and Ambar).
Northwest Turkey –
Thrace Basin
•
Tekirdag
development
project
–
low
risk
gas
production
growth
–
normal
pressure
gradient.
•
Hayrabolu
–
Eight
exploration
and
delineation
wells
–
overpressured
below
1,500
meters.
•
Final exploitation of Edirne blocks (NW Thrace).
•
Limited development within TPAO joint blocks as they "learn" unconventional
potential. •
3D on structure near Thrace area “kitchen.”
Other
•
Sivas
Basin
–
First
half
of
2013.
•
Bulgaria –
Resume activity summer 2013. |
 Management
Transition 8
Success
of
horizontal,
unconventional
plays
drive
increased
need
for
drilling
and
completions
team
managed and staffed with team leaders with heavy experience in horizontal drilling,
multi-stage fracture design, and North American activity pace.
Key
New
Hires/Promotions:
Ian
Delahunty,
President
–
Completions
engineer,
US
&
international
experience
with
Schlumberger,
Oxy
and
TransAtlantic.
Mitch
Whatley,
VP-Drilling
–
Drilling
engineer,
extensive
horizontal
experience
with
Pioneer
(Eagle
Ford),
Encana
(Haynesville and Deep Bossier), and additional industry experience with Marathon and
Sidewinder Drilling. Justin
Davis,
VP-Engineering
–
Completions
engineer,
extensive,
multi-basin,
unconventional
experience
with
Riata, SandRidge, TransAtlantic and Viking.
Darcy
Dorscher,
VP-Production
&
Facilities
–
Engineer,
extensive
international
experience
in
Canada,
India,
Kazakhstan, Madagascar, Qatar, and Turkey.
Geological
&
Geophysical
–
Relocated
senior
personnel
to
Dallas. |
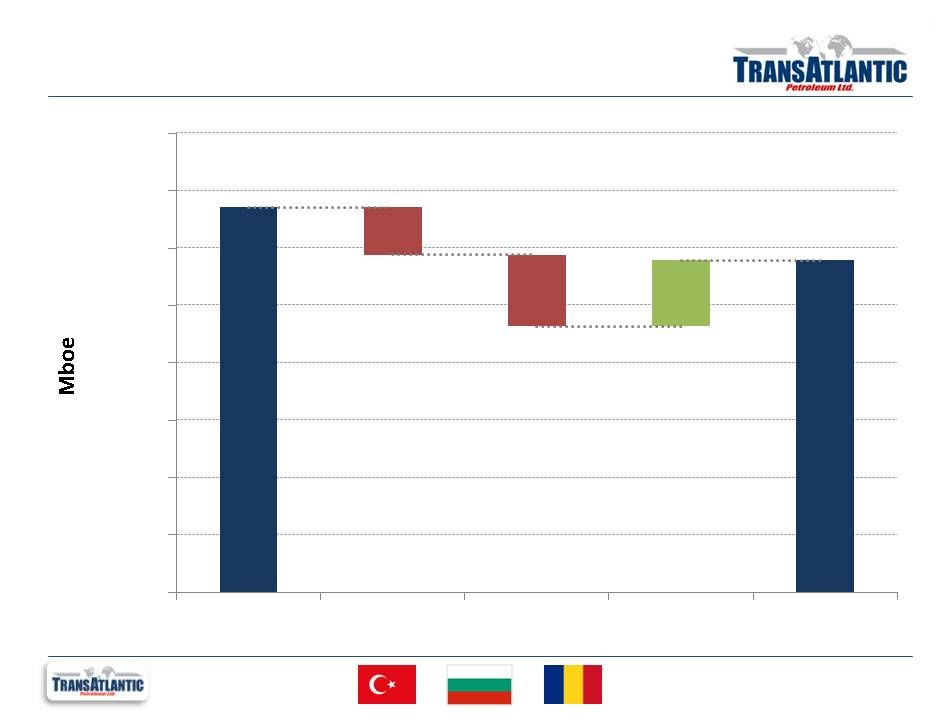 1P Reserves
Roll-forward 9
YE2011
Production
Revisions
Discoveries
YE2012
0
2,000
4,000
6,000
8,000
10,000
12,000
14,000
16,000 |
 Year-end 3P
Reserves Profile and Comparison 10
*Hatched area represents increased 2P/3P independent reserves evaluation disclosed by Valeura
Energy, which benefitted from three additional weeks of study/review. 0
5,000
10,000
15,000
20,000
25,000
30,000
35,000
2011 Gas
2012 Gas*
2011 Oil
2012 Oil
1P
2P
3P |
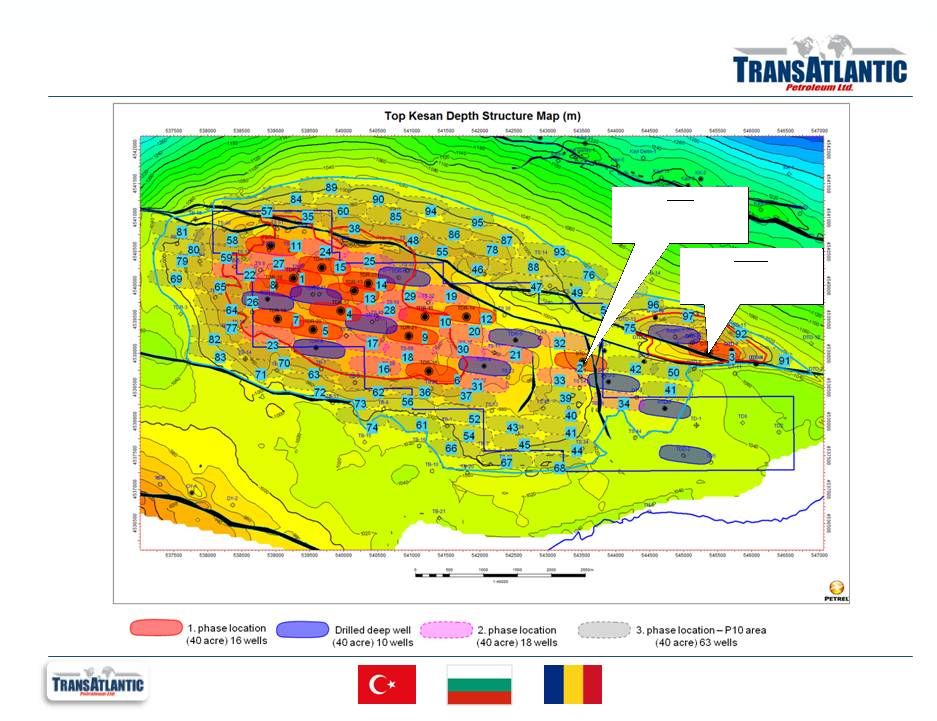
 Turkey: Activity
Overview 11
Thrace Basin
Region Summary:
Conventional and tight natural gas
production with upside potential from
deep intervals and technological
application.
Proved Reserves:
11.1 Bcf
(1)
4Q12 Production:
9.2 MMcf/d
Thrace Basin
Southeast
Central
Southeast
Region Summary:
Conventional oil production provides low
decline base. Conventional and
unconventional upside opportunities.
Proved Reserves:
9.7 MMboe
(1)
4Q12 Production:
2.9 Mboe/d
Central
Region Summary:
Frontier basins offer under-explored, high
potential, oil and gas opportunities
Proved Reserves:
0.0 MMboe
4Q12 Production:
0.0 Mboe/d
Overview
Region Summary:
Over 4 million acres in an under-explored
region with attractive fiscal terms.
Extension of prolific Syrian and Iraqi oil
fields in the southeast and established
natural gas play in the northwest.
Proved Reserves:
11.6 MMboe
(1)
4Q12 Production:
4.4 Mboe/d
(1)
Reflects DeGolyer and MacNaughton (“D&M”) reserve report, effective 12/31/2012
based on $108.30/barrel and $8.94/Mcf. BOE conversions are calculated by the Company. |
 Molla:
Demonstrating Stacked Pay Potential 12
Demonstrated
horizontal success
with Goksu 3H over
300 BOPD after ~5
months of production.
Vertical discovery
(Bahar-1) IP after
frac at ~600 BOPD.
Horizontal currently
drilling.
Tested 150 BOPD
(Bahar-1).
Two cores taken. |
 Molla-area
Gravity Map 13
*
DeGolyer & McNaughton as of 12/31/2012
Goksu:
2P Reserves:
2.9 MMbbls*
Field discoveries align well with gravity data. Meaningful running room whether structural or
stratigraphic. Kastel Field:
EUR 15 MMbbls
Bahar:
2P Reserves:
2.5 MMbbls* |
 Molla: Mardin
Potential and Goksu Discovery 14
*
DeGolyer & McNaughton as of 12/31/2012.
Molla: Mardin
Overview
Mardin
Formation
Fractured Cretaceous carbonate present across
the region.
Initial vertical discoveries bolstered by recent
application of horizontal drilling processes.
Total 1P reserves of 0.6 MMbbls*.
Total 2P reserves of 2.9 MMbbls*.
Goksu-3H
Flowing over 300 BOPD after almost 5 months
of production.
TransAtlantic’s first horizontal completion,
1,600 foot lateral.
Drilled and completed for approximately $3.5
million.
Goksu-2
Cumulative production nearing 60,000 Bbls.
Initial flow rates were 400-500 BOPD in
February 2012.
Put on 16/64”
choke.
Stable FTP of 240 psi. |
 Molla: Mardin
Reserves 15
*
DeGolyer & McNaughton as of 12/31/2012. |
 Molla: Mardin
Horizontal – Ambar Structure
16 |
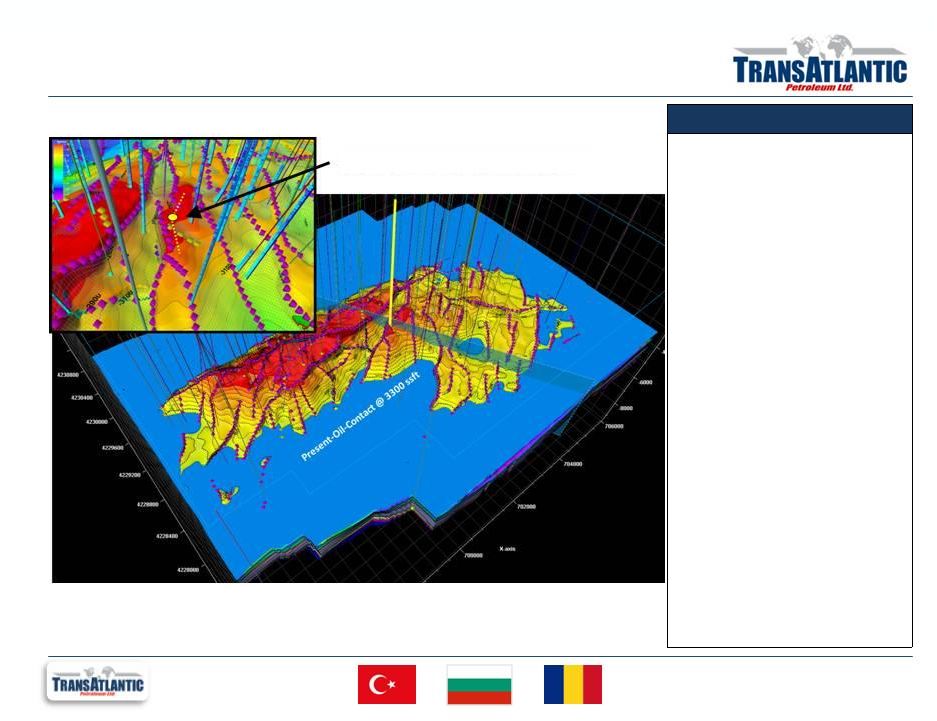
 Molla: Bedinan
and Hazro Discovery 17
*
DeGolyer & McNaughton as of 12/31/2012.
Molla: Bedinan & Hazro Overview
Conventional targets immediately above and below Dadas
with prospectivity demonstrated via recent discovery well.
Bedinan Formation
Hazro Formation
Shut-in while Hazro tested (150 bopd)
Analog Hazro well 27 km north of Bahar-1 with EUR of 1.4
mmbo and 14 bcf.
Bahar-1 (TAT operated discovery well) -
Hazro tested 150
BOPD.
Sandstone directly above the Dada
Shale.
Horizontal offset currently drilling designed for multi-
stage frac completion.
Bedinan produced ~600 BOPD (+ high BTU gas) after
frac.
TAT operated vertical discovery well with 50’
of net pay
Normal pressure gradient in southern (shallower) part
of the basin at Arpatepe field (25 kms south). Arpatepe
Field EUR’s of 200mbo –
400mbo with acid stimulation.
Overpressured in central and northern parts of basin.
Sandstone immediately below the Dada
Shale.
Total 2P reserves of 2.5 MMbbls* including 2.1 MMbbls
from the Bedinan and 400 Mbbls from the Hazro.
Total 1P Reserves of 1.4 MMbbls* including 1.0 MMbbls
from the Bedinan and 400 Mbbls from the Hazro.
Bahar-1 |
 Molla: Bedinan
Horizontal – Cataksu-1H
18
Bahar-2H
Drilling Curve Now
Cataksu-1H
Next well in program. Lateral
trajectory TBD. |
 Selmo
Remapping 19
Selmo Overview
•
Extensive work has been done
to remap and model Selmo to
identify bypassed oil due to the
extremely fractured nature of
the field.
•
New dynamic model
incorporates updated
substructure mapping with
production and pressure
histories to determine the areas
of the field that will most
benefit from a horizontal drilling
campaign.
•
We believe horizontal wellbores
will allow pressure drawdown
that is more uniform across the
length of the wellbore and
prevent water coning or
premature breakthrough of
water.
•
2013 budget provides for 4
horizontal wells in the Middle
Sinan Dolomite (MSD) and 1
horizontal well in the Lower
Sinan Dolomite (LSD).
Example Selmo Horizontals |
 New License
Applications 20
Acquired or applied for
seven new licenses
totaling over 550k acres. |
 Thrace Basin
– Mezardere Formation
21
New
basin-wide
map
provides
better
understanding
of
source,
kitchen,
trap,
and
pressure
dynamics.
TEKIRDAG |
 Thrace Basin
Frac: Tekirdag Development Program 22
Development Program Characteristics:
•
Initial 88-well development program covering approximately 5,000 acres of the Tekirdag
Field Area. •
Plan 17 wells in Tekirdag area and 8 wells in Hayrabolu during 2013.
•
Two rig drilling program carries activity into 2015.
•
Gross
well
costs
expected
to
range
between
$2.0
million
and
$3.0
million,
depending
upon
total
depth
and
completion design.
•
Gross
expected
ultimate
recovery
expected
to
exceed
70
Bcf
(1)
.
(1) Internal estimate prepared 10/1/12
Tekirdag
Hayrabolu |
 Thrace Basin
Frac: Tekirdag Development Program 23
DTD-19
5-stage frac, flowing back
with early choked gas rate
> 1 MMcf/d
BTD-5
4-stage frac, flowing back
with early choked gas rate
~ 1 MMcf/d |
 Thrace Basin
Frac: Hayrabolu Trend 24
11,000 prospective acres
Yildirim-1
2-stage frac, drilling out plugs.
Pre-frac instantaneous flow
rate of 1.8MMcf/d
Kazanci-5
Deepest zone unsuccessful
Hayrabolu-10
Drilling
Kazanci-5 |
 EBITDAX
Reconciliation 25
For the three months ended
(in millions)
Dec 31, 2012
Adjusted EBITDAX from continuing operations
$22.0
–
$24.0
Subtract:
Interest and other, net
$1.2
Income tax expense
2.6
Depreciation, depletion, and amortization
11.3-14.3
Accretion of asset retirement obligation
0.1
Exploration, abandonment, and impairment
24.4
Seismic and other exploration
2.4
Other items
2.2
Net loss from continuing operations
($25.2)
–
($20.2)
* Totals may not sum due to independent rounding
This presentation references estimated EBITDAX, which is a non-GAAP financial measure that
represents earnings from continuing operations before income taxes, interest,
depreciation, depletion, amortization, impairment, abandonment and exploration expense.
The Company believes EBITDAX assists management and investors in
comparing the Company’s performance and ability to fund capital expenditures and working
capital requirements
on
a
consistent
basis
without
regard
to
depreciation,
depletion
and
amortization,
impairment
of
natural
gas
and
oil
properties
and
exploration
expenses,
which
can vary significantly from period to period. In addition, management uses EBITDAX as a
financial measure to evaluate the Company’s operating performance. EBITDAX is
also widely used by investors and rating agencies.
EBITDAX is not a measure of financial performance under GAAP. Accordingly, it should not
be considered as a substitute for net income, income from operations, or cash flow
provided by operating activities prepared in accordance with GAAP. Information regarding
income taxes, interest, depreciation, depletion, amortization, impairment, abandonment
and exploration expense is unavailable on a forward looking basis. Net income, income from operations, or cash flow provided by operating activities may vary
materially from EBITDAX. Investors should carefully consider the specific items included
in the computation of EBITDAX. The Company has disclosed EBITDAX to permit a
comparative analysis of its operating performance and debt servicing ability relative to other
companies. |
 Hedge
Profile 26
As of 12/31/2012
775
622
0
831
726
1,016
$100.25
$99.63
$88.44
$0
$25
$50
$75
$100
$125
$150
0
250
500
750
1,000
1,250
1,500
2013
2014
2015
way Collars
Collars
Floor/Ceiling Mid-
point
3- |
 PV10
Reconciliation 27
The
PV-10
value
of
the
estimated
future
net
revenue
are
not
intended
to
represent
the
current
market
value
of
the
estimated
oil
and
natural
gas reserves we own. Management believes that the presentation of PV-10, while not a
financial measure in accordance with U.S. GAAP, provides useful information to
investors because it is widely used by professional analysts and sophisticated investors in evaluating oil and
natural gas companies. Because many factors that are unique to each individual company impact
the amount of future income taxes estimated to be paid, the use of a pre-tax
measure is valuable when comparing companies based on reserves. PV-10 is not a measure of
financial or operating performance under U.S. GAAP. PV-10 should not be considered as an
alternative to the standardized measure as defined under U.S. GAAP.
US $ thousands
Total PV 10:
$511,075
Future income taxes:
(106,411)
Discount of future income taxes at 10% per annum:
31,213
Standardized measure:
$435,880
The
following
table
provides
a
reconciliation
of
our
PV10
to
our
standardized
measure: |
 Investor Contact
Information Chad W. Potter, CFA
VP –
Finance / Investor Relations
(214) 265-4746
chad.potter@tapcor.com
Wil F. Saqueton
VP –
Chief Financial Officer
(214) 265-4743
wil.saqueton@tapcor.com
Ian Delahunty
President
(214) 265-4780
Ian.delahunty@tapcor.com
16803 Dallas Parkway
P.O. Box 246
Addison, TX 75001-0246
28 |