Attached files
| file | filename |
|---|---|
| 8-K - FORM 8-K - GAIN Capital Holdings, Inc. | d500331d8k.htm |
| EX-99.1 - EX-99.1 - GAIN Capital Holdings, Inc. | d500331dex991.htm |
 4
th
Quarter & Full Year 2012
Financial and Operating Results
March 12, 2013
Exhibit 99.2 |
 Special Note Regarding Forward-Looking Information
In addition to historical information, this presentation contains
"forward-looking" statements that reflect management's
expectations for the future. A variety of important factors could cause
results
to
differ
materially
from
such
statements.
These
factors
are
noted
throughout
GAIN
Capital's annual report on Form 10-K, as filed with the Securities and Exchange
Commission on March 15, 2012, and include, but are not limited to, the
actions of both current and potential new competitors, fluctuations in
market trading volumes, financial market volatility, evolving industry
regulations, including changes in regulation of the futures companies, errors or
malfunctions in our systems or technology, rapid changes in technology, effects of
inflation, customer trading patterns, the success of our products and
service offerings, our ability to continue to innovate and meet the demands
of our customers for new or enhanced products, our ability to successfully
integrate assets and companies we have acquired, including the
successful
integration
of
Open
E
Cry,
our
ability
to
effectively
compete
in
the
futures
industry,
changes in tax policy or accounting rules, fluctuations in foreign exchange rates
and commodity prices, adverse changes or volatility in interest rates, as
well as general economic, business, credit and financial market conditions,
internationally or nationally, and our ability to continue paying a
quarterly dividend in light of future financial performance and financing
needs. The forward-looking statements included herein represent GAIN Capital's
views as of the date of this presentation. GAIN Capital undertakes no
obligation to revise or update publicly any forward-looking statement
for any reason unless required by law. 2 |
 Overview
Glenn Stevens, CEO |
 Full
Year Highlights •
Progress on revenue diversification
–
Commission revenue totaled 13% of FY 2012 revenue vs. 3% in FY 2011
–
Continued growth of institutional business, GTX
–
Only 4 mos. of contribution from newly acquired Futures business, OEC
•
Solid
operating
metrics
in
our
retail
businesses
despite
adverse
market
conditions
–
Funded accounts up 11%
–
Client assets up 44%
•
Strategically managed expenses in our retail OTC business to fund
investments in futures and institutional businesses
•
5% decrease in FY 2012 expenses; $20.8 million (17%) decrease in
retail OTC
operating expenses
•
Active corporate development pipeline
–
Market
consolidator
in
the
U.S.
via
recent
acquisitions
of
GFT
&
FX
Solutions
customer
accounts
–
Experienced acquirer with strong integration skills
–
Aggressively seeking deals that will help scale our businesses
4 |
 4
th
Quarter
&
FY
2012
Results
Overview
5
•
Q4 2012 Financial Summary
•
Net Revenue: $32.4 million
•
Net Loss: ($3.8) million
•
Adjusted Net Loss
(1)
: ($3.3) million
•
Adjusted EBITDA
(2)
: ($5.0) million
•
FY 2012 Financial Summary
•
Net Revenue: $151.4 million
•
Net Income: $2.6 million
•
Adjusted Net Income
(1)
: $5.5 million
•
Adjusted EBITDA
(2)
: $11.1 million
•
EPS (Diluted): $0.07
•
Adjusted
EPS
(Diluted)
(3)
:
$0.14
•
Operating Metrics
(4)
•
Total trading volume up 34% to $3.3 trillion
•
Retail volume decreased 17% to $1.3 trillion
•
Institutional volume increased 129% to $2.0 trillion
•
Funded accounts up 11% to 85,099
•
Client assets up 44% to $446.3 million as of December 31, 2012
(Comparisons are referenced to FY 2011)
Adjusted net income is a non-GAAP financial measure that represents our net income excluding
purchase intangible amortization. A reconciliation of net income to adjusted net income is available
in the appendix to this presentation.
Adjusted EBITDA is a non-GAAP financial measure that represents our earnings before
interest, taxes, depreciation, amortization and non-recurring expenses. A reconciliation of net income to
adjusted EBITDA is available in the appendix to this presentation. Reconciliation of EPS to adjusted
EPS is available in the appendix to this presentation.
Definitions for all our operating metrics are available in the appendix to this presentation. (1)
(2)
(3)
(4) |
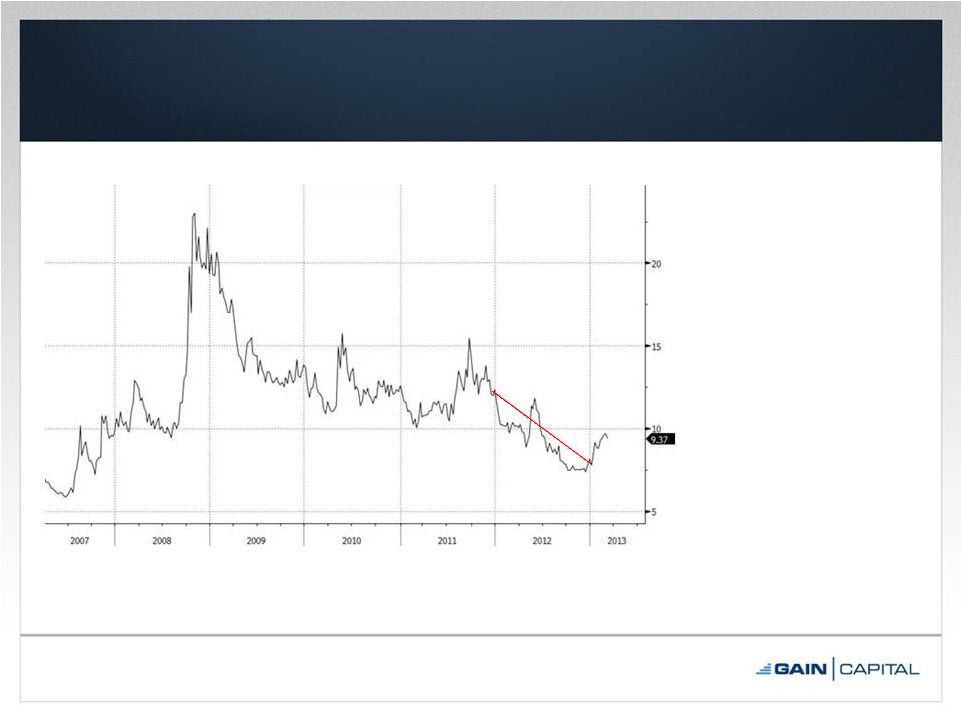 Market
Conditions in 2012 6
Source: JPMorgan’s G7 Volatility Index
•
FX volatility declined
34% in 2012
•
Q4 low point of year;
December levels not
seen since mid 2007
•
Promising trend
reversal in first few
months of 2013,
though volatility still
relatively low vs.
historical levels |
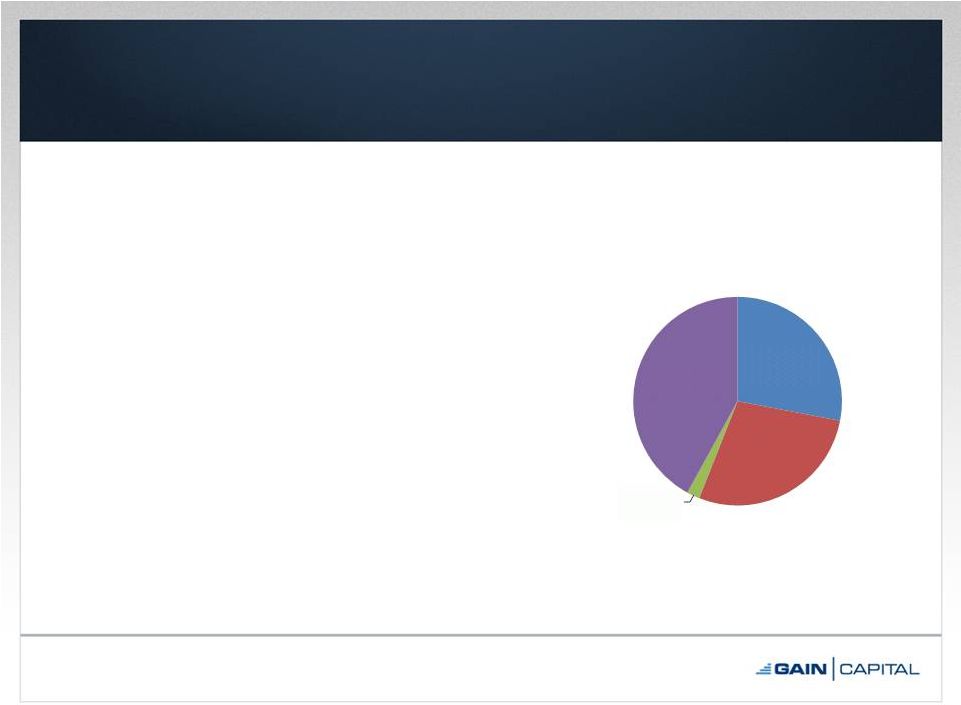 Retail
OTC Business Continues to Evolve •
Geographically diversified business
–
In FY 2012, 28% of retail business from North
America; 51% in FY 2010
–
Presence in key markets; Canada service
launched in 2012
•
Expanded product offering
–
Introduction of TRADE, with over 450 FX &
CFD markets, up from 70 in 2011
–
Additional markets planned for 2013
•
Continued growth in mobile trading
–
64% year-over-year volume growth
–
26% of clients traded on a mobile device in
2012
•
Indirect business 37% of volume in 2012
–
New white label partners from Turkey, US,
Hong Kong, Eastern Europe & New Zealand
7
FY 2012 Retail OTC Volume
North America
28%
Asia-Pac
42%
EMEA
28%
Rest of World
2% |
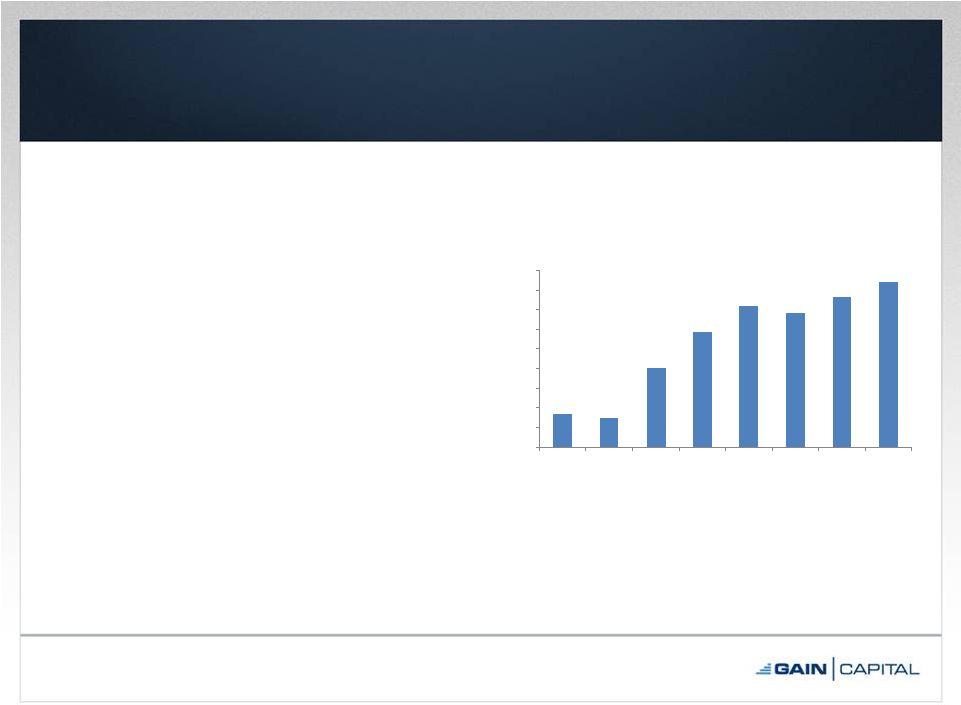 GTX
- Strong Momentum
8
•
Trading volumes continued
steady ramp in 2012
•
Doubled execution desk staff in
Q3
•
Key executive from Knight hired in
Q4 2012 to lead institutional
business
•
Q1 2013 results continue to show
upward trajectory
•
Multi-dealer ECN provides
opportunities in both institutional
and retail OTC markets
$1.7
$1.5
$4.0
$5.9
$7.2
$6.8
$7.6
$8.4
$0.0
$1.0
$2.0
$3.0
$4.0
$5.0
$6.0
$7.0
$8.0
$9.0
Q1 11
Q2 11
Q3 11
Q4 11
Q1 12
Q2 12
Q3 12
Q4 12
Average Daily Volume
Note: Dollars in billions. |
 OEC
– Strategic Entry into Futures
9
•
Transaction closed in late Q3 2012
–
Acquired
from
Schwab
&
Co.
for
$9.5
million
(net
of
$2.5
million
cash
received)
•
Continues to show growth in key operating metrics and financials
•
Q1 2013 revenue run-rate trending significantly higher than FY
2012
•
US futures market ripe for further consolidation
–
Increasing regulatory costs impacting smaller firms |
 Growth Through M&A
•
GAIN continues to grow its business via M&A
–
Amplifies our expansion into new products, customer segments
or geographies
•
Strength in M&A driven by previous transaction experience
–
6 asset deals in last 3 years (GFT & FX Solutions in last three
months)
–
Acquisition of OEC from Schwab in late 2012
•
Reputation as a fair counterparty with strong integration skills
•
M&A pipeline remains strong in domestic and international
markets
10 |
 Financial Review
Daryl Carlough, Interim CFO |
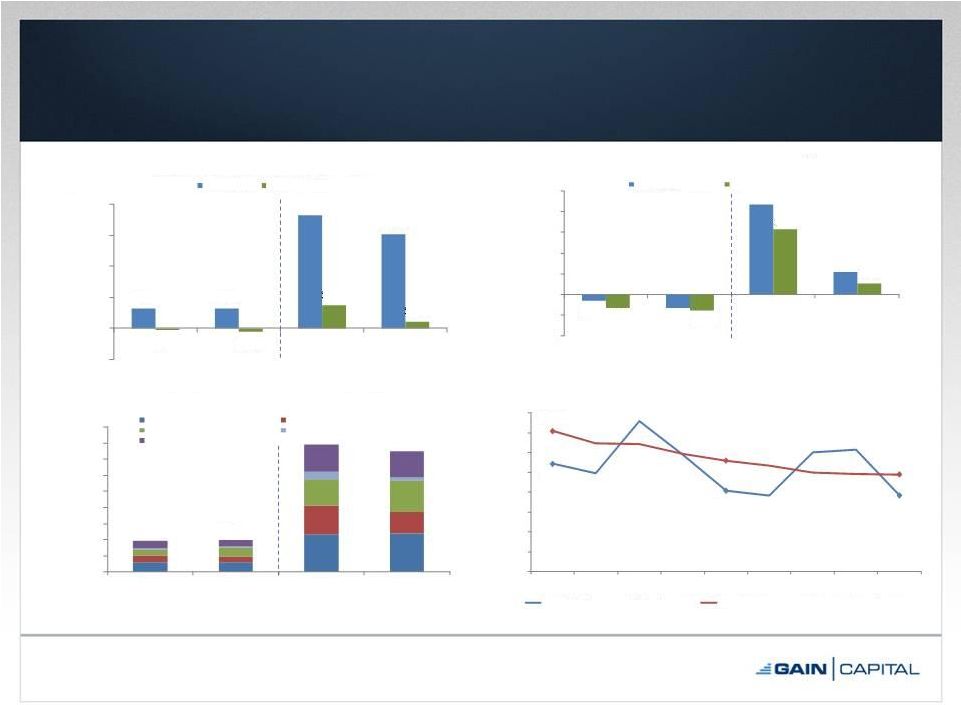 4 Quarter & FY 2012 Financial Results
12
Note: Dollars in millions.
4
Quarter
Full Year
4
Quarter
Full Year
4
th
Quarter
Full Year
$31.6
$32.4
$181.5
$151.4
($3.1)
($5.0)
$36.6
$11.1
($50.0)
$0.0
$50.0
$100.0
$150.0
$200.0
2011
2012
2011
2012
Net Revenue & Adjusted EBITDA
Net Revenue
Adjusted EBITDA
(1)
$38.3
$39.8
$158.2
$150.3
$0
$20
$40
$60
$80
$100
$120
$140
$160
$180
2011
2012
2011
2012
Total Expenses
Comp & Benefits
Marketing
Trading
Purchase Intangible Amort.
All Other
($1.6)
($3.3)
$21.7
$5.5
($3.3)
($3.8)
$15.7
$2.6
($10.0)
($5.0)
$0.0
$5.0
$10.0
$15.0
$20.0
$25.0
2011
2012
2011
2012
GAAP & Adjusted Net Income
(2)
Adjusted Net Income
GAAP Net Income
$108.5
$81.3
$76.6
$141.5
$111.8
$97.9
$0.0
$20.0
$40.0
$60.0
$80.0
$100.0
$120.0
$140.0
$160.0
4Q 10
1Q 11
2Q 11
3Q 11
4Q 11
1Q 12
2Q 12
3Q 12
4Q 12
Retail Trading Revenue per Million
Retail Trading Revenue per Million (Quarterly)
Retail Trading Revenue per Million (Last Twelve Months)
th
th
th
(1)
Reconciliation of net income to adjusted EBITDA is available in the appendix to this presentation. (2)
Reconciliation of net income to adjusted net income available in appendix to this presentation. |
 Quarterly Dividend & Share Buyback
•
$0.05 per share quarterly dividend approved
–
Record Date: March 12, 2013
–
Payment Date: March 21, 2013
–
0.4 mm repurchased in 4Q 2012 at an average price of $4.45
13
•
Continue to repurchase shares pursuant to our share buyback
program
•
$8.7mm of shares repurchased LTD |
 2013
Opportunities •
Regulatory change creating organic and M&A opportunities for GAIN
due to our scale and strong balance sheet
–
Higher regulatory costs coupled with challenging market conditions creating
opportunities for consolidation in several key markets
–
Potential
loss
of
credit
card
funding
in
US
10%
of
GAIN’s
deposits
in
2012)
–
More active oversight in lightly regulated markets like Cyprus, Malta, etc.
marginalizing many offshore competitors
•
Continued growth in CFD trading volumes among our international
retail customer base
•
Continued growth in emerging markets in Asia Pac and Middle East
•
Leverage cross sell opportunities in complementary futures, retail
OTC and institutional offerings –
strong multi asset product offering
•
Poised to benefit from any improvement in market conditions
14
(~ |
 Appendix |
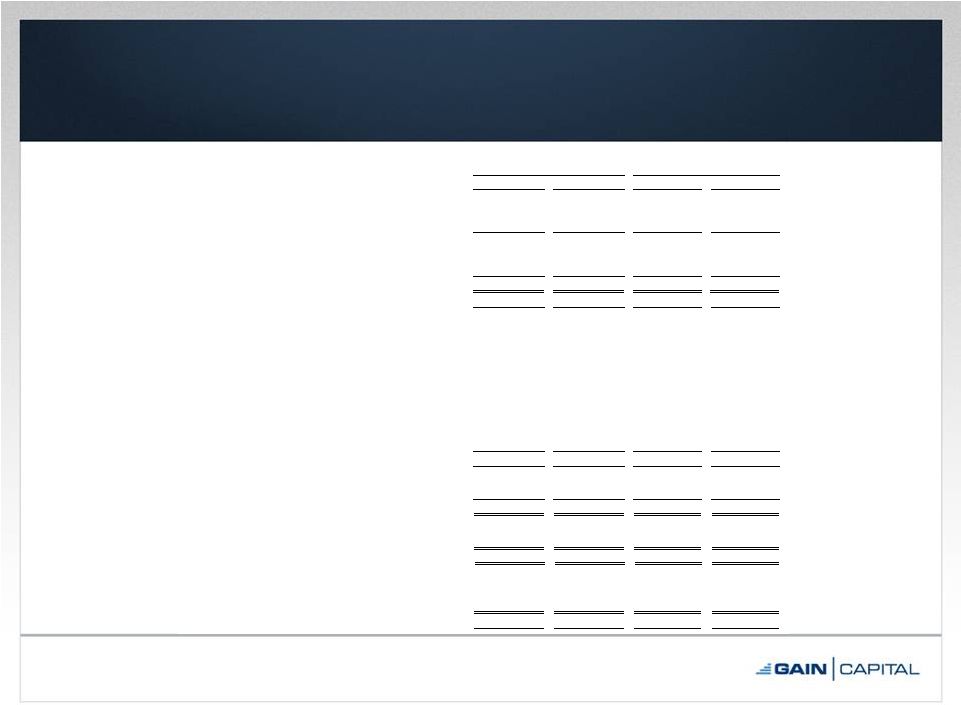 Condensed Consolidated Statements of Operations
16
Note: Unaudited. Dollars in millions, except per share data.
(1)
Non-recurring expenses relating to cost-savings effected in 2Q 2012.
Three Months Ended
Twelve Months Ended
December 31,
December 31,
Revenue
2012
2011
2012
2011
Trading revenue
22.9
$
29.8
$
127.5
$
175.9
$
Commission revenue
7.8
1.4
21.4
4.6
Other revenue
1.6
0.4
2.3
1.8
Total non-interest revenue
32.3
31.6
151.2
182.3
Interest revenue
0.2
0.3
0.6
0.6
Interest expense
(0.1)
(0.3)
(0.4)
(1.4)
Total net interest revenue/(expense)
0.1
-
0.2
(0.8)
Net revenue
32.4
31.6
151.4
181.5
Expenses
Employee compensation and benefits
12.0
11.5
47.5
46.4
Selling and marketing
6.9
8.2
27.0
36.2
Trading expenses and commissions
11.2
7.5
38.0
33.0
General & Administrative
5.1
5.5
20.1
21.8
Depreciation and amortization
1.7
1.0
4.9
3.9
Purchased intangible amortization
0.7
2.5
4.1
8.9
Communication and data processing
2.1
2.0
7.7
7.1
Bad debt provision
0.1
0.1
0.4
0.9
Restructuring
(1)
-
-
0.6
-
Total
39.8
38.3
150.3
158.2
(Loss)/income before tax expense
(7.4)
(6.7)
1.1
23.3
Income tax (benefit)/expense
(3.6)
(3.4)
(1.5)
7.6
Net (Loss)/income
(3.8)
$
(3.3)
$
2.6
$
15.7
$
Basic
(0.11)
$
(0.10)
$
0.08
$
0.46
$
Diluted
(0.11)
$
(0.10)
$
0.07
$
0.40
$
Weighted averages common shares outanding used
in computing earnings per common share:
Basic
35,081,311
34,205,991
34,940,800
34,286,840
Diluted
35,081,311
34,205,991
37,880,208
38,981,792
(Loss)/earnings per common share: |
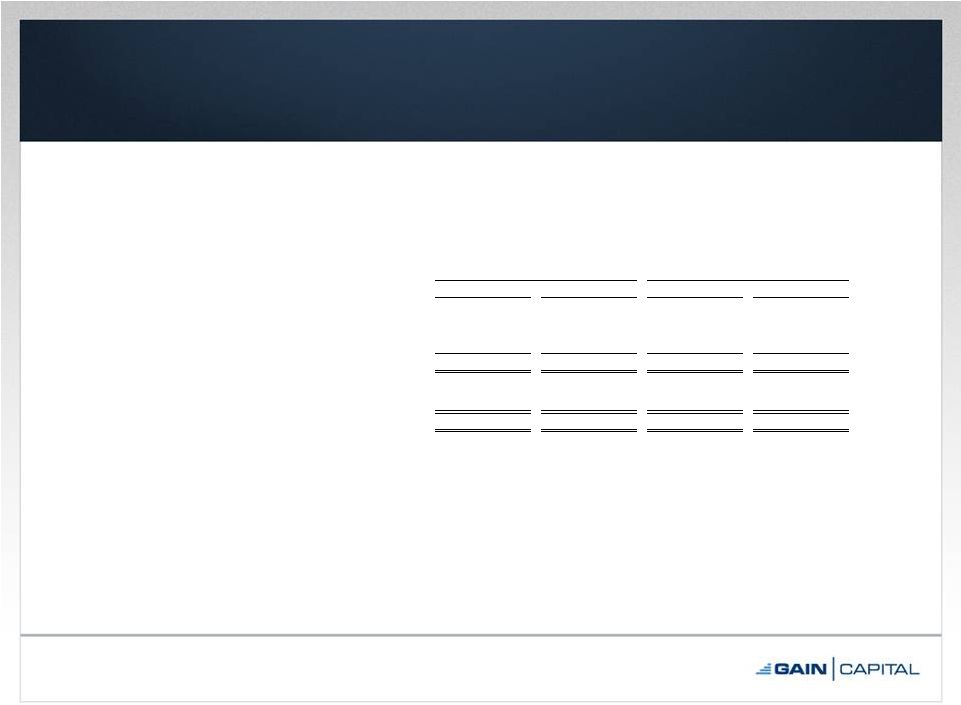
 Consolidated Balance Sheet
17
Note: Unaudited. Dollars in millions.
As of December 31,
2012
2011
ASSETS:
Cash
and
cash
equivalents
36.8
$
60.3
$
Cash and securities held for customers
446.3
310.4
Short term investments
1.4
0.1
Receivables from banks and brokers
89.9
85.4
Property
and
equipment
-
net
of
accumulated
depreciation
11.0
7.5
Prepaid assets
7.7
9.9
Goodwill
9.0
3.1
Intangible
assets,
net
9.9
10.8
Other
assets
17.9
18.1
Total
assets
629.9
$
505.6
$
LIABILITIES AND SHAREHOLDERS' EQUITY:
Payables to customer, brokers, dealers, FCM'S and other regulated entities
446.3
$
310.4
$
Accrued compensation & benefits payable
6.1
4.9
Accrued expenses and other liabilities
12.5
14.9
Income tax payable
1.3
2.6
Note payable
-
7.9
Total
liabilities
466.2
$
340.7
$
Shareholders' Equity
163.7
$
164.9
$
Total
liabilities
and
shareholders'
equity
629.9
$
505.6
$
(1)
Previously the Company presented all of its cash and cash equivalents in “Cash and cash
equivalents” on the Consolidated Balance Sheet. However, in an effort to improve
clarity of presentation and reflect the separation between the cash on hand which correlates to amounts held
on behalf of customers and free cash, the Company has separated all cash and cash equivalents into
“Cash and cash equivalents” and “Cash and securities held
for customers”. (1) |
 Current Liquidity
18
Note: Dollars in millions.
(1)
Reflects cash that would be received from brokers following the close-out of
all open positions. (2)
Excludes current liabilities of $19.9mm and capital charges associated with open
positions as of 12/31/2012. (3)
The Company has a $50.0mm revolving line of credit. The amount available
varies from time to time due to the terms of financial covenants contained in
the credit facility agreement. As of December 31, 2012, $17.0mm was available.
12/31/2012
Cash and cash equivalents
$36.8
Cash and securities held for customers
446.3
Short term investments
1.4
Receivable from banks and brokers
(1)
89.9
Total Operating Cash
$574.4
Less: Cash and securities held for customers
(446.3)
Free Operating Cash
$128.1
Less: Minimum regulatory capital requirements
(45.6)
Less: Note payable
-
Free
Cash
Available
(2)
$82.5
Add:
Available credit
facility
(3)
17.0
Available Cash & Liquidity
$99.5 |
 4
th
Quarter & FY 2012 Financial Summary
19
Note: Dollars in millions, except per share data.
(1)
See page 21 for a reconciliation of GAAP net income to adjusted EBITDA.
(2)
See page 20 for a reconciliation of GAAP net income to adjusted net income.
(3)
See page 22 for a reconciliation of GAAP EPS to adjusted EPS.
(4)
Adjusted EBITDA margin is calculated as adjusted EBITDA divided by net revenue (ex.
interest expense on note). 3 Months Ended December 31,
Fiscal Year Ended December 31,
'12 v '11 % Change
2012
2011
2012
2011
4th Quarter
Full Year
Net Revenue
$32.4
$31.6
$151.4
$181.5
3%
(17%)
Interest Expense on Note
-
0.1
0.4
0.5
(100%)
(20%)
Net Revenue (ex. Interest Expense on Note)
$32.4
$31.7
$151.8
$182.0
2%
(17%)
Operating Expenses
37.4
34.8
140.7
145.4
7%
(3%)
Adjusted EBITDA
(1)
($5.0)
($3.1)
$11.1
$36.6
61%
(70%)
GAAP Net (Loss)/Income
($3.8)
($3.3)
$2.6
$15.7
15%
(83%)
(2)
(3.3)
(1.6)
5.5
21.7
106%
(75%)
GAAP EPS (Diluted)
($0.11)
($0.10)
$0.07
$0.40
10%
(83%)
Adjusted EPS (Diluted)
(3)
(0.09)
(0.05)
0.14
0.56
(74%)
Adjusted EBITDA Margin %
(1)(4)
(15.4%)
(9.8%)
7.3%
20.1%
(6 pts)
(13 pts)
Net Income Margin %
(11.7%)
(10.4%)
1.7%
8.7%
(1 pts)
(7 pts)
Adjusted Net Income Margin %
(2)
(10.2%)
(5.1%)
3.6%
12.0%
(5 pts)
(8 pts)
80%
Adjusted Net (Loss)/Income |
 Adjusted Net Income & Margin Reconciliation
20
Note: Dollars in millions, except per share data.
Three Months Ended December 31,
Fiscal Year Ended December 31,
2012
2011
2012
2011
Net Revenue
32.4
$
31.6
$
151.4
$
181.5
$
Net (Loss)/income
(3.8)
(3.3)
2.6
15.7
Plus: Purchase intangible amortization (net of tax)
0.5
1.7
2.9
6.0
Adjusted Net (Loss)/Income
(3.3)
$
(1.6)
$
5.5
$
21.7
$
Adjusted (Loss)/Earnings per Share
Basic
(0.09)
$
(0.05)
$
0.16
$
0.63
$
Diluted
(0.09)
$
(0.05)
$
0.14
$
0.56
$
Net Income Margin %
(11.7%)
(10.4%)
1.7%
8.7%
Adjusted Net Income Margin %
(10.2%)
(5.1%)
3.6%
12.0% |
 Adjusted
EBITDA
&
Margin
Reconciliation
21
Note: Dollars in millions.
(1)
Non-recurring expenses relating to cost savings effected in 2Q 2012.
(2)
Adjusted EBITDA margin is calculated as adjusted EBITDA divided by net revenue (ex.
interest expense). Three Months Ended December 31,
Fiscal Year Ended December 31,
2012
2011
2012
2011
Net Revenue
32.4
$
31.6
$
151.4
$
181.5
$
Interest Expense on Note
-
0.1
0.4
0.5
Net Revenue (ex. Interest Expense on Note)
32.4
$
31.7
$
151.8
$
182.0
$
Net (loss)/income
(3.8)
$
(3.3)
$
2.6
$
15.7
$
Depreciation & amortization
1.7
1.0
4.9
3.9
Purchase intangible amortization
0.7
2.5
4.1
8.9
Interest expense on note
-
0.1
0.4
0.5
Restructuring
(1)
-
-
0.6
-
Income tax (benefit)/expense
(3.6)
(3.4)
(1.5)
7.6
Adjusted EBITDA
(5.0)
$
(3.1)
$
11.1
$
36.6
$
Adjusted EBITDA Margin %
(2)
(15.4%)
(9.8%)
7.3%
20.1% |
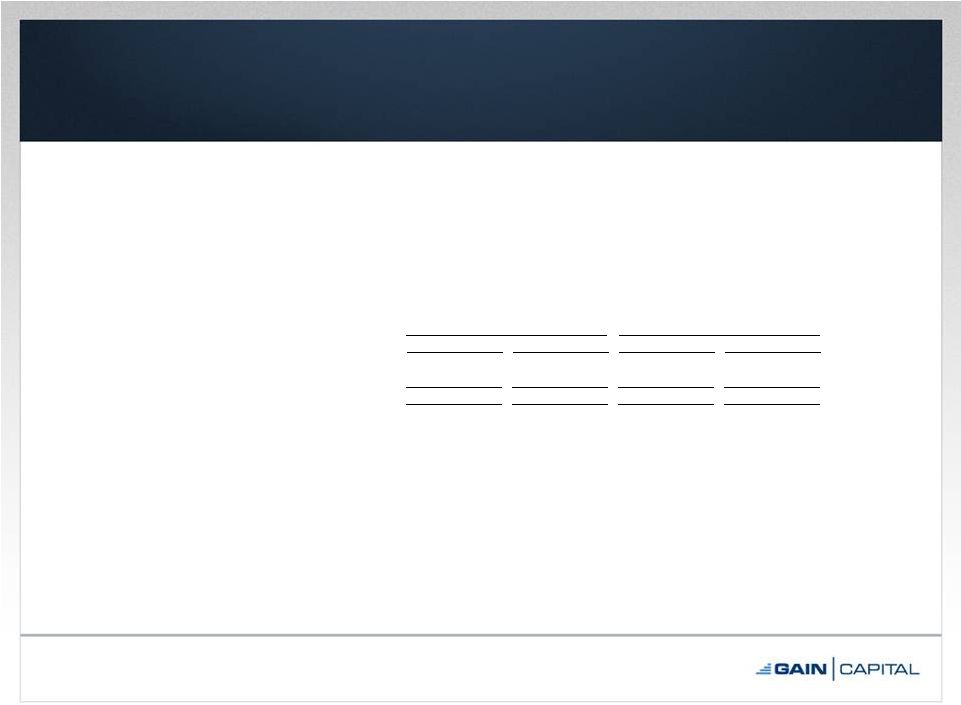 Adjusted EPS (Diluted) Reconciliation
22
(1)
Net of tax.
Three Months Ended December 31,
Fiscal Year Ended December 31,
2012
2011
2012
2011
GAAP (Loss)/Earnings per Share (Diluted)
(0.11)
$
(0.10)
$
0.07
$
0.40
$
Plus: Purchase intangible amortization
(1)
0.02
0.05
0.07
0.16
Adjusted (Loss)/Earnings per Share (Diluted)
(0.09)
$
(0.05)
$
0.14
$
0.56
$
|
 Operating Metrics
(1)
23
Note: Volume in billions. Assets in millions.
(1)
Definitions for all our operating metrics are available on page 24.
(2)
Reflects 1 month of OEC data.
3 Months Ended,
30-Mar-11
30-Jun-11
30-Sep-11
31-Dec-11
31-Mar-12
30-Jun-12
30-Sep-12
31-Dec-12
Retail
OTC Trading Volume
$402.5
$357.2
$447.9
$366.4
$385.1
$340.8
$278.7
$298.8
Average Daily Volume
$6.3
$5.4
$6.9
$5.6
$5.9
$5.2
$4.2
$4.7
Active OTC Accounts
66,106
65,455
65,397
63,435
62,723
61,746
59,166
60,219
Futures DARTs
-
-
-
-
-
-
15,270
(2)
13,000
Funded Accounts
85,698
78,379
77,013
76,485
73,483
74,620
82,394
85,099
Customer Assets
$283.0
$293.1
$286.4
$310.4
$325.9
$320.2
$426.6
$446.3
Institutional
Trading Volume
$110.1
$97.4
$260.0
$386.4
$468.0
$442.5
$503.7
$538.4
Average Daily Volume
$1.7
$1.5
$4.0
$5.9
$7.2
$6.8
$7.6
$8.4 |
 Definition of Metrics
•
Funded Accounts
–
Retail accounts who maintain a cash balance
•
Active OTC Accounts
–
Retail accounts who executed a transaction during a given period
•
Trading Volume
–
Represents the U.S. dollar equivalent of notional amounts traded
•
Futures DARTs
–
Represents the average daily trades transacted by OEC customers
•
Customer Assets
–
Represents amounts due to clients, including customer deposits and
unrealized gains or losses arising from open positions
24 |
 4
Quarter
&
Full
Year
2012
Financial and Operating Results
March 12, 2013
th |