Attached files
| file | filename |
|---|---|
| 8-K - FORM 8-K - Manitex International, Inc. | d499805d8k.htm |
| EX-99.1 - EX-99.1 - Manitex International, Inc. | d499805dex991.htm |
 “Focused
manufacturer of
engineered lifting
equipment”
Exhibit 99.2
Manitex International, Inc.
Conference Call
Fourth Quarter and Full Year 2012
March 11th, 2013 |
 2
Forward Looking Statements &
Non GAAP Measures
“Focused
manufacturer of
engineered lifting
equipment”
Safe Harbor Statement under the U.S. Private Securities Litigation Reform Act of
1995: This presentation contains statements that are forward-looking in
nature which express the beliefs and expectations of management including
statements regarding the Company’s expected results of operations or liquidity;
statements concerning projections, predictions, expectations, estimates or forecasts
as to our business, financial and operational results and future economic
performance; and statements of management’s goals and objectives and
other similar expressions concerning matters that are not historical facts. In some
cases, you can identify forward-looking statements by terminology such as
“anticipate,” “estimate,”
“plan,”
“project,”
“continuing,”
“ongoing,”
“expect,”
“we believe,”
“we intend,”
“may,”
“will,”
“should,”
“could,”
and similar expressions. Such statements are based on current plans, estimates and
expectations and involve a number of known and unknown risks, uncertainties
and other factors that could cause the Company's future results, performance
or achievements to differ significantly from the results, performance or
achievements expressed or implied by such forward-looking statements. These factors and additional
information are discussed in the Company's filings with the Securities and Exchange
Commission and statements in this presentation should be evaluated in light of
these important factors. Although we believe that these statements are based
upon reasonable assumptions, we cannot guarantee future results.
Forward-looking statements speak only as of the date on which they are made, and
the Company undertakes no obligation to update publicly or revise any
forward-looking statement, whether as a result of new information, future
developments or otherwise. Non-GAAP Measures: Manitex International from
time to time refers to various non-GAAP (generally
accepted accounting principles) financial measures in this presentation.
Manitex believes that this information is useful to understanding its
operating results without the impact of special items. See Manitex’s Full
Year and Fourth Quarter 2012 Earnings Release on the Investor Relations section of our
website www.manitexinternational.com
for a description and/or reconciliation of these measures.
|
 3
“Focused
manufacturer of
engineered lifting
equipment”
Overview
•
2012 was another year of record growth and strong financial performance.
–
Sales
of
$205.2
million
(44%
increase)
–
Net
income
of
$8.1
million
(191%
increase)
–
EPS
$0.68
(183%
increase)
–
EBITDA
$18.0
million
(61%
increase),
8.7%
of
sales
–
Backlog
$130.4
million
(56%
increase)
•
Economies remain in slow growth state together with continued uncertainty. N.
America general commercial activity inching upwards (including rental
activity), Europe flat at best, selective international demand. Energy
sector medium term outlook very positive
•
We remain optimistic for above average sector growth in 2013 and
beyond
supported by:
–
Approx.
50%
of
business
involved
with
high
long
term
growth
energy
sector
–
Well
received
product
launches
in
2012
and
planned
2013
launches
–
Replacement
cycle
for
older
equipment
approaching,
and
continued
uptick
in
demand
–
Parts
sales
to
follow
increase
in
unit
sales
over
past
few
years |
 4
“Focused
manufacturer of
engineered lifting
equipment”
Business Update
•Market conditions consistent with prior quarter
•Significant degree of uncertainty still exists in N. America, influencing
buying decisions •N. American general construction / housing steady,
but still relatively subdued. Energy still active and positive
outlook •European
markets
continue
to
be
adversely
impacted
from
economic
conditions
and
lack
of
credit
•Selective international markets and sectors remain a positive
opportunity •Product demand profile remains consistent with recent
quarters i.e. still focused on more specialized, higher tonnage units or
industry specific product (e.g. energy). •
12/31/12 Backlog $130.4 million
•YOY increase 56%, sequential quarter increase 4%
•Broad based order book although boom trucks continue to be heavily
represented •
Strongest
demand
for
our
Manitex
boom
trucks.
Large
tonnage
unit
shipments
up
over
120% compared
to
2011
•
Specialized trailer demand continues to strengthen in response to continued
product developments and mining, rail and international demand
•
Invested in sales network with several new distributors appointed in last 12
months •
Product offering expanded, key focus to benefit from selling newly introduced
products |
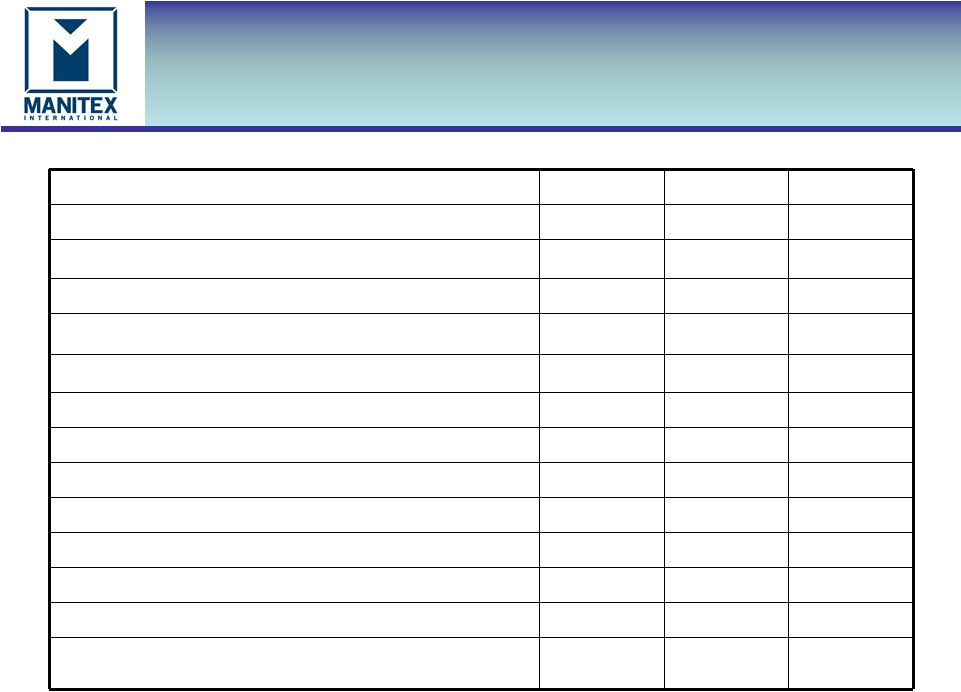 5
Key Figures -
Annual
“Focused
manufacturer of
engineered lifting
equipment”
USD thousands
2012
2011
2010
Net sales
$205,249
$142,291
$95,875
% change in 2012 to prior period
44.2%
114.1%
Gross profit
40,464
29,250
23,334
Gross margin %
19.7%
20.6%
24.3%
Operating expenses
26,005
22,649
17,797
Net Income
8,077
2,780
2,109
Earnings per share
$0.68
$0.24
$0.19
Ebitda
17,957
11,120
8,676
Ebitda % of Sales
8.7%
7.8%
9.0%
Working capital
61,426
41,032
31,692
Current ratio
2.4
2.4
2.4
Backlog
130,352
83,700
39,905
% change in 2012 to prior period
55.7%
226.7% |
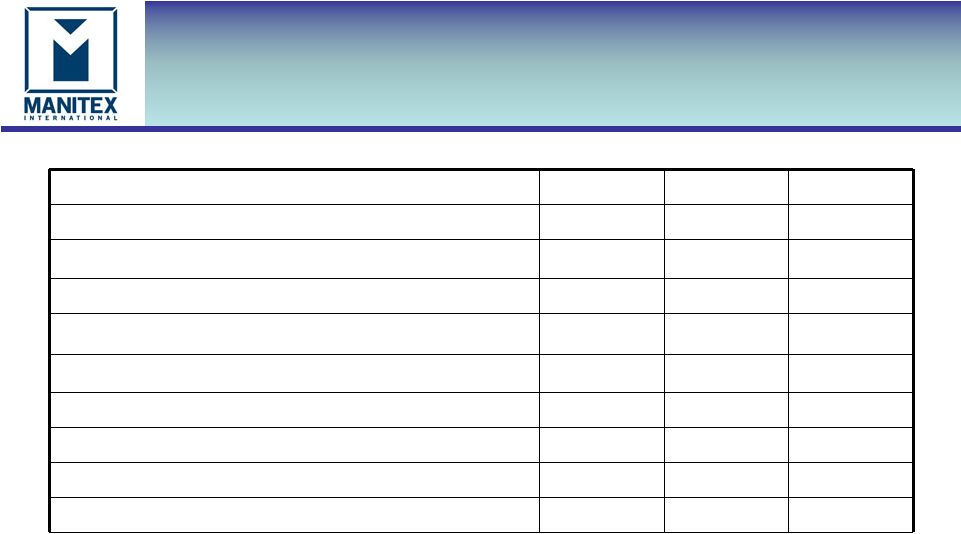 6
Key Figures -
Quarterly
“Focused
manufacturer of
engineered lifting
equipment”
USD thousands
Q4-2012
Q4-2011
Q3-2012
Net sales
$56,524
$36,561
$53,380
% change in Q4-2012 to prior period
54.6%
5.9%
Gross profit
10,322
7,489
10,810
Gross margin %
18.3%
20.5%
20.3%
Operating expenses
7,046
6,614
6,343
Net Income
2,014
289
2,504
Earnings Per Share
$0.16
$0.03
$0.21
Ebitda
4,102
2,876
5,349
Ebitda % of Sales
7.3%
7.9%
10.0% |
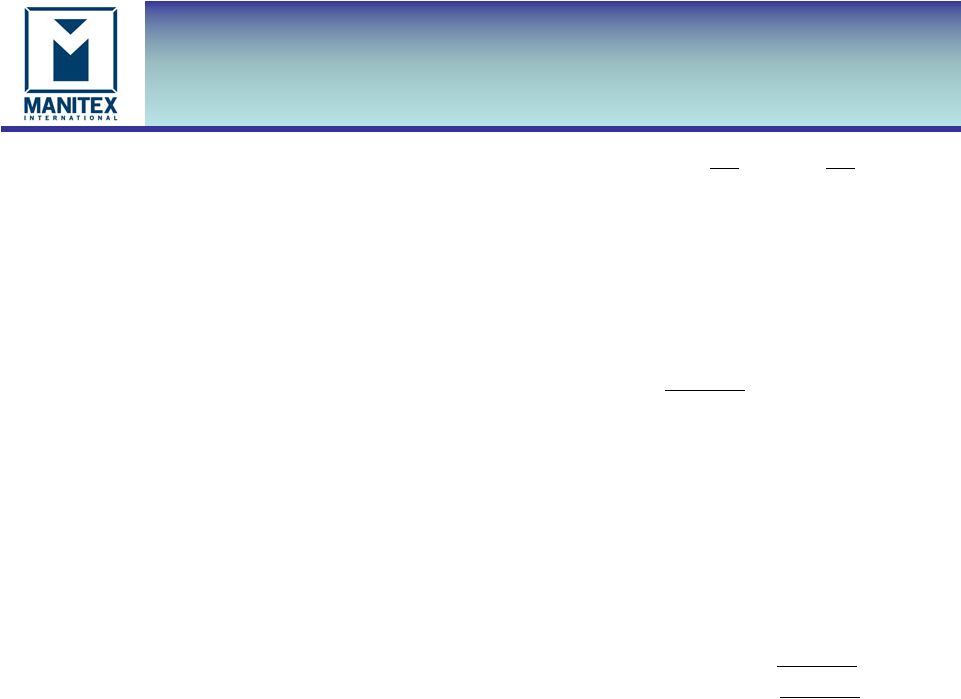 7
“Focused
manufacturer of
engineered lifting
equipment”
2012 Operating Performance
$m
$m
2011 Net income
2.8
Gross profit impact of increased sales of $63.0 million
(2012 sales less 2011 sales at 2011 gross profit % ).
13.0
Impact from lower margin
(2012 gross profit % -
2011 gross profit % multiplied by 2012 sales)
(1.8)
Increase in gross profit
11.2
Increase in R&D expense
Increase in SG&A expenses
2011 legal settlement
(0.9)
(3.7)
1.2
Interest
0.1
Other income / (expense)
(0.2)
Increase in tax
(2.4)
2012 Net income
$ 8.1 |
 8
Working Capital
“Focused
manufacturer of
engineered lifting
equipment”
$000
2012
2011
2010
Working Capital
$61,426
$41,032
$31,692
Days sales outstanding (DSO)
58
60
60
Days payable outstanding (DPO)
51
59
62
Inventory turns
3.0
2.7
2.9
Current ratio
2.4
2.4
2.4
Operating working capital
74,300
50,007
36,763
Operating working capital % of
annualized LQS
32.9%
34.2%
31.1%
•Major movements in working capital increase 2012 v 2011 of $20.4m
•Cash, net of short term credit facility, $0.9m, Receivables $12.3m,
inventory $19.0m, offset by increased accounts payable $7.0m,
accrued expenses $2.8m, other current liabilities $1.2m, and
short term notes payable $0.9m •Inventory: increases in raw
materials $11.6m and WIP $3.2m and finished goods $4.2m to support
growth •Working capital ratios in good position v 2011
|
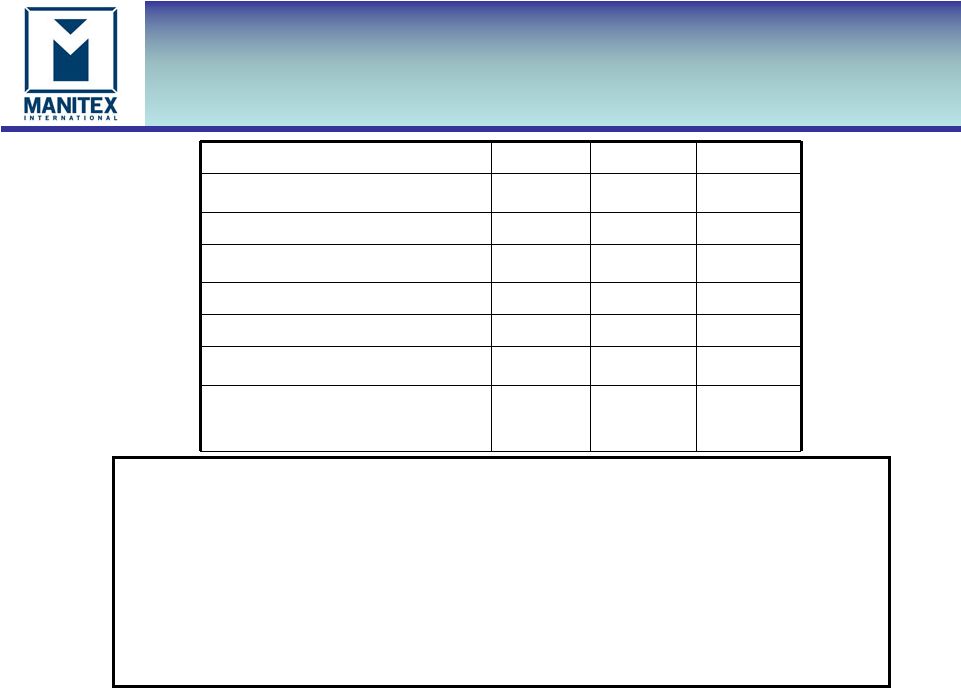
 9
“Focused
manufacturer of
engineered lifting
equipment”
$000
2012
2011
2010
Total Cash
1,889
71
662
Total Debt
49,138
42,227
34,019
Total Equity
59,533
46,794
43,274
Net capitalization
106,782
88,950
76,631
Net debt / capitalization
44.2%
47.4%
43.5%
EBITDA
17,957
11,120
8,676
EBITDA % of sales
8.7%
7.8%
9.0%
•Increase in debt at 12/31/2012 from 12/31/2011 of $6.9m, ($5.1m net of
cash) •
Increase in lines of credit, equipment finance and Italian working capital finance
$13.5m •
Repayments of $6.6 m on long term debt
•N. American revolver facilities, based on available collateral at 12/31/12
was $43m. •N. American revolver availability at 12/31/12 of $7.8m
•Record EBITDA of $18 million for 2012
Debt & Liquidity
•
Net capitalization is the sum of debt plus equity minus cash
•
Net debt is total debt less cash |
 10
Summary
“Focused
manufacturer of
engineered lifting
equipment”
•
Niche product and market strategy continues to deliver strong growth
potential
•
Solid 2012 financial performance and strategic developments
–
Output capabilities expanded
–
Significant expansion into new high growth markets to complement
traditional commercial focus
–
New products launched or in pipeline
–
Balance sheet strengthened by debt repayments and working
capital facilities increased for continued growth
•
Optimistic outlook
–
Expect full year 2013 to be another year of profitable growth
|