Attached files
| file | filename |
|---|---|
| 8-K - FORM 8-K - Nationstar Mortgage Holdings Inc. | d498381d8k.htm |
| EX-99.1 - EX-99.1 - Nationstar Mortgage Holdings Inc. | d498381dex991.htm |
 Q4 and
FY 2012 Earnings Presentation Three Months and Twelve Months Ended December 31,
2012 March 7, 2013
Exhibit 99.2 |
 Forward
Looking Statements 1
Any statements in this presentation that are not historical or current facts are
forward-looking statements. Forward-looking statements include,
without limitation, statements concerning plans, objectives, goals, projections,
strategies, future events or performance, and underlying assumptions and other
statements, which are not statements of historical facts. Forward-looking statements convey Nationstar Mortgage
Holdings Inc.’s (“Nationstar”) current expectations or forecasts of
future events. When used in this presentation, the words “anticipate,”
“appears,” “believe,” “foresee,” “intend,”
“should,” “expect,” “estimate,” “target,” “project,” “plan,” “may,” “could,” “will,” “are likely” and similar
expressions are intended to identify forward-looking statements. These statements
involve predictions of our future financial condition, performance, plans and
strategies, and are thus dependent on a number of factors including, without limitation, assumptions and data that may
be imprecise or incorrect. Specific factors that may impact performance or other
predictions of future actions have, in many but not all cases, been identified
in connection with specific forward-looking statements. Forward-looking statements involve known and unknown risks,
uncertainties and other factors that may cause Nationstar’s actual results,
performance or achievements to be materially different from any future results,
performances or achievements expressed or implied by the forward-looking statements. Certain of these risks and uncertainties
are described in the “Risk Factors” section of Nationstar Mortgage LLC’s
Form 10-K for the year ended December 31, 2011, Nationstar Mortgage Holdings
Inc.’s Form 10-Q for the quarter ended September 30, 2012, and other reports filed with the SEC, which are available at
the SEC’s website at http://www.sec.gov. We caution you not to place undue
reliance on these forward-looking statements that speak only as of the date
they were made. Unless required by law, Nationstar undertakes no obligation to publicly update or revise any forward-looking
statements to reflect circumstances or events after the date of this presentation.
|
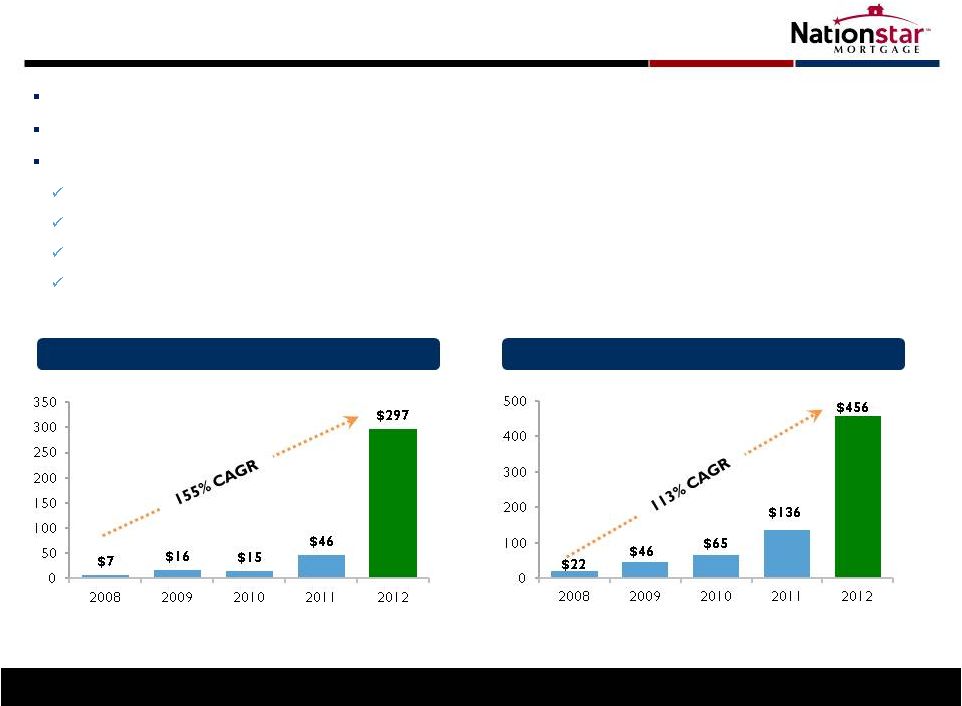 2012: Transformative Year for Nationstar
2
IPO on March 7, 2012; top 3 ranked IPO
(1)
Record EPS for Q4’12 and FY ’12 of $0.71 and $2.40, respectively
Significant YoY increases in key metrics
Revenue +161%
Net Income +882%
Servicing portfolio +94% to $208B
Record origination volume +132% to $7.9B
($mm)
Pre-Tax Income Growth
(2)
AEBITDA Growth
(2,3)
($mm)
By share price appreciation; Renaissance Capital - “Global IPO Market:
2012 Annual Review”; Global statistics include IPOs with a deal size of at least $100 million and exclude closed-end funds and SPACs; 203 deals total
For Operating segments; excludes Legacy segment
Please see Appendix for information on AEBITDA and reconciliations beginning on page 18
1)
2)
3) |
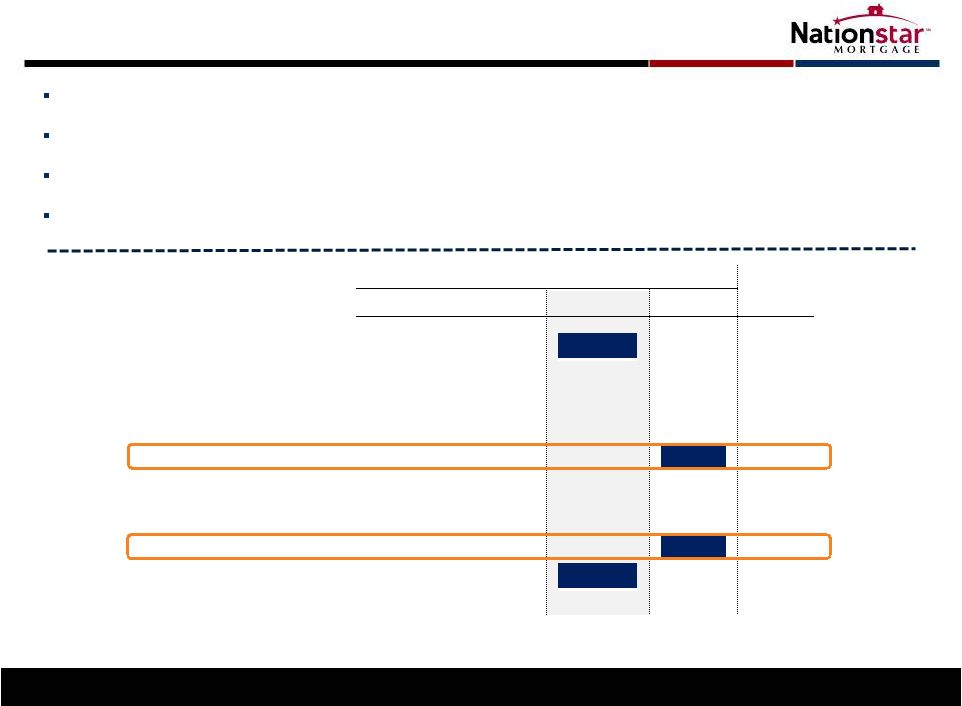
 1 Year IPO
Anniversary: Significant Value Creation 3
Then (IPO)
Now
$1.3B
$3.7B
52%
80%
$14.00
$41.06
0.6M
1.6M
+185%
+54%
+193%
+167%
Increase
Substantial increase in key metrics
Share price value up more than 2.9x since IPO; significant value driven by
performance and expectations Diversified shareholder base and improved
liquidity Strong ROE
40%
Market capitalization
(1)
:
Institutional Ownership
(2)
:
Excludes Fortress
Share price
(1)
:
Average trading volume (Qtr)
:
Return on Equity (thru 12/31):
1)
As of March 6, 2013
2)
As of January 31, 2013 |
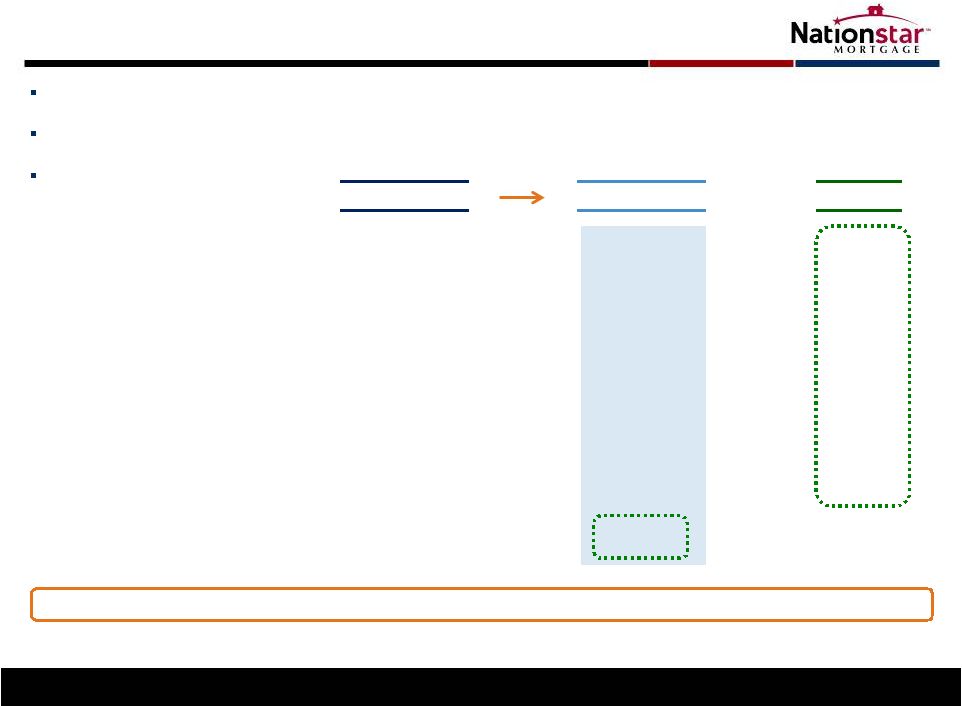
 4
The Future of Our Business
Market dislocation as banks
focus on core customers
Bulk and flow servicing sales
Non-branch origination
opportunities
Non-core and default
servicing
Near term
Banks assess capital and
look for process partners
Mortgage services factory
with plug-in capability
Complete outsourcing
Origination/fulfillment
Continued servicing transfers
Intermediate term
Capital returns to the real
estate market
Investors require best-in-
class asset managers
Agency, non-agency, whole
loan, distressed assets
Credit risk management
essential
Longer term
Market
trends
Services
Well-positioned to capitalize on market trends
Solutionstar |
 Customer-Centric Model
5
Preserve homeownership and increase mortgage affordability
Loan Modifications & HARP Originations
(units)
Cumulative Total
Performance-driven culture emphasizes customer service and
loan performance
Reduced over 60 days delinquency rate by 28% since ‘09
Single point of contact, a cornerstone of our success for 15
years
Completed 51,000 total workouts in ’12 (+25%)
~29,000 modifications in ‘12
100,000 modifications since ‘10
18,000+ HARP loans in ‘12 (+232%)
Servicing portfolio remains HARP rich
Customers
helped since
2010
45,000
127,000
0
25,000
50,000
75,000
100,000
125,000
150,000
175,000
2010
2011
2012
80,000 |
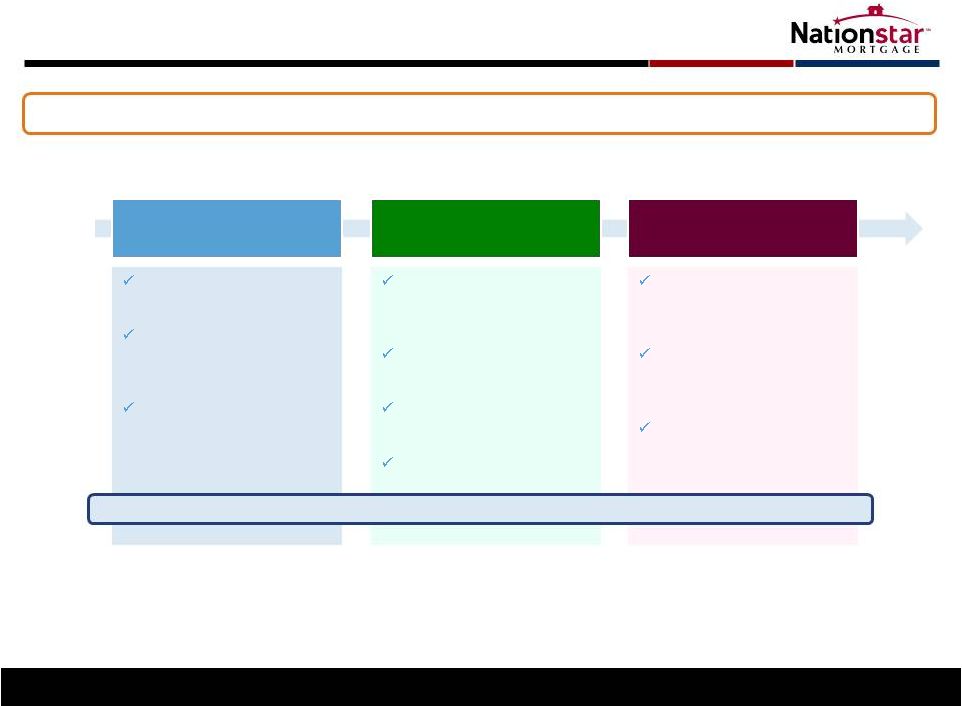
 6
Focused on growth AND profitability
Landmark BofA
Transaction
Strong Pipeline
(1)
Cost Reduction
Initiatives
Jan/Feb:
Announced acquisition of BofA MSRs
Q1/Q2:
PLS third-party approvals & closing
Bulk pipeline:
$300B
Flow servicing target:
$25-50B annual
Flow agreements in place:
$15B annual
Total transfer potential:
Cost per loan:
Automation and strategic sourcing
Delinquencies:
Reduced Aurora 60+ DQ rate by 250 bps
Advances:
$300MM GSE advance securitization executed in Jan.
Non-agency securitization in Q2
Closed Fannie, Freddie, Ginnie portfolios
$2 trillion+
1)
The identified opportunities referenced above are not currently serviced by the Company
and there can be no assurance that these potential servicing transactions will ultimately be consummated, or will
remain the same size. Notwithstanding the above, it is possible that these potential
servicing transactions, if consummated, could result in a partial or total loss of any invested capital.
Servicing: Opportunities in ‘13 and Beyond |
 Originations: Organic Growth for Servicing in ’13 and Beyond
7
Profitable: complements and enhances servicing segment
1)
KB Home FY 2012 10K; Nationstar Mortgage did not originate mortgages for 100% of KB
Home’s home sales in 2012 JV with KB Home
KB Home sold $1.5B of homes in
FY ’12
(1)
Improve capture rates; expense
sharing
Additional ventures with
homebuilders
Source of purchase money volume
Expand volume across channels to
organically grow servicing
Acquire servicing at attractive returns
Source of purchase money volume
Highest margin channel; integrated
with servicing platform
Helps borrowers with lower monthly
payments
Continued focus on HARP &
recapture opportunities to serve
customer
Recapture
Builder
Wholesale/Correspondent
’13/’14 Objectives: Increase Capacity, Productivity and Volume
|
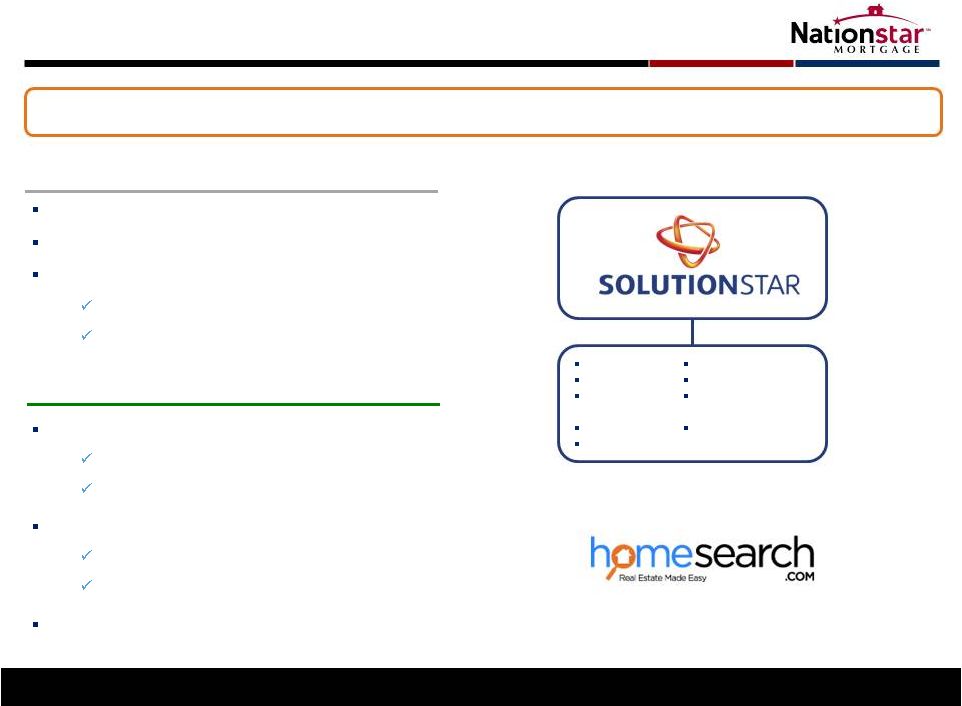 Solutionstar: Meet Evolving Needs of Mortgage Industry
8
Broad array of services & technology offerings spanning entire mortgage
lifecycle Acquired Equifax Settlement Services on 2/7
Appraisal, title and closing
Large bank clients
Launch HomeSearch.com expected in Q1’13
Real estate marketplace
Accelerates sales and improves pricing
Evaluate strategic acquisitions
Key events in ‘13
Strategy
Support originators and servicers
Improve customer experience with seamless integration
Manage REO property sales
Completed 2,000 REO sales since Jan. 1
Future increase with BofA PLS portfolio
REO Sales
Brokerage
Valuation
Services
Title
Closing
Recovery Services
Bankruptcy Services
Foreclosure
Services
Claims Processing |
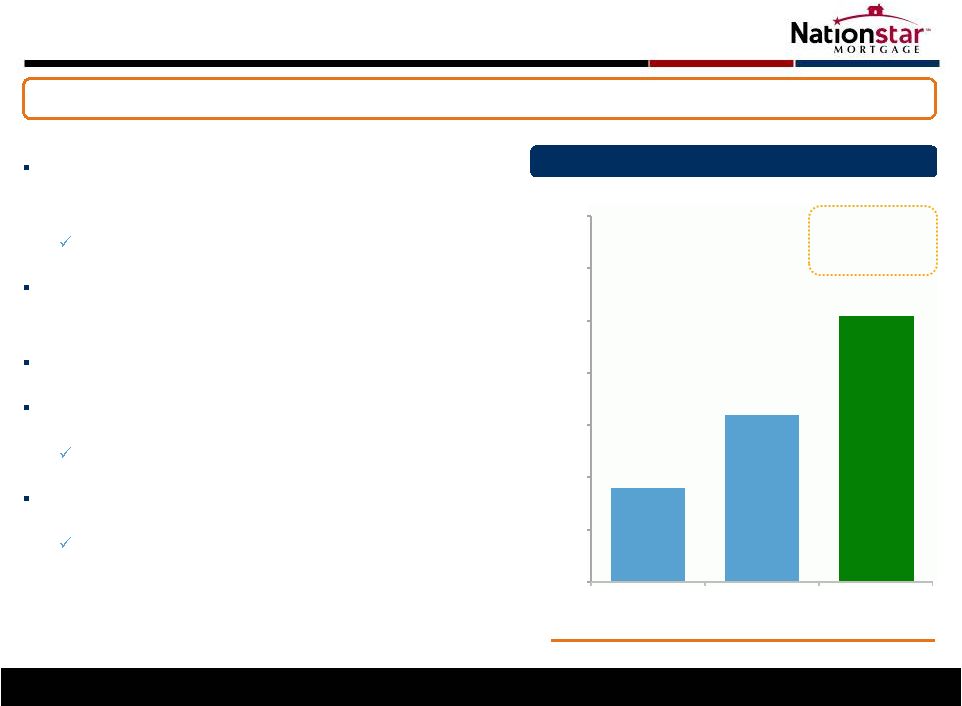
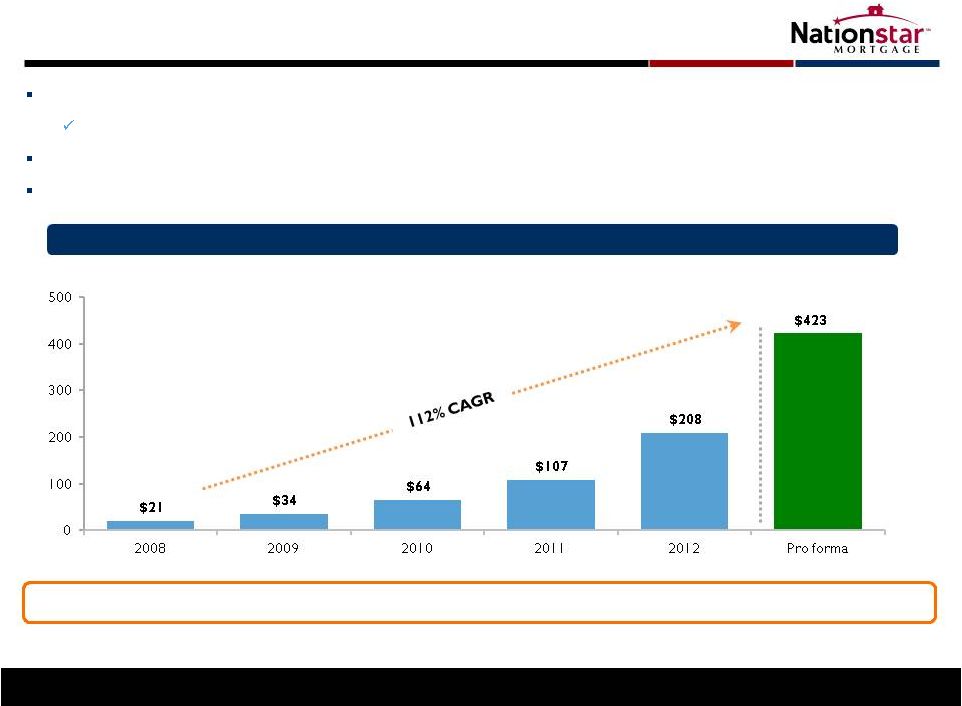 Doubled
size of servicing book Portfolio of $300B+ as of Feb ’13, including closing of BofA agency MSRs
Successful integration of Aurora portfolio
Segment pretax income increased 60% YoY to $35MM
Servicing
Results:
Substantial
Growth;
Building
to
Full
Scale
1)
Pro forma balance represents ending Q4’12 UPB balance plus $215B BofA servicing
portfolio announced on January 7, 2013. Balances may change prior to closing due to normal portfolio run-off
9
($bn of UPB)
Servicing Growth
(1)
As portfolio achieves critical mass, earnings potential realized
|
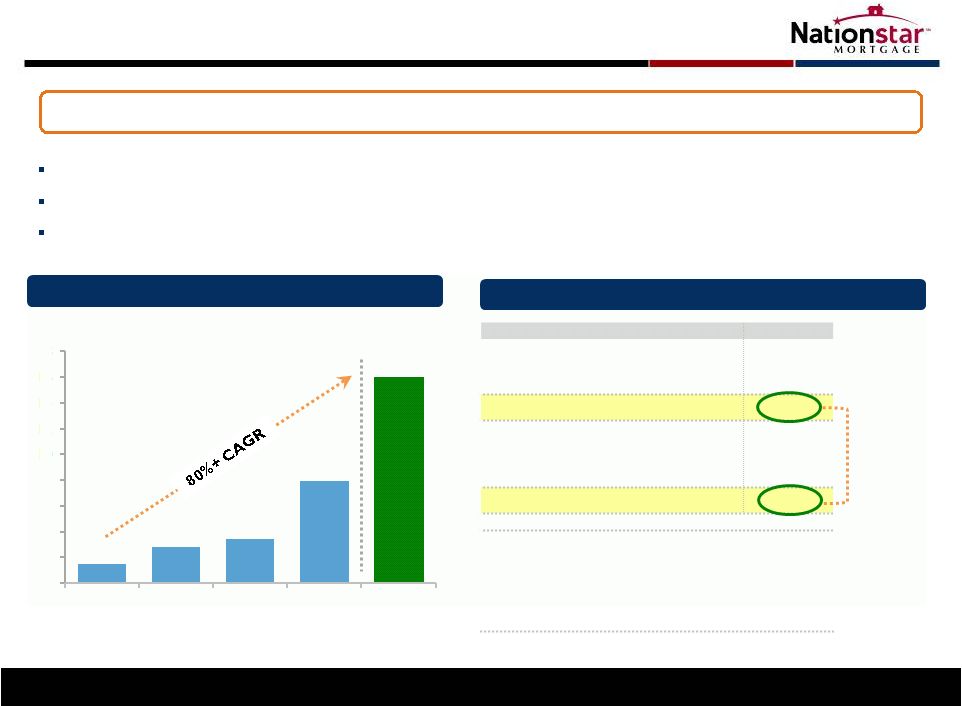 Originations Results: Robust Market Conditions
10
Record
pretax income for Q4’12 and FY’12
Record
Q4 volume of $3.1B; application pipeline growth to $6.6B
Gain on sale margin, ex-correspondent, modest decrease (682 bps in Q4 vs 744 bps in
Q3), remains elevated
Origination Volume
($bn of UPB)
Profitably creating servicing assets as we grow volume and channels
($mm)
Cash –
Points, Fees, Gain on Sale
$102
Pipeline Value
(1)
56
Subtotal Cash / Near Cash Revenue
$158
Servicing Asset
(Cash value realized over time)
21
Other
(6)
Total Originations Revenue
$173
Originations Volume
$3,081
Excluding Correspondent
$2,513
Locked Pipeline
$4,992
Application Pipeline
$6,643
Q4 ‘12 Economics
Cash / near
cash is 91% of
total revenue
1)
Includes mark-to-market on loans held for sale and derivative/hedges
2)
As of December 31, 2012
$1.5
$2.8
$3.4
$7.9
$16.0+
0
2
4
6
8
10
12
14
16
18
2009
2010
2011
2012
2013E
(2)
(2) |
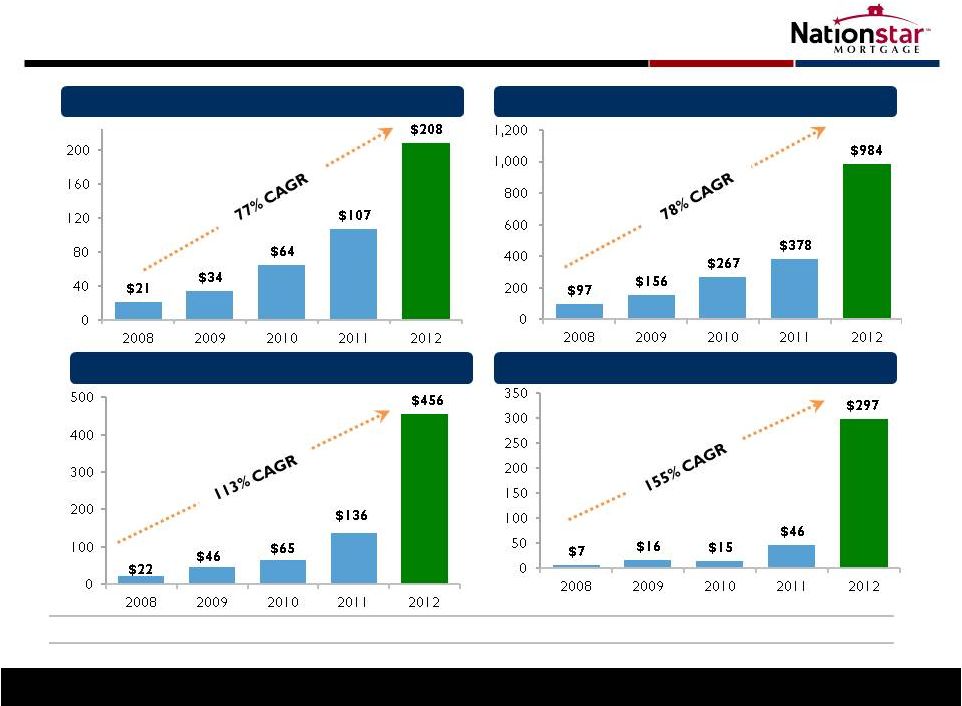
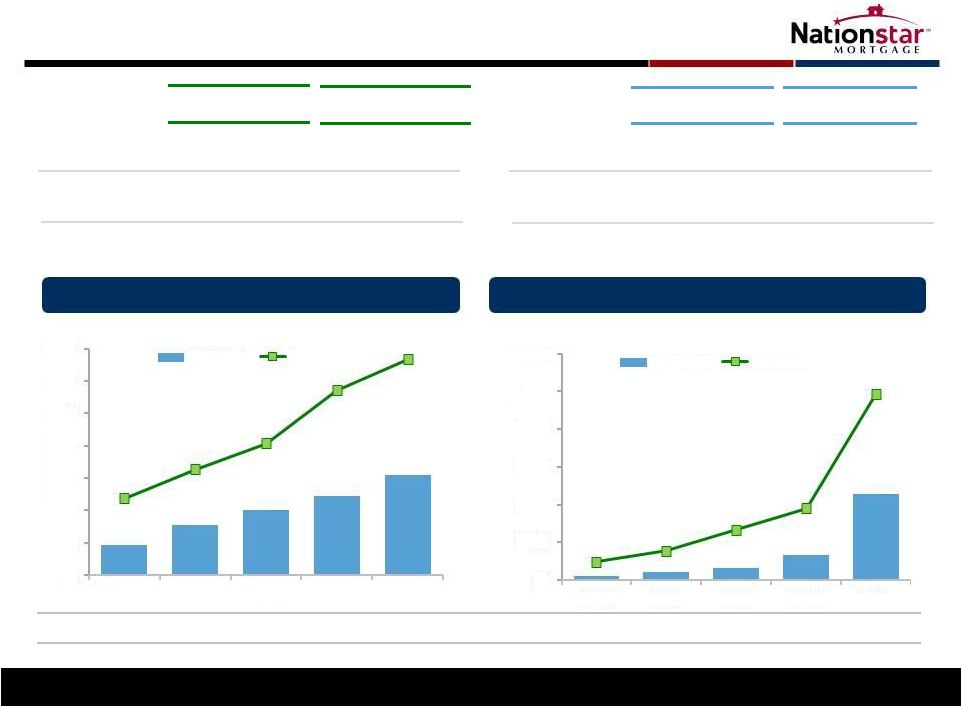 Financial
Highlights: Q4 and FY ‘12 11
Annual Revenue and AEBITDA
(1,2)
Quarterly Revenue and AEBITDA
(1,2)
1)
2) Please see Appendix for information on AEBITDA and reconciliations beginning on page
18 Margin (%)
23%
29%
24%
36%
40%
47%
50%
47%
43%
46%
Q4’12
Increase (QoQ)
FY ’12
Increase (YoY)
$456MM
$155MM
$205MM
$2.40
$64MM
$0.71
26%
16%
16%
236%
882%
700%
AEBITDA
(1)
Net Income
EPS
AEBITDA
(1)
Net Income
EPS
($MM)
($MM)
$0
$50
$100
$150
$200
$250
$300
$350
Q4 '11
Q1 '12
Q2 '12
Q3 '12
Q4 '12
AEBITDA
Revenue
$0
$200
$400
$600
$800
$1,000
$1,200
2008
2009
2010
2011
2012
AEBITDA
Revenue
$22
$65
$136
$456
$97
$984
$378
$267
$46
$156
2) For Operating segments; excludes Legacy segment
$47
$77
$101
$123
$155
$119
$164
$203
$285
$333 |
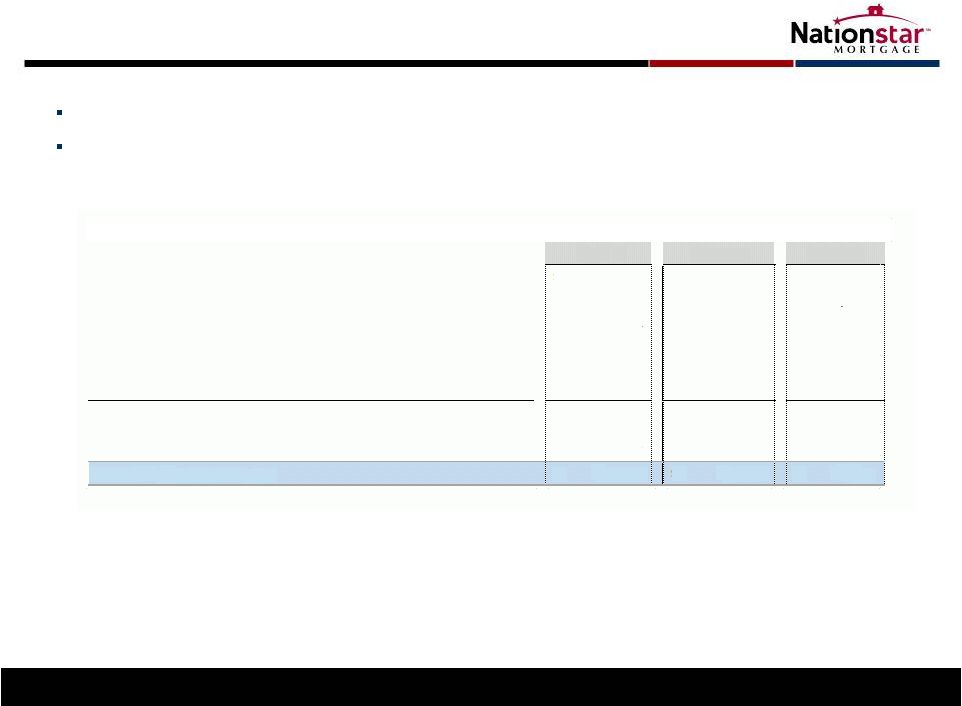
 Q3'12
($ millions except where noted)
Servicing
Originations
Operating
Total
(2)
Total
AEBITDA
(1)
$66.9
$88.1
$155.0
$153.0
$121.7
margin%
42%
51%
47%
Pre-Tax Income
$14.9
$81.7
$96.6
$94.4
$79.8
Income Tax Expense
($30.7)
($24.7)
Net Income - GAAP
$63.8
$55.1
Per Share Data:
Pre-Tax Income
$1.08
$1.05
$0.89
Net Income - GAAP
$0.71
$0.61
AEBITDA
(1)
$0.74
$0.98
$1.72
$1.70
$1.36
Average shares outstanding (mm)
89.9
89.9
89.9
89.9
89.8
Q4 '12
Consolidated Performance
1) Please see Appendix for information on AEBITDA and reconciliations beginning on page
18 2) Includes Legacy Segment
12
Strong sequential quarter for Company
Total GAAP Net Income of $64MM
GAAP EPS of $0.71
Operating Segment AEBITDA of $155MM
(1) |
 Appendix
13 |
 Focused
on Profitable Growth 1) Revenue, AEBITDA and
pre-tax income from operating segments 2) Please see
Appendix for information on AEBITDA and reconciliations beginning on page 18
14
Pre-Tax Income Growth ($mm)
(1)
UPB Growth ($bn)
Revenue Growth ($mm)
(1)
AEBITDA Growth ($mm)
(1)(2)
Margin (%)
23%
29%
24%
36%
7%
10%
6%
30%
12%
46% |
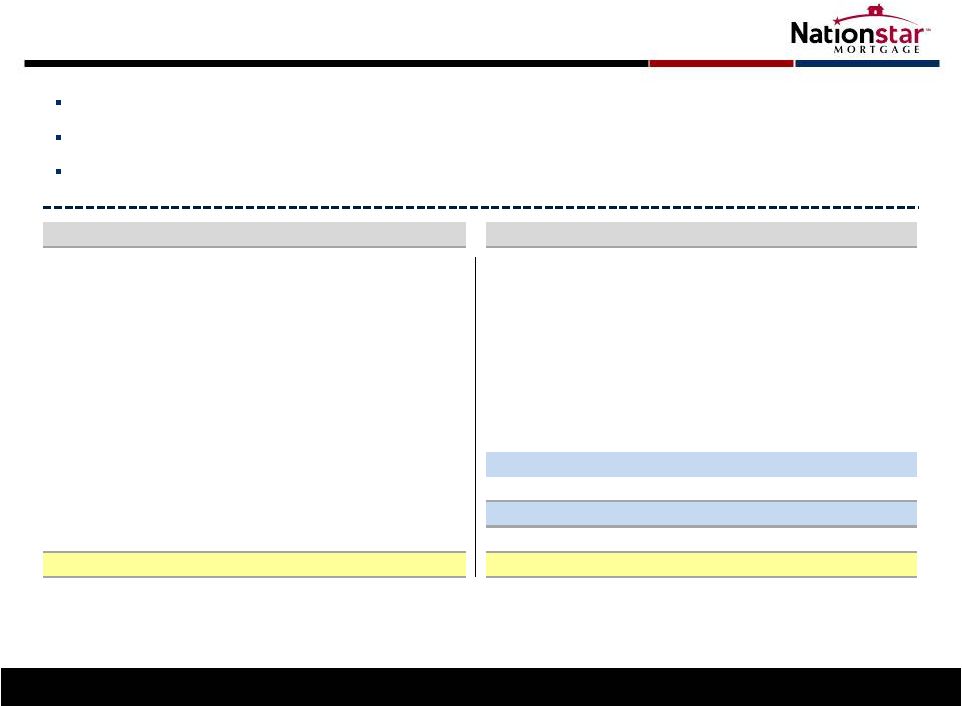 Balance
Sheet Low leverage with Corporate Debt to AEBITA of 1.7x
(1)
; net of cash, 1.5x
Significant capital levers in place for additional investment
Capacity remains for additional corporate debt
1)
Corporate Debt to Q4 run-rate AEBITDA
2)
Includes receivables from affiliates
3)
Includes servicing advance facilities and origination warehouse facilities
4)
Includes
derivative
financial
instruments
and
mortgage
servicing
liabilities
15
$ millions
Q4 '12
Q3 '12
$ millions
Q4 '12
Q3 '12
Assets:
Liabilities:
Cash and cash equivalents
$153
$431
Notes payable
(3)
$3,602
$2,532
Restricted cash
393
259
Senior unsecured notes
1,063
1,062
Accounts
receivable
(2)
3,056
2,866
Payables and accrued liabilities
628
762
Mortgage loans held for sale
1,481
703
Nonrecourse
debt
-
Legacy
assets
101
102
Mortgage
loans
held
for
investment
-
Legacy
239
238
Excess spread financing at fair value
288
255
Mortgage
servicing
rights
-
fair
value
636
593
Participating interest financing
581
415
Participating interest in reverse mortgages
750
453
Other liabilities
(4)
103
120
Mortgage
servicing
rights
-
amortized
cost
11
8
Total Liabilities
$6,365
$5,250
Property and equipment, net
75
49
Other assets
329
341
Shareholders Equity
$758
$691
Total Assets
$7,123
$5,941
Total Liabilities and Shareholders Equity
$7,123
$5,941 |
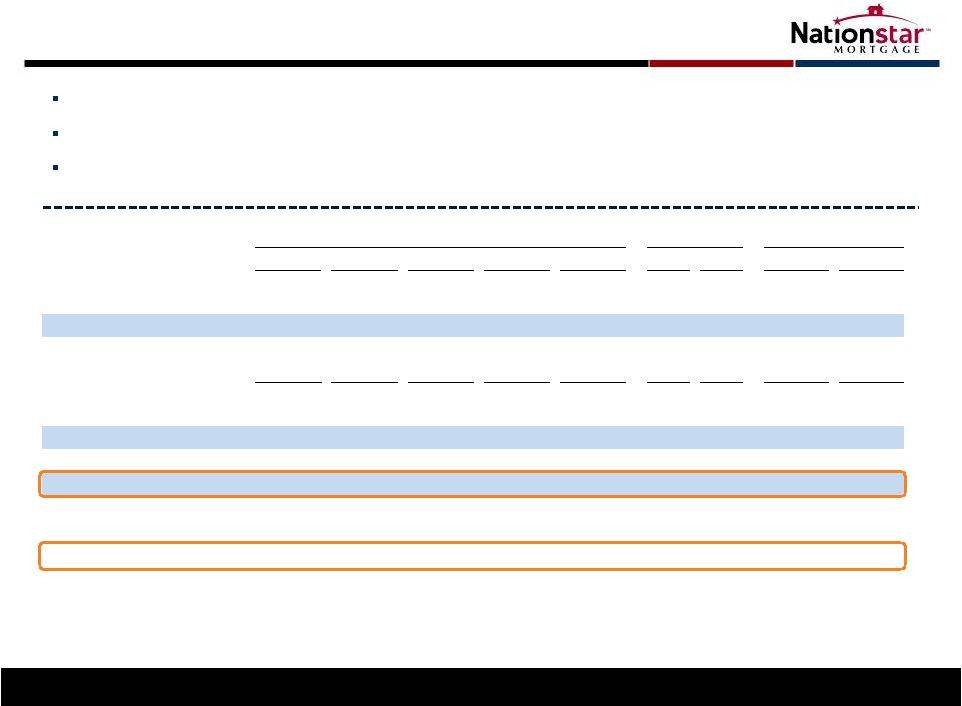 ($ in
millions) For the three month period ending
Variance
Last twelve months
Q4'12
Q3'12
Q2'12
Q1'12
Q4'11
QoQ
YoY
Q4'12
Q3'12
Fee income
$158
$146
$100
$94
$83
8%
126%
$497
$411
Gain on sale
175
139
102
71
36
26%
363%
487
348
Total revenue
$333
$285
$202
$165
$119
17%
204%
$984
$759
Expenses and impairments
(200)
(155)
(130)
(97)
(86)
29%
87%
(582)
(468)
Other income (expense)
(38)
(50)
(23)
(15)
(18)
105%
291%
(126)
(94)
Pre-tax income
95
80
49
53
15
18%
NM
277
197
Income taxes
(31)
(25)
(13)
(3)
-
(71)
(41)
Net income
$64
$55
$36
$50
$15
53%
NM
$205
156
Adjusted AEBITDA
(1)
$155
$123
$101
$77
$47
26%
284%
$456
$348
EPS
(2)
$0.71
$0.61
$0.41
$0.67
$0.21
17%
NM
$2.40
$1.90
Pro forma EPS
(2,3)
$0.71
$0.64
$0.44
$0.44
$0.21
11%
NM
$2.23
$1.73
AEBITDA per share
(2)
$1.72
$1.37
$1.18
$1.04
$0.67
26%
157%
$5.31
$4.27
Five-Quarter Income Statement Summary
Successfully, consistently scaled the business
Increasing profitability with growth
Sequential improvement in pro forma EPS and AEBITDA per share
1)
Please see page 18 for AEBITDA reconciliations; excludes Legacy segment
2)
Calculated using a fully-diluted average share count for Q4’12 Q3
’12, Q2 ’12 and Q1’12 of 89.9, 89.8, 89.5 and 89.2 million shares, respectively, and 70.0 million shares for 2011 periods
3)
Please see Appendix for information on pro forma net income and EPS reconciliation
16 |
 Servicing
Fee Detail (1)
17
Fee income before fair value adjustment increased by 9% to $175 million
MSR fair value adjustments include portfolio run-off and mark-to-market
adjustments 1)
Servicing segment only
($ in thousands)
Q4 '12
Q3 '12
Q4 '11
Total servicing fee income before MSR fair value adjustments
174,645
$
159,941
$
80,707
$
Fair value adjustments on excess spread financing
(5,633)
2,213
(3,060)
Reverse mortgage servicing liability amortization/accretion
1,844
2,652
-
MSR changes in fair value:
Due to changes in valuation inputs or assumptions
(1,169)
8,355
1,304
Other changes in fair value (portfolio run-off)
(24,263)
(30,785)
(9,547)
Servicing fee income
145,424
142,376
69,404
Other fee income
14,078
7,190
9,967
Total servicing fee income
159,502
$
149,566
$
79,371
$ |
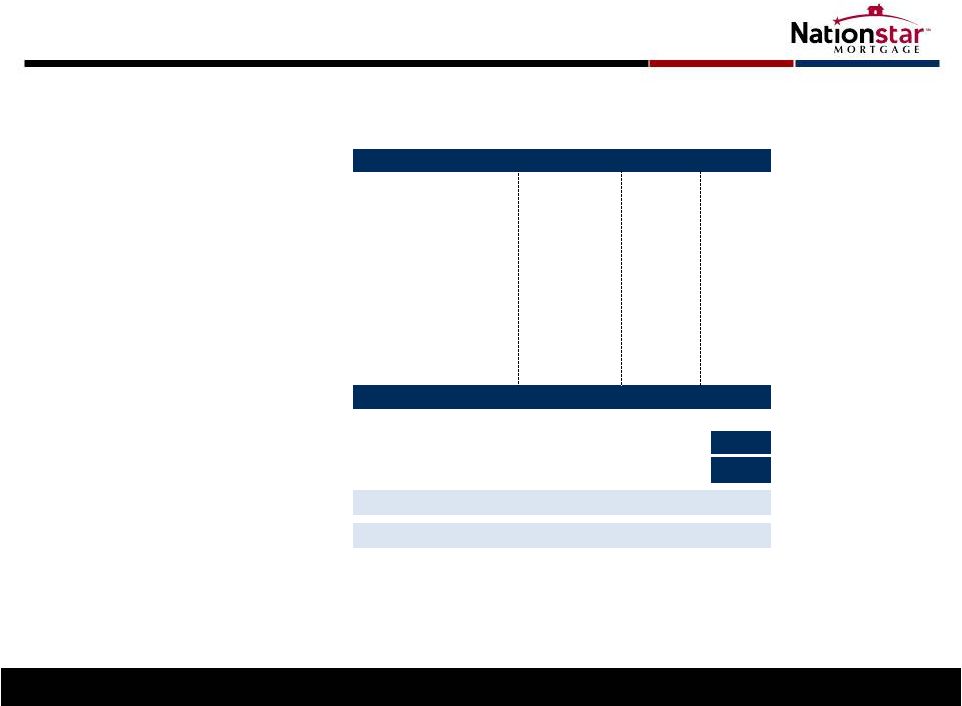   AEBITDA
Reconciliation 18
1)
Calculated using a fully-diluted average share count of 89.9 million shares
For Quarter Ended December 31, 2012
($ in millions)
Servicing
Originations
Operating
Legacy
Total
Adjusted EBITDA
$66.9
$88.1
$155.0
($1.9)
$153.0
Interest expense on corporate notes
(20.0)
(4.2)
(24.2)
-
(24.2)
MSR valuation adjustment
(25.4)
-
(25.4)
-
(25.4)
Excess spread adjustment
(5.6)
-
(5.6)
-
(5.6)
Amortization of mort. serv. obligations
1.8
-
1.8
-
1.8
Depreciation & amortization
(2.0)
(1.1)
(3.1)
(0.2)
(3.3)
Stock-based compensation
(1.6)
(1.1)
(2.7)
(0.0)
(2.7)
Fair value adjustment for derivatives
0.8
-
0.8
(0.1)
0.7
Pre-Tax Income
$14.9
$81.7
$96.6
($2.2)
$94.4
Income Tax
(30.7)
Net Income
$63.8
Earnings per share
(1)
$0.71
AEBITDA per share
(1)
$0.74
$0.98
$1.72
($0.02)
$1.70
Pre-Tax Income per share
(1)
$0.17
$0.91
$1.07
($0.02)
$1.05
Average shares outstanding
89.9
89.9
89.9
89.9
89.9
|
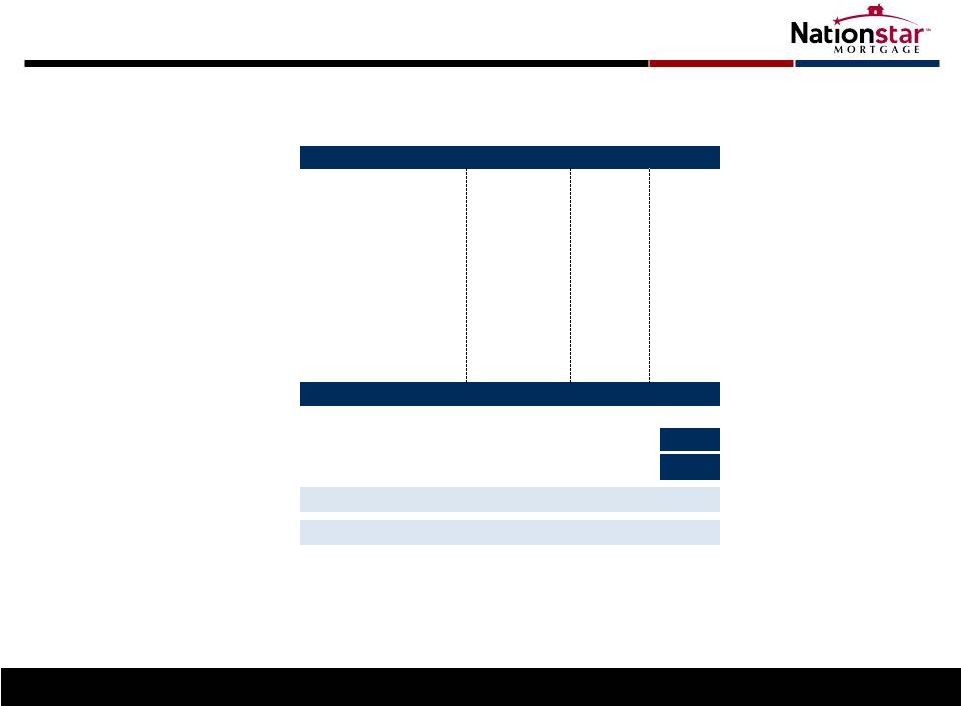   AEBITDA
Reconciliation 19
1)
Calculated using a fully-diluted average share count of 89.8 million shares
For Quarter Ended September 30, 2012
($ in millions)
Servicing
Originations
Operating
Legacy
Total
Adjusted EBITDA
$42.1
$80.9
$123.0
($1.3)
$121.7
Interest expense on corporate notes
(15.7)
(1.9)
(17.7)
-
(17.7)
MSR valuation adjustment
(22.4)
-
(22.4)
-
(22.4)
Excess spread adjustment
2.2
-
2.2
-
2.2
Amortization of mort. serv. obligations
2.7
-
2.7
-
2.7
Depreciation & amortization
(2.0)
(0.8)
(2.8)
(0.2)
(3.0)
Stock-based compensation
(1.6)
(1.1)
(2.6)
0.0
(2.6)
Fair value adjustment for derivatives
0.2
-
0.2
(1.3)
(1.1)
Pre-Tax Income
$5.5
$77.1
$82.7
($2.9)
$79.8
Income Tax
(24.7)
Net Income
$55.1
Earnings per share
(1)
$0.61
AEBITDA per share
(1)
$0.47
$0.90
$1.37
($0.02)
$1.36
Pre-Tax Income per share
(1)
$0.06
$0.86
$0.92
($0.03)
$0.89
(continued) |
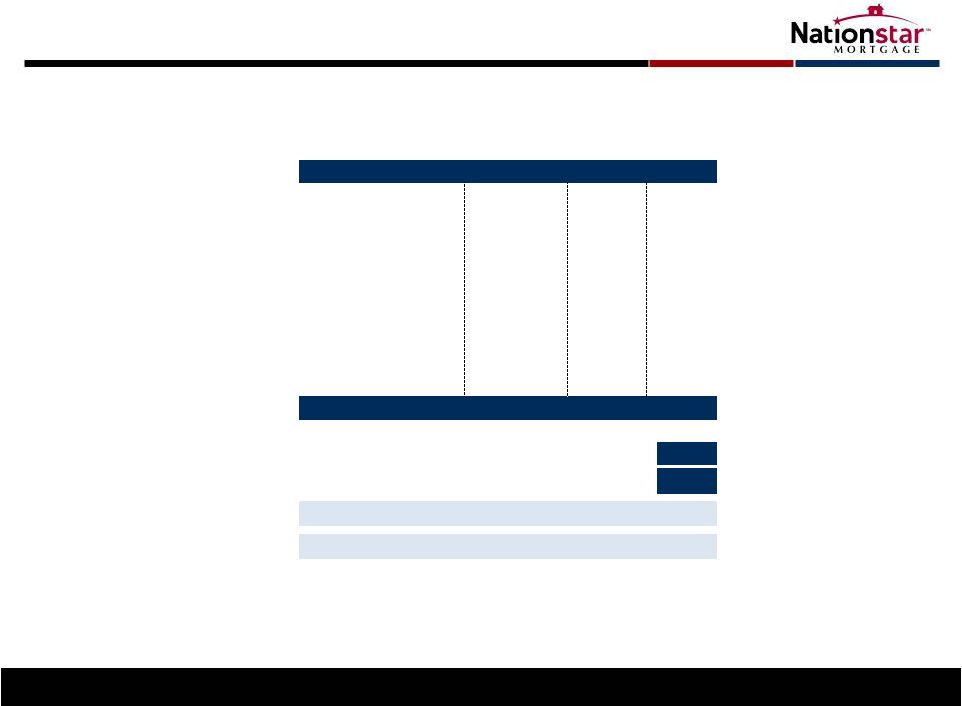   AEBITDA
Reconciliation (continued)
20
1)
Calculated using a fully-diluted average share count of 70.0 million shares
For Quarter Ended December 31, 2011
($ in millions)
Servicing
Originations
Operating
Legacy
Total
Adjusted EBITDA
$35.6
$11.7
$47.3
($7.6)
$39.7
Interest expense on corporate notes
(7.8)
-
(7.8)
-
(7.8)
MSR valuation adjustment
(8.2)
-
(8.2)
-
(8.2)
Excess spread adjustment
(3.1)
-
(3.1)
-
(3.1)
Amortization of mort. serv. obligations
-
(1.8)
(1.8)
-
(1.8)
Depreciation & amortization
(0.8)
(0.4)
(1.2)
(0.3)
(1.5)
Stock-based compensation
(2.4)
(0.3)
(2.6)
-
(2.6)
Fair value adjustment for derivatives
0.3
-
0.3
-
0.3
Pre-Tax Income
$13.6
$9.2
$22.8
($7.9)
$14.9
Income Tax
-
Net Income
$14.9
Earnings per share
(1)
$0.21
AEBITDA per share
(1)
$0.51
$0.17
$0.68
($0.11)
$0.57
Pre-Tax Income per share
(1)
$0.19
$0.13
$0.33
($0.11)
$0.21 |
 AEBITDA
Reconciliations 21
($ in thousands)
Net Income (loss)
$ (157,610)
$ (80,877)
$ (9,914)
$ 20,887
$ 63,759
$ 205,287
Adjust for:
Net loss from Legacy Portfolio and Other
164,738
97,263
24,806
24,892
2,189
20,483
Interest expense from unsecured senior notes
-
-
24,628
30,464
24,165
63,879
Depreciation and amortization
1,172
1,542
1,873
3,395
3,107
8,880
Change in fair value of MSRs
11,701
27,915
6,043
39,000
25,432
68,242
Amortization of mortgage servicing obligations
-
-
-
-
(1,844)
(5,120)
Fair value changes on excess spread financing
-
-
-
3,060
5,633
10,684
Share-based compensation
1,633
579
8,999
14,764
2,675
14,045
Exit costs
-
-
-
1,836
-
-
Fair value changes on interest rate swaps
-
-
9,801
(298)
(813)
(1,237)
Ineffective portion of cash flow hedge
-
-
(930)
(2,032)
-
-
Income tax expense
-
-
-
-
30,657
71,296
Adjusted EBITDA
(1)
$ 21,634
$ 46,422
$ 65,306
$ 135,968
$ 154,960
$ 456,439
For Operating Segments; calculated using a fully-diluted average share count of
70.0 million shares for FY 2008 – 2011, 74.6 million shares in Q1 ‘12, 89.5 million shares in Q2 ’12, 89.8 million shares in Q3 ’12, 89.9
million shares in Q4’12
1)
FY 2008
FY 2009
FY 2010
FY 2011
Q4 ’12
FY 2012 |
 Pro Forma
Per Share Reconciliations 22
For Quarters Ending September 30, June 30 and March 31, 2012
($ in millions)
Q3 '12
Q2 '12
Net Income
$55.1
$36.3
$50.2
Income Tax
24.7
12.8
3.1
Pre-Tax Income
79.8
49.1
53.3
ResCap and transaction-related expenses
3.9
4.1
-
Pro-forma Pre-Tax Income
$83.7
$53.2
$53.3
Income Tax -
Q3 & Q2 '12 Rate
(25.9)
(13.9)
(13.9)
Pro-Forma Income
$57.8
$39.3
$39.4
Pro-forma Per Share:
$0.64
$0.44
$0.44
Average shares outstanding
89.8
89.5
89.5
Q1 '12 |
 Endnotes
Pro-forma
Earnings
Per
Share
(“Pro-forma
EPS”)
This
disclaimer
applies
to
every
usage
of
pro-forma
EPS
in
this
presentation.
Pro-forma
EPS
is
a
metric
that
is
used
by
management to exclude certain non-recurring items in an attempt to provide a better
earnings per share comparison to prior periods. Pro-forma Q3 ‘12 EPS excludes certain expenses
related
to
ResCap
and
other
transactions.
These
expenses
include
the
advance
hiring
of
servicing
staff,
recruiting
expenses
and
travel
and
licensing
expenses.
Pro-forma
Q2
‘12
EPS
excluded certain expenses incurred in advance of the closing of the Aurora transaction.
Pro-forma
AEBITDA
Per
Share
This
disclaimer
applies
to
every
usage
of
pro-forma
AEBITDA
per
share
in
this
presentation. Pro-forma
AEBITDA
per
share
is
a
metric
that
is
used
by management to exclude certain non-recurring items in an attempt to provide a
better earnings per share comparison to prior periods. Pro-forma Q3 ‘12 AEBITDA per share
excludes certain expenses related to ResCap and other transactions. These
expenses include the advance hiring of servicing staff, recruiting expenses and travel and licensing expenses.
Pro-forma Q2 ‘12 AEBITDA per share excluded certain expenses incurred in
advance of the closing of the Aurora transaction. Adjusted
EBITDA
(“AEBITDA”)
This
disclaimer
applies
to
every
usage
of
“Adjusted
EBITDA”
or
“AEBITDA”
in
this
presentation.
Adjusted
EBITDA
is
a
key
performance
metric
used
by management in evaluating the performance of our segments. Adjusted EBITDA
represents our Operating Segments' income (loss), and excludes income and expenses that relate to
the financing of our senior notes, depreciable (or amortizable) asset base of the
business, income taxes (if any), exit costs from our restructuring and certain non-cash items. Adjusted
EBITDA
also
excludes
results
from
our
legacy
asset
portfolio
and
certain
securitization
trusts
that
were
consolidated
upon
adoption
of
the
accounting
guidance
eliminating
the
concept
of a qualifying special purpose entity ("QSPE“).
23 |