Attached files
| file | filename |
|---|---|
| 8-K - FORM 8-K - E TRADE FINANCIAL CORP | d495587d8k.htm |
 E*TRADE
Financial Corporation Raymond
James
34
Annual
Institutional
Investors
Conference
Matthew Audette, Chief Financial Officer
March 5, 2013
©
2013 E*TRADE Financial Corporation all rights
reserved. Exhibit 99.1
th |
 ©
2013 E*TRADE Financial Corporation all rights reserved
2
Safe Harbor Statement
This presentation contains certain forward-looking statements regarding our business
strategy and the related impact, our strategic and capital plans, certain deleveraging
and cost-savings initiatives, the continuation of current trends,
future
events
and
the
future
performance
of
the
Company.
E*TRADE
claims
the
protection
of
the
safe
harbor
for forward-looking statements contained in the Private Securities Litigation Reform Act
of 1995 for all forward- looking statements. Various factors, including risks
and uncertainties referred to in the 10-K, 10-Q and other reports the Company
periodically files with the SEC, could cause our actual results to differ materially from those indicated by
our projections or other forward-looking statements.
Non-GAAP Financial Measures
In addition to financial results prepared in accordance with Generally Accepted Accounting
Principles, or GAAP, this presentation will also contain certain non-GAAP financial
measures. Management uses these non-GAAP measures to evaluate our performance
and in planning for future periods. Management believes that adjusting GAAP measures by
excluding
or
including
certain
items
is
helpful
to
investors
and
analysts
who
may
wish
to
use
some
or
all
of
this
information to analyze our current performance, prospects and valuation. It is important to
note these non-GAAP measures
involve
judgment
by
management
and
should
be
considered
in
addition
to,
not
as
a
substitute
for,
the
most directly comparable measures calculated and prepared in accordance with GAAP. Investors
and potential investors are encouraged to review the reconciliation of non-GAAP
financial measures with their most direct comparable GAAP financial measures included
as an appendix to this presentation. This presentation presents data as of December 31,
2012, unless otherwise indicated. Notice to investors |
 ©
2013 E*TRADE Financial Corporation all rights reserved
3
Business strategy
Improve market position in retail brokerage
•
Accelerate growth of the customer franchise
•
Continue to enhance the customer experience, improve satisfaction and retention
Capitalize on value of complementary brokerage businesses
•
Corporate Services Group
•
Market making operations
Enhance position in retirement & investing
•
Expand brand position for awareness and preference
•
Grow customer share of wallet
Continue to manage and de-risk the Bank
•
Mitigate
credit
losses
on
legacy
loan
portfolio
and
enhance
risk
profile
•
Build out enterprise risk management capabilities
Strengthen overall financial and franchise position
•
Improve capital ratios through de-risking and de-leveraging
•
Focus on ultimately deploying excess Bank capital to parent to pay off corporate debt
•
Increase focus on cost reductions and efficiencies: Targeting $110M in run-rate
reductions |
 ©
2013 E*TRADE Financial Corporation all rights reserved
4
($ M)
2012
Driver
Long-term impact
of current strategy
Revenue
$1,899
$2,161
Provision
($354)
$0
Servicing
($60)
$0
FDIC expenses
($117)
($59)
Other operating expenses
($985)
($985)
Expenses, total
($1,162)
($1,044)
Operating income
$383
$1,117
Corporate interest expense
($180)
$0
Other
($77)
$(77)
Pre-tax income
$126
$1,040
Should reduce to $0 as excess Bank capital is
deployed to parent to pay off corporate debt
Net interest spread should improve to 300bps
with normalized rate environment
Should reduce to $0 as legacy portfolio runs off
Should reduce to $0 as legacy portfolio runs off
Should reduce by half as risk profile improves
Strengthen overall financial and franchise position
Long-term impact of current strategy to improve earnings
(1) |
 ©
2013 E*TRADE Financial Corporation all rights reserved
5
Strengthen overall financial and franchise position
Focused on deleveraging to improve most constraining ratio: Tier
1 leverage
Capital ratios as of
12/31/12
Bank
Parent
Well-
capitalized
threshold
Total capital to
risk-weighted assets
(3)
20.6%
13.7%
10.0%
Tier 1 capital to
risk-weighted assets
(3)
19.3%
12.5%
6.0%
Tier 1 common
(4)
19.3%
10.3%
7.0%
Tier 1 leverage
(3)
8.7%
5.5%
5.0%
Reducing balance sheet size / improving leverage ratio is integral to the successful execution
of the Capital Plan Strategic and Capital Plan submitted to Fed and OCC
•
Outlines
assumptions
for
capital
levels
and
distributions
under
various
operating
conditions
over
the
next
5
years
•
Includes
assumption
that
Bank
begins
distributing
capital
to
Parent
by
the
end
of
2013
•
Plan
assumes
Bank
will
dividend
capital
to
Parent
above
Tier
1
leverage
ratio
of
9.5%
•
9.5%
target
decreases
by
50
bps
each
year
beginning
in
2014,
ultimately
settling
at
8.0%
Bank excess capital / Corporate debt
(5)
(6) |
 ©
2013 E*TRADE Financial Corporation all rights reserved
6
Drivers of change in balance sheet size
Focused on deleveraging to improve most constraining ratio: Tier
1 leverage
Strengthen overall financial and franchise position
Identified or Completed Deleveraging
Actions
2012
Q1 2013
Q2 2013
TOTAL
Transfer sweep deposits off balance sheet
$1,700
$2,300
$500
$4,500
Direct new customer cash to money funds
$800
$400
$1,200
Reduce wholesale borrowings
$1,500
$1,500
Convert customer payables to money funds
$900
$100
$1,000
Total
$4,900
$2,800
$500
$8,200
Tier 1 Leverage ratio: Bank | Parent
8.7% | 5.5% |
 ©
2013 E*TRADE Financial Corporation all rights reserved
7
Strengthen overall financial and franchise position
Debt refinancing to significantly improve cash flow and reduce interest burden
•
Lowest Senior Note coupons in the Company’s history
•
Improves annual earnings by approximately $60M or
$0.21 per share
(7)
•
Improves debt service coverage ratio for parent cash to
3.7X from 2.5X
•
Lengthens maturity profile, eliminating nearest maturity
and extending weighted average maturity by +1 year
•
Call features allow prepayment flexibility
Transaction benefits
Transaction overview
•
Launched transaction to refinance debt on 11/5
•
Successfully raised $1.3B in Senior Notes –
closed on
11/14
•
Issued call notice for $930M of Springing Lien Notes due
2017 and $243M of 7.875% Senior Notes due 2015
•
Called notes were extinguished on 12/1/2012 |
 ©
2013 E*TRADE Financial Corporation all rights reserved
8
Consolidated DTA of $1.4B
($0.4B at parent; $1.0B at Bank)
Ability to include more in regulatory capital with ongoing
profitability
Source of corporate cash as subsidiaries reimburse the
parent for use of its DTA
Approximately 15 years to use; expect to utilize the full
amount
Strengthen overall financial and franchise position
Deferred tax asset: Embedded value realized with ongoing profitability
|
 ©
2013 E*TRADE Financial Corporation all rights reserved
9
Committed to grow as a recognized leader with iconic brand and advertizing
Improve market position in retail brokerage |
 ©
2013 E*TRADE Financial Corporation all rights reserved
10
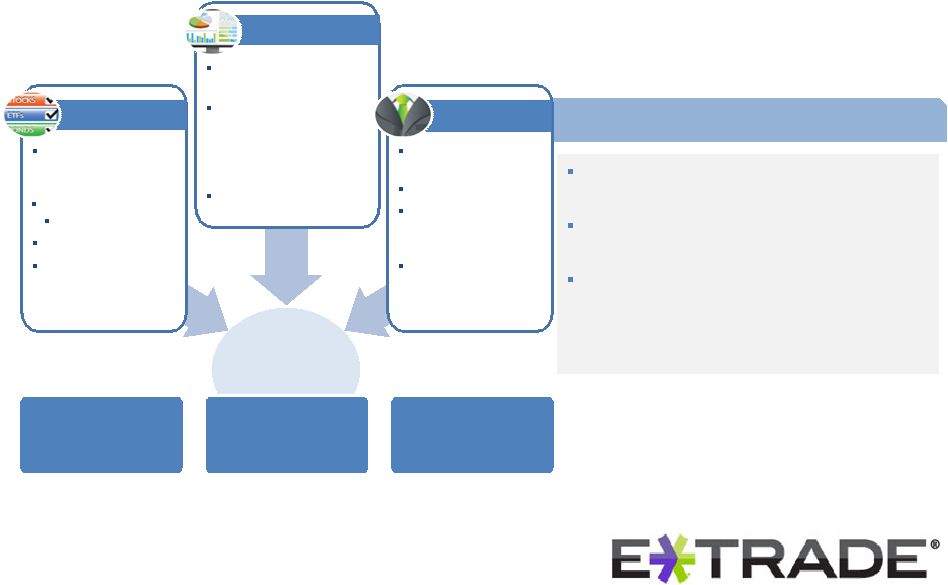
Improve market position in retail brokerage
Lower
attrition
Increase
net new assets /
share of wallet
Grow
high quality
account base
Increase asset-based
and commission-
based revenue
Key initiatives to drive success
•
Create leading online broker
experience:
•
E*TRADE.com
•
E*TRADE 360
•
E*TRADE Mobile
•
Education & research
•
E*TRADE Community
•
Focus on customer dissatisfiers
•
Continuous process improvements
•
Expand brand as a trusted
retirement and investing
provider
•
Deliver retirement advice &
planning:
•
Financial Consultants
•
Online planning tools
•
Managed Products
•
Increase awareness of needs-
based investing solutions:
•
Mutual funds
•
Fixed income
•
ETFs
•
Deepen relationships with
high-potential customers
Improve
Improve
customer experience
customer experience
Grow retirement
Grow retirement
& investing
& investing
Enhance retail
Enhance retail
trading offering
trading offering
•
Deliver best-in-class trading
experience:
•
E*TRADE.com
•
E*TRADE Pro
•
E*TRADE Mobile
•
Expand product engagement
through:
•
Platform enhancements
•
Idea generating tools
•
Education for all traders on
products, platforms, strategies and
risk management |
 ©
2013 E*TRADE Financial Corporation all rights reserved
11
Improve market position in retail brokerage
Accelerate growth of the customer franchise |
 ©
2013 E*TRADE Financial Corporation all rights reserved
12
Improve market position in retail brokerage
Accelerate growth of the customer franchise |
 ©
2013 E*TRADE Financial Corporation all rights reserved
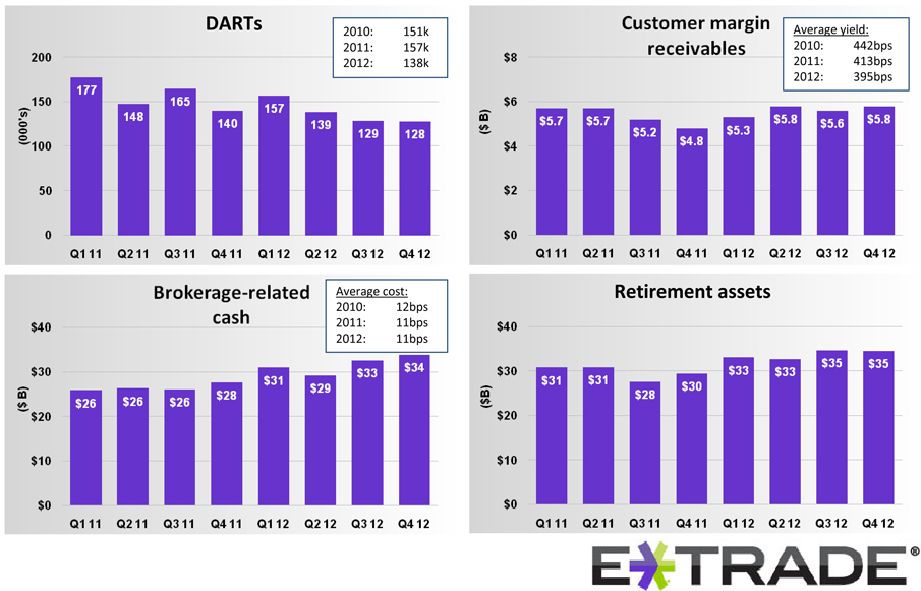
13
Financial Consultant network highlights
Increased Financial Consultant headcount by 40%
since year-end 2010
Estimated 12% share of our customers’
investible
assets (36% for active traders; 10% for investors)
(15)
Identified segments best served by proactive
engagement with Financial Consultants
—
1-year post assignment seeing significant
improvement in engagement and retention
Accounts &
assets
$34.6 billion in
retirement assets
20% of $173 billion of
brokerage-related assets
799k retirement
accounts
28% of brokerage accounts
$1.3 billion in managed
accounts
(3 years post inception)
8,100+ mutual funds
—
4,600 no-load
—
6,900 NTF
80+ Comm. Free
50,000+ bonds
Managed Accounts
(MIP & UMA)
Chartered Retirement
Planning
Counselors
#1 ranking in Kiplinger’s
2012 Best Online Brokers -
five stars in Investment
Choices and Customer
Service
Retirement education
Integrated into
advertising
Headcount of 270
Increased asset
penetration 1 year post
assignment
Complementary
retirement & portfolio
consultations
Products
†
Services
Financial
Consultants
Enhance position in retirement & investing
†
Unified Managed Accounts and Managed Investment Portfolios are offered by E*TRADE Capital
Management SM
Every
ETF
sold |
 ©
2013 E*TRADE Financial Corporation all rights reserved
14
Corporate Services Group
Build on market leadership with 1,000+ corporate stock plan clients
Award-winning
platform
–
Equity
Edge
Online
–
rated
#1
in
Overall Satisfaction and Loyalty in the 2012 Group Five Stock
Plan
Administration
Study
Industry
Report
Strategically important channel for new brokerage accounts,
accounting for 25-30% of gross new accounts
1.1 million accounts; $22B in vested and $47B in unvested
options
Proceeds retention of 35%+ 3 months post exercise,
and 15%+ 12 months post exercise
Market making business
Leading market share in ADRs; growing market share in
National Market Securities
Growing base of external customers, comprising 45+ external
clients
(30% y/y growth), and accounting for approximately
half of market making revenue
Capitalize on value of complementary brokerage businesses
TM
(16) |
 ©
2013 E*TRADE Financial Corporation all rights reserved
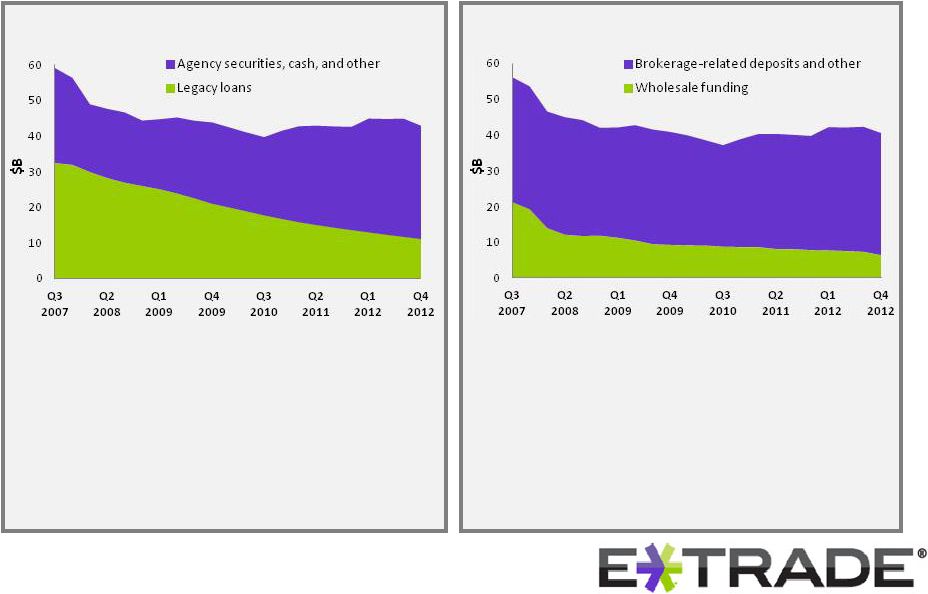
15
Improvement in asset composition…
…Funding mix also continues to improve
•
Legacy loan portfolio now accounts for less than 30% of
average interest-earning assets, down from 55% in Q3 2007
•
Average loan portfolio balances are down 66% from peak in
Q3 2007
•
Bank risk weighted assets are down 44% from peak in Q3
2007, while average total assets are down 27%
•
More expensive wholesale funding channel now accounts
for only 16% of average interest-bearing liabilities, down
from 38% at its peak in Q3 2007
•
Average wholesale funding is down 70% from its peak in Q3
2007
•
Balance sheet strategy going forward is liability-driven, by
brokerage cash
Favorable mix shift in assets (lower risk) and liabilities (lower-cost)
Continue to manage and de-risk the Bank |
 ©
2013 E*TRADE Financial Corporation all rights reserved
16
($ B)
Loan balance
9/30/07
(17)
Paydowns
(18)
Charge-offs
Loan balance
12/31/12
(17)
Average age
1-4 Family loans
$17
($10)
($1)
$6
6.7 yrs
Home equity
$12
($5)
($3)
$4
6.9 yrs
Consumer
$3
($2)
($0)
$1
9.0 yrs
TOTAL
$32
($17)
($4)
$11
Continue to manage and de-risk the Bank
Mitigate credit losses on legacy loan portfolio |
 ©
2013 E*TRADE Financial Corporation all rights reserved
17
Coverage of non-modified loans
Coverage of modified loans
Components of allowance for loan losses
Specific
Valuation
Allowance
Continue to manage and de-risk the Bank
Mitigate credit losses on legacy loan portfolio
0.0
0.5
1.0
1.5
2.0
Q1
2010
Q2
2010
Q3
2010
Q4
2010
Q1
2011
Q2
2011
Q3
2011
Q4
2011
Q1
2012
Q2
2012
Q3
2012
Q4
2012
90+ days past due non-modified loans
General
reserve
as
a
%
of
90+
days
past
due
non-modified
(20)
0.0
0.5
1.0
1.5
2.0
Q1
2010
Q2
2010
Q3
2010
Q4
2010
Q1
2011
Q2
2011
Q3
2011
Q4
2011
Q1
2012
Q2
2012
Q3
2012
Q4
2012
Total
expected
losses
on
modified
loans
Modified loans
General reserve
Prior charge-offs
Qualitative reserve
= Accounts for factors not directly considered in our quantitative model = Expected
losses over remaining life of modified loans
= Expected losses over next 12 months for non-modified loans 0%
20%
40%
60%
80%
0%
20%
40%
60%
80%
loans |
 ©
2013 E*TRADE Financial Corporation all rights reserved
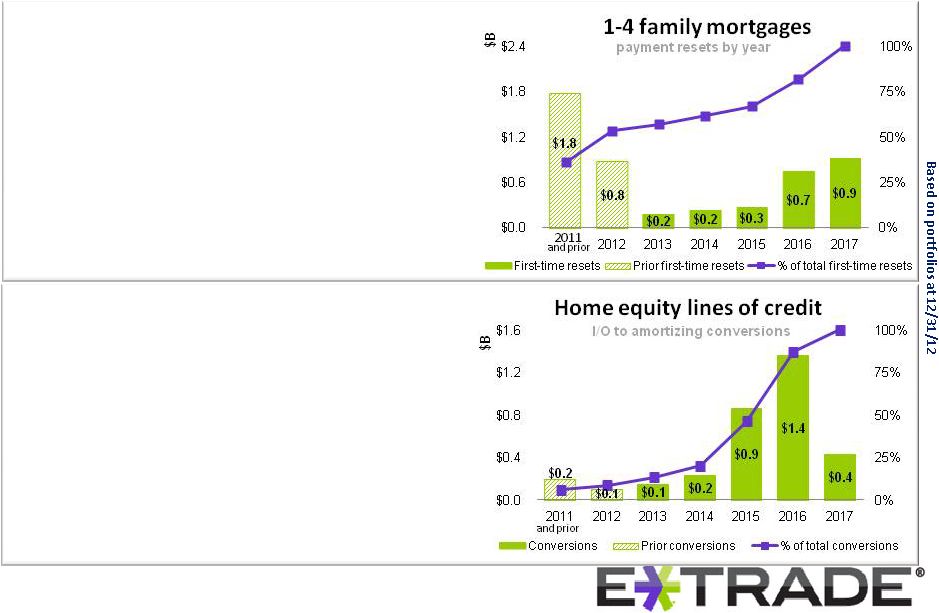
18
Continue to manage and de-risk the Bank
Visibility into future drivers of credit costs
•
Less than 1% of all 1-4 family loans resetting in 2013 are expected
to experience a payment increase of more than 10%
•
Nearly 83% of 1-4 family loans resetting in 2013 are expected to
reset to a lower payment
•
Average loan size: $458k
•
85% of non-TDR portfolio is adjustable for rate or amortization
•
Approximately $2.6B, or 53% of the portfolio, has previously reset
for the first time
•
Approximately 80% of home equity loans are lines of credit, the
majority of which do not begin to amortize until 2015 or later, and
balances continue to decline
•
Lines of credit are generally structured as 5-10 year draw period,
followed by 10-20 year amortization period
•
Average loan size: $75k
(21)
•
Approximately 40% of HELOC borrowers in their draw period
made meaningful voluntary principal reductions in 2012
of at least $500
•
Approximately half of those borrowers (20%) reduced their
principal balance by at least $2,500 during 2012 |
 ©
2013 E*TRADE Financial Corporation all rights reserved
19
Continue to manage and de-risk the Bank
•
Deleveraging actions and resulting smaller
balance sheet
•
Proactive and scheduled reduction of
wholesale borrowings
•
Runoff of higher yielding legacy loan
portfolio
•
Declining marginal reinvestment rate
on agency securities
Current drivers of net interest spread |
       ©
2013 E*TRADE Financial Corporation all rights reserved
20
•
Prolonged low interest rate environment
•
Home prices
•
Weak consumer / investor confidence
•
Heightened regulatory sensitivity
Environmental
Challenges
•
Mitigate credit losses on legacy loan portfolio
•
Execute on all aspects of the Strategic Plan
•
Obtain regulatory approval to distribute capital from
Bank to Parent
•
Build out enterprise risk management capabilities
E*TRADE
Challenges
•
Accelerate growth of customer franchise
•
Expand brand as a trusted retirement and investing
provider
•
Cost reduction / efficiency gains
E*TRADE
Opportunities
Challenges and opportunities |
 |
 ©
2013 E*TRADE Financial Corporation all rights reserved
22
Appendix |
 ©
2013 E*TRADE Financial Corporation all rights reserved
23
Appendix |
 ©
2013 E*TRADE Financial Corporation all rights reserved
24
Appendix |