Attached files
| file | filename |
|---|---|
| 8-K - CURRENT REPORT OF MATERIAL EVENTS OR CORPORATE CHANGES - Monogram Residential Trust, Inc. | a13-6362_18k.htm |
Exhibit 99.1
|
|
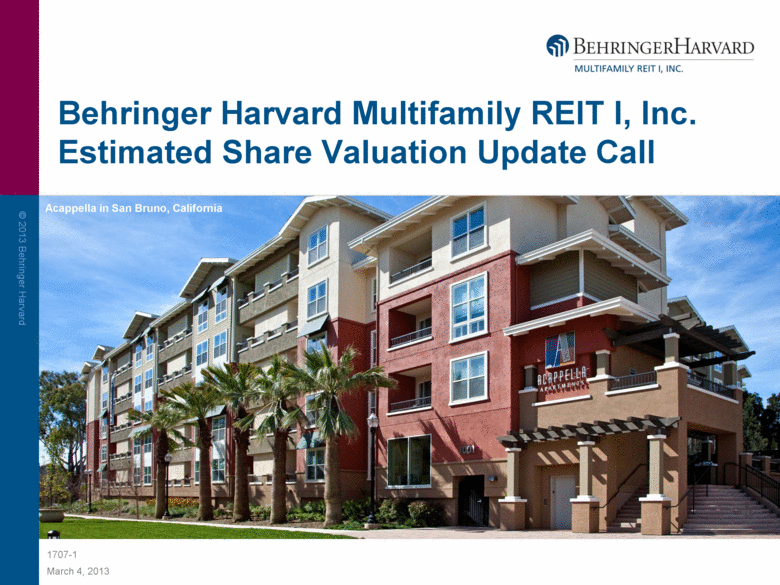
Behringer Harvard Multifamily REIT I, Inc. Estimated Share Valuation Update Call Acappella in San Bruno, California 1707-1 |
|
|
Forward-Looking Statements This presentation contains forward-looking statements, including discussion and analysis of the financial condition of Behringer Harvard Multifamily REIT I, Inc. (the “REIT”) and its subsidiaries and other matters. These forward-looking statements are not historical facts but are the intent, belief or current expectations of the REIT’s management based on their knowledge and understanding of the REIT’s business and industry. Words such as “may,” “anticipates,” “expects,” “intends,” “plans,” “believes,” “seeks,” “estimates,” “would,” “could,” “should” and variations of these words and similar expressions are intended to identify forward-looking statements. We intend that such forward-looking statements be subject to the safe harbor provisions created by Section 27A of the Securities Act of 1933, as amended (the “Securities Act”), and Section 21E of the Securities Exchange Act of 1934, as amended (the “Exchange Act”). These statements are not guarantees of future performance and are subject to risks, uncertainties and other factors, some of which are beyond our control, are difficult to predict and could cause actual results to differ materially from those expressed or forecasted in the forward-looking statements. Forward-looking statements that were true at the time made may ultimately prove to be incorrect or false. We caution you not to place undue reliance on forward-looking statements, which reflect the REIT’s management's view only as of the date of this presentation. We undertake no obligation to update or revise forward-looking statements to reflect changed assumptions the occurrence of unanticipated events or changes to future operating results. |
|
|
Forward-Looking Statements Factors that could cause actual results to vary materially from any forward-looking statements made in this presentation include, but are not limited to: absence of a public market for the REIT’s securities; limited operating history; limited transferability and lack of liquidity; risks associated with lending activities ; no assurance that distributions will continue to be made or that any particular rate of distribution will be maintained; until the proceeds from an offering are invested and generating cash flow from operating activities, some or all of the distributions will be paid from other sources, which may be deemed a return of capital, such as from the proceeds of an offering, cash advances by the advisor, cash resulting from a waiver of asset management fees, proceeds from the sales of assets, and borrowings in anticipation of future cash flow from operating activities, which could result in less proceeds to make investments in real estate; reliance on the program’s advisor; payment of significant fees to the advisor and their affiliates ; potential conflicts of interest; lack of diversification in property holdings; Market and economic challenges experienced by the U.S. economy or real estate industry as a whole and the local economic conditions in the markets in which our properties are located; the REIT’s ability to make accretive investments in a diversified portfolio of assets; Availability of cash flow from operating activities for distribution; the REIT’s level of debt and the terms and limitations imposed on the REIT by its debt agreements; the availability of credit generally, and any failure to obtain debt financing at favorable terms or a failure to satisfy the conditions and requirements of that debt; the ability to secure resident leases at favorable rental rates; the ability to raise future capital through equity and debt security offerings and through joint venture arrangements; the ability to retain our executive officers and other key personnel of our advisor, our property manager and their affiliates; conflicts of interest arising out of our relationships with our advisor and its affiliates; unfavorable changes in laws or regulations impacting our business, our assets or our key relationships; factors that could affect our ability to qualify as a real estate investment trust; potential development risks and construction delays; the potential inability to retain current tenants and attract new tenants due to a competitive real estate market; risk that a program’s operating results will be affected by economic and regulatory changes that have an adverse impact on a program’s investments; risks related to investments in distressed properties or debt include possible default under the original loan; unforeseen increases in operating and capital expenses; declines in real estate values; and, lack of availability of due diligence information. These risks may impact the REIT’s financial condition, operating results, returns to its shareholders, and ability to make distributions as stated in the REIT’s offering. Investment in securities of Behringer Harvard real estate programs is subject to substantial risks and may result in the loss of principal invested. Real Estate programs are not suitable for all investors. The forward looking statements should be read in light of these and other risk factors identified in the “Risk Factors” section of the REIT’s Annual Report on Form 10-K for the year ended December 31, 2012, as filed with the Securities and Exchange Commission. |
|
|
Full Disclosure in Annual Report filed on Form 10-K Note: For additional information on the Estimated Share Valuation, new price per share under the Distribution Reinvestment Plan, and the terms of the modified and reinstated Share Redemption Plan, please see the “Estimated Per Share Value” section under “Item 5. Market for Registrant’s Common Equity, Related Stockholder Matters and Issuer Purchases of Equity Securities” in the REIT’s Annual Report on Form 10-K for the year ended December 31, 2012 as filed on March 1, 2013 with the Securities and Exchange Commission Full text of the modified and reinstated Share Redemption Plan can be found in Exhibit 4.4, filed with the Annual Report on Form 10-K |
|
|
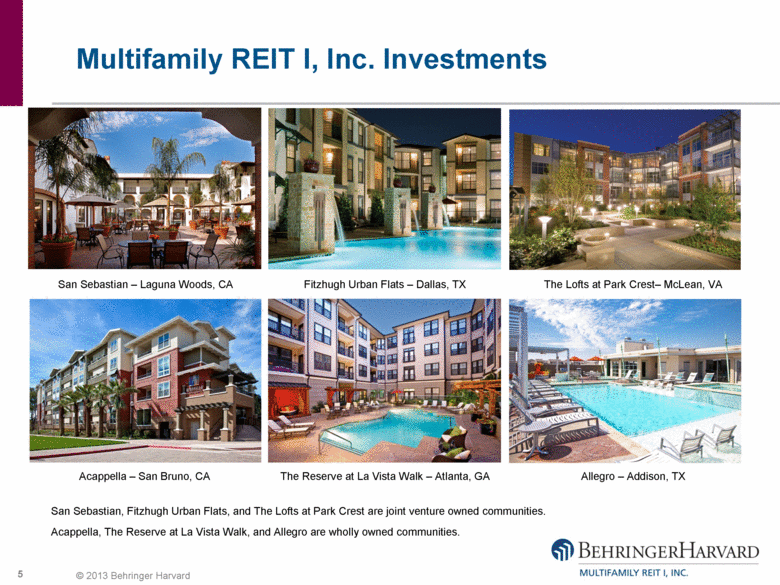
Multifamily REIT I, Inc. Investments San Sebastian – Laguna Woods, CA The Lofts at Park Crest– McLean, VA Fitzhugh Urban Flats – Dallas, TX Acappella – San Bruno, CA Allegro – Addison, TX The Reserve at La Vista Walk – Atlanta, GA San Sebastian, Fitzhugh Urban Flats, and The Lofts at Park Crest are joint venture owned communities. Acappella, The Reserve at La Vista Walk, and Allegro are wholly owned communities. |
|
|
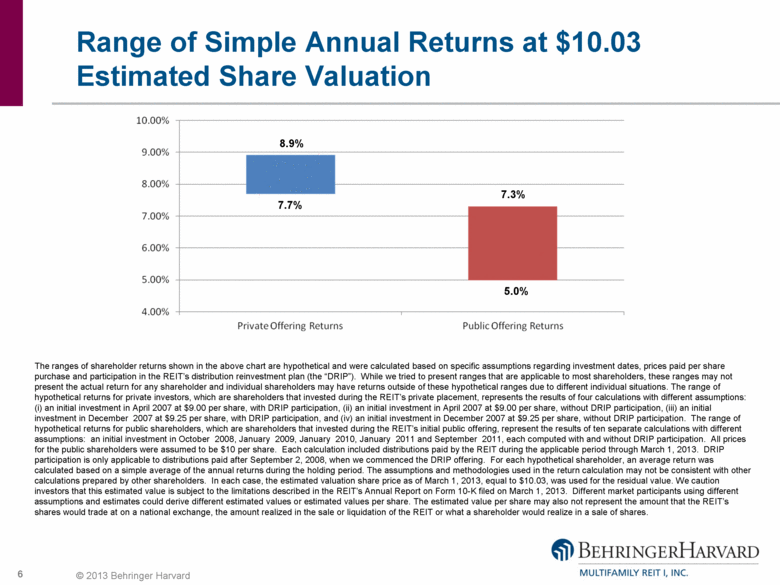
Range of Simple Annual Returns at $10.03 Estimated Share Valuation 8.9% 7.7% 7.3% 5.0% The ranges of shareholder returns shown in the above chart are hypothetical and were calculated based on specific assumptions regarding investment dates, prices paid per share purchase and participation in the REIT’s distribution reinvestment plan (the “DRIP”). While we tried to present ranges that are applicable to most shareholders, these ranges may not present the actual return for any shareholder and individual shareholders may have returns outside of these hypothetical ranges due to different individual situations. The range of hypothetical returns for private investors, which are shareholders that invested during the REIT’s private placement, represents the results of four calculations with different assumptions: (i) an initial investment in April 2007 at $9.00 per share, with DRIP participation, (ii) an initial investment in April 2007 at $9.00 per share, without DRIP participation, (iii) an initial investment in December 2007 at $9.25 per share, with DRIP participation, and (iv) an initial investment in December 2007 at $9.25 per share, without DRIP participation. The range of hypothetical returns for public shareholders, which are shareholders that invested during the REIT’s initial public offering, represent the results of ten separate calculations with different assumptions: an initial investment in October 2008, January 2009, January 2010, January 2011 and September 2011, each computed with and without DRIP participation. All prices for the public shareholders were assumed to be $10 per share. Each calculation included distributions paid by the REIT during the applicable period through March 1, 2013. DRIP participation is only applicable to distributions paid after September 2, 2008, when we commenced the DRIP offering. For each hypothetical shareholder, an average return was calculated based on a simple average of the annual returns during the holding period. The assumptions and methodologies used in the return calculation may not be consistent with other calculations prepared by other shareholders. In each case, the estimated valuation share price as of March 1, 2013, equal to $10.03, was used for the residual value. We caution investors that this estimated value is subject to the limitations described in the REIT’s Annual Report on Form 10-K filed on March 1, 2013. Different market participants using different assumptions and estimates could derive different estimated values or estimated values per share. The estimated value per share may also not represent the amount that the REIT’s shares would trade at on a national exchange, the amount realized in the sale or liquidation of the REIT or what a shareholder would realize in a sale of shares. |
|
|
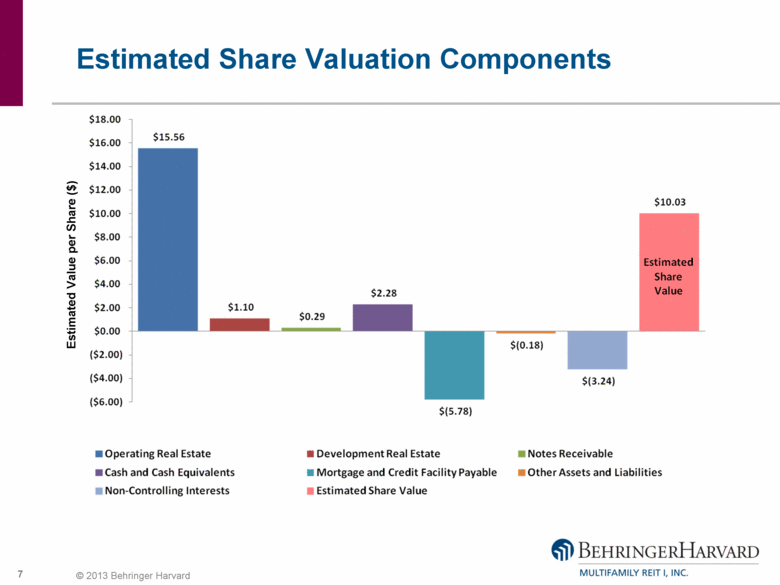
Estimated Share Valuation Components Estimated Value per Share ($) |
|
|
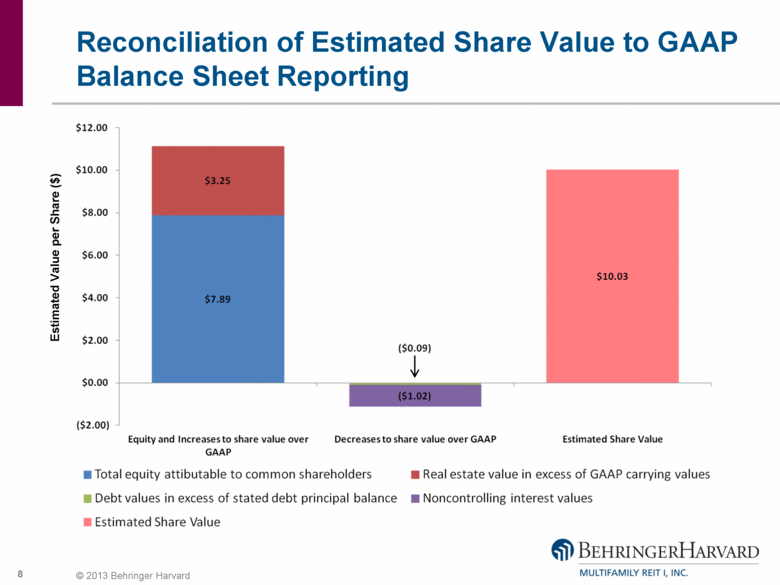
Reconciliation of Estimated Share Value to GAAP Balance Sheet Reporting Estimated Value per Share ($) |
|
|
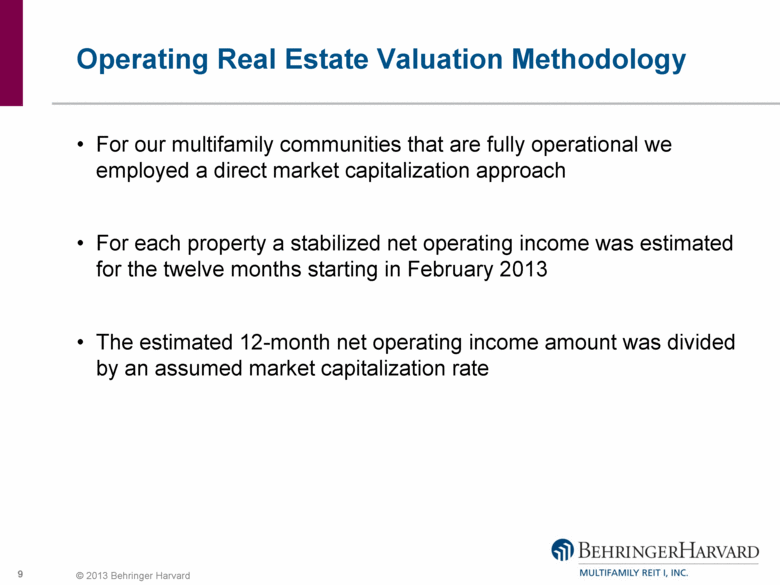
Operating Real Estate Valuation Methodology For our multifamily communities that are fully operational we employed a direct market capitalization approach For each property a stabilized net operating income was estimated for the twelve months starting in February 2013 The estimated 12-month net operating income amount was divided by an assumed market capitalization rate |
|
|
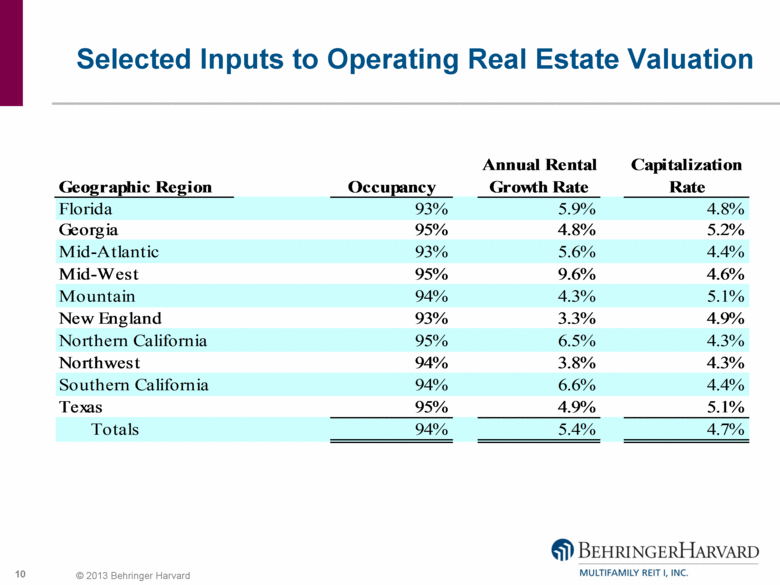
Selected Inputs to Operating Real Estate Valuation Annual Rental Capitalization Geographic Region Occupancy Growth Rate Rate Florida 93% 5.9% 4.8% Georgia 95% 4.8% 5.2% Mid-Atlantic 93% 5.6% 4.4% Mid-West 95% 9.6% 4.6% Mountain 94% 4.3% 5.1% New England 93% 3.3% 4.9% Northern California 95% 6.5% 4.3% Northwest 94% 3.8% 4.3% Southern California 94% 6.6% 4.4% Texas 95% 4.9% 5.1% Totals 94% 5.4% 4.7% |
|
|
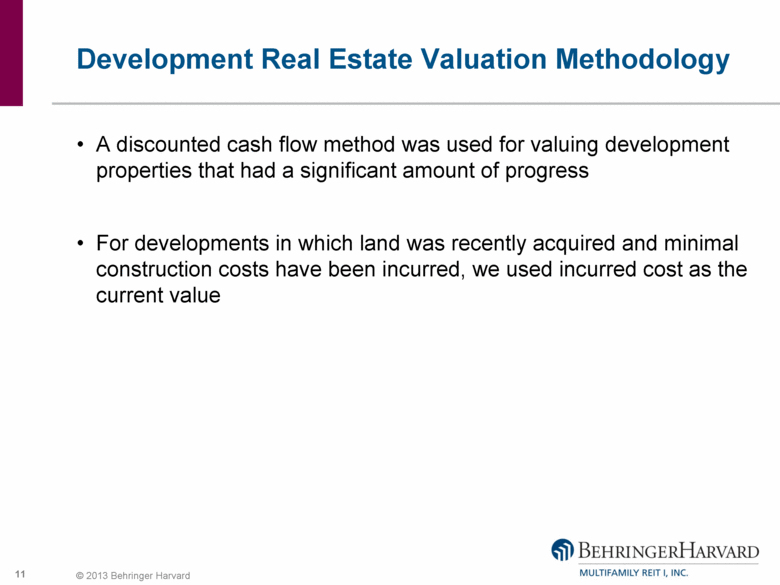
Development Real Estate Valuation Methodology A discounted cash flow method was used for valuing development properties that had a significant amount of progress For developments in which land was recently acquired and minimal construction costs have been incurred, we used incurred cost as the current value |
|
|
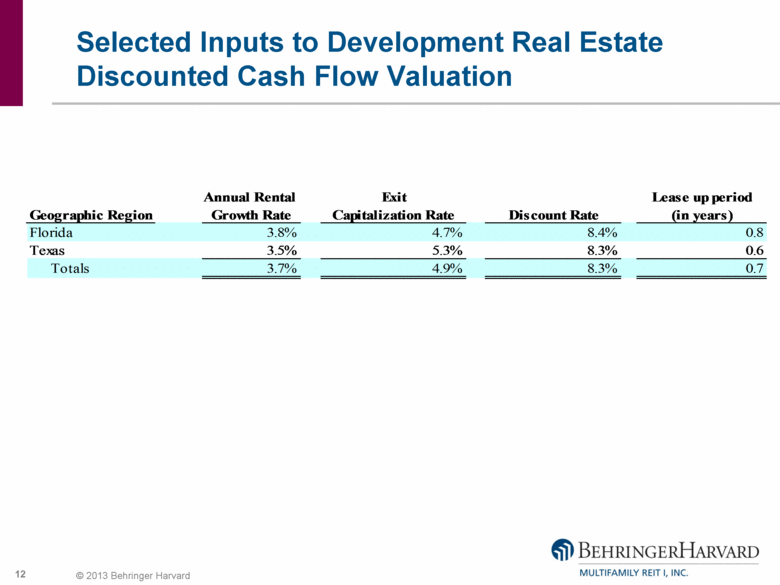
Selected Inputs to Development Real Estate Discounted Cash Flow Valuation Annual Rental Exit Lease up period Geographic Region Growth Rate Capitalization Rate Discount Rate (in years) Florida 3.8% 4.7% 8.4% 0.8 Texas 3.5% 5.3% 8.3% 0.6 Totals 3.7% 4.9% 8.3% 0.7 |
|
|
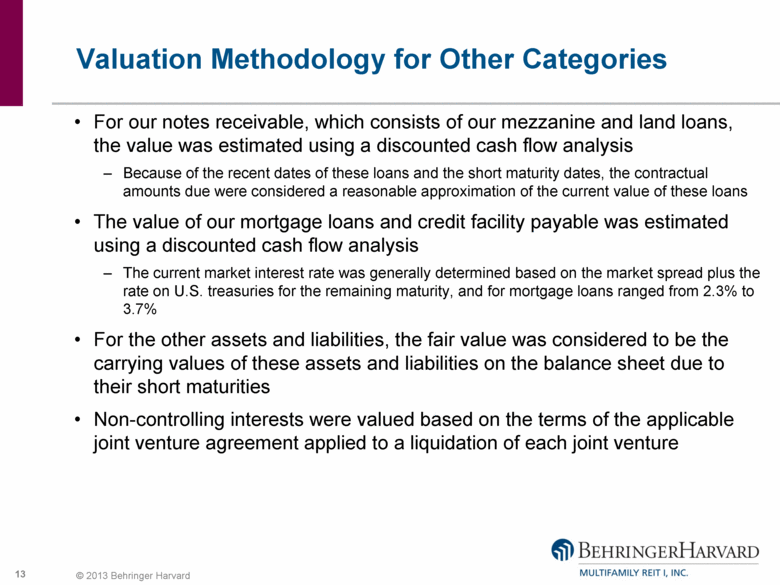
Valuation Methodology for Other Categories For our notes receivable, which consists of our mezzanine and land loans, the value was estimated using a discounted cash flow analysis Because of the recent dates of these loans and the short maturity dates, the contractual amounts due were considered a reasonable approximation of the current value of these loans The value of our mortgage loans and credit facility payable was estimated using a discounted cash flow analysis The current market interest rate was generally determined based on the market spread plus the rate on U.S. treasuries for the remaining maturity, and for mortgage loans ranged from 2.3% to 3.7% For the other assets and liabilities, the fair value was considered to be the carrying values of these assets and liabilities on the balance sheet due to their short maturities Non-controlling interests were valued based on the terms of the applicable joint venture agreement applied to a liquidation of each joint venture |
|
|
Distribution Reinvestment Plan Pricing Effective March 1, 2013, distributions may be reinvested in shares of our common stock at a price of $9.53 per share, which is approximately 95% of the first estimated valuation |
|
|
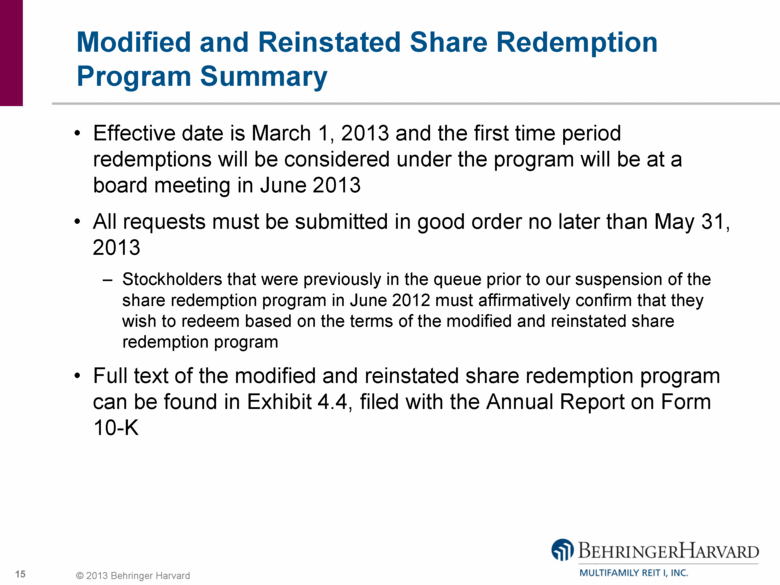
Modified and Reinstated Share Redemption Program Summary Effective date is March 1, 2013 and the first time period redemptions will be considered under the program will be at a board meeting in June 2013 All requests must be submitted in good order no later than May 31, 2013 Stockholders that were previously in the queue prior to our suspension of the share redemption program in June 2012 must affirmatively confirm that they wish to redeem based on the terms of the modified and reinstated share redemption program Full text of the modified and reinstated share redemption program can be found in Exhibit 4.4, filed with the Annual Report on Form 10-K |
|
|
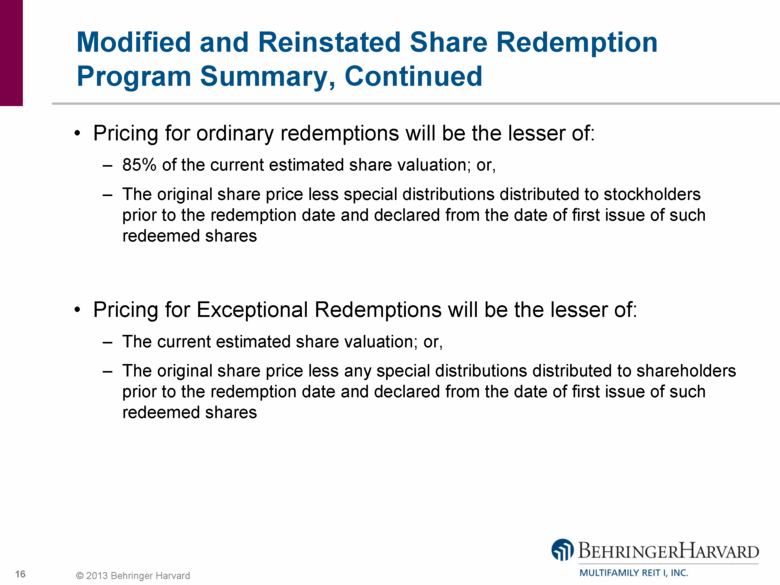
Modified and Reinstated Share Redemption Program Summary, Continued Pricing for ordinary redemptions will be the lesser of: 85% of the current estimated share valuation; or, The original share price less special distributions distributed to stockholders prior to the redemption date and declared from the date of first issue of such redeemed shares Pricing for Exceptional Redemptions will be the lesser of: The current estimated share valuation; or, The original share price less any special distributions distributed to shareholders prior to the redemption date and declared from the date of first issue of such redeemed shares |
|
|
Modified and Reinstated Share Redemption Program Summary, Continued A quarterly funding limit has been established of $7 million per quarter If we do not redeem all shares presented for redemption during any period in which we are redeeming shares, then all shares will generally be redeemed on a pro rata basis during the relevant period Exceptional redemptions will be considered first, as a group, with any remaining available funds allocated pro rata among requests for ordinary redemptions Generally, no outstanding requests for ordinary redemptions will be satisfied until all outstanding requests for exceptional redemptions are satisfied in full |
|
|
Modified and Reinstated Share Redemption Program Summary, Continued No time limitation for those seeking an exceptional redemption The effective date of any redemption has been changed to the fifth business day following the date the board approves the redemption |
|
|
Full Disclosure in Annual Report filed on Form 10-K Note: For additional information on the Estimated Share Valuation, new price per share under the Distribution Reinvestment Plan, and the terms of the modified and reinstated Share Redemption Plan, please see the “Estimated Per Share Value” section under “Item 5. Market for Registrant’s Common Equity, Related Stockholder Matters and Issuer Purchases of Equity Securities” in the REIT’s Annual Report on Form 10-K for the year ended December 31, 2012 as filed on March 1, 2013 with the Securities and Exchange Commission Full text of the modified and reinstated Share Redemption Plan can be found in Exhibit 4.4, filed with the Annual Report on Form 10-K |
|
|
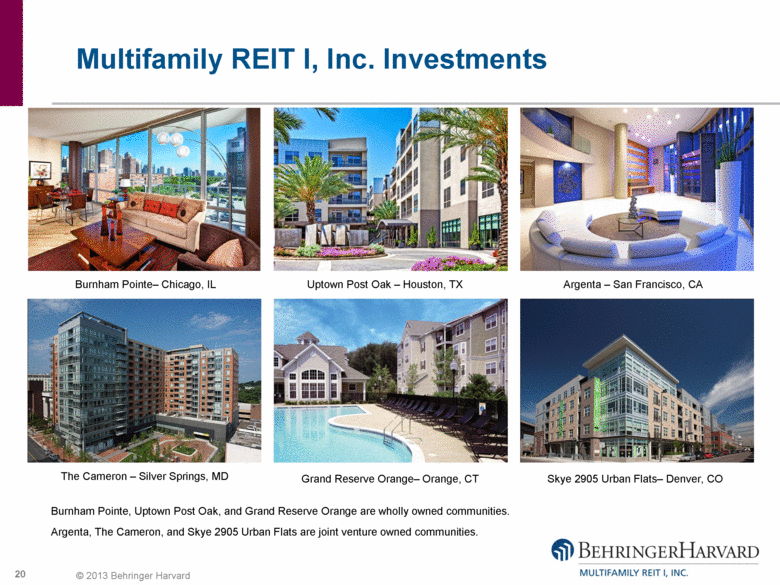
Multifamily REIT I, Inc. Investments Burnham Pointe– Chicago, IL Argenta – San Francisco, CA Uptown Post Oak – Houston, TX The Cameron – Silver Springs, MD Burnham Pointe, Uptown Post Oak, and Grand Reserve Orange are wholly owned communities. Argenta, The Cameron, and Skye 2905 Urban Flats are joint venture owned communities. Grand Reserve Orange– Orange, CT Skye 2905 Urban Flats– Denver, CO |
|
|
Questions? Press *1 to enter the queue Please ask one question and a follow-up question Re-enter the queue to ask further questions |
|
|
Playback Information Representatives may log on to the password protected portion of the Behringer Harvard website (www.behringerharvard.com) for a playback of today’s call Home office contacts may dial toll free (855) 859-2056 and use conference ID 89617810 to access a playback of today’s call Replays will be available until Monday, April 1, 2013 |

