Attached files
| file | filename |
|---|---|
| 8-K - FORM 8-K - Chaparral Energy, Inc. | d492825d8k.htm |
| EX-99.1 - EX-99.1 - Chaparral Energy, Inc. | d492825dex991.htm |
 Chaparral Energy
J.P. Morgan High Yield & Leveraged
Finance Conference
February, 2013
Chaparral Energy
J.P. Morgan High Yield & Leveraged
Finance Conference
February, 2013
Exhibit 99.2 |
 2
This presentation contains "forward-looking statements" within the meaning of
Section 27A of the Securities Act of 1933, as amended, and Section 21E of the Securities
Exchange Act of 1934, as amended. These forward-looking statements are subject
to certain risks, trends and uncertainties that could cause actual results to differ materially from
those projected. Among those risks, trends and uncertainties are our ability to find oil
and natural gas reserves that are economically recoverable, the volatility of oil and
natural gas prices and significantly depressed natural gas prices since the middle of
2008, the uncertain economic conditions in the United States and globally, the decline in the values of our
properties that have resulted in and may in the future result in additional ceiling test
write-downs, our ability to replace reserves and sustain production, our estimate of
the sufficiency of our existing capital sources, our ability to raise additional capital
to fund cash requirements for future operations, the uncertainties involved in prospect development
and property acquisitions or dispositions and in projecting future rates of production or future
reserves, the timing of development expenditures and drilling of wells, hurricanes and
other natural disasters, including the impact of the oil spill in the Gulf of Mexico on
our present and future operations, the impact of government regulation, and the operating
hazards attendant to the oil and natural gas business. In particular, careful consideration should be given to
cautionary statements made in the various reports we have filed with the Securities and
Exchange Commission. We undertake no duty to update or revise these forward-looking
statements. |
 3
3
Company Representative
Company Representative
3
Joe Evans
Chief Financial Officer
& Executive Vice President
Mark Fischer
Chief Executive Officer
& President
Patrick Graham
Manager of Corporate Planning
& Investor Relations
Earl Reynolds
Chief Operating Officer
& Executive Vice President |
 Founded in 1988, Based in
Oklahoma City Core
areas
—
Mid-Continent
(Oklahoma)
and
Permian
Basin
(W.
Texas)
Stable
1P
base
with
large
potential
upside
–
771
MMBoe,
R/P
16
years
Oil focused:
Third largest “oil”
producer in Oklahoma
(71%
oil;
29%
gas)
–
2012
Preliminary
SEC
Reserves
(64%
oil;
36%
gas)
–
2013
Production
Estimate
Growth drivers:
Near-term
growth
potential
through
drilling
~
500,000
acres
Long-term
growth
through
CO
2
EOR
–
74
fields
¹Based on 12/31/2011 and 12/31/2012 SEC methodology
2
Preliminary Results
Company Statistics
2011
2012
2
Annual Production (Boe/d)
~23,700
~24,910
Proved Reserves (MMBoe)
1
156.3
146.1
Proved Reserves PV-10 ($ in mm)
1
$2,309
$2,068
TTM EBITDA ($ mm)
$313
$330-340
4
4
Chaparral Overview
Chaparral Overview |
 Operating
Areas Operating Areas
As of December 31, 2012 (SEC)
Core Area
Growth Area
Acreage
Field Offices
Headquarters
Val Verde
Basin
5
Sabine
Uplift
Midland
Basin
Delaware
Basin
Ouachita
Uplift
Arkoma
Basin
Fort
Worth
Basin
Anadarko
Woodford
Basin
OKC
Company Total
December
2012
proved
reserves
–
146.1
MMBoe
2012
average
daily
production
–
24.9
MBoe/d
Acreage (gross / net): 1,238,747 / 628,564
North Texas
Reserves: 3.8 MMBoe, 3% of total
Production: 0.4 Mboe/d, 2% of total
Permian Basin
Reserves: 17.1 MMBoe, 12% of total
Production: 3.2 MBoe/d, 13% of total
Mid-Continent
(Anadarko Basin & Central Oklahoma)
Reserves: 117.8 MMBoe, 81% of total
Production: 19.3 MBoe/d, 78% of total
Ark-La-Tex
Reserves: 5.4 MMBoe, 4% of total
Production: 1.2 MBoe/d, 5% of total
Gulf Coast
Reserves: 2.0 MMBoe, 1% of total
Production: 0.8 MBoe/d, 3% of total |
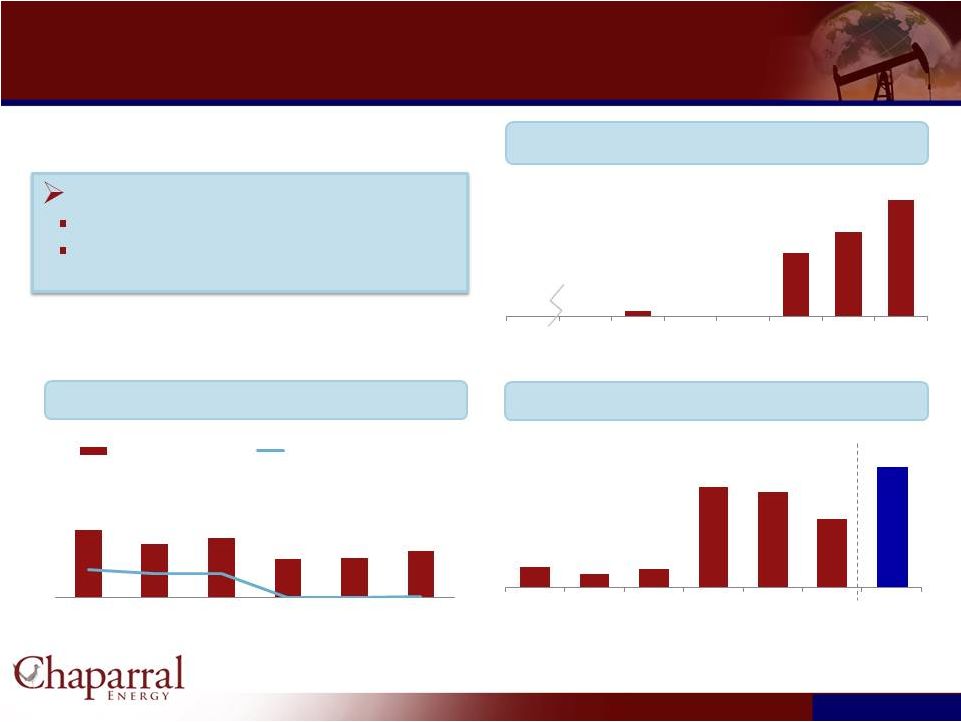
 Strong
Record of Reserve and Production Growth Strong Record of Reserve and Production
Growth Year-End SEC Reserves (MMBoe)
(1)
2003 –
2012 CAGR = 12%
Annual Production (MMBoe)
2003 –
2012 CAGR = 15%
Chaparral’s reserve replacement ratio averaged 383%
per year since 2003
6
6
Year
Oil
Gas
2007
$96.01
$6.80
2008
$44.60
$5.62
2009
$61.18
$3.87
2010
$79.43
$4.38
2011
$96.19
$4.11
2012
$94.71
$2.76
1)
Reserves
as
of
December
31
for each year calculated
using flat SEC
pricing per the following:
6
6
*2013B illustrated at midpoint of guidance |
     2011 to
2012 SEC Reserves Reconciliation 2011 to 2012 SEC Reserves Reconciliation
7
7
7
Product Pricing - SEC
12/31/2011
Price
12/31/2012
Price
Difference
Difference
(%)
Oil ($/bbl)
$ 96.19
$ 94.71
$ (1.48)
-1.5%
Gas ($/MMBtu)
$ 4.12
$ 2.76
$ (1.36)
-33.0%
Total YTD Proved Volume
Reconciliation
Volumes in
MMBOE
Beginning Balance (12/31/2011)
156.3
2012 Production
-9.1
Extensions & Discoveries
13.3
Improved Recoveries (EOR)
0.8
Divestitures
-3.8
Pricing Revisions
-12.0
Other Revisions
0.5
Ending Balance (12/31/2012)
146.1
Negative price revisions due to low
natural gas pricing and divestitures
reduced year end reserves by ~15.8
mmboe or 11%
Proved liquids reserves increased by
~3% compared to 2011 while total
reserves decreased by ~6.5% |
 Current
Production - 2012
Current Production -
2012
2012 Production by Quarter
8
8
8
Production in the 4
quarter increased 4.3% over the previous quarter
and
increased
15.1%
when
compared
to
the
4
Quarter
2011
From 2011 to 2012, estimated liquids production
increased by over 15% and gas production declined by
approximately 8%
th
th |
 9
9
Net Debt / EBITDA
Liquidity ($mm)
Financial Position to Execute Strategy
Financial Position to Execute Strategy
$325
$300
$400
* Pro-Forma for $150mm Senior Notes Add-On and Increased Borrowing Base;
subject to 4.5x Debt / EBITDA Borrowing Base covenant
* Pro-Forma for $150mm Senior Notes Add-On
Strong Financial Position
No senior note maturities before 2020
Hedge positions in place to secure
cash flow in near term
$25
$300
$400
$550
2012
2016
2017
2018
2019
2020
2021
2022
5.6x
4.4x
4.9x
3.2x
3.3x
3.8x
2.3x
2.0x
2.0x
0.0x
0.0x
0.1x
2007
2008
2009
2010
2011
Q3, 2012
Total net debt to EBITDA
Net secured debt to
EBITDA $88
$55
$77
$429
$407
$290
$514
2007
2008
2009
2010
2011
Q3, 2012
2012
Pro Forma*
Current Maturity Profile ($mm)
* |
 Capital
Budget
($mm)
Capital
Budget
($mm)
Component
2010
2011
2012P
2013B
2013%
Drilling
$196
$172
$239
$206
50%
EOR
36
86
187
$130
32%
Enhancements
39
32
20
$20
5%
Acquisitions
41
17
48
$25
6%
Other (P&E, Capitalized
G&A, etc)
32
28
37
$30
7%
Total
$344
$336
$531
$411
100%
Key Drilling Areas
Capital
Wells
Northern OK Mississippi
Horizontal
$107
38
Marmaton
40
11
Anadarko
Cleveland
Sand
20
7
Anadarko Granite Wash
7
3
Other
32
*
Total
$206
59
10
EOR Field
Capital
N. Burbank
$84
Panhandle Area
42
Other
4
Total
$130
99% of 2013 Capital Program is Oil Focused
*Includes both Operated and Non-Operated Wells |
 11
Drilling Resource Potential
Drilling Resource Potential |
 Substantial Resource Potential for Near-Term Growth
12
12
Near-Term
2,640 Unrisked (1,406 Risked) Net Undrilled Wells
146
MMBoe
Proved
Reserves
Plus
625
MMBoe
Unproved
Resource
Potential
Conventional
Drilling
(ROR
50%
-
75%)
Anadarko Granite Wash
Anadarko Cleveland Sand
Unconventional
Resource
Play
Drilling
(ROR
35%
-
75%)
Northern Oklahoma Mississippi Play (NOMP)
~ 280,000 acres
Panhandle Marmaton
~ 50,000
acres
Anadarko Woodford Shale
~ 22,000 acres
Bone Spring/Avalon Shale
~ 18,000 acres
12 |
 Northern
Oklahoma Mississippi Play The Northern Oklahoma Mississippi Play
(“NOMP”) is a key near–term focus area for Chaparral
Chaparral acreage over 280,000 net acres in the NOMP
Over 151 MMBoe of potential
1,740 unrisked drilling well inventory
Chaparral Acreage
13
KS
OK
Emerging
Core
IP Rates:
300 –
600 Boe/d
EUR:
300 –
400 MBoe
Well Cost:
$3.0 –
$4.0 million
% Oil
40% –
50%
IRR:
25% –
60%
IP Rates:
70 –
300 Boe/d
EUR:
50 –
150 Mboe
Well Cost:
$1.8 –
$2.3 million
% Oil
100%
IRR:
25% –
40%
NOMP Emerging Well Economics
NOMP Core Well Economics
Overview
NOMP Asset Map |
 Marmaton Shelf Play
Johnston 1H-24
IP +300 Boepd
Lamaster 1H-23
IP +600 Boepd
Marmaton Vertical Production
Chaparral Acreage
Net Acreage: 50,000
14
IP Rates:
150 –
600 Boe/d
EUR:
150 –
200 Mboe
Well Cost:
$3.5 –
$4.0 million
% Oil
80%
IRR:
30% –
50%
Jay 1H-1098
IP +150 Boepd
Marmaton
Well
Economics |
 15
Chaparral:
Chaparral:
A Growing Mid-Continent
CO
2
EOR Company
A Growing Mid-Continent
CO
2
EOR Company |
 # of
Active Producer
CO2-EOR Projects
31
22
8
7
7
7
6
5
4
4
4
Total
105
Source: April 2012 Oil & Gas Journal
Note: Chaparral projects include the North Burbank Unit
16
Chaparral is a Leader in the CO2-EOR Industry
Chaparral is the third most active CO2-EOR producer in the U.S.
|
 17
Long Life EOR Assets in Four Key Growth Areas
Long Life EOR Assets in Four Key Growth Areas
Panhandle
Area
Permian
Basin
Central
Oklahoma
Area
Burbank
Area
74 Fields
200+ MMBoe Potential Reserves
Low Geologic Risk
Attractive Economics
ROR –
25% to 40%
ROI –
2.5:1 to 3.5:1
Capital Requirements -
$75-$150 mm/yr
Long-term growth potential -
30-40% CAGR expected through 2020
405 miles of CO
2
Pipelines (net 245)
CO
2
Supply –
95 MMcfd
Current: 50 MMcfd
Coffeyville Contract: 45 MMcfd |
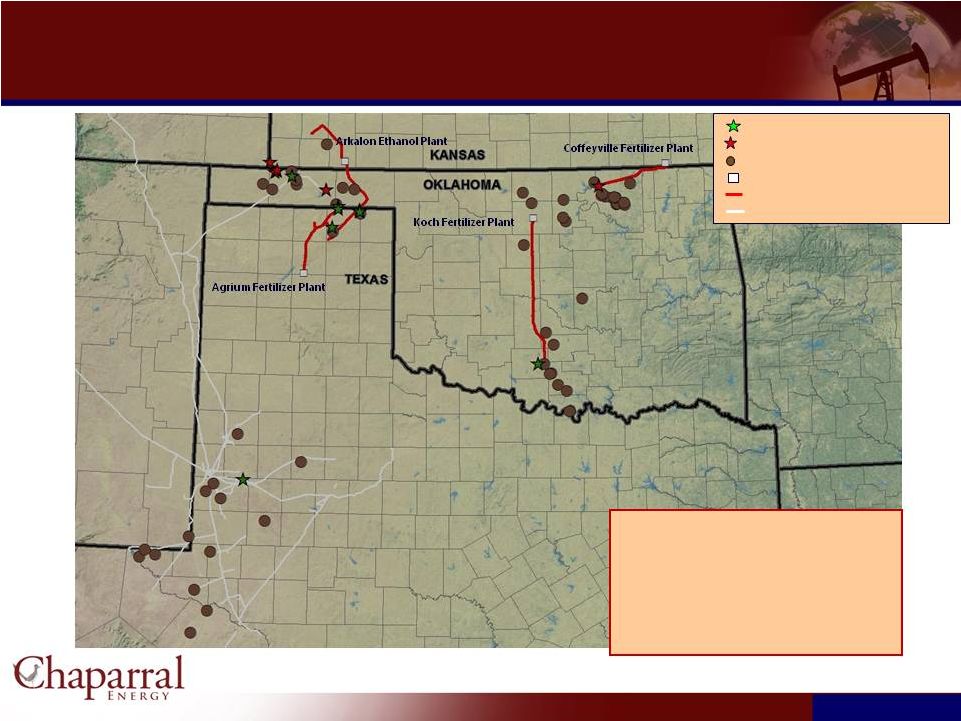 18
18
Current CO
2
Infrastructure/Future EOR Potential
Current CO
2
Infrastructure/Future EOR Potential
Total OOIP
3,735 MMBo
Primary Production 628 MMBo
Secondary Recovery
597 MMBo
Tertiary Potential
410 MMBo
Net Tertiary Potential
197 MMBo
Active CO2
fields
CO2
fields in 5 year plan
Chaparral
Owned
Potential
CO2
fields
CO2
Source
Locations
Chaparral
CO2
Pipelines
Third
Party
CO2
Pipelines |
 EOR 2013
Capital Budget (1)
EOR 2013 Capital Budget
(1)
19
Budget by Category ($mm)
2012P
2013B
Infrastructure / Pipelines
105
62
Drilling
20
16
Enhancements / CO
2
Purchases
62
52
Total
$187
$130
Panhandle
Area
Permian
Basin
Central
Oklahoma
Area
Burbank
Area
(1)
Does not include Capitalized G&A |
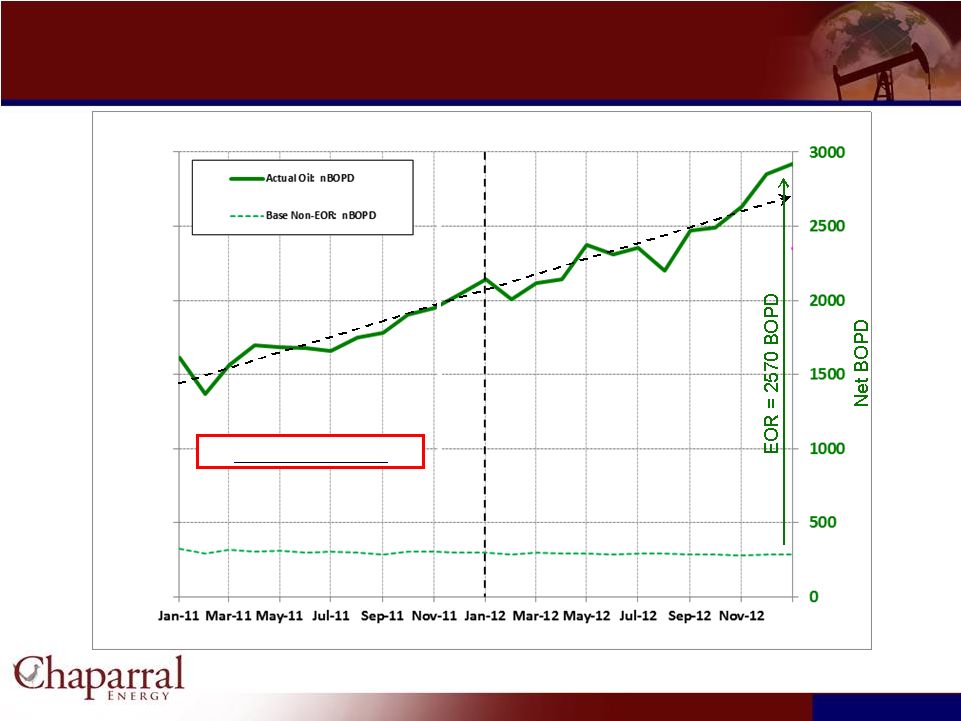 Monthly
Incremental EOR from Active CO 2
Projects
20
Avg. +41% CAGR |
 Chaparral –
Potential EOR Production Growth
Chaparral –
Potential EOR Production Growth
21
Business Plan
Add C02
Others |
 22
North Burbank CO
2
Development
North Burbank CO
2
Development |
 Burbank
Area Potential CO 2
Projects
Burbank Area Potential CO
2
Projects
23
Total OOIP
1,163 MMBbls
Primary Production
239 MMBbls
Secondary Recovery
211 MMBbls
Tertiary Potential
119 MMBbls
Net Tertiary Potential
100 MMBbls
Burbank Area:
Net Potential: 100 MMBoe, 51% of total
|
 Burbank
in Perspective Burbank in Perspective
24
Secondary
Development
Primary
Development
Tertiary
Development
110 Years
“Waterflood”
+8000 BOPD |
 25
Ph-I Vicinity
North Burbank Unit –
Miscibility Pressure Build
Dec 2012
Average pressure
1650 psia |
 Coffeyville CO
2
System
Coffeyville CO
2
System
26
The Coffeyville CO
2
System
$110 million of total capital expenditures
23,500 HP compression facility
68.3-mile 8-inch pipeline with potential
capacity of approximately 60 MMcf/d.
CO
2
is sourced from the CVR Partners
fertilizer plant in Coffeyville, KS.
Online and operational in March 2013
Coffeyville CO2 System
Asset Map |
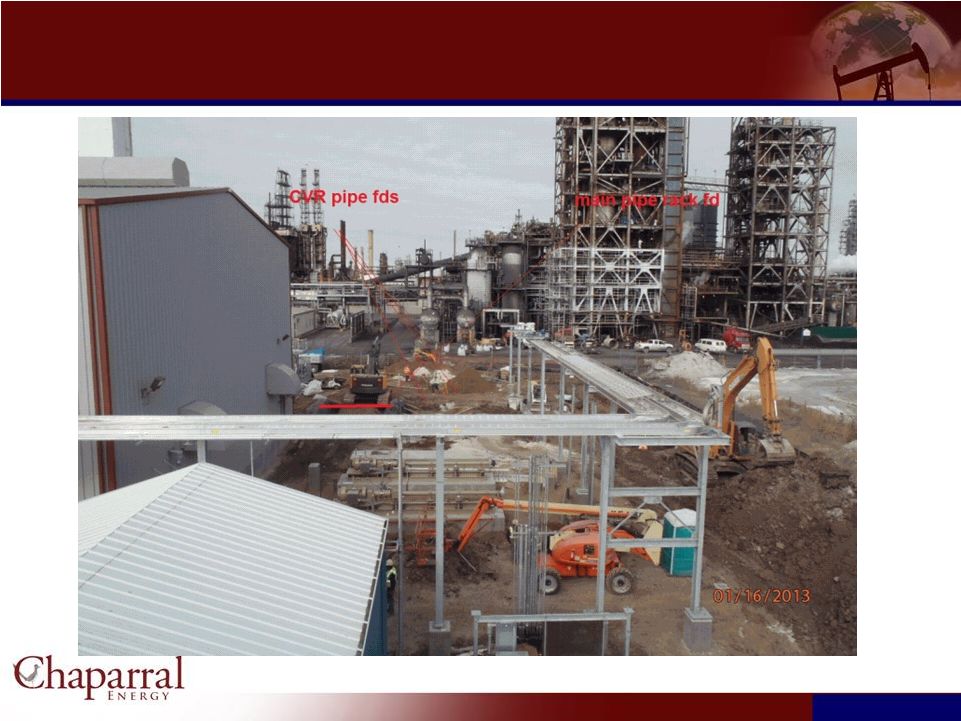
 27
COFFEYVILLE
CO
2
PLANT
COFFEYVILLE
CO
2
PLANT |
 28
COFFEYVILLE
CO
2
PLANT
COFFEYVILLE
CO
2
PLANT |
 29
COFFEYVILLE
CO
2
PLANT
COFFEYVILLE
CO
2
PLANT |
 30
COFFEYVILLE
CO
2
PLANT
COFFEYVILLE
CO
2
PLANT |
 31
COFFEYVILLE
CO
2
PLANT
COFFEYVILLE
CO
2
PLANT |
 32
COFFEYVILLE
CO
2
PIPELINE:
TRENCHING
RIGHT
OF WAY
COFFEYVILLE
CO
2
PIPELINE:
TRENCHING
RIGHT
OF WAY
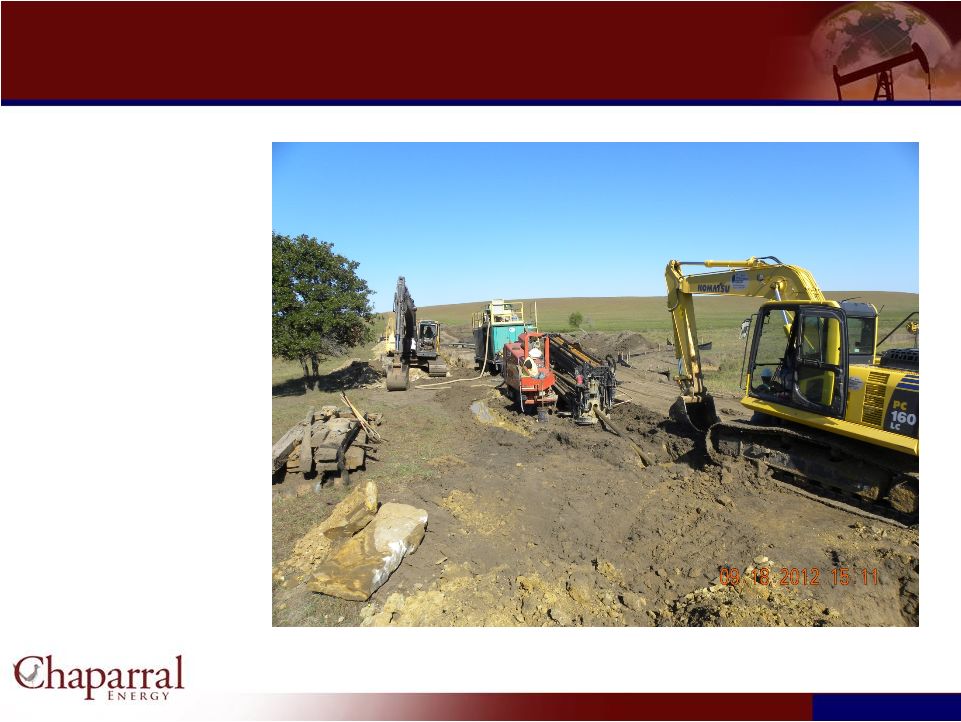
Digging the trench in preparation for laying the pipeline
~68 miles; Coffeyville, KS to Shidler, OK |
 33
COFFEYVILLE
CO
2
PIPELINE:
CLEARING
RIGHT-OF-WAY
COFFEYVILLE
CO
2
PIPELINE:
CLEARING
RIGHT-OF-WAY
Final Efforts:
•
Borings (Pic)
•
Hydro-test |
 34
Other CO
2
Injection Projects
Other CO
2
Injection Projects |
 Camrick
CO 2
–EOR Flood
Camrick CO
2
–EOR Flood
35 |
 36
North Perryton CO
2
–EOR Flood
North Perryton CO
2
–EOR Flood |
 37
Booker Area CO
2
–EOR Flood
Booker Area CO
2
–EOR Flood |
 38
Farnsworth Area CO
2
–EOR Flood (West Side Only)
Farnsworth Area CO
2
–EOR Flood (West Side Only) |
 39
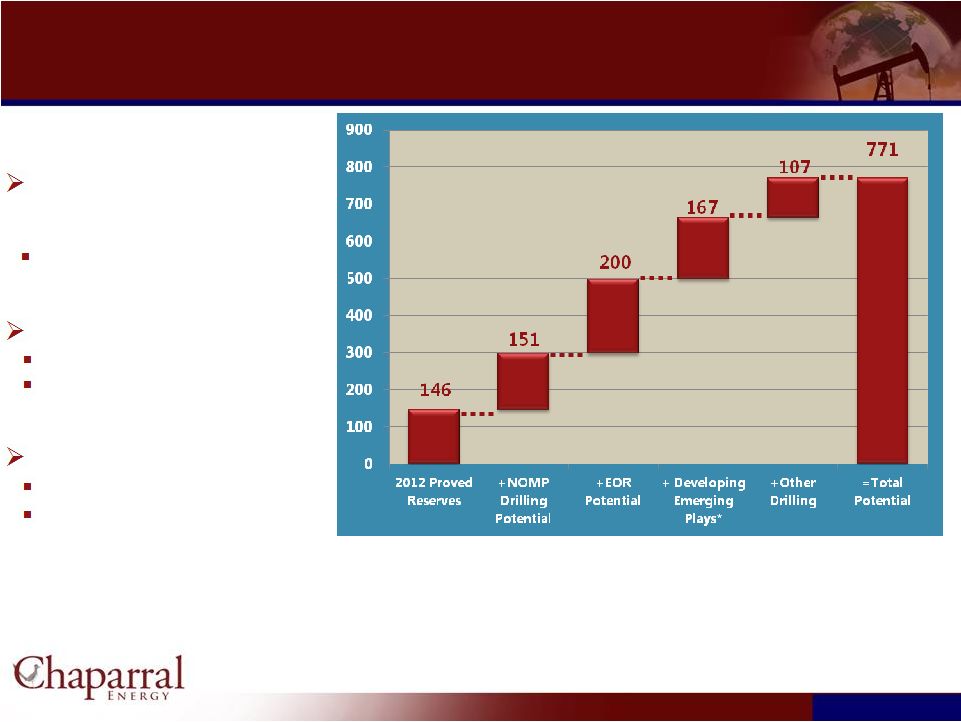
Potential in Excess of 771 MMBoe
Potential in Excess of 771 MMBoe
* Woodford, Bone Spring, Avalon, Cleveland Sand, Granite
Wash, and Marmaton
(1)
Near-term + Long-term
strategy yields significant
value increase
~ 70% Oil
Near-term focus on NOMP
De-risk play, unlock value
Production growth
Long-term focus on EOR
Low-risk production upside
Long-life, stable production |
 40
Financial Overview
Financial Overview |
 41
Financial Summary
Financial Summary |
 Financial Metrics per Boe
42 |
 Operating Statistics
2012
Guidance
2013
Guidance
Capital Expenditures
$460 million
$410 -
$420 million
Production
8.8 -9.0 MMBoe
9.6 -
9.8 MMBoe
General and Administrative
$5.75 –
$6.25/Boe
$5.50 -
$6.00/Boe
Lease Operating Expense
$14.25 -
$14.75/Boe
$14.25 -
$14.75/Boe
2012 and 2013 Guidance
2012 and 2013 Guidance
43 |
 44
% of Total Proved Reserves Hedged (as of February 20, 2013)
Hedge Portfolio
Note:
Dollars
represent
average
strike
price
of
hedges
(includes
all
derivative
instruments)
Gas Basis Hedges
YR
Price
% TP
’13
$
0.20
82%
’14
$
0.23
69% |
 Question & Answer
45 |