Attached files
| file | filename |
|---|---|
| 8-K - FORM 8-K - Arlington Asset Investment Corp. | v334939_8k.htm |
Investor Presentation February 13, 2013
1 Information Related to Forward - Looking Statements This presentation contains “forward - looking statements” within the meaning of the Private Securities Litigation Reform Act of 19 95. These include statements regarding future results or expectations. Forward - looking statements can be identified by forward - look ing language, including words such as “believes,” “anticipates,” “views”, “expects,” “estimates,” “intends,” “may,” “plans,” “pro jec ts,” “potential,” “prospective,” “will” and similar expressions, or the negative of these words. Such forward - looking statements are based on facts and conditions as they exist at the time such statements are made. Forward - looking statements are also based on predictio ns as to future facts and conditions, the accurate prediction of which may be difficult and involve the assessment of events beyond ou r c ontrol. Forward - looking statements are further based on various operating and return assumptions. Caution must be exercised in relying o n forward - looking statements. Due to known and unknown risks, actual results may differ materially from expectations or projectio ns. You should carefully consider these risks when you make a decision concerning an investment in our common stock, along with the following factors, among others, that may cause our actual results to differ materially from those described in any forward - look ing statements: availability of, and our ability to deploy, capital; our ability to grow our business through a strategy focused on acquiring primarily private - label MBS and agency - backed MBS; yields on MBS; our ability to successfully implement our hedging strategy ; our ability to realize reflation on our assets; our ability to effectively migrate private - label MBS to agency - backed MBS; the credit performance of our private - label MBS; our ability to potentially realize a higher return on capital reallocated to agency - backed MBS; current conditions and further adverse developments in the residential mortgage market and the overall economy; job growth; home price stabilization; potential risk attributable to our mortgage - related portfolios; impacts of regulatory changes, including actions taken by the SEC, the U.S. Federal Reserve and the U.S. Treasury and changes affecting Fannie Mae and Freddie Mac; failure of sovereign or municipal entities to meet their debt obligations or a downgrade in the credit rating of such obligations; overall interest rate environment and changes in interest rates, interest rate spreads, the yield curve and prepayment rates; changes in anticipated earnings a nd returns; the amount and growth in our cash earnings and distributable income; growth in our book value per share; our ability to maintain adequate liquidity; our use of leverage and dependence on repurchase agreements and other short - term borrowings to finance our mortgage - r elated holdings; the loss of our exclusion from the definition of “investment company” under the Investment Company Act of 1940; our ab ility to forecast our tax attributes and protect and use our net operating loss carry - forwards and net capital loss carry - forwards to offset future taxable income and gains; changes in our strategies, asset allocation and operational policies; our ability and willingness t o m ake future dividends; competition for investment opportunities and qualified personnel; our ability to retain key personnel; effects of litigation and contractual claims; changes in, and our ability to remain in compliance with, law, regulations or governmental policies affecting our business; risk from strategic ventures or entry into new business areas; failure to maintain effective internal controls; and th e factors described in the sections entitled “Risk Factors” in our annual report on Form 10 - K for the year ended December 31, 2012 and our other public filings with the SEC. You should not place undue reliance on these forward - looking statements, which apply only as of th e date of this presentation. We undertake no obligation to update or revise any forward - looking statement, whether written or oral, relat ing to matters discussed in this presentation, except as may be required by applicable securities laws.
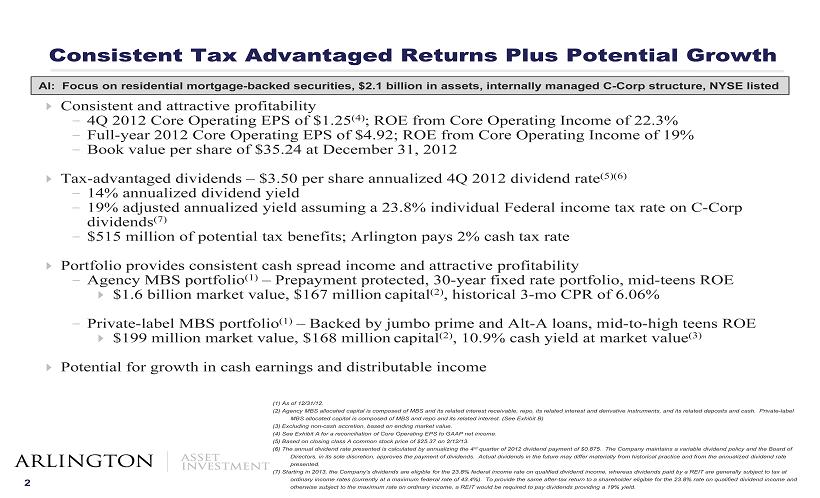
2 Consistent and attractive profitability - 4Q 2012 Core Operating EPS of $1.25 (4) ; ROE from Core Operating Income of 22.3% - Full - year 2012 Core Operating EPS of $4.92; ROE from Core Operating Income of 19% - Book value per share of $35.24 at December 31, 2012 Tax - advantaged dividends – $3.50 per share annualized 4Q 2012 dividend rate (5)(6) - 14% annualized dividend yield - 19% adjusted annualized yield assuming a 23.8% individual Federal income tax rate on C - Corp dividends (7) - $515 million of potential tax benefits; Arlington pays 2% cash tax rate Portfolio provides consistent cash spread income and attractive profitability - Agency MBS portfolio (1) – Prepayment protected, 30 - year fixed rate portfolio, mid - teens ROE $1.6 billion market value, $167 million capital (2) , historical 3 - mo CPR of 6.06% - Private - label MBS portfolio (1) – Backed by jumbo prime and Alt - A loans, mid - to - high teens ROE $199 million market value, $168 million capital (2) , 10.9% cash yield at market value (3) Potential for growth in cash earnings and distributable income ( 1 ) As of 12 / 31 / 12 . (2) Agency MBS allocated capital is composed of MBS and its related interest receivable, repo, its related interest and derivativ e instruments, and its related deposits and cash. Private - label MBS allocated capital is composed of MBS and repo and its related interest . (See Exhibit B) ( 3 ) Excluding non - cash accretion, based on ending market value . ( 4 ) See Exhibit A for a reconciliation of Core Operating EPS to GAAP net income . ( 5 ) Based on closing class A common stock price of $ 25 . 37 on 2 / 12 / 13 . (6) The annual dividend rate presented is calculated by annualizing the 4 rd quarter of 2012 dividend payment of $0.875. The Company maintains a variable dividend policy and the Board of Directors, in its sole discretion, approves the payment of dividends. Actual dividends in the future may differ materially f rom historical practice and from the annualized dividend rate presented. (7) Starting in 2013, the Company's dividends are eligible for the 23.8% federal income rate on qualified dividend income, where as dividends paid by a REIT are generally subject to tax at ordinary income rates (currently at a maximum federal rate of 43.4%). To provide the same after - tax return to a shareholder eli gible for the 23.8% rate on qualified dividend income and otherwise subject to the maximum rate on ordinary income, a REIT would be required to pay dividends providing a 19% yield. Consistent Tax Advantaged Returns Plus Potential Growth AI: Focus on residential mortgage - backed securities, $2.1 billion in assets, internally managed C - Corp structure, NYSE listed
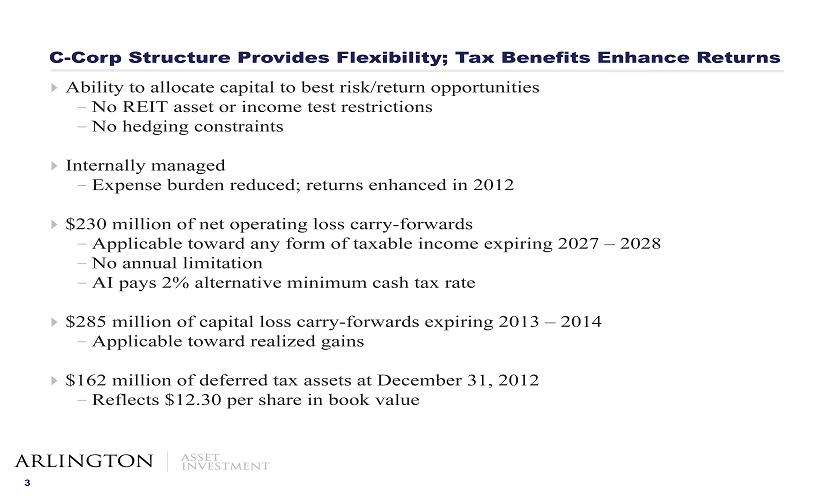
3 Ability to allocate capital to best risk/return opportunities - No REIT asset or income test restrictions - No hedging constraints Internally managed - Expense burden reduced; returns enhanced in 2012 $ 230 million of net operating loss carry - forwards - Applicable toward any form of taxable income expiring 2027 – 2028 - No annual limitation - AI pays 2% alternative minimum cash tax rate $285 million of capital loss carry - forwards expiring 2013 – 2014 - Applicable toward realized gains $162 million of deferred tax assets at December 31, 2012 - Reflects $12.30 per share in book value C - Corp Structure Provides Flexibility; Tax Benefits Enhance Returns
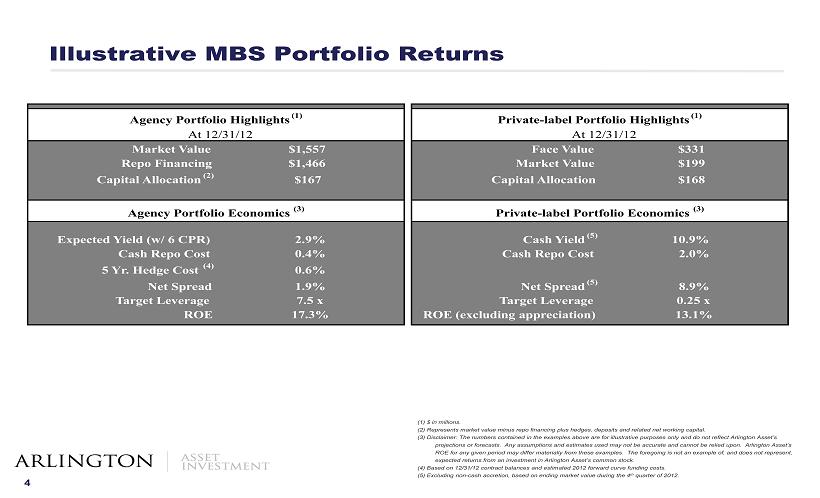
4 Illustrative MBS Portfolio Returns (1) $ in millions. (2) Represents market value minus repo financing plus hedges , deposits and related net working capital. (3) Disclaimer: The numbers contained in the examples above are for illustrative purposes only and do not reflect Arlington Asset’s projections or forecasts. Any assumptions and estimates used may not be accurate and cannot be relied upon. Arlington Asset ’s ROE for any given period may differ materially from these examples. The foregoing is not an example of, and does not represe nt, expected returns from an investment in Arlington Asset’s common stock. (4) Based on 12/31/12 contract balances and estimated 2012 forward curve funding costs. (5) Excluding non - cash accretion, based on ending market value during the 4 th quarter of 2012. Market Value $1,557 Face Value $331 Repo Financing $1,466 Market Value $199 Capital Allocation (2) $167 Capital Allocation $168 Expected Yield (w/ 6 CPR) 2.9% Cash Yield (5) 10.9% Cash Repo Cost 0.4% Cash Repo Cost 2.0% 5 Yr. Hedge Cost (4) 0.6% Net Spread 1.9% Net Spread (5) 8.9% Target Leverage 7.5 x Target Leverage 0.25 x ROE 17.3% ROE (excluding appreciation) 13.1% Agency Portfolio Economics (3) Agency Portfolio Highlights (1) At 12/31/12 Private - label Portfolio Highlights (1) At 12/31/12 Private - label Portfolio Economics (3)
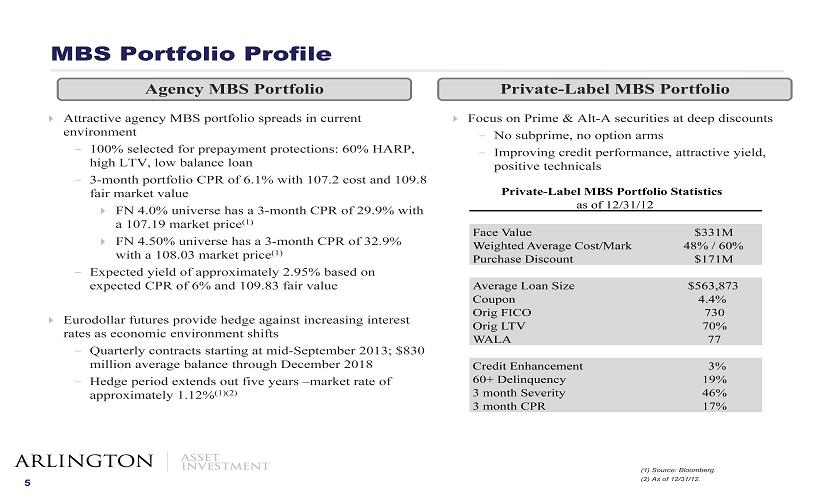
5 MBS Portfolio Profile Attractive agency MBS portfolio spreads in current environment - 100% selected for prepayment protections: 60% HARP, high LTV, low balance loan - 3 - month portfolio CPR of 6.1% with 107.2 cost and 109.8 fair market value FN 4.0% universe has a 3 - month CPR of 29.9% with a 107.19 market price (1) FN 4.50% universe has a 3 - month CPR of 32.9% with a 108.03 market price (1) - Expected yield of approximately 2.95% based on expected CPR of 6 % and 109.83 fair value Eurodollar futures provide hedge against increasing interest rates as economic environment shifts - Quarterly contracts starting at mid - September 2013; $ 830 million average balance through December 2018 - Hedge period extends out five years – market rate of approximately 1.12% ( 1)(2) ( 1 ) Source : Bloomberg. (2) As of 12/31/12. Private - Label MBS Portfolio Focus on Prime & Alt - A securities at deep discounts - No subprime, no option arms - Improving credit performance, attractive yield, positive technicals Agency MBS Portfolio Private - Label MBS Portfolio Statistics Face Value $331M Weighted Average Cost/Mark 48% / 60% Purchase Discount $171M Average Loan Size $563,873 Coupon 4.4% Orig FICO 730 Orig LTV 70% WALA 77 Credit Enhancement 3% 60+ Delinquency 19% 3 month Severity 46% 3 month CPR 17% as of 12/31/12
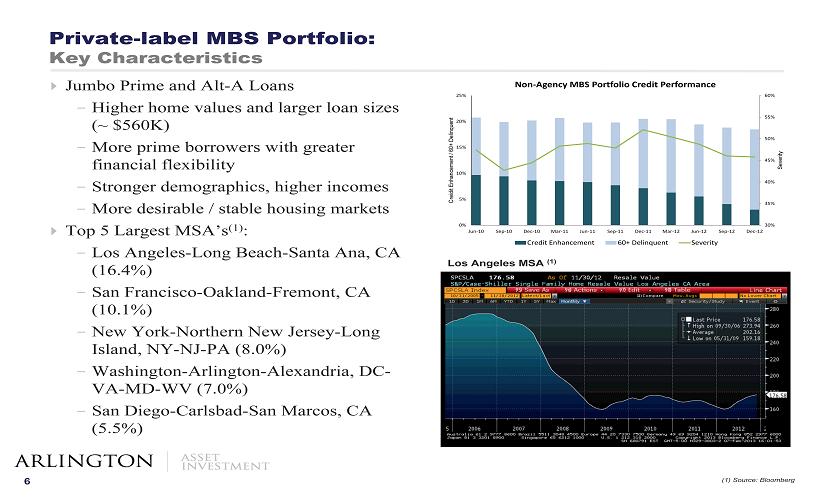
6 Private - label MBS Portfolio: Key Characteristics Jumbo Prime and Alt - A Loans - Higher home values and larger loan sizes (~ $560K) - More prime borrowers with greater financial flexibility - Stronger demographics, higher incomes - More desirable / stable housing markets Top 5 Largest MSA’s (1) : - Los Angeles - Long Beach - Santa Ana, CA (16.4%) - San Francisco - Oakland - Fremont, CA (10.1%) - New York - Northern New Jersey - Long Island, NY - NJ - PA (8.0%) - Washington - Arlington - Alexandria, DC - VA - MD - WV (7.0%) - San Diego - Carlsbad - San Marcos, CA (5.5%) Los Angeles MSA (1) (1) Source: Bloomberg 30% 35% 40% 45% 50% 55% 60% 0% 5% 10% 15% 20% 25% Jun-10 Sep-10 Dec-10 Mar-11 Jun-11 Sep-11 Dec-11 Mar-12 Jun-12 Sep-12 Dec-12 Severity Creidit Enhancement / 60+ Delinquent Non - Agency MBS Portfolio Credit Performance Credit Enhancement 60+ Delinquent Severity
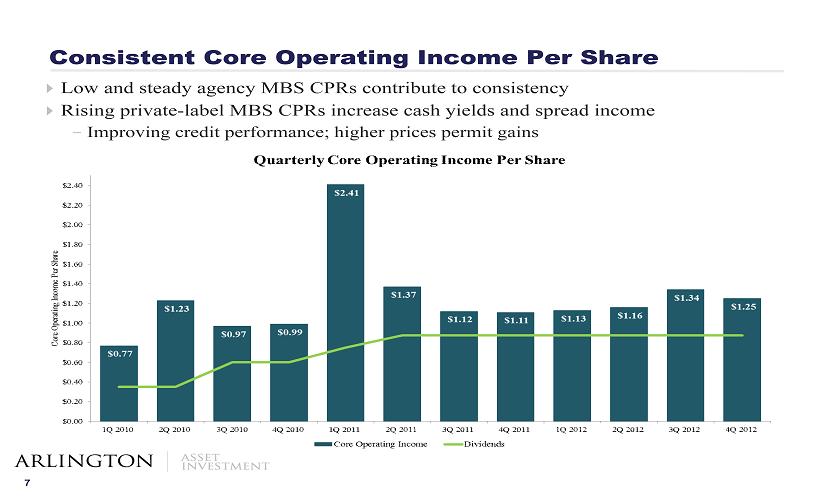
7 Consistent Core Operating Income Per Share Low and steady agency MBS CPRs contribute to consistency Rising private - label MBS CPRs increase cash yields and spread income - Improving credit performance; higher prices permit gains
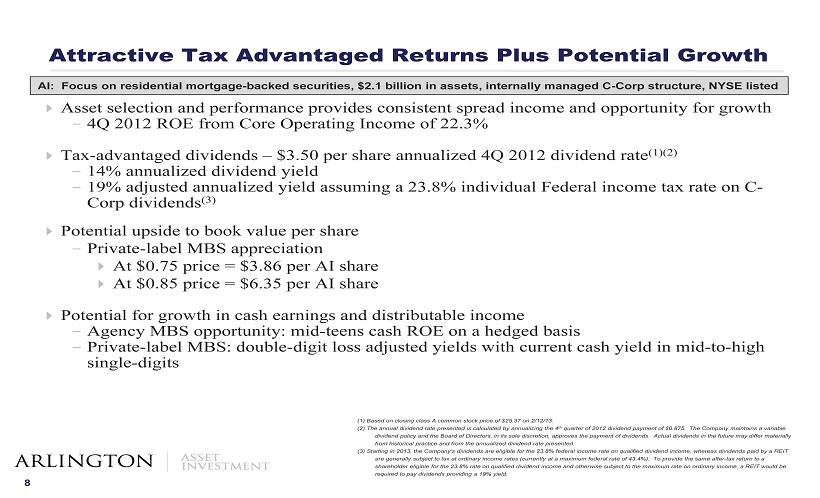
8 Asset selection and performance provides consistent spread income and opportunity for growth - 4Q 2012 ROE from Core Operating Income of 22.3% Tax - advantaged dividends – $3.50 per share annualized 4Q 2012 dividend rate (1)(2) - 14% annualized dividend yield - 19% adjusted annualized yield assuming a 23.8% individual Federal income tax rate on C - Corp dividends (3) Potential upside to book value per share - Private - label MBS appreciation At $0.75 price = $3.86 per AI share At $0.85 price = $6.35 per AI share Potential for growth in cash earnings and distributable income - Agency MBS opportunity: mid - teens cash ROE on a hedged basis - Private - label MBS: double - digit loss adjusted yields with current cash yield in mid - to - high single - digits ( 1 ) Based on closing class A common stock price of $ 25 . 37 on 2 / 12 / 13 . ( 2 ) The annual dividend rate presented is calculated by annualizing the 4 th quarter of 2012 dividend payment of $0.875. The Company maintains a variable dividend policy and the Board of Directors, in its sole discretion, approves the payment of dividends. Actual dividends in t he future may differ materially from historical practice and from the annualized dividend rate presented. (3) Starting in 2013, the Company's dividends are eligible for the 23.8% federal income rate on qualified dividend income, whereas dividends paid by a REI T are generally subject to tax at ordinary income rates (currently at a maximum federal rate of 43.4%). To provide the same after - tax return to a shareholder eligible for the 23.8% rate on qualified dividend income and otherwise subject to the maximum rate on ordinary incom e, a REIT would be required to pay dividends providing a 19% yield. Attractive Tax Advantaged Returns Plus Potential Growth AI: Focus on residential mortgage - backed securities, $2.1 billion in assets, internally managed C - Corp structure, NYSE listed
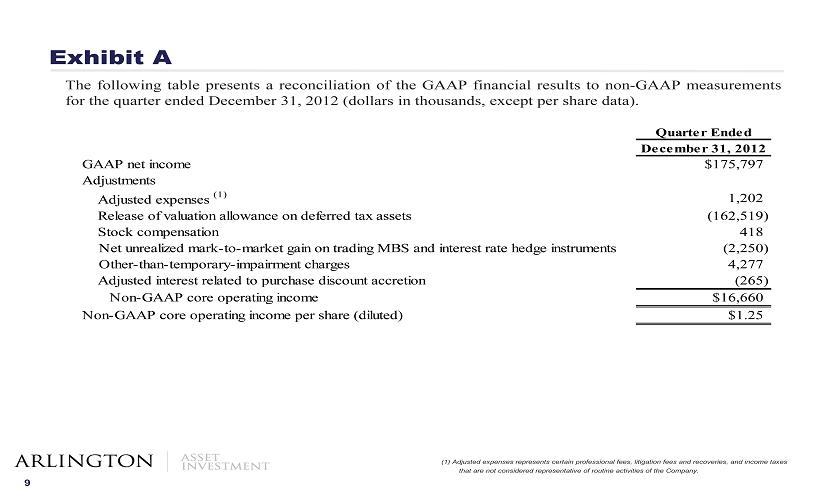
9 Exhibit A The following table presents a reconciliation of the GAAP financial results to non - GAAP measurements for the quarter ended December 31 , 2012 (dollars in thousands, except per share data) . ( 1) Adjusted expenses represents certain professional fees, litigation fees and recoveries, and income taxes that are not considered representative of routine activities of the Company. Quarter Ended December 31, 2012 GAAP net income $175,797 Adjustments Adjusted expenses (1) 1,202 Release of valuation allowance on deferred tax assets (162,519) Stock compensation 418 Net unrealized mark-to-market gain on trading MBS and interest rate hedge instruments (2,250) Other-than-temporary-impairment charges 4,277 Adjusted interest related to purchase discount accretion (265) Non-GAAP core operating income $16,660 Non-GAAP core operating income per share (diluted) $1.25
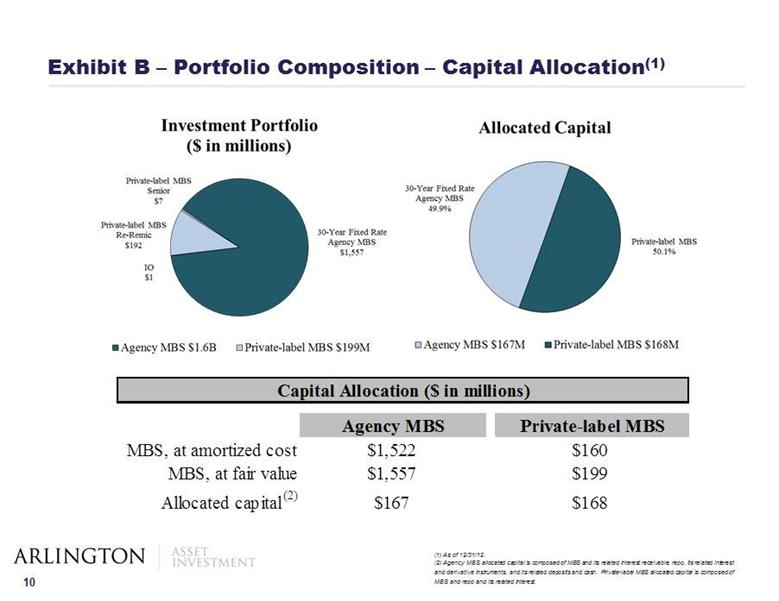
10 Exhibit B – Portfolio Composition – Capital Allocation (1) (1) As of 12/31/12 . (2) Agency MBS allocated capital is composed of MBS and its related interest receivable, repo, its related interest and derivative instruments, and its related deposits and cash. Private - label MBS allocated capital is composed of MBS and repo and its related interest. Agency MBS Private-label MBS MBS, at amortized cost $1,522 $160 MBS, at fair value $1,557 $199 Allocated capital (2) $167 $168 Capital Allocation ($ in millions)