Attached files
| file | filename |
|---|---|
| 8-K - FORM 8-K - ReShape Lifesciences Inc. | d482258d8k.htm |
| EX-99.2 - EX-99.2 - ReShape Lifesciences Inc. | d482258dex992.htm |
 ReCharge
Pivotal Trial Results February 7, 2013
Copyright ©
2013
Exhibit 99.1 |
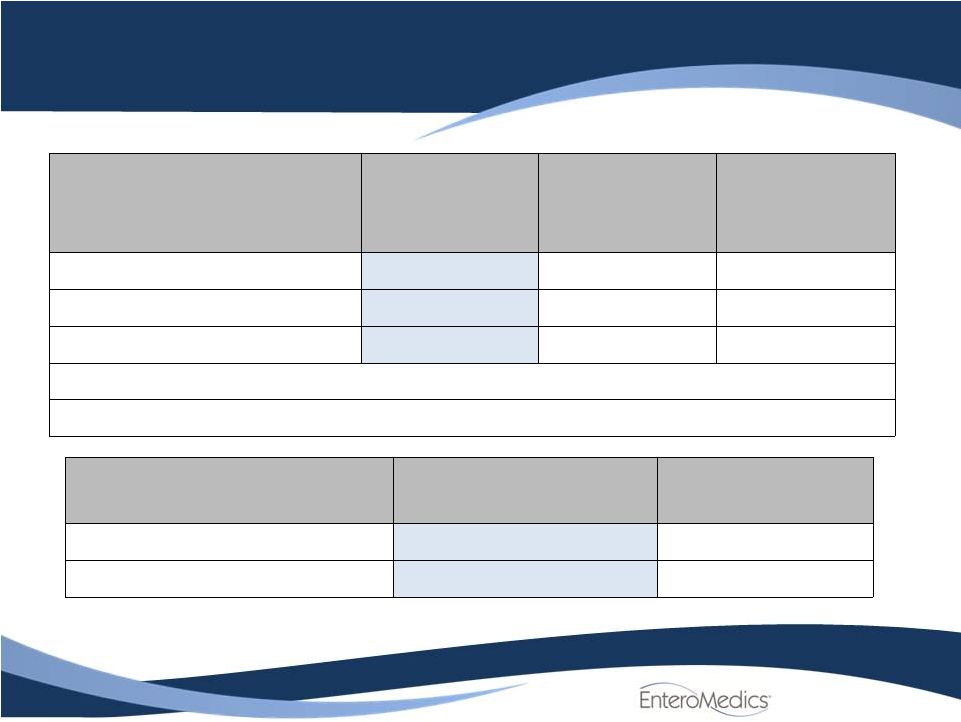
 Study
Design Prospective, double-blind, sham controlled randomized trial in
239 subjects (233 implanted)
Co-Primary Efficacy
Endpoint:
At least 10% difference in %EWL by super-superiority of
treatment over sham control (BMI method at 12
months, post randomization)
Co-Primary Efficacy
endpoint:
55% of subjects achieve at least 20% EWL, 45% of
subjects achieve at least 25% EWL in the treatment
group (BMI method at 12 months, post randomization)
Primary Safety Objective:
Implant/revision procedure, device and therapy-related
serious adverse events (SAE) through 12 months post-
randomization is less than 15% in the treatment group
Mean BMI:
40.9 Kg/m
Mean Age:
47
Gender:
85% female/ 15% male
2
2 |
 Results
Overview
-
ITT
Population
Overall outcome:
Excellent benefit/risk ratio at 12 months
Efficacy –
Percent EWL:
Clinically meaningful, statistically significant
superiority over Sham Control
Efficacy
–
Responder
analysis:
Strongly in favor of VBLOC
Safety:
Primary endpoint met
3 |
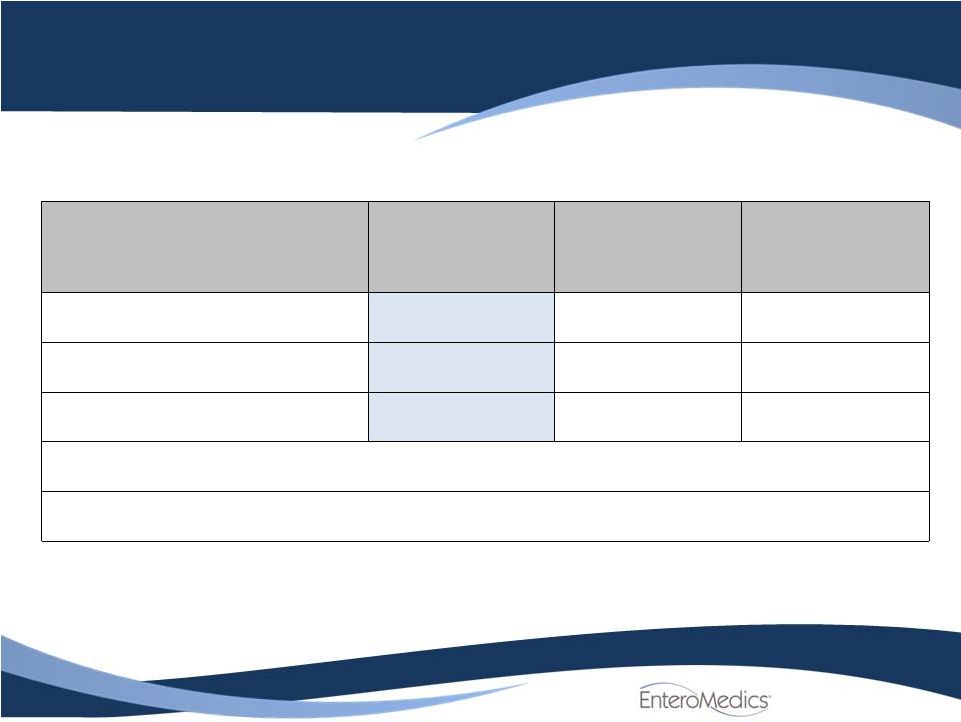 Efficacy
Results: Mean %EWL in ITT Population
Excess Weight Loss (%)
at 12 months (BMI)
Treated
Control
Difference
N
162
77
Mean ±
SD
24.4
±
23.6
15.9
±
17.7
8.5 ±
21.9
[95% CI]
[20.8, 28.1]
[11.9, 19.9]
[3.1, 13.9]
Super-superiority P-value
0.705
Superiority P-value
0.002
4 |
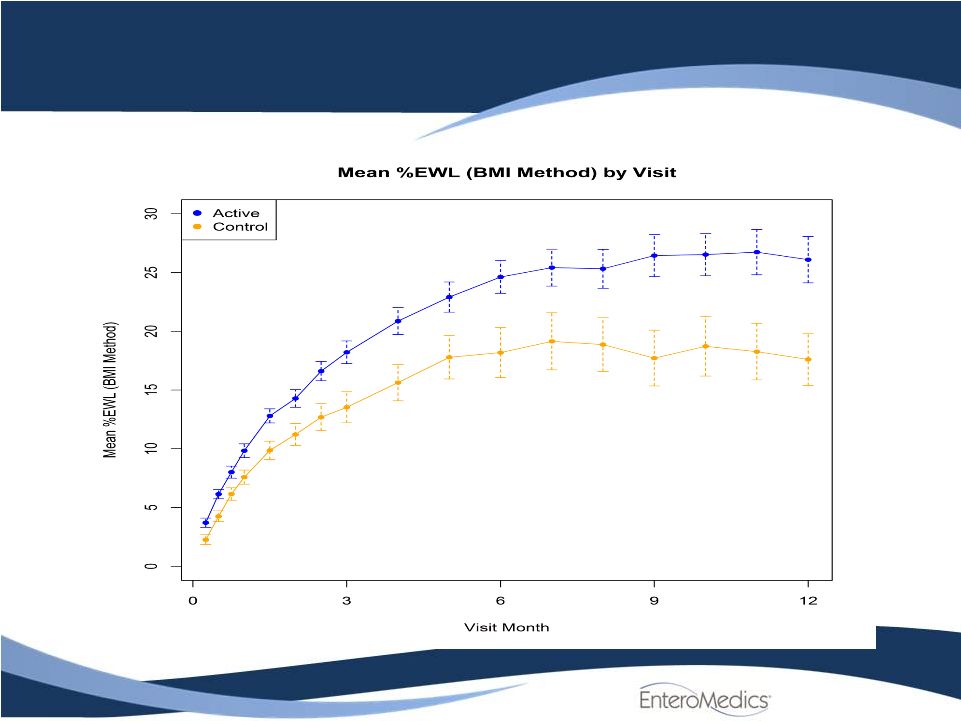 ReCharge Weight
Loss 5 |
 Efficacy
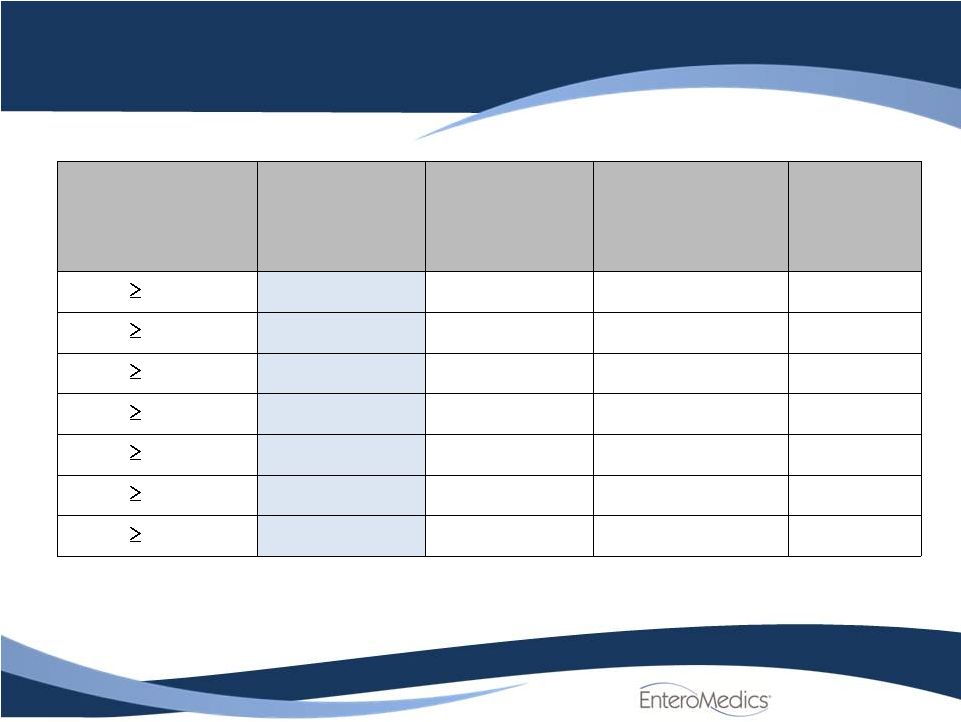
Results: Responder Analysis in ITT Population
6
Percent EWL
achieved
(BMI)
Treated
N=162
Control
N=77
Odds Ratio
p-Value
20%
52.5%
(85)
32.5%
(25)
2.3 (1.3, 4.1)
.004
25%
38.3%
(62)
23.4%
(18)
2.1 (1.1, 3.8)
.02
30%
30.2%
(49)
18.2%
(14)
2.0 (1.0, 3.9)
.047
35%
25.9%
(42)
9.1%
(7)
3.5 (1.5, 8.3)
.004
40%
21.6%
(35)
5.2%
(4)
5.1 (1.7, 14.9)
.003
45%
18.5%
(30)
3.9%
(3)
5.7 (1.7, 19.2)
.005
50%
14.8%
(24)
1.3%
(1)
13.3 (1.8, 100.5)
.01 |
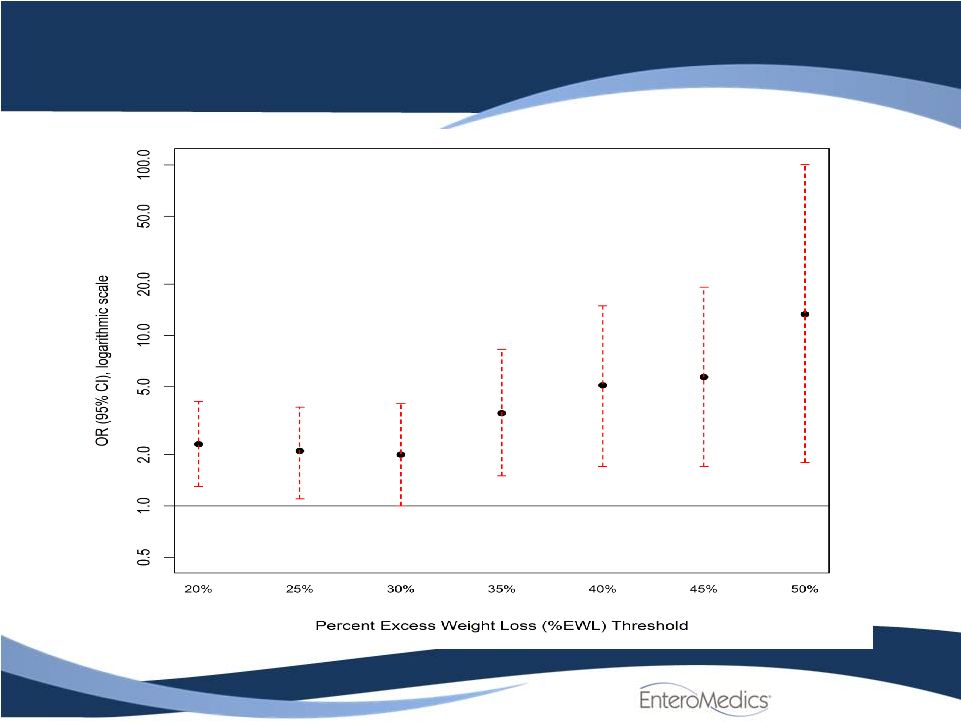 Odds Ratio for
Various Response Rates Treated vs. Sham Control
7 |
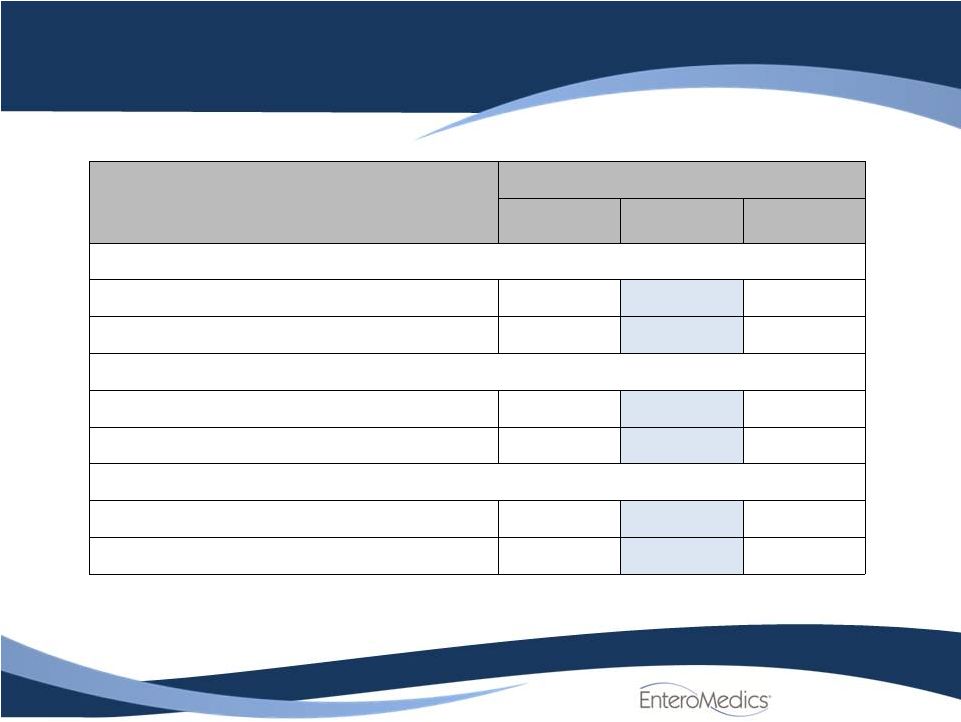
 Per Protocol
Population Efficacy Results
Excess Weight Loss (%)
at 12 months
(BMI )
Treated
Control
Difference
N
146
65
Mean ±
SD
26.3
±
23.8
17.3
±
18.1
8.9 ±
22.2
[95% CI]
[22.4, 30.2]
[12.9, 21.8]
[3.0, 14.8]
P-value (Delta = 10%)
0.640
P-value (Delta = 0%)
0.003
Percent EWL achieved (BMI)
Treated
N=146
Control
N=65
20%
56.8% (83)
35.4%
(23)
25%
41.8% (61)
26.2%
(17)
8 |
 Safety
Results •
No deaths, no unanticipated adverse device effects
•
Implant/revision procedure, device, therapy-related SAEs in
treated subjects (primary safety endpoint): 3.1% vs. 15% pre-
specified limit, CI (1.0, 7.1%); p<0.0001
•
93% of subjects were active in the blinded trial at 12 months
9 |
 Cardiovascular
Safety Measure
Visit Type
Treated
N
Mean
SD
Systolic Blood Pressure (mmHg)
6 months
149
-6.6
12.7
12 months
147
-5.5
14.2
Diastolic Blood Pressure (mmHg)
6 months
149
-3.4
8.9
12 months
147
-2.8
9.6
Heart Rate (bpm)
6 months
149
-4.4
11.9
12 months
147
-3.6
10.3
10 |
 Overview of
Results ReCharge Pivotal Trial
By: Robert D. Gibbons, Ph.D.
11 |
 Conclusions
•
Excellent safety profile met pre-specified target
•
Statistical superiority achieved in favor of treated group based
on percent EWL
•
Statistically significant responder analyses based on pre-
specified (20% and 25%) and “super-response”
(50%) thresholds
•
ITT and per protocol analyses are in agreement
•
Highly clinically meaningful EWL of 24.4%
•
Although the pre-defined “super-superiority”
efficacy endpoint
was not met, the risk/benefit ratio for Maestro RC2 device is
clearly positive and supports FDA PMA submission
12 |
 Thank
you |