Attached files
| file | filename |
|---|---|
| 8-K - 8-K - RENASANT CORP | d479989d8k.htm |
| EX-99.1 - EX-99.1 - RENASANT CORP | d479989dex991.htm |
 Merger of Renasant Corporation
and First M&F Corporation
February 7, 2013
Exhibit 99.2 |
 2
This presentation contains forward-looking statements within the
meaning of the Private Securities Litigation Reform Act of
1995. Congress passed the Private Securities Litigation Act of 1995 in an effort to encourage corporations to
provide
information
about
companies’
anticipated
future
financial
performance.
This
act
provides
a
safe
harbor
for
such
disclosure, which protects the companies from unwarranted
litigation if actual results are different from management
expectations. This release contains forward looking statements
within the meaning of the Private Securities Litigation Reform
Act, and reflects management’s current views and estimates of
future economic circumstances, industry conditions, company
performance, and financial results. These forward looking
statements are subject to a number of factors and uncertainties which
could cause Renasant’s, M&F’s or the combined
company’s actual results and experience to differ from the anticipated results
and expectations expressed in such forward looking statements.
Forward looking statements speak only as of the date they are
made and neither Renasant nor M&F assumes any duty to update
forward looking statements. In addition to factors previously
disclosed in Renasant’s and M&F’s reports filed with the
SEC and those identified elsewhere in presentation, these forward-
looking statements include, but are not limited to, statements about
(i) the expected benefits of the transaction between Renasant
and M&F and between Renasant Bank and Merchants and Farmers Bank,
including future financial and operating results, cost savings,
enhanced revenues and the expected market position of the combined company that may be realized from the
transaction, and (ii) Renasant and M&F’s plans, objectives,
expectations and intentions and other statements contained in this
presentation
that
are
not
historical
facts.
Other
statements
identified
by
words
such
as
“expects,”
“anticipates,”
“intends,”
“plans,”
“believes,”
“seeks,”
“estimates,”
“targets,”
“projects”
or words of similar meaning generally are intended to identify
forward-looking
statements.
These
statements
are
based
upon
the
current
beliefs
and
expectations
of
Renasant’s
and
M&F’s
management and are inherently subject to significant business, economic
and competitive risks and uncertainties, many of which are
beyond their respective control. In addition, these forward-looking statements are subject to assumptions with respect
to future business strategies and decisions that are subject to
change. Actual results may differ materially from those indicated
or implied in the forward-looking statements.
Forward Looking Statement |
 3
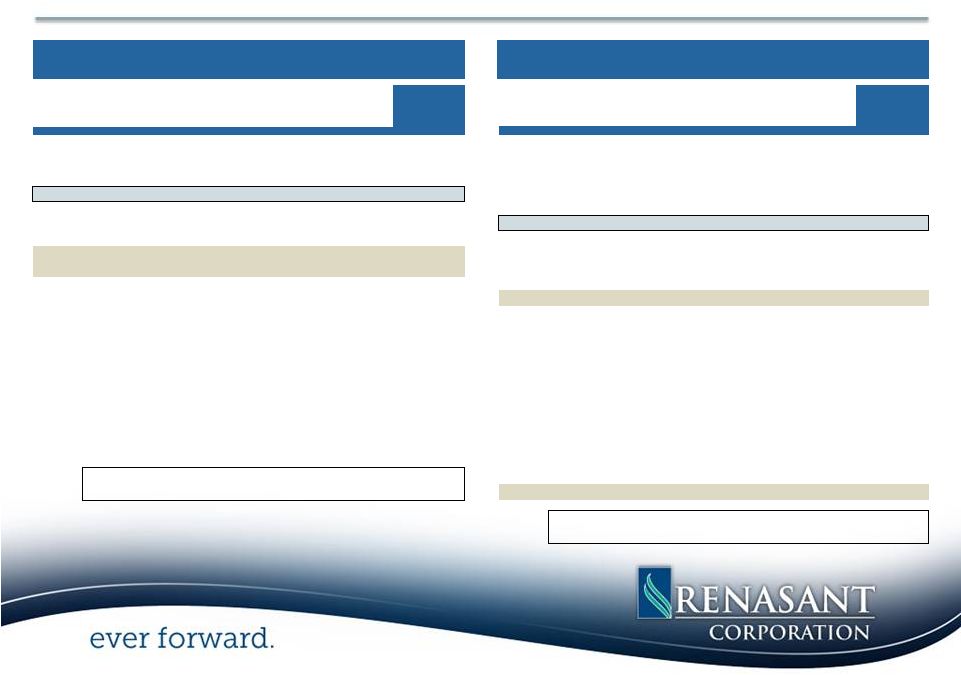
Consideration:
100% stock (tax-free exchange)
Fixed exchange ratio of 0.6425x
Implied Price Per Share:
$12.35
(1)
Aggregate Value:
$118.8
million
(1)(2)
CDCI Preferred Stock and TARP Preferred
Warrant Treatment:
$30.0 million CDCI to be redeemed in full prior to close
TARP warrants to be repurchased at close
Repurchase price to be negotiated with US Treasury
Board Seats:
Two current members from FMFC to be added to RNST’s board
of directors
Ownership:
FMFC pro forma ownership will be approximately 20%
Required Approvals:
Customary regulatory approval, RNST and FMFC shareholder
approval
Expected Closing:
Third quarter 2013
(1)
Based on RNST’s 10 day average closing price as of February 4, 2013
of $19.22 (2)
Does not include consideration to repurchase TARP warrants
Transaction Terms |
 4
Strategically advantageous
•
Acquisition of 120+ year old bank with quality core customer
base –
Combination of two 100+ year old institutions
•
In-market transaction consistent with our acquisition
philosophy •
Creates the 4
th
largest bank by pro forma deposit market share in Mississippi
–
Strengthens position throughout existing footprint and provides
entrance into new markets •
Enhances fee revenue businesses of insurance, mortgage, and wealth
management •
Complementary cultures and strong ties to community
•
Strong, stable deposits and earnings generation complement de novo and
out-of-state market expansion activities
Financially attractive
•
Immediately accretive to EPS, double-digit EPS accretion projected
in 2014 •
Tangible book value earn back in approximately 2.5 years
•
IRR approximately 20%
•
Realization
of
significant
expense
synergies
(25%
of
noninterest
expense)
•
Pro
forma
capital
ratios
above
“well
capitalized”
guidelines
Transaction Rationale |
 5
5
Source: SNL Financial
(1)
(2)
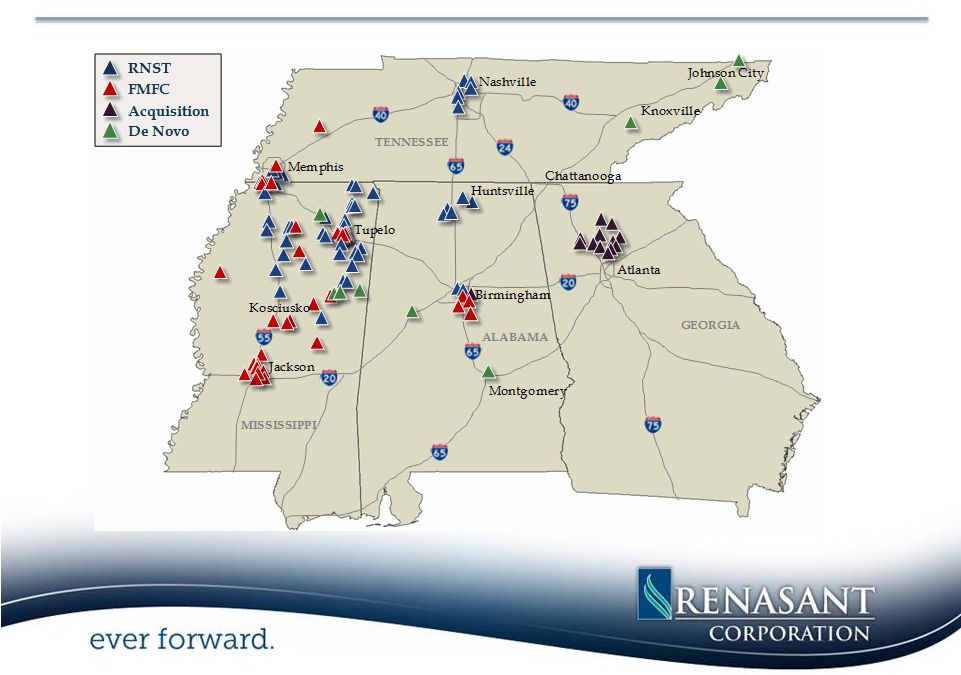
Logical In-Market Transaction
Pro forma figures as of 12/31/2012, excluding purchase accounting
adjustments Pro forma branches as of 1/31/2013
•
Provides further expansion in
current states of operation
–
Mississippi
Jackson MSA
DeSoto County
Oxford
Starkville
–
Alabama
Birmingham MSA
–
Tennessee
Greater Memphis
•
13 of 36 FMFC branches are located
within 1 mile of a RNST branch
Branches
(1)
117
Assets
(2)
$5.8 billion
Gross Loans
(2)
$3.8 billion
Deposits
(2)
$4.9 billion
Pro Forma Highlights
Tupelo
Nashville
Atlanta
Birmingham
Huntsville
Montgomery
Jackson
Memphis
Kosciusko
Chattanooga
Johnson City
Knoxville
GEORGIA
ALABAMA
MISSISSIPPI
TENNESSEE
RNST
FMFC |
 6
Extensive Credit Review
Cumulative Losses and Credit Mark
Credit Due Diligence
Cumulative Losses Since 12/31/07
(1)
:
$118.2mm
Estimated Credit Mark (Loans & OREO)
$62.5mm
Total Estimated Losses Through
Cycle: $180.7mm As % of
12/31/07 Gross Loan Balance (2)
: 14.8%
•
Two tiered review conducted by Renasant’s senior
credit officers and loan review team
•
Individually reviewed 84% of adversely classified
loans by volume, representing all relationships with
a balance greater than $100,000
•
Individually reviewed 100% of relationships with a
balance greater than $500,000
•
Conducted review of underwriting policy and
procedure for smaller balance portfolios
•
Reviewed 100% of OREO properties, including
physical inspection of over 80% of OREO by
volume
(1)
Represents cumulative net charge-offs and OREO expenses through
12/31/12 (2)
12/31/07 gross loans held for investment of $1.2 billion
|
 7
Implied Price Per Share:
$12.35
(1)
Price / Tangible Book Value Per Share:
119%
Price / 2012 EPS:
23.1x
Price / 2013 EPS
(2)
:
15.8x
Core Deposit Premium:
1.5%
(1)
Based on RNST’s 10 day average closing price as of February 4, 2013
of $19.22 and an exchange ratio of 0.6425x (2)
Based on analyst estimate
Transaction Multiples |
 8
Assumptions
•
Credit Mark
•
Gross of Reserves: $54.7mm or 5.4% of
loans
•
Net of Reserves: $37.5mm or 3.7% of loans
•
OREO Mark: 30%
•
Cost Savings: 25%, 40% realized in 2013 and
100% realized thereafter
•
No revenue enhancements assumed
•
Pre-Tax Merger Expenses: $12.0 million
•
100% realized in 2013
•
Core
Deposit
Intangible:
2.0%,
amortized
sum-of-
the-years digits over 10 years
•
Closing: Q3 2013
Attractive Returns
•
Immediately accretive to EPS; double-digit EPS
accretion projected in 2014
•
Tangible book value earn back in less than two and a
half years
•
IRR approximately 20%
Pro Forma Capital Ratios
Pro
“Well RNST
Forma
Capitalized”
TCE/TA
7.7%
6.5% N/A
Tier 1
Leverage 9.9% 8.3% 5.0%
Tier 1
Risk-Based 12.7% 11.0% 6.0%
Total
Risk-Based 14.0% 12.1% 10.0%
(1)
As of December 31, 2012
(2)
Estimated pro forma capital ratios at close, including the redemption of
the CDCI preferred stock (1)
(2)
Financial Impact of the Transaction |
 9
Source: SNL Financial, Company documents
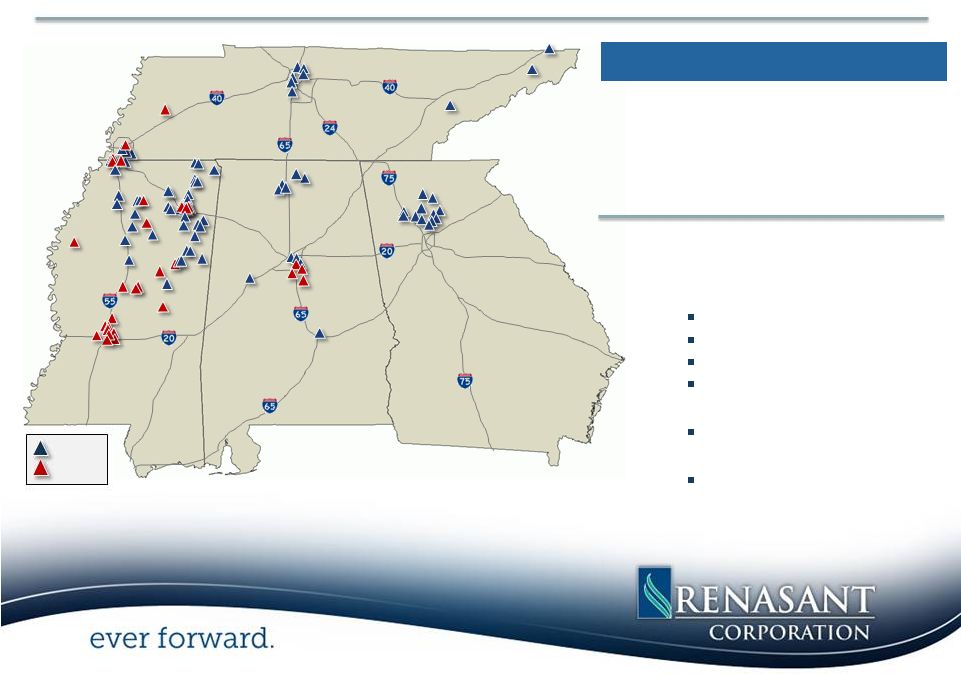
Market Expansion Experience |
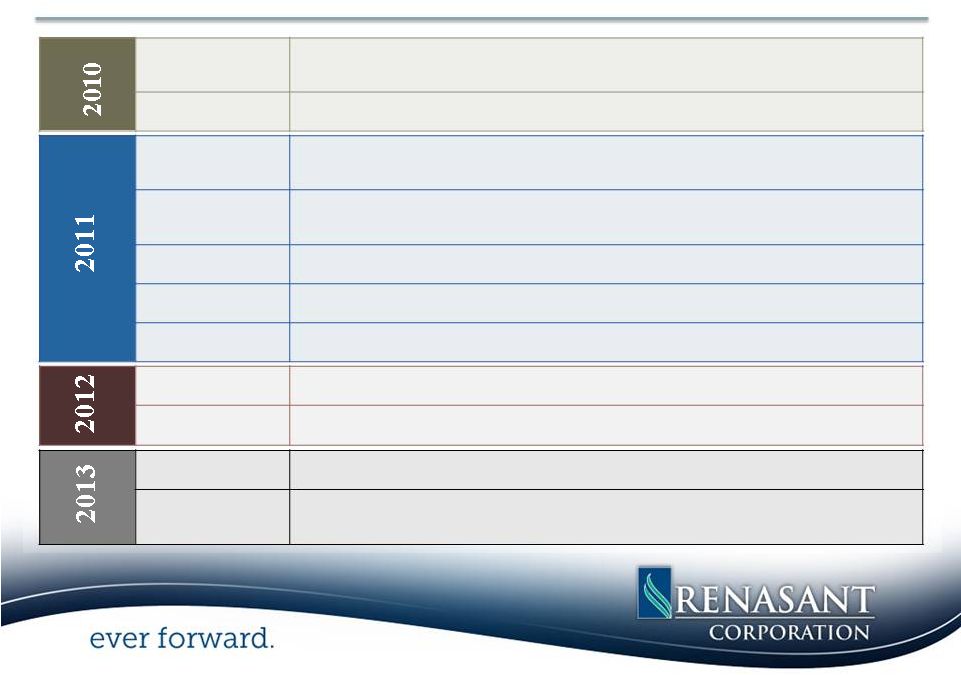 10
Source: SNL Financial, dates are those on which each transaction
was announced
Market Expansion Experience
July 23
FDIC-assisted
transaction:
Crescent Bank and Trust Company headquartered
in Jasper, Georgia; assets ~ $1 billion
September 8
De novo expansion:
Columbus, Mississippi
February 4
FDIC-assisted
transaction:
American Trust Bank headquartered in Roswell,
June 29
Trust acquisition:
RBC
(USA) Trust Unit based in Birmingham, Alabama;
AUM ~ $680 million
July 1
De novo expansion:
Montgomery,
Alabama
July 26
De novo expansion:
Starkville, Mississippi
August
23
De novo expansion:
Tuscaloosa,
Alabama
May 2
De novo expansion
:
Maryville, Tennessee
December 6
De novo expansion
:
Jonesborough, Tennessee
January 17
De novo expansion
:
Bristol, Tennessee
February 7
Whole
Bank transaction:
First M&F Corporation headquartered in Kosciusko,
MS; assets ~$1.6 billion
Georgia; assets ~ $145 million |
 11
Strategically advantageous
•
Acquisition of 120+ year old bank with quality core customer
base •
In-market transaction consistent with our acquisition
philosophy •
Creates the 4
th
largest bank by pro forma deposit market share in Mississippi
•
Enhances fee revenue businesses of insurance, mortgage, and wealth
management •
Complementary cultures and strong ties to community
•
Strong, stable deposits and earnings generation complement de novo and
out-of-state market expansion activities
Financially attractive
•
Immediately accretive to EPS, double-digit EPS accretion projected
in 2014 •
Tangible book value earn back in approximately 2.5 years
•
IRR approximately 20%
•
Realization
of
significant
expense
synergies
(25%
of
noninterest
expense)
•
Pro
forma
capital
ratios
above
“well
capitalized”
guidelines
•
Extensive due diligence process completed
•
Comprehensive review of loan and OREO portfolios
•
Conservative credit mark
Summary Highlights
Low risk opportunity |
 Appendix |
 13
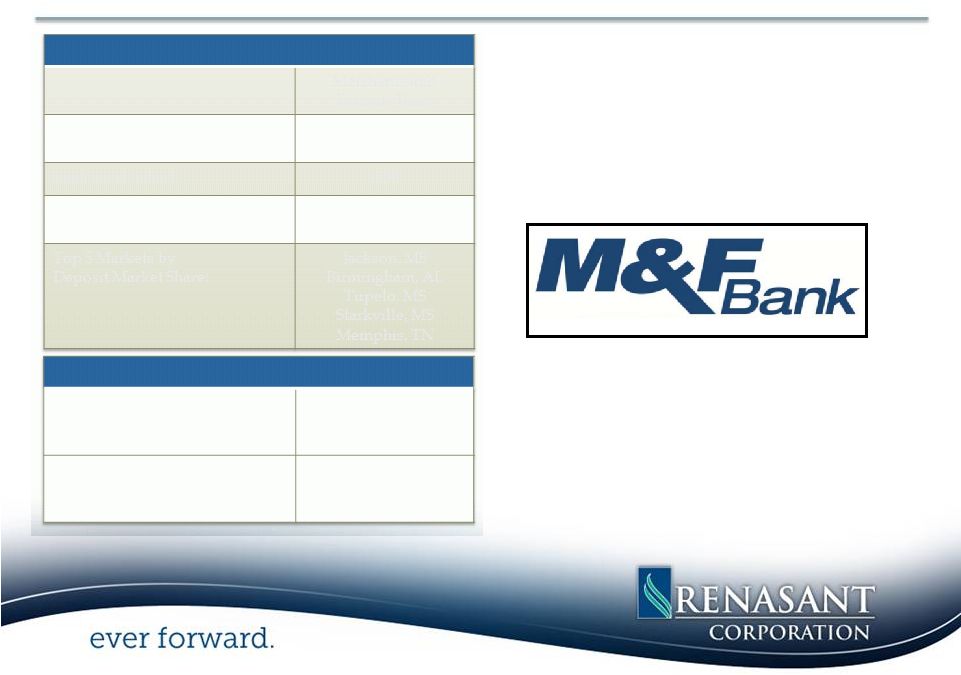
Source: SNL Financial
Bank Subsidiary
Merchants
and
Farmers Bank
Headquarters
Kosciusko,
Mississippi
Bank Established:
1890
Offices
36 branches
9 insurance
offices
Top 5 Markets by
Deposit Market Share:
Jackson, MS
Birmingham, AL
Tupelo,
MS
Starkville, MS
Memphis, TN
Financial
Highlights (Year Ended 12/31/12)
Total Assets:
Gross Loans:
Total Deposits:
$1.6 billion
$1.0 billion
$1.4 billion
NPAs/Assets:
Noninterest Income/Avg. Assets:
Q4’12 Cost of Deposits:
2.15%
1.41%
0.54%
Company Profile
First M&F Corporation Highlights |
 14
(1) In 2009, excludes $34.3 million goodwill impairment charge
(2) Nonperforming loans (NPLs) include loans 90 days past due and
nonaccrual loans. Nonperforming assets (NPAs) include NPLs
and other real estate owned Source: SNL Financial, data as of
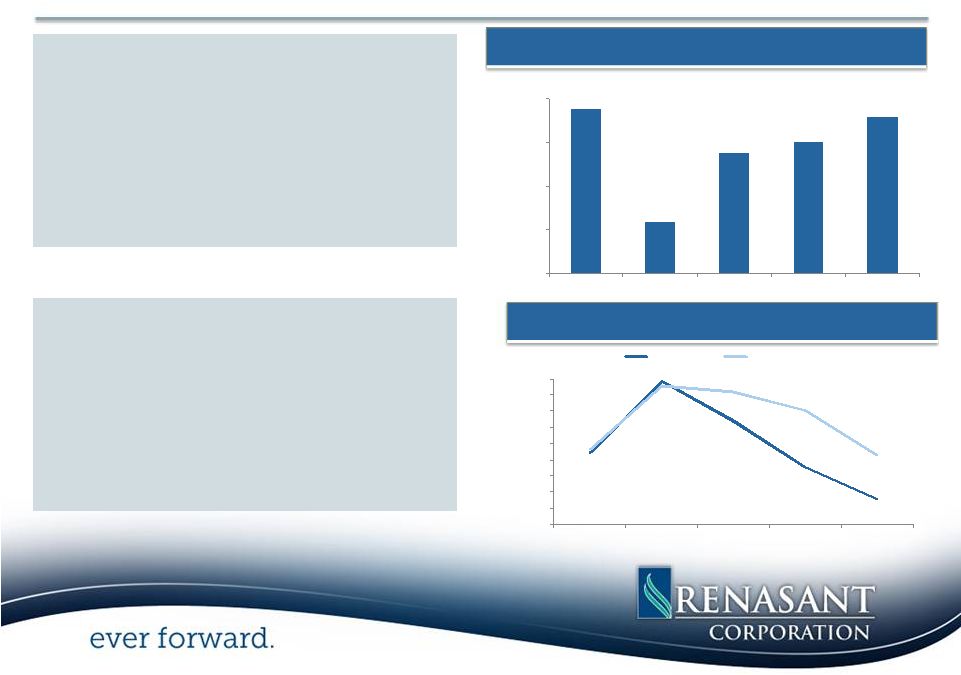
12/31/2012 2.23%
0.80%
2.34%
2.15%
0.00%
0.50%
1.00%
1.50%
2.00%
2.50%
3.00%
3.50%
4.00%
4.50%
2008
2009
2010
2011
2012
NPLs / Loans
NPAs / Assets
•
Increased Profitability
–
Net income available to common
shareholders increased by 90% in 2012
•
Fee Income
–
Mortgage banking revenue of $5.3 million
–
Insurance revenues of $3.5 million
•
Considerable Improvement in Asset Quality
–
Nonperforming Loans/Loans at lowest
level since 2006 (0.80% of gross loans)
–
38% decrease in total nonperforming
assets in 2012 (to 2.15% of total assets)
First M&F Corporation: Recent Improvements
$18.8
$6.0
$13.8
$15.1
$17.9
$0.0
$5.0
$10.0
$15.0
$20.0
2008
2009
2010
2011
2012
Pre-Tax, Pre-Provision Revenue ($mm)
(1)
Credit Quality
(2) |
 42%
50%
22%
6%
12%
16%
3%
4%
22%
24%
0%
20%
40%
60%
80%
100%
2008
2009
2010
2011
2012
15
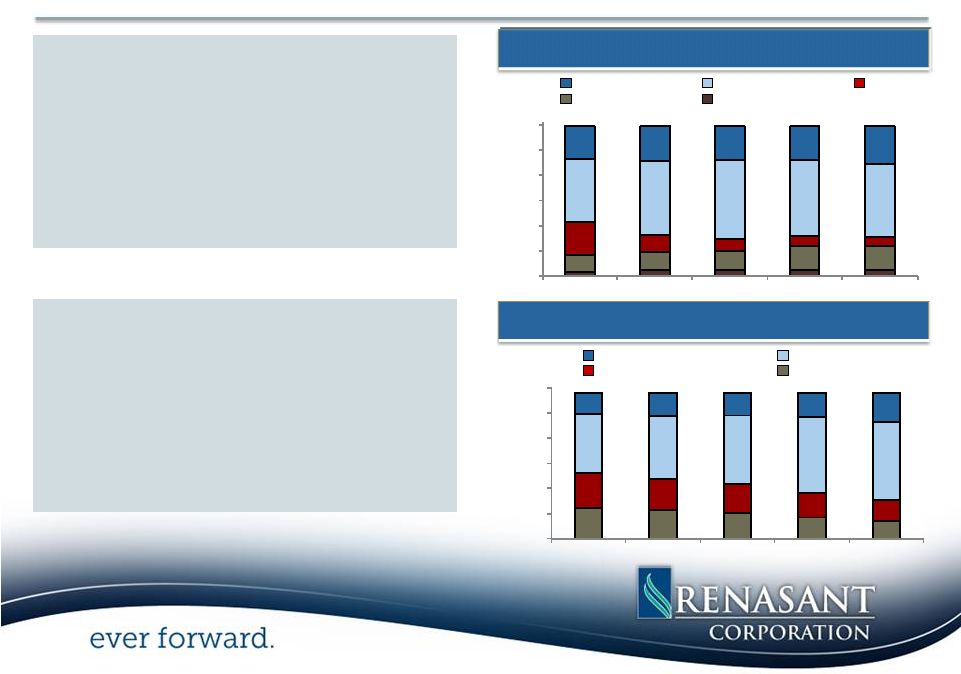
Non-Int. Bearing
Int. Bearing
Trans.
Time < $100K
Time > $100K
RE –
Residential
RE –
Commercial
C&D
C&I
Consumer & Other
•
Significant Remixing of Loan Portfolio
–
C&D loans now represent 6% of the
portfolio, replaced by a greater
concentration of owner occupied CRE and
C&I loans
•
Shift in Deposit Mix
–
Noninterest bearing deposits represent
20% of total deposits
–
Decrease in time deposits to 27% of total
deposits
First M&F Corporation: Recent Improvements
41%
54%
14%
20%
23%
14%
22%
13%
0%
20%
40%
60%
80%
100%
2008
2009
2010
2011
2012
Loan Portfolio
Deposit Mix |
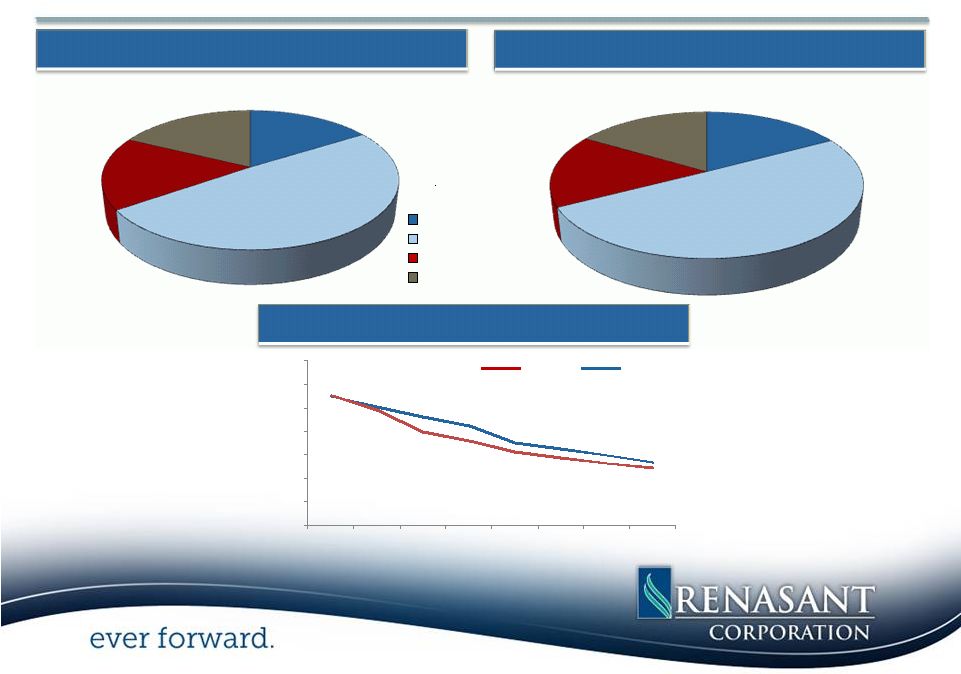 16
Source: SNL Financial, company earnings releases, data as of
12/31/2012 RNST
FMFC
Non-Int. Bearing
Int. Bearing Trans.
Time < $100K
Time > $100K
Pro Forma Deposit Composition
1.10%
1.01%
0.93%
0.85%
0.71%
0.65%
0.60%
0.54%
1.11%
0.99%
0.80%
0.72%
0.63%
0.58%
0.53%
0.49%
0.00%
0.20%
0.40%
0.60%
0.80%
1.00%
1.20%
1.40%
Q1'11
Q2'11
Q3'11
Q4'11
Q1'12
Q2'12
Q3'12
Q4'12
Renasant Corporation (12/31/12)
Pro Forma Company (12/31/12)
Historical Cost of Total Deposits
17%
50%
16%
16%
16%
49%
17%
18% |
   17
Source: SNL Financial
Deposit data as of 6/30/2012
(1)
Represents deposit market share for the state of Mississippi
(2)
Represents deposit market share for counties with RNST presence
17
Total
Market
# of
Deposits
Share
Rank
Institution
Branches
($mm)
(%)
1
Regions Financial Corp.
146
$6,851
14.8
2
Trustmark Corp.
137
6,577
14.2
3
BancorpSouth Inc.
102
5,047
10.9
--
Pro Forma
77
2,830
6.1
4
Hancock Holding Co.
46
2,642
5.7
5
Community Bancshares of MS
37
1,915
4.1
6
BancPlus Corp.
59
1,814
3.9
7
Renasant Corp.
47
1,658
3.6
8
First M&F Corp.
30
1,172
2.5
9
Citizens National Banc Corp.
27
956
2.1
10
BankFirst Capital Corp.
13
626
1.4
11
Wells Fargo & Co.
13
619
1.3
12
Planters Holding Co.
15
616
1.3
13
Citizens Holding Co.
22
593
1.3
14
First Bancshares Inc.
17
536
1.2
15
State Capital Corp.
22
493
1.1
16
Peoples Financial Corp.
17
482
1.0
17
Guaranty Capital Corp.
13
472
1.0
18
First Horizon National Corp.
7
454
1.0
19
PriorityOne Capital Corp.
11
449
1.0
20
Merchants & Marine Bancorp
11
449
1.0
Top 20 Institutions
792
$34,420
74.5
Total Market
1,199
46,221
100.0
Mississippi
1
Alabama
2
Total
Market
# of
Deposits
Share
Rank
Institution
Branches
($mm)
(%)
1
Regions Financial Corp.
118
$14,394
33.2
2
Banco Bilbao Vizcaya Argentaria SA
48
7,320
16.9
3
Wells Fargo & Co.
62
5,087
11.7
4
Synovus Financial Corp.
27
2,645
6.1
5
BB&T Corp.
28
2,603
6.0
--
Pro Forma
14
719
1.7
6
ServisFirst Bancshares Inc.
7
1,853
4.3
7
PNC Financial Services Group Inc.
33
1,556
3.6
8
Cadence Bancorp LLC
26
988
2.3
9
Bryant Bank
12
807
1.9
10
Renasant Corp.
10
568
1.3
11
AloStar Bank of Commerce
1
466
1.1
12
IBERIABANK Corp.
13
452
1.0
13
USAmeriBancorp Inc.
9
433
1.0
14
Charles Investment Group LLC
4
376
0.9
15
Progress Bank and Trust
4
357
0.8
16
BancorpSouth Inc.
11
285
0.7
17
Capstone Bancshares Inc.
3
211
0.5
18
SouthPoint Bank
3
198
0.5
19
Trustmark Corp.
4
175
0.4
20
Oakworth Capital Bank
1
171
0.4
21
River Financial Corp.
2
162
0.4
22
Altrust Financial Services Inc.
9
155
0.4
23
First M&F Corp.
4
152
0.4
Top 20 Institutions
424
$40,944
94.4
Total Market
540
43,388
100.0
Pro Forma Deposit Market Share |
   18
Counties with Top 5 Deposit Market Share
Source: SNL Financial, deposit data as of 6/30/2012
Includes counties with pro forma deposits greater than $100 million
Blue highlight denotes top 5 deposit market share
RNST Market Share Information
FMFC Market Share Information
Pro Forma Market Share Information
Deposits
Market
Deposits
Market
Deposits
Market
County
($mm)
Share
Branches
Rank
($mm)
Share
Branches
Rank
($mm)
Share
Branches
Rank
Lee, MS
$653.2
36.3
13
1
$133.6
7.4
3
4
$786.8
43.7
%
16
1
Morgan, AL
275.9
17.1
3
2
--
--
--
--
275.9
17.1
3
2
Shelby, TN
241.4
1.3
3
14
14.6
0.1
1
21
256.0
1.4
4
13
Davidson, TN
252.1
1.1
4
13
--
--
--
--
252.1
1.1
4
13
Madison, MS
--
--
--
--
250.4
10.6
5
4
250.4
10.6
5
4
Attala, MS
--
--
--
--
191.9
60.0
3
1
191.9
60.0
3
1
Shelby, AL
32.2
1.2
1
17
151.6
5.6
4
5
183.8
6.8
5
5
Cherokee, GA
173.2
7.6
3
6
--
--
--
--
173.2
7.6
3
6
Desoto, MS
84.1
4.2
4
8
64.3
3.2
3
9
148.3
7.4
7
5
Monroe, MS
138.9
23.5
4
2
--
--
--
--
138.9
23.5
4
2
Jefferson, AL
133.7
0.6
2
16
--
--
--
--
133.7
0.6
2
16
Forsyth, GA
126.5
4.8
2
9
--
--
--
--
126.5
4.8
2
9
Rankin, MS
--
--
--
--
121.9
5.4
4
7
121.9
5.4
4
7
Pickens, GA
116.3
15.8
2
3
--
--
--
--
116.3
15.8
2
3
Fulton, GA
112.1
0.2
3
21
--
--
--
--
112.1
0.2
3
21
Pontotoc, MS
106.1
27.8
2
2
--
--
--
--
106.1
27.8
2
2
Bartow, GA
103.5
8.9
2
5
--
--
--
--
103.5
8.9
2
5
Prentiss, MS
102.7
27.6
3
2
--
--
--
--
102.7
27.6
3
2
Lafayette, MS
25.0
2.9
2
8
76.2
8.9
2
5
101.2
11.8
4
4
Counties with top 5 market share
7
5
12
Deposit Market Share by County |
 Additional Information
19
Renasant and M&F will be filing a joint proxy statement/prospectus,
and other relevant documents concerning the merger
with the Securities and Exchange
Commission (the “SEC”). This presentation does not constitute an offer to sell or the
solicitation
of
an
offer
to
buy
any
securities
or
a
solicitation
of
any
vote
or
approval.
INVESTORS
ARE
URGED
TO
READ
THE JOINT PROXY STATEMENT/PROSPECTUS AND ANY OTHER DOCUMENTS TO BE
FILED WITH THE SEC IN CONNECTION WITH THE MERGER OR INCORPORATED
BY REFERENCE IN THE JOINT PROXY STATEMENT/PROSPECTUS BECAUSE
THEY WILL CONTAIN IMPORTANT INFORMATION ABOUT RENASANT, M&F
AND THE PROPOSED MERGER. When available, the joint proxy statement/prospectus will be mailed to shareholders
of
both
Renasant
and
M&F.
Investors
will
also
be
able
to
obtain
copies
of
the
joint
proxy
statement/prospectus
and
other
relevant documents (when they become available) free of charge at the
SEC’s Web site (www.sec.gov). In addition, documents
filed with the SEC by Renasant will be available free of charge from
Mitchell Waycaster, Director of Investor Relations, Renasant
Corporation, 209 Troy Street, Tupelo, Mississippi 38804-4827, telephone: (662) 680-1215. Documents filed with the
SEC by M&F will be available free of charge from M&F by
contacting John G. Copeland, Chief Financial Officer, First M&F
Corporation, 134 West Washington Street, Kosciusko, Mississippi 39090,
telephone: (662) 289-8594.
Renasant,
M&F
and
certain
of
their
directors,
executive
officers
and
other
members
of
management
and
employees may be deemed to be participants in the solicitation of
proxies from the shareholders of Renasant and M&F in
connection with the proposed merger. Information about the
directors and executive officers of Renasant is included in the
proxy statement for its 2012 annual meeting of shareholders, which was
filed with the SEC on March 8, 2012. Information
about
the
directors
and
executive
officers
of
M&F
is
included
in
the
proxy
statement
for
its
2012
annual
meeting
of
shareholders, which was filed with the SEC on March 14, 2012.
Additional information regarding the interests of such
participants
and
other
persons
who
may
be
deemed
participants
in
the
transaction
will
be
included
in
the
joint
proxy
statement/prospectus
and
the
other
relevant
documents
filed
with
the
SEC
when
they
become
available. |
 Investor Inquiries
20
E. Robinson McGraw
Chairman
President and Chief Executive Officer
Kevin D. Chapman
Senior Executive Vice President and
Chief Financial Officer
209
TROY
STREET
TUPELO,
MS
38804-4827
PHONE:
1-800-680-1601
FACSIMILE: 1-662-680-1234
WWW.RENASANT.COM
WWW.RENASANTBANK.COM |