Attached files
| file | filename |
|---|---|
| EX-99.1 - EX-99.1 - Matson, Inc. | a13-4669_1ex99d1.htm |
| 8-K - 8-K - Matson, Inc. | a13-4669_18k.htm |
Exhibit 99.2
|
|
Fourth Quarter 2012 Earnings Conference Call - February 7, 2013 |
|
|
Forward Looking Statements Statements made during this call and presentation that set forth expectations, predictions, projections or are about future events are based on facts and situations that are known to us as of today, February 7, 2013. We believe that our expectations and assumptions are reasonable. Actual results may differ materially, due to risks and uncertainties, such as those described on pages 19-29 of the 2011 Form 10-K filed by Alexander & Baldwin, Inc. on February 28, 2012, and other subsequent filings by Matson with the SEC. Statements made during this call and presentation are not guarantees of future performance. We do not undertake any obligation to update our forward-looking statements. |
|
|
Solid results in Ocean Transportation during the quarter Strong volume in Guam and rate gain in China Acquired primary assets of Reef Shipping in early January $9.5 million debt pay down in 4Q12, $53.7 million since Separation One-time charges in NorCal warehouse operations in 4Q12 Opening Remarks |
|
|
EBITDA, EPS – 4Q 2012 4Q12 Net Income of $15.6 million versus 4Q11 Net Income of $1.6 million See the Addendum for a reconciliation of GAAP to non-GAAP for Financial Metrics 4Q EBITDA ($millions) $30.4 $40.3 $0.0 $10.0 $20.0 $30.0 $40.0 $50.0 4Q11 4Q12 4Q EPS from Continuing Operations, Fully Diluted $0.16 $0.36 $0.00 $0.10 $0.20 $0.30 $0.40 $0.50 4Q11 4Q12 4Q EPS, Fully Diluted $0.04 $0.36 $0.00 $0.10 $0.20 $0.30 $0.40 $0.50 4Q11 4Q12 |
|
|
EBITDA, EPS and ROIC – FY 2012 See the Addendum for a reconciliation of GAAP to non-GAAP for Financial Metrics FY12 Net Income of $45.9 million versus FY11 Net Income of $34.2 million FY EBITDA ($millions) $150.2 $168.8 $50.0 $100.0 $150.0 $200.0 $250.0 FY11 FY12 FY ROIC (%) 9.9% 0.0% 4.0% 8.0% 12.0% 16.0% FY12 FY EPS from Continuing Operations, Fully Diluted $1.09 $1.22 $0.00 $0.40 $0.80 $1.20 $1.60 FY11 FY12 |
|
|
Hawaii Service Fourth Quarter Performance Slight uptick in volume YOY Lower vessel operating costs as fleet returned to 9-ship deployment Barge dry-docking led to higher outside transportation costs Outlook for 2013 Modest volume gains Core 9-ship deployment expected for most of year due to lighter dry-dock schedule Second Pasha vessel not expected to enter market until 2014 Container Volume 25,000 30,000 35,000 40,000 1Q11 2Q11 3Q11 4Q11 1Q12 2Q12 3Q12 4Q12 Auto Volume 10,000 15,000 20,000 25,000 1Q11 2Q11 3Q11 4Q11 1Q12 2Q12 3Q12 4Q12 |
|
|
Hawaii Economic Indicators 8.6 9.3 7.7 0.6 (2.0) (8.1) Construction Jobs 2 9.3 5.0 2.7 2.5 2014F 4.2 4.6 2.6 2.5 2015F 3.9 9.4 4.0 7.7 Visitor Arrivals 1 Indicator (% Change YOY, except Unemployment rate) 2010 2011 2012F 2013F Real Gross Domestic Product 1 1.4 (0.2) 1.6 2.4 Unemployment Rate 2 6.9 6.7 6.3 5.6 Building Permits 2 9.7 (26.2) 48.4 11.0 Sources 1 DBEDT: Hawaii Department of Business, Economic Development & Tourism, Fourth Quarter 2012 Report, November 8, 2012 http://hawaii.gov/dbedt 2 UHERO: University of Hawaii Economic Research Organization, State Forecast Update, November 2, 2012 http://www.uhero.hawaii.edu |

|
|
SSAT Joint Venture Outlook for 2013 Customer loss will negatively impact joint venture contributions Aggressive expense control initiatives Breakeven performance expected Fourth Quarter Performance Customer losses continue to weigh on performance Overall market has contracted slightly Equity in Income from Joint Venture (in millions) $5.2 $6.2 $12.8 $8.6 $3.2 0 3 6 9 12 15 2008 2009 2010 2011 2012 |
|
|
Guam Service Outlook for 2013 Muted economic activity Volume similar to 2012, assuming no new competitor enters market Military redeployment pushed out to 2015, at earliest Fourth Quarter Performance Container volume up significantly YOY reflecting competitor exit in 4Q2011 Overall market has contracted slightly Container Volume 0 2,000 4,000 6,000 8,000 1Q11 2Q11 3Q11 4Q11 1Q12 2Q12 3Q12 4Q12 |
|
|
Matson South Pacific Acquisition Acquired primary assets of Reef Shipping for $9.6 million Reef in business since 1968 Four small container ships Approximately 1,300 containers Included two market-rate charters (2/5 year terms) Expansion into strategically attractive adjacent Pacific regions New platform creates opportunities to link with Guam/China/Hawaii Will be included in Ocean Transportation segment for reporting purposes North & West of Fiji Tahiti & Cook Islands Fiji, Samoas, Tonga Guam/Micronesia |

|
|
China Expedited Service (CLX) Fourth Quarter Performance YOY spot freight rates up significantly Benefits approximately 50% of volume Container volume down 11.4% in 4Q12 Delayed sailing slipped into 2013 Ships running near full capacity Outlook for 2013 Record global capacity added Average annual freight rates expected to erode modestly Expect flat container volume YOY Container Volume 0 5,000 10,000 15,000 20,000 1Q11 2Q11 3Q11 4Q11 1Q12 2Q12 3Q12 4Q12 Average Shanghai Containerized Freight Index by Quarter (Spot Rates) $1,478 $1,813 $2,429 $2,561 $2,273 0 500 1,000 1,500 2,000 2,500 3,000 4Q11 1Q12 2Q12 3Q12 4Q12 |
|
|
Matson Logistics Fourth Quarter Performance Improvement in domestic intermodal and highway margins Lower G&A $3.9 million one-time charges in NorCal warehousing Outlook for 2013 Expense control focus Improve margins to 1-2% of revenues Operational improvement in NorCal warehousing YOY Growth in AAR Total Intermodal Volume (2011-2012) 0.0% 2.0% 4.0% 6.0% 8.0% 10.0% 1Q11 2Q11 3Q11 4Q11 1Q12 2Q12 3Q12 4Q12 |
|
|
Consolidated Operating Income $23.9 ($2.8) $26.7 4Q12 ($2.1) ($0.7) Logistics $12.1 $11.8 TOTAL Change 4Q11 $14.2 Ocean Transportation $12.5 $96.7 $0.1 $96.6 FY12 ($4.8) $4.9 Logistics $18.1 $78.6 TOTAL Change FY11 $22.9 Ocean Transportation $73.7 4Q 2012 Operating Income ($millions) $11.8 $23.9 $0 $10 $20 $30 $40 4Q11 4Q12 FY 2012 Operating Income ($millions) $78.6 $96.7 $20 $40 $60 $80 $100 $120 FY11 FY12 |
|
|
Ocean Transportation SSAT contributed $0.1 million in 4Q12 and $3.2 million in FY 2012 8.8% $26.7 $303.7 4Q12 $14.2 $12.5 Operating Income 4.4% Oper. Income Margin Change 4Q11 $21.6 Revenue $282.1 8.1% $96.6 $1,189.8 FY12 $22.9 $73.7 Operating Income 6.8% Oper. Income Margin Change FY11 $113.6 Revenue $1,076.2 4Q 2012 Operating Income ($millions) $12.5 $26.7 $0 $10 $20 $30 $40 4Q11 4Q12 FY 2012 Operating Income ($millions) $73.7 $96.6 $20 $40 $60 $80 $100 $120 FY11 FY12 |
|
|
Matson Logistics (3.0%) ($2.8) $94.6 4Q12 ($2.1) ($0.7) Operating Income (0.8%) Oper. Income Margin Change 4Q11 $1.8 Revenue $92.8 0.0% $0.1 $370.2 FY12 ($4.8) $4.9 Operating Income 1.3% Oper. Income Margin Change FY11 ($16.2) Revenue $386.4 4Q 2012 Operating Income ($millions) ($0.7) ($2.8) -$4 -$2 $0 $2 $4 4Q11 4Q12 FY 2012 Operating Income ($millions) $4.9 $0.1 $0 $2 $4 $6 FY11 FY12 |
|
|
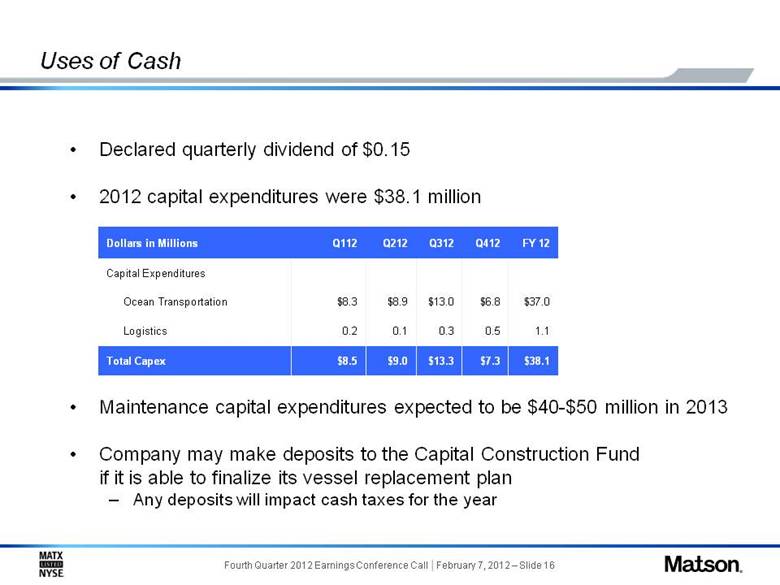
Declared quarterly dividend of $0.15 2012 capital expenditures were $38.1 million Maintenance capital expenditures expected to be $40-$50 million in 2013 Company may make deposits to the Capital Construction Fund if it is able to finalize its vessel replacement plan Any deposits will impact cash taxes for the year Uses of Cash $38.1 1.1 $37.0 FY 12 $13.3 0.3 $13.0 Q312 $9.0 0.1 $8.9 Q212 0.5 0.2 Logistics $7.3 $8.5 Total Capex $6.8 Q412 Dollars in Millions Q112 Capital Expenditures Ocean Transportation $8.3 |
|
|
Condensed Balance Sheet 35.5 19.9 Cash Assets (dollars in millions) 12/31/12 6/30/12 Other total current assets 214.2 201.3 Investment in terminal joint venture 59.6 58.7 Property, net 762.5 783.0 Other assets 118.1 111.0 Total $1,174.3 $1,189.5 28.4 16.4 Current portion of long-term debt 179.3 177.0 Other current liabilities 33.0 38.4 Other liabilities 252.0 251.9 Deferred income taxes Liabilities & Shareholders’ Equity 12/31/12 6/30/12 Total current liabilities 193.4 207.7 Long term debt 302.7 344.4 Employee benefit plans 108.0 105.1 Total long term liabilities 701.0 734.5 Shareholders’ equity 279.9 247.3 Total $1,174.3 $1,189.5 Debt Total debt of $319.1 million Current portion is $16.4 million Net Debt/EBITDA ratio of 1.77 Paid down total debt by $53.7 million since Separation See the Addendum for a reconciliation of GAAP to non-GAAP for Financial Metrics |

|
|
Ocean Transportation operating income for 2013 expected to be modestly higher than 2012, impacted by: Modest uptick in Hawaii volume 9-ship fleet deployment due to lighter dry-dock schedule Flat Guam volume Modest erosion in China rates Break-even performance at SSAT Logistics operating profit expected to turn positively in 2013, impacted by: Continued expense control Improved NorCal warehouse operations after consolidation 53’ program, improve internal sales 1Q13 operating income outlook Approximate doubling in Ocean Transportation off $5.7 million 1Q12 base Breakeven in logistics, similar to 1Q12 base 2013 Outlook |
|
|
Summary Remarks Historic year for Matson – Separation, 130th year in service Financial results for the quarter solid, FY results satisfactory Ocean transportation margin improvement expected to continue Taken necessary steps at Logistics to rationalize operations, especially in NorCal warehousing Strong cash flow generation allows continued debt pay down Reef acquisition provides small, but important, growth platform |
|
|
Addendum |
|
|
Use of Non-GAAP Measures Matson reports financial results in accordance with U.S. generally accepted accounting principles (“GAAP”). The Company also considers other non-GAAP measures to evaluate performance, make day-to-day operating decisions, help investors understand our ability to incur and service debt and to make capital expenditures, and to understand period-over-period operating results separate and apart from items that may, or could, have a disproportional positive or negative impact on results in any particular period. These non-GAAP measures include, but are not limited to EBITDA and Return on Invested Capital (“ROIC”). The Company defines EBITDA as the sum of net income, less income or loss from discontinued operations, plus income tax expense, interest expense and depreciation and amortization. EBITDA should not be considered as an alternative to net income (as determined in accordance with GAAP), as an indicator of our operating performance, or to cash flows from operating activities (as determined in accordance with GAAP) as a measure of liquidity. Our calculation of EBITDA may not be comparable to EBITDA as calculated by other companies, nor is this calculation identical to the EBITDA used by our lenders to determine financial covenant compliance. For purposes of external reporting, the Company defines ROIC as Net Income less Income or Loss from Discontinued Operations plus tax effected Interest Expense divided by Total Debt plus Shareholder Equity. Our calculation of ROIC may not be comparable to ROIC as calculated by other companies. |

|
|
GAAP to Non-GAAP Reconciliation (Net Debt and EBITDA) 18.6 150.2 168.8 9.9 30.4 40.3 EBITDA 5.5 (11.6) (6.1) 5.0 (5.1) (0.1) Subtract: Loss from discontinued operations 7.9 25.1 33.0 1.3 3.1 4.4 Add: Income tax expense 11.7 34.2 45.9 14.0 1.6 15.6 Net Income 72.1 11.7 2012 Full Year 71.6 7.7 2011 0.5 4.0 Change Fourth Quarter Dollars in Millions 16.4 3.8 2012 18.6 2.0 2011 (2.2) 1.8 Change Add: Interest expense Add: Depreciation & amortization $319.1 Total Debt $299.2 Net Debt (19.9) (Less) Total Cash As of December 31, 2012 (in $ millions) |

|
|
GAAP to Non-GAAP Reconciliation (ROIC) 7.2 Add: Interest expense (tax effected)1 (6.1) Subtract: Loss from discontinued operations 279.9 Shareholder Equity 59.2 Total Return 9.9% ROIC (Total Return/Total Invested Capital) 45.9 Net Income 599.0 319.1 2012 Dollars in Millions, unless otherwise noted Total Debt Total Invested Capital21 The effective tax rate for 2012 is 38.82% 2 Total Debt and Shareholder Equity as of December 31, 2012 |