Attached files
| file | filename |
|---|---|
| 8-K - FORM 8-K - IDEX CORP /DE/ | d482077d8k.htm |
| EX-99.2 - TRANSCRIPT OF IDEX CORPORATIONS EARNINGS CONFERENCE CALL - IDEX CORP /DE/ | d482077dex992.htm |
 Fourth Quarter 2012 Earnings Release
February 5, 2013
Exhibit 99.1 |
 Agenda
2
•
IDEX Outlook
•
2012 Financial Performance
•
2012 Segment Performance
Fluid & Metering
Health & Science
Fire & Safety / Diversified
•
2013 Guidance
•
Q&A |
 IDEX Proprietary & Confidential
Replay Information
Dial toll–free: 855.859.2056
International: 404.537.3406
Conference ID: #86510532
Log on to: www.idexcorp.com
3 |
 IDEX Proprietary & Confidential
Cautionary Statement Under the Private Securities
Litigation Reform Act
This presentation and discussion will include forward-looking statements.
Our actual performance may differ materially from that indicated
or suggested
by any such statements. There are a number of factors that could cause those
differences, including those presented in our most recent annual
report and
other company filings with the SEC.
4 |
 IDEX Proprietary & Confidential
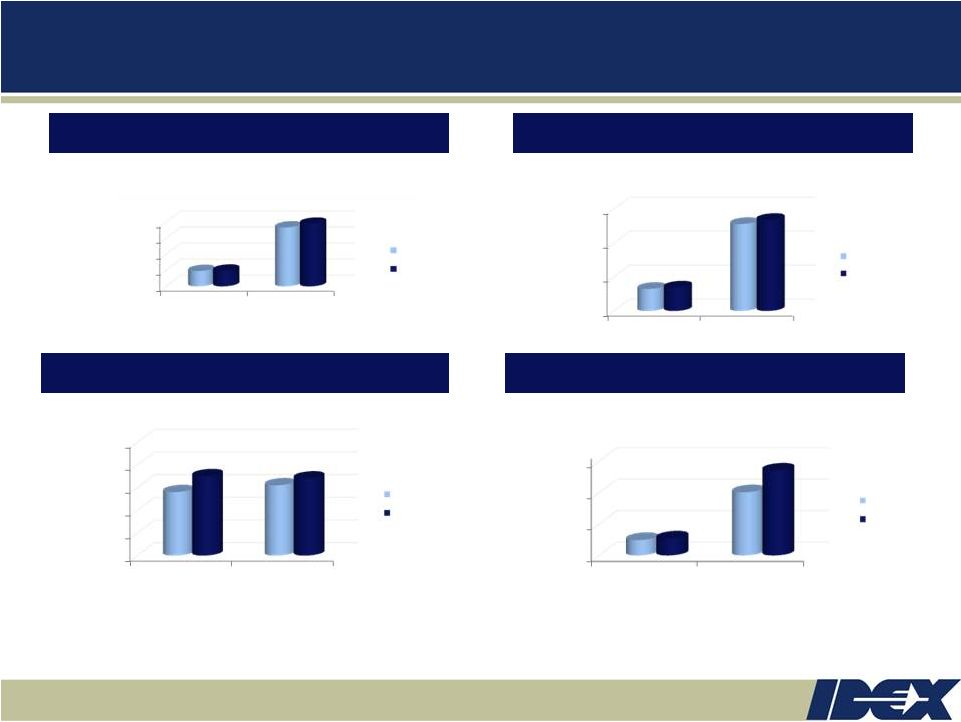
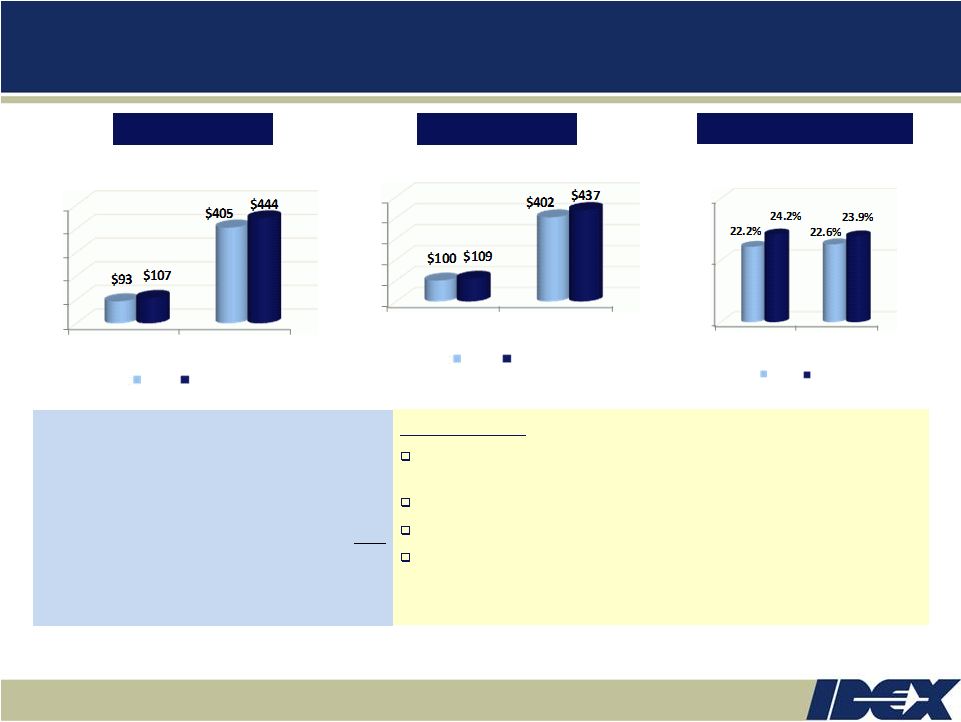
Total Revenue
Operating Margin*
Free Cash Flow**
EPS*
IDEX 2012 Financial Performance
Continued growth, margin expansion and strong cash flow in a volatile
market 5
* 2012 EPS / Op Margin data adjusted for impairment charge ($198M for Q4 and YTD) and
restructuring expenses ($18M in Q4 and $32M YTD) while 2011 EPS / Op Margin data
adjusted for restructuring expenses ($9M in Q4 and $12M YTD) and CVI inventory step-up expense ($16M YTD)
** 2011 Q4 and YTD Free Cash Flow adjusted for the forward starting interest rate swap
settlement ($39M) Org: 3%
30 bps expansion
30% growth
Org: Flat
5% growth
6% growth
70 bps expansion
8% growth
$0
$500
$1,000
$1,500
$2,000
Q4
Year
$481
$1,838
$491
$1,954
2011
2012
$0.00
$1.00
$2.00
$3.00
Q4
Year
$0.65
$2.56
$0.69
$2.68
2011
2012
$25
$125
$225
$325
Q4
Year
$74
$226
$79
$295
2011
2012
15%
16%
17%
18%
19%
20%
Q4
Year
17.8%
18.1%
18.5%
18.4%
2011
2012 |
 IDEX Proprietary & Confidential
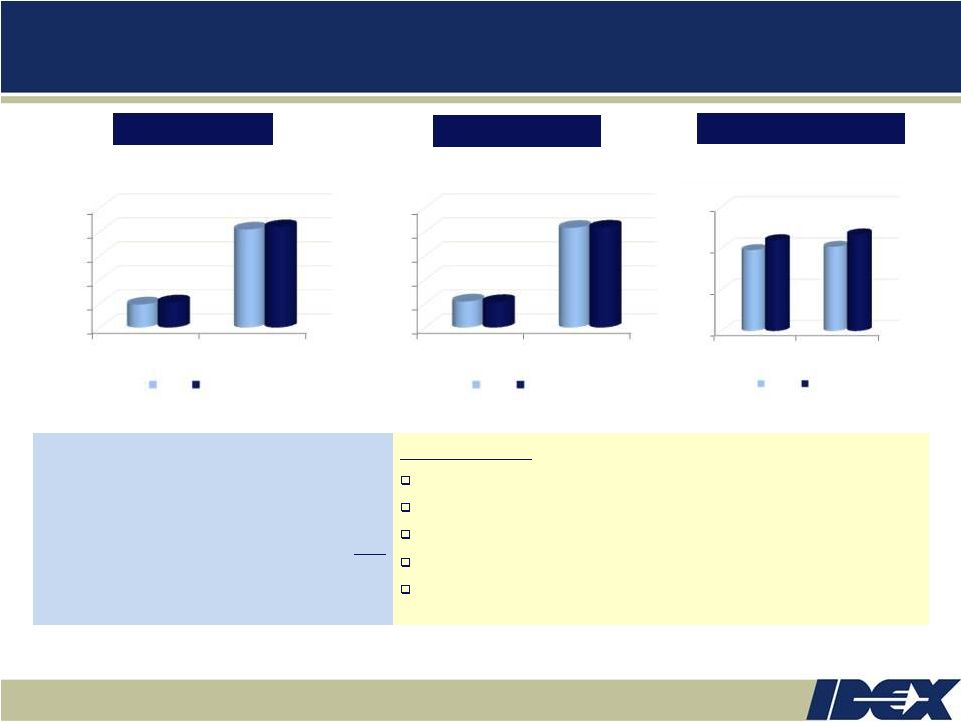
Fluid & Metering
Productivity and strong execution generated margin expansion of 150 bps
in 2012 6
Q4 Sales Mix:
Organic
-1%
Acquisition
0%
Fx
-1%
Total
-2%
Q4
Summary:
Energy and Ag markets remain robust
Chemical project activity has rebounded
Municipal water services remain soft
Excellent operational execution and productivity
Improved general market environment
Total Orders
Total Revenue
Operating Margin*
Org: 2% growth
150 bps expansion
Org: 4% growth
* Op Margin data adjusted for impairment charge (2012) and restructuring expense (2012 and
2011) Org: 10% growth
Org: 1% decline
120 bps expansion
$0
$200
$400
$600
$800
$1,000
Q4
Year
$192
$817
$209
$836
2011
2012
$0
$200
$400
$600
$800
$1,000
Q4
Year
$217
$831
$212
$833
2011
2012
10%
15%
20%
25%
Q4
Year
19.8%
20.2%
21.0%
21.7%
2011
2012 |
 IDEX Proprietary & Confidential
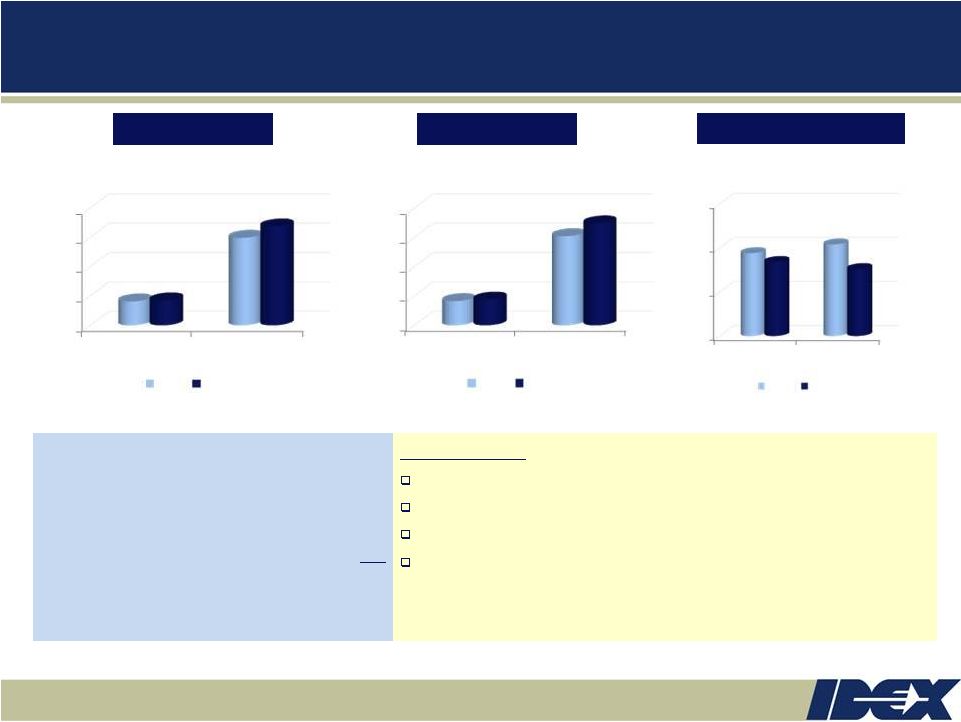
Health & Science
Q4 Operating Margins of 18.4% up 110 bps sequentially
7
Q4 Sales Mix:
Organic
-3%
Acquisition
+9%
Fx
0%
Total
+6%
Q4
Summary:
Scientific Fluidics experienced sequential growth and favorable
outlook in Asia
Synergies being realized between Matcon and the remainder of MPT
Optics & Photonics long term prospects remain solid
Industrial-exposed businesses off to a good start in January 2013
* Op Margin data adjusted for impairment charge (2012), restructuring
expense (2012 and 2011) and CVI inventory step-up expense (2011)
Total Orders
Total Revenue
Operating Margin*
Org: 1% decline
280 bps contraction
Org: 2% decline
Org: 4% decline
Org: 3% decline
100 bps contraction
$0
$200
$400
$600
$800
Q4
Year
$163
$597
$170
$674
2011
2012
$0
$200
$400
$600
$800
Q4
Year
$165
$608
$175
$695
2011
2012
10%
15%
20%
25%
Q4
Year
19.4%
20.4%
18.4%
17.6%
2011
2012 |
 IDEX Proprietary & Confidential
$0
$100
$200
$300
$400
$500
Q4
Year
2011
2012
$0
$100
$200
$300
$400
$500
Q4
Year
2011
2012
10%
20%
30%
Q4
Year
2011
2012
Fire & Safety/Diversified
Tremendous performance across all of the diversified businesses
8
Q4 Sales Mix:
Organic
+10%
Acquisition
0%
Fx
-1%
Total
+9%
Q4
Summary:
North American Fire markets were steady in Q4 and completed restructuring
activities will generate benefit in FY13
Rescue experiencing strong North American and Middle Eastern markets
Dispensing domestic markets remain strong
Op margins are up 200 bps driven by structural cost actions, productivity and
volume leverage
* Op Margin data adjusted for restructuring expense (2012 and
2011) Total Orders
Total Revenue
Operating Margin*
Org: 11% growth
130 bps expansion
Org: 12% growth
Org: 14% growth
Org: 10% growth
200 bps expansion |
 IDEX Proprietary & Confidential
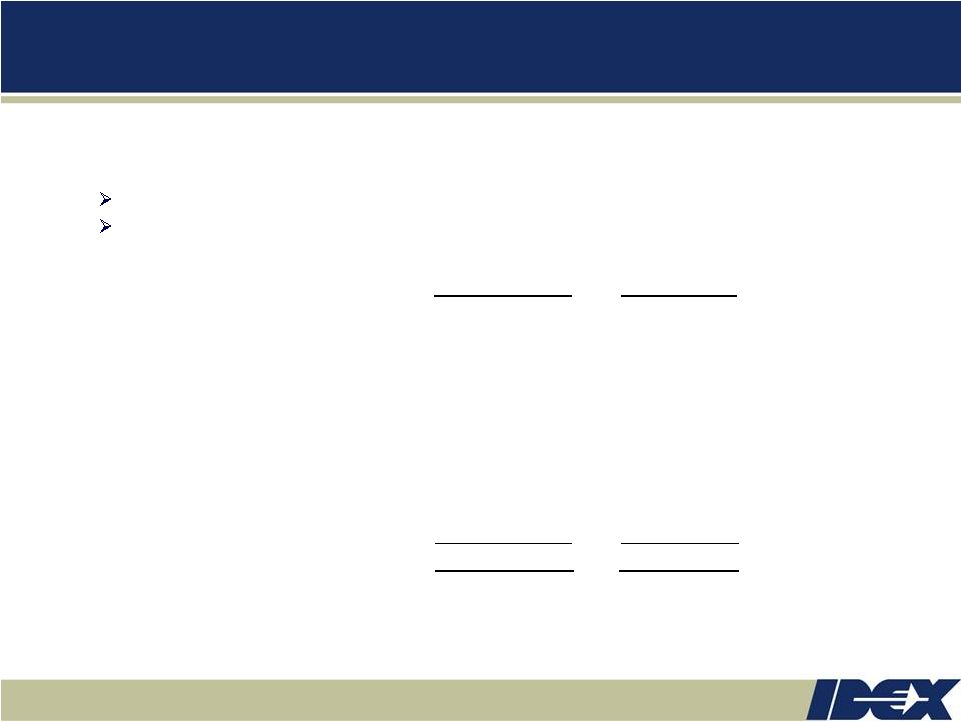
2013 Guidance Detail
9
Completed structural cost actions driving earnings growth
2013 Growth Expectations
Low to mid single digit organic revenue growth
Future acquisitions not contemplated in the growth below
* EPS adjusted to exclude impairment and restructuring charges
** Wage, fringe and material inflation, net of productivity and sourcing savings
Sales
EPS
(in M's)
FY 2012 Actuals*
$
1,954 $ 2.68
Organic Growth
40 -
75
0.10 -
0.20
FX
0.01
Full Year Acquisitions
30
0.03
Structural Cost Benefits
0.24
Growth Investments
(0.14)
Net Inflation**
(0.07)
FY 2013 Forecast
$2.0 -
$2.1B
$2.85 -
$2.95
10 |
 IDEX Proprietary & Confidential
Outlook: 2013 Guidance Summary
Q1 2013
EPS
estimate
range:
$0.70
–
$0.72
Flat organic revenue growth
Positive acquisition impact ~ 3%
Operating margin ~ 18.5%
FY 2013
EPS
estimate
range:
$2.85
–
$2.95
Low-to-mid single digit organic revenue growth
Positive acquisition impact ~ 1.5%
Operating margin ~ 19%
Positive Fx impact ~ 1% to sales
Other modeling items
Tax
rate
~
29
-
30%
Cap
Ex
~
$40
-
$42M
Free Cash Flow will significantly exceed net income
Continued opportunistic share repurchases
EPS estimate excludes future acquisitions
10 |
 IDEX Proprietary & Confidential
Q&A
11 |