Attached files
| file | filename |
|---|---|
| 8-K - FORM 8-K - CVR Refining, LP | d480862d8k.htm |
 Investor Presentation
February 6-7, 2013
Exhibit 99.1 |
 Forward Looking Statements
1
The following presentation contains forward-looking statements based on management’s current
expectations and beliefs, as well as a number of assumptions concerning future events. The
assumptions and estimates underlying the financial information are inherently uncertain and,
although considered reasonable as of the date of preparation by the management team of our
general partner, all of whom are employed by CVR Energy, Inc., are subject to a wide variety of
significant business, economic, and competitive risks and uncertainties that could cause actual
results to differ materially from those contained in the prospective information. Accordingly, there
can be no assurance that the prospective results are indicative of our future performance or that
actual results will not differ materially from those presented in the prospective information.
You are cautioned not to put undue reliance on such forward-looking statements (including
forecasts and projections regarding our future performance) because actual results may vary
materially from those expressed or implied as a result of various factors, including, but not
limited to those set forth under “Risk Factors” in the Prospectus (File no.
333-184200), as amended, of CVR Refining, LP (the “Company”). CVR Energy,
Inc. and the Company assume no obligation to, and expressly disclaims any obligation to, update
or revise any forward-looking statements, whether as a result of new information, future
events or otherwise, except as required by law. |
 Today’s presenters
2
Jack Lipinski
Chief Executive Officer & President
Susan Ball
Chief Financial Officer & Treasurer
Jay Finks
Director of Finance & Head of Investor Relations |
 The
Offering 3
Issuer:
CVR Refining, LP (“CVR Refining,” “CVRR,” the “Company” or the
“Issuer”) NYSE Ticker:
CVRR
Security:
Common units representing limited partner interests
Common units offered:
24 million
Underwriters’ option to purchase additional units:
3.6 million common units (15%)
Units offered as a % of units outstanding after offering:
16.2% (18.7% including full exercise of the underwriters’ option to purchase additional units)
Offering Price:
$25 per common unit
MLP structure:
Variable distribution MLP; no distribution coverage, MQD or IDRs
Quarterly distribution policy:
An amount equal to 100% of available cash generated each quarter
Estimated Distribution for the 12 Months Ending
December 31, 2013:
$4.7215 per unit (to be prorated from the closing of the Offering)
Implied Yield at Offering Price:
18.89%
Joint Bookrunners:
Credit Suisse, Citi, Barclays, UBS, Jefferies
Co-Managers:
JP Morgan, Macquarie, Simmons and Company
Pricing Date/IPO Close Date:
January 16, 2013 / January 23, 2013
Intent to purchase:
Icahn Enterprises, LP (“IEP”) purchased $100 million of units in this offering
CEO Jack Lipinski purchased $5 million of units in this offering |
 Gasoline
49.7%
Distillate
40.8%
Other
9.5%
Owns two of only seven refineries in the underserved Group 3 of
the
PADD
II
region
–
refining
capacity
of
185
thousand
barrels per
day (“Mbpd”) and a weighted average complexity of 11.5 between
the two refineries
Represents ~22% of regional refining capacity
Strategic location and logistics assets provide access to price-
advantaged mid-continent, Bakken and Canadian crude oils
100% of processed crude is priced by reference to WTI
WTI
currently
(1)
trading
at
$19.93
discount
to
Brent
EIA
estimates
2013E
Brent-WTI
differential
of
$15.37
(2)
Average realized discount to WTI on purchased crudes of
$3.52/bbl
over
2007
–
Q3
2012
Favorable products demand / supply dynamics, with local demand
on average 16.9% higher than local fuel production over 2007-
2011
(3)
Company Overview
(1)
Bloomberg data as of 1/7/2013.
(2)
As per the EIA’s Short-term Energy Outlook dated December 11, 2012
(3)
Based on EIA data, including gasoline and ultra-low sulfur diesel (ULSD)
demand and production in the states of Kansas, Oklahoma, Missouri, Nebraska, and Iowa.
(4)
Data for nine months ended September 30, 2012.
(5)
Other includes pet coke, asphalt, natural gas liquids (“NGLs”), slurry,
sulfur, gas oil and specialty products such as propylene and solvents, excludes internally produced fuel.
Leading independent mid-con refiner with world class strategically located
refineries and supporting logistics assets 4
Wynnewood Refinery
CVR Refining Crude Transportation
CVR Refining Crude Oil Pipeline
Third-Party Crude Oil Pipeline
CVR Refining Headquarters
Other PADD II Group 3 refineries
Coffeyville Refinery
Key operational data
(4)
:
Sweet
77.3%
Medium
12.3%
Heavy sour
10.4%
Crude throughput
(176,589 bpd)
Production
(185,270 bpd)
(5)
Refinery
Capacity
Complexity
(Mbpd)
Coffeyville
115
12.9
Wynnewood
70
9.3
CVR Refining
185
11.5 |
 115,000 bpd of crude throughput capacity
12.9 complexity
Located in Kansas in Group 3 of the PADD II
region
Access to cost-advantaged, WTI price-linked
crude oils (100% of crude slate) –
local and
Canadian
~100 miles from Cushing, Oklahoma
High complexity refinery with last nine months ended
September 30, 2012 product yield including gasoline
(49.2%), distillate (42.4%), and pet coke and other
specialty products (8.4%)
Sales and distribution primarily to the central mid-
continent
~35% of FY 2011 products sold through the rack
system directly to retail and wholesale customers
~65% of remaining FY 2011 products sold
through pipelines (Magellan, Enterprise, and
NuStar) via bulk spot and term contracts
Over $700 million invested since 2005 to modernize
the refinery and meet more stringent environmental,
health, and safety requirements
Two-phase turnaround completed in early 2012 at a
total cost of ~$89 million
High Quality Refineries: Coffeyville
2005 (Acquisition year)
Current
Operational
Upgrades
Invested $700 million
since 2005
Now, one of the most
flexible Mid-Con
refineries
Crude
throughput
capacity (bpsd)
(4)
<90,000
~125,000
Feedstock
flexibility
No heavy sour
Up to 25,000 bpd
Complexity
10.3
12.9
Gathered Barrels
Capacity (bpd)
~7,000
~50,000
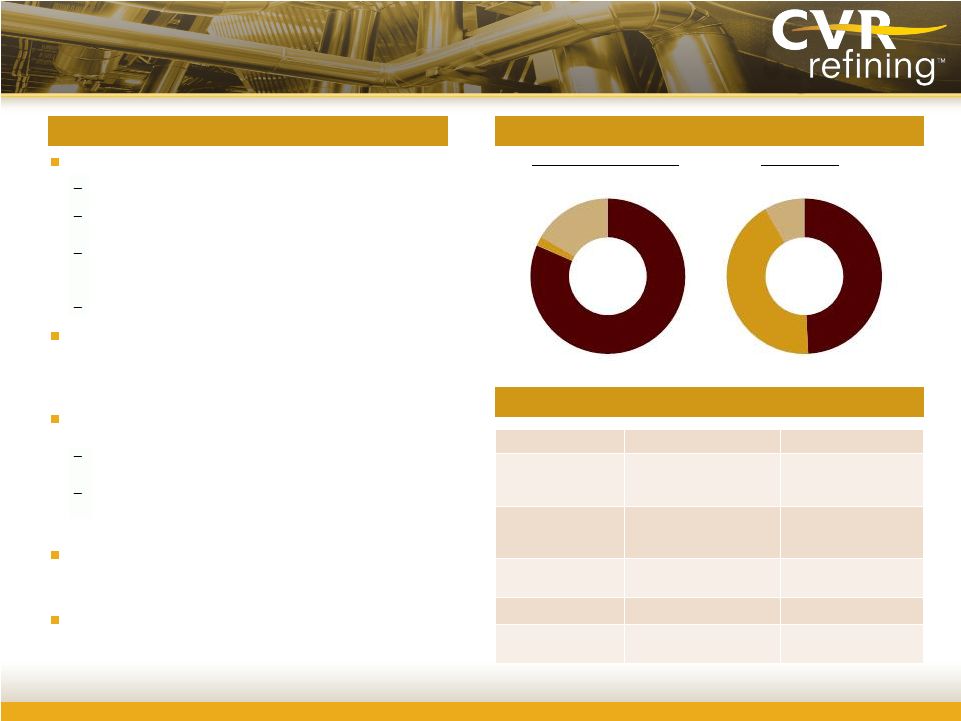
Summary
Crude oil & product mix
(1)
Management’s proven track record
(1)
For nine months ended September 30, 2012.
(2)
Other includes pet coke, asphalt, NGLs, slurry, sulfur, gas oil and specialty
products such as propylene and solvents, excludes internally produced fuel.
(3)
Includes 5.0% by volume used as blendstock.
(4)
Barrels per stream day (“bpsd”).
5
Crude oil throughput
Production
111,505
bpd
119,669
bpd
Heavy sour
16.5%
Light/medium
sour
2.0%
Sweet
81.5%
Other
(2)
8.4%
Distillate
42.4%
Gasoline
49.2%
(3) |
 High
Quality Refineries: Wynnewood 70,000 bpd of crude throughput capacity
-
9.3 complexity
-
Located in Oklahoma in Group 3 of the PADD II
region
-
Access to local cost-advantaged, WTI price-
linked crude oils (100% of crude slate)
For the last nine months ended September 30, 2012
product yield includes gasoline (50.7%), distillate
(37.8%), asphalt and other products (11.5%)
Sales and distributions primarily to Oklahoma market
(~60%)
-
~12,000 bpd of gasoline and ULSD sold via the
truck rack located at the refinery
-
Non-Oklahoma gasoline and ULSD distributed in
the mid-con region via Magellan pipeline
Turnaround was completed in Q4 2012 for a total
expected cost of ~$105 million
Since acquisition in December 2011, utilization has
increased from ~88% to approximately ~93%
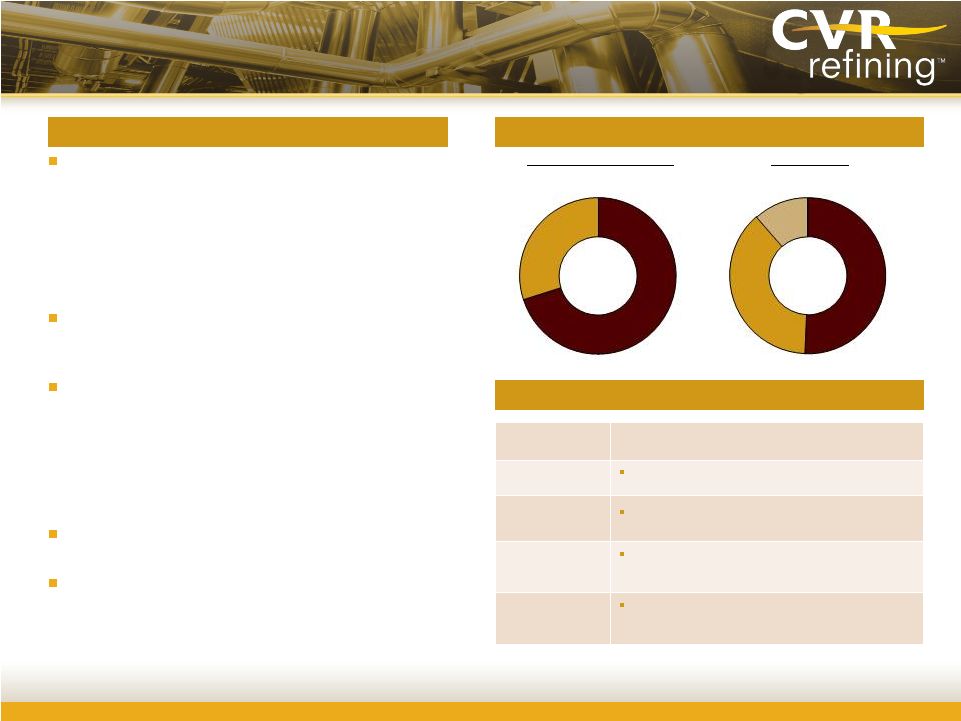
Project
Opportunity
Logistics
Opportunity to share feedstocks based on unit
economics
Crude slate
Optimize crudes to improve consumed crude
differentials and improve realized refining margin
Rail options
Wynnewood connected to a BNSF main line
–
Property can accommodate new track and
off-take infrastructure
Storage options
Currently 500,000 barrels of storage
–
Sufficient land for significant additional
storage / blending tanks
Summary
Asset improvement opportunities
6
Light/medium
sour
29.9%
Production
65,084
bpd
65,601
bpd
Crude oil throughput
Sweet
70.1%
(1)
For nine months ended September 30, 2012.
(2)
Other includes asphalt, NGL’s, slurry, sulfur, gas oil and specialty products
such as propylene and solvents, excludes internally produced fuel. (2)
Other
11.5%
Gasoline
50.7%
Distillate
37.8%
Crude oil & product mix
(1) |
 Source:EIA and Wall Street research.
(1)
PADD II consolidated refinery statistics.
(2)
For the nine months ended September 30, 2012.
(3)
Operating expenses calculated on a per barrel of crude throughput and excluding
SG&A and direct turnaround expenses. (4)
CVR Refining EBITDA margin calculated as Adjusted EBITDA of $988.9 million for nine
months ended September 30, 2012 divided by total crude throughput of 48.39 MMbbls
for nine months ended September 30, 2012.
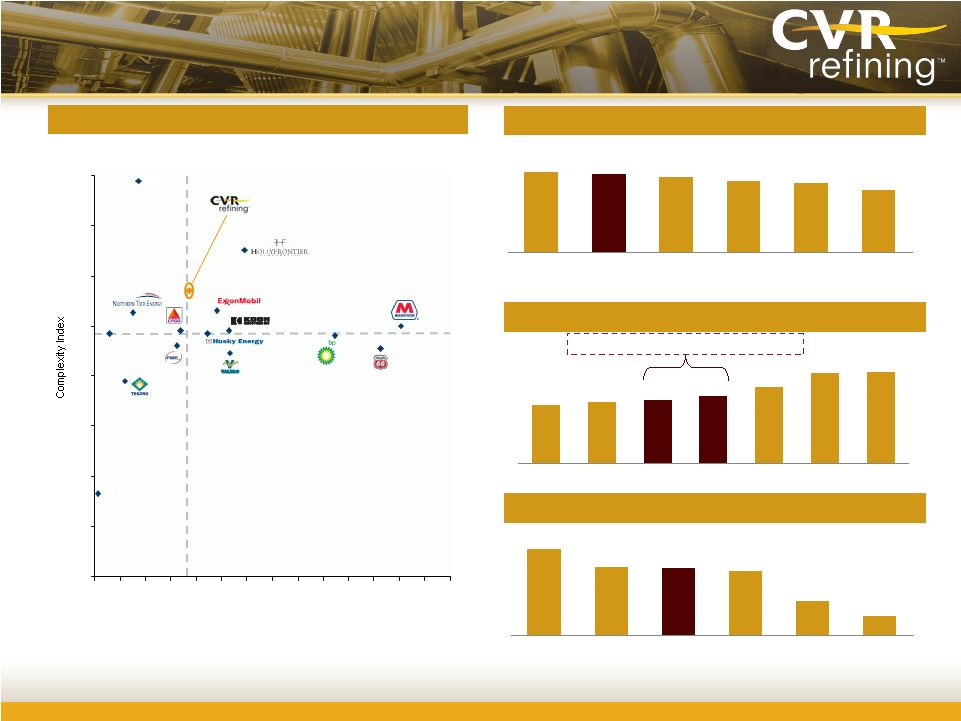
High Quality Assets
Favorable high distillate yield
(2)
“Top quartile”
consolidated asset profile
(1)
Low cost operator (operating expenses in $/bbl)
(2) (3)
7
Median
Capacity:
185.0
Median
Complexity
9.7
CMC
SR
Capacity: 185 kbpd (Coffeyville & Wynnewood)
Complexity: 11.5 (blended average)
0.0
2.0
4.0
6.0
8.0
10.0
12.0
14.0
16.0
0
50
100
150
200
250
300
350
400
450
500
550
600
650
700
Crude Unit Processing Capacity (000's bpd)
Strong EBITDA margins ($/bbl)
(2)
Operating expenses for CVR Refining: $4.52/bbl
(4)
41.7%
40.8%
39.0%
36.8%
36.2%
32.1%
WNR
CVR
Refining
HFC
PBF
TSO
NTI
$4.08
$4.23
$4.41
$4.69
$5.32
$6.27
$6.33
NTI
PBF
Coffeyville
Refinery
Wynnewood
Refinery
HFC
WNR
TSO
$26.28
$20.74
$20.44
$19.47
$10.45
$5.76
NTI
WNR
CVR
Refining
HFC
TSO
PBF
NCRA |
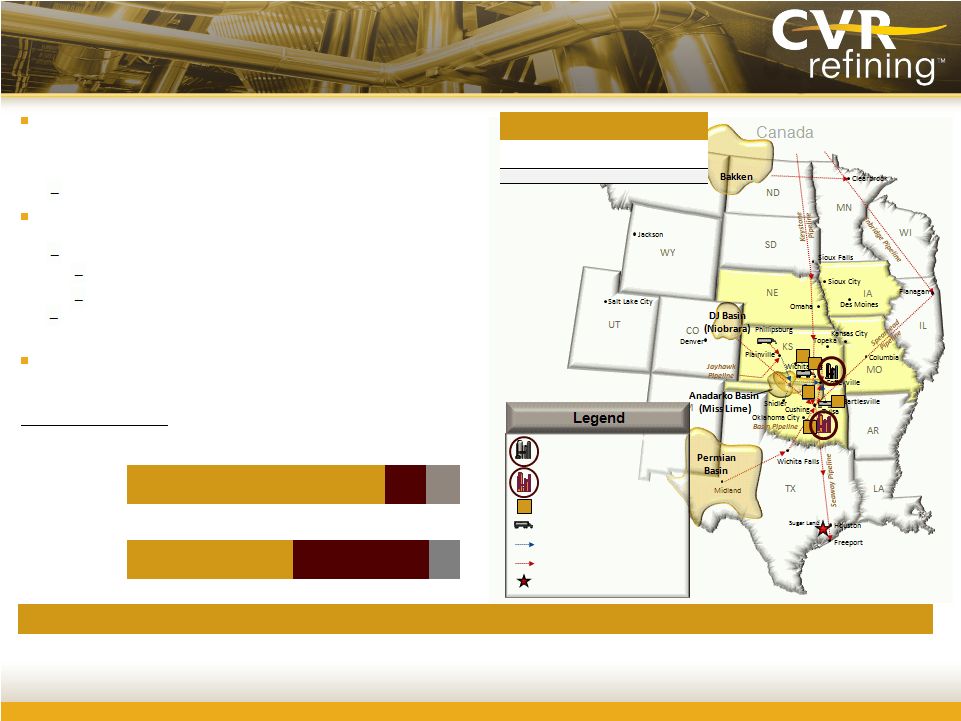
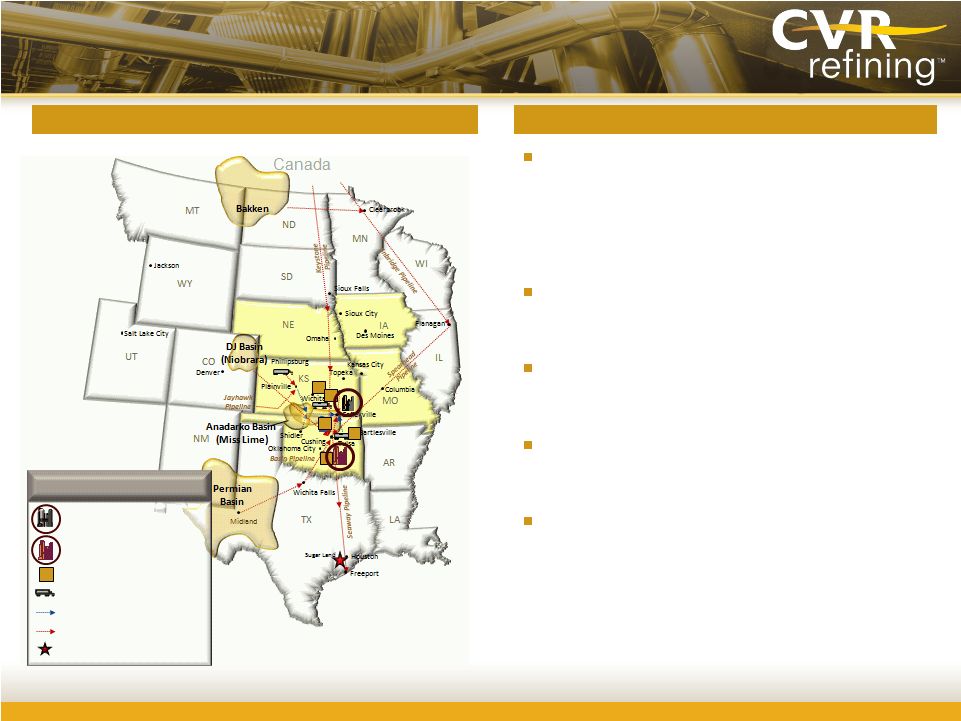 Strategically Located Mid-con Refineries
Source: EIA and Wall Street research.
Located in the Group 3 of the PADD II region which
currently has access to lower cost mid-continent
domestic sweet and sour crude oils
–
Located near the current crude export bottleneck at
Cushing
Near emerging mid-continent shale plays such as the
Niobrara in the DJ basin and the Mississippian Lime
in Northern Oklahoma and Southwestern Kansas
Near major pipelines (Keystone, Spearhead) with
access to various light and heavy grade Canadian
crude oils
Close proximity to, and substantial storage capacity
at, Cushing minimizes the likelihood of a supply
interruption
Supply-constrained products market with
transportation and crude cost advantage relative to
Gulf Coast refineries
8
CVR Refining asset locations
Strategically located refineries
Coffeyville Refinery
Wynnewood Refinery
Other PADD II Group 3 refineries
CVR Refining Crude Transportation
CVR Refining crude Oil Pipeline
Third-Party Crude Oil Pipeline
CVR Refining Headquarters
Legend |
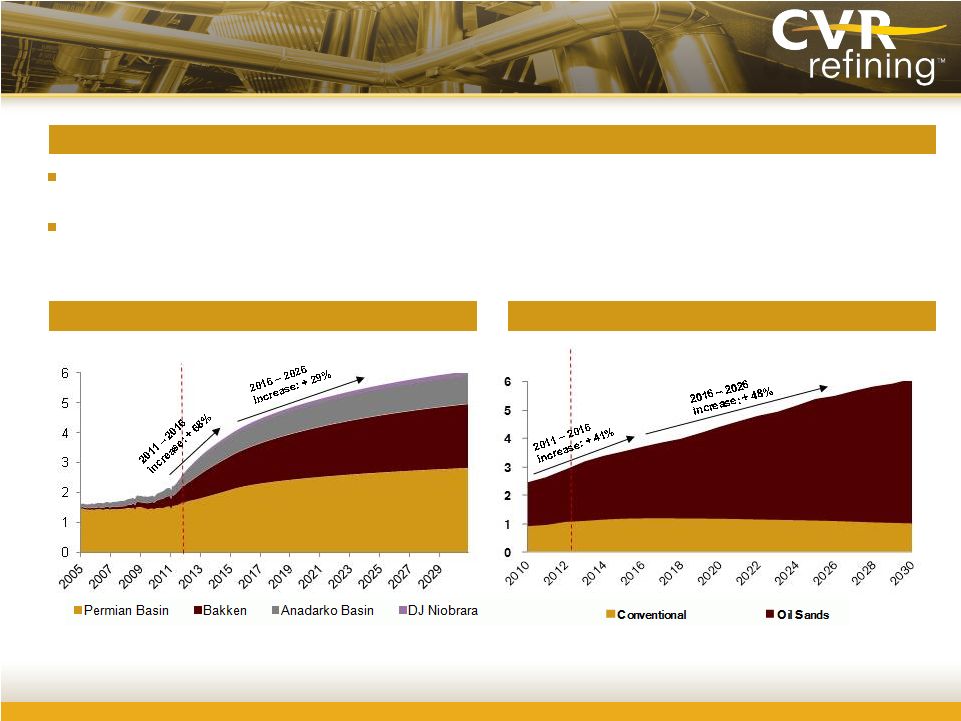 Historical Forecast
(MMbpd)
Crude Advantage Sustainable Long Term
We expect WTI to continue to trade at a discount to Brent over the long term, but
anticipate that this discount will vary over time
Canadian production exceeds existing transportation capacity south to the
U.S. Increasing domestic and Canadian crude oil production
Regional Play Oil and NGL Forecasts
Western Canada Crude Oil Forecasts
Source: Investment Technology Group.
Note:
Anadarko Basin includes Mississippian Lime, Granite Wash, Cleveland Tonkawa,
Marmaton; DJ Niobrara includes horizontal wells only.
Source:
Canadian Association of Petroleum Refiners, “Crude Oil Forecast, Markets
& Pipelines, June 2012.”
Note:
Oil sands includes upgraded conventional, imported condensate, manufactured
diluent from upgraders and upgraded heavy volumes coming from upgraders.
(MMbpd)
9
Historical Forecast |
 Crude
Advantage Sustainable Long Term (cont’d)
Both
refineries
benefit
from
the
current
WTI-Brent
–
WTI price-linked crudes are currently trading at a historically wide discount
to waterborne foreign crudes, such as Brent
Ever-increasing
mid-continent
domestic
and
Canadian
crude
oil
production,
decreasing
North
Sea
production,
transportation infrastructure limitations and geopolitical factors are contributing
to maintain this differential Currently capable of gathering ~50,000 bpd of
crudes from our gathering area at a discount to WTI –
Volumes
are
expected
to
increase
further
with
the
growth
in
the
logistics
infrastructure
–
targeting
~10%
growth
per
annum
2013E Brent-WTI differential of $15.37, according to EIA’s Short-term
Energy Outlook dated December 11, 2012 Favorable crude differentials
Spot crude differentials
($/bbl)
10
Source: Bloomberg as of 2/4/2013.
$(70.00)
$(50.00)
$(30.00)
$(10.00)
$10.00
$30.00
Jan-05
Jan-06
Jan-07
Jan-08
Jan-09
Jan-10
Jan-11
Jan-12
Jan-13
Jan-14
Jan-15
Historical
Forward
Current
as of
2/4/13:
Average
(1/1/2005 –
2/4/2013):
($31.50)
($16.69)
WCS -
WTI
($20.56)
($4.31)
WTI -
Brent
NTM
average:
($14.32)
($27.72)
($52.06)
($24.49)
WCS -
Brent
($42.04)
($2.35)
($0.72)
WTI at Midland -
WTI
NA
differential – 100% of crude input priced with reference to WTI |
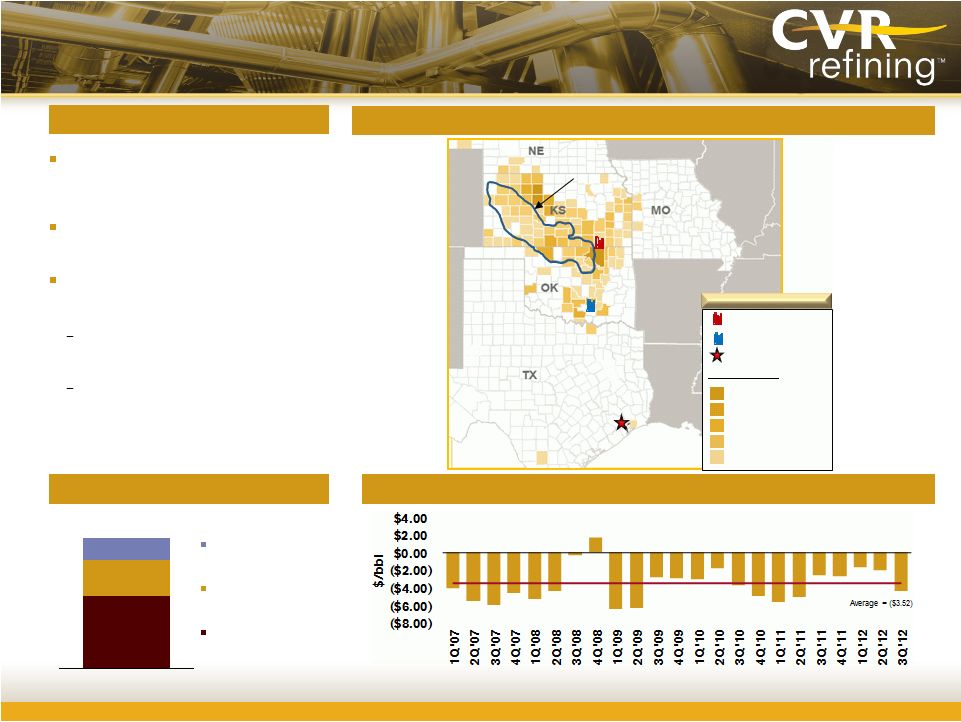 Complementary Logistics Assets
Logistics overview
~6.0MMbbls of total storage capacity,
including ~6% of total crude oil storage
capacity at Cushing
35,000 bpd of contracted capacity on the
Keystone and Spearhead pipelines
Currently gathering ~50,000 bpd of price-
advantaged crudes from Kansas, Nebraska,
Oklahoma, Missouri and Texas
CVR Refining gathering network
Crude storage owned / leased
Total purchased crude discount to WTI
1.7
3.3
1.0
Cushing owned
Wynnewood, Coffeyville,
and gathering system
Cushing leased
6.0
(MMbbls)
11
Greater than 3,000 bpd
1,000 to 3,000 bpd
500 to 999 bpd
100 to 499 bpd
0 to 99 bpd
Coffeyville Refinery
Wynnewood Refinery
CVR Refining Headquarters
Volumes gathered:
Mississippian Lime
350 miles of owned pipelines and over 125
crude oil transports and associated storage
facilities
Grown from ~7,000 bpd in 2005 to
~50,000 bpd currently and
targeting growth of ~10% per year
Legend |
 Since the mid-1990s, demand for gasoline and distillates in our key supply area
has exceeded production, resulting in a need for imports from other regions,
specifically from the U.S. Gulf Coast Group 3 market prices typically include
a premium equivalent to the logistics cost for U.S. Gulf Coast suppliers to ship
products into the region but this may vary
Favorable Local End Product Supply-Demand
12
Regional supply and demand for distillates
(1)
(Mbpd)
Regional supply and demand for gasoline
(1)
(Mbpd)
Source: EIA; Distillates include jet fuel, kerosene and distillate fuel
oil. (1) Based on data
for the following states: Kansas, Oklahoma, Missouri, Nebraska and Iowa. PADD
II Group 3 product pricing advantage CVR
Refining
benefits
from
the
favorable
supply
–
demand
dynamics
for
gasoline
and
distillates
in
its
key
supply
area
(Kansas, Oklahoma, Missouri, Nebraska, and Iowa)
PADD
II
Group
3
2-1-1
benchmark
was
on
average
$1.54/bbl
above
NYMEX
2-1-1
over
2007
–
2011
421
440
461
465
472
565
549
543
559
545
2007
2008
2009
2010
2011
Gasoline production
Total gasoline sales
274
306
297
318
311
354
360
328
367
362
2007
2008
2009
2010
2011
Distillate production
Total distillate sales
Over the five-year period ended December 31 2011, local gasoline and
distillate demand exceeded production by an average of 16.9%
|
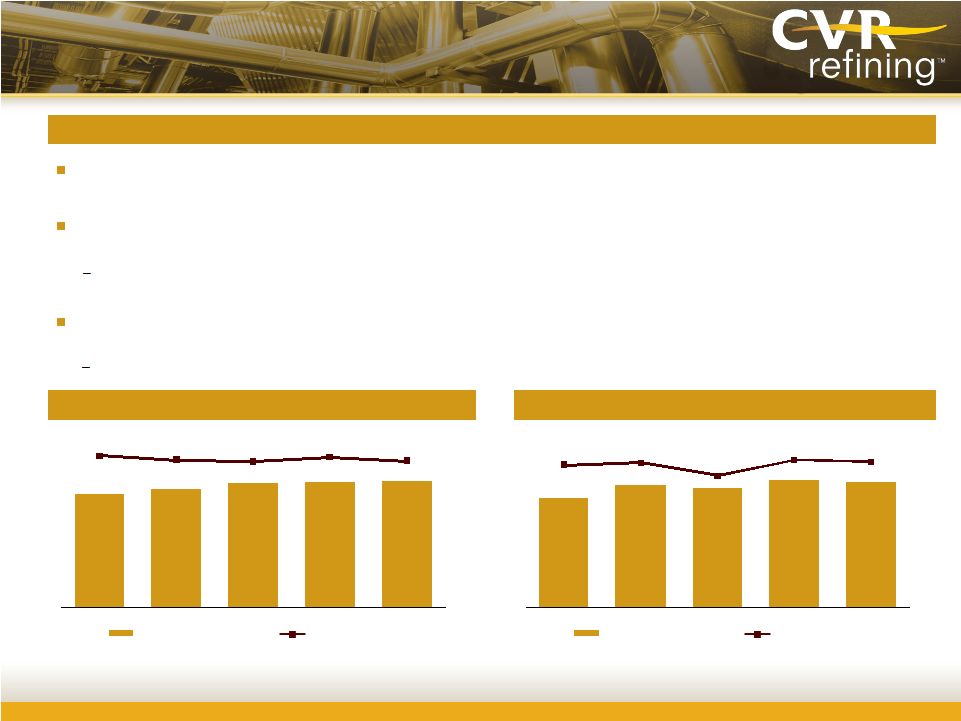
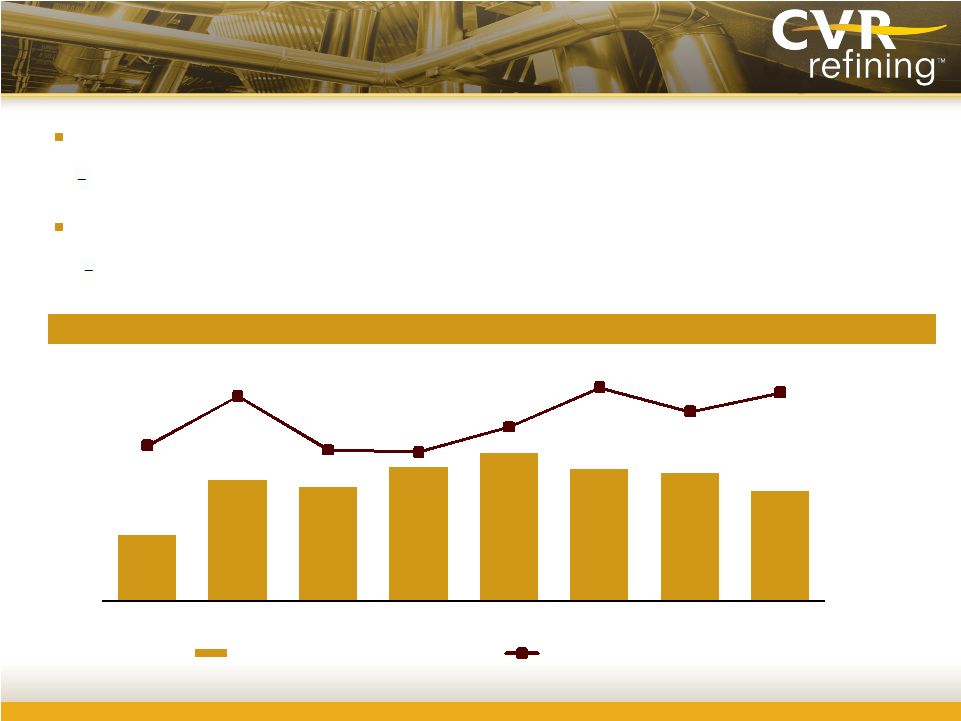
 Strong Operating Track Record
Utilization rate
(1)
High
average
annual
refining
utilization
rate
of
94.3%
over
2009
–
2011
Source:
Company data and peer group filings.
(1)
Refinery
utilization
defined
as
crude
throughput
divided
by
the
capacity
of
the
refinery.
(2)
2009 and 2010 utilization rate is not pro forma for the Wynnewood
acquisition. (3)
2011 utilization rate is pro forma for Wynnewood acquisition.
94.3%
94.1%
98.6%
92.4%
93.1%
2009 - 2011 average
2009
2010
2011
Nine months ended
Sept 30, 2012
13
(2)
(2)
(3) |
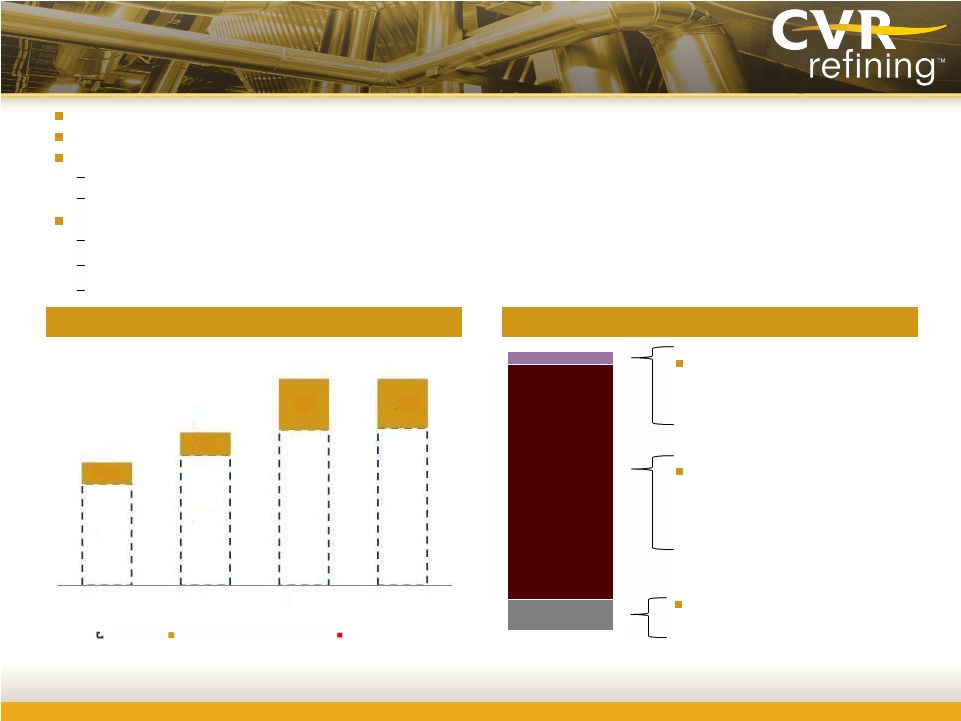 How
CVR Refining Makes Money CVRR historical crack spread
(1)
14
CVR
Refining
makes
money
by
buying
crude
oil
and
selling
refined
products
(primarily
gasoline
and
diesel)
The crack spread for mid-continent suppliers includes the Brent-WTI
differential The Company enjoys some advantages that enhance this
spread Has access to and can process price-advantaged mid-continent
local and Canadian crude oils Markets its products in a
supply-constrained products market with transportation and crude cost advantage
Costs include
Direct and variable operating costs
Volumetric loss
Product mix variance
Long-term PADD II Group 3
2-1-1 crack premium versus
NYMEX:
(2)
•
$1.54 per barrel
CVRR long-term average crude cost
discount
versus
NYMEX
WTI:
(4)
•
$3.52 per barrel of crude
Average NYMEX 2-1-1 crack
spread,
2009
-
2011
(3)
:
$14.97/bbl
•
Crack spread for nine months
ended 9/30/2012 : $29.87/bbl
Implied CVRR 2-1-1 crack spread
$62
$80
$95
$96
$13
$13
$31
$30
$75
$93
$126
$126
2009
2010
2011
Nine months
ended
Sept 30, 2012
WTI
CVRR realized crack spread
Product prices
Note:
2009, 2010 and 2011 data includes Coffeyville refinery only.
(1)
CVRR 2-1-1 crack spread. The 2-1-1 crack spread is not a full representation of the
realized refining gross margin as it does not include asphalt and other lower margin products.
(2)
Based on historical five year period ended December 31, 2011.
(3)
Based on historical annual data from 2009 to 2011.
(4)
Based on historical Company data from 1Q 2007 to 3Q 2012.
NYMEX
2-1-1
crack
spread
Group 3 product premium
CVRR crude discount |
 Financial Overview |
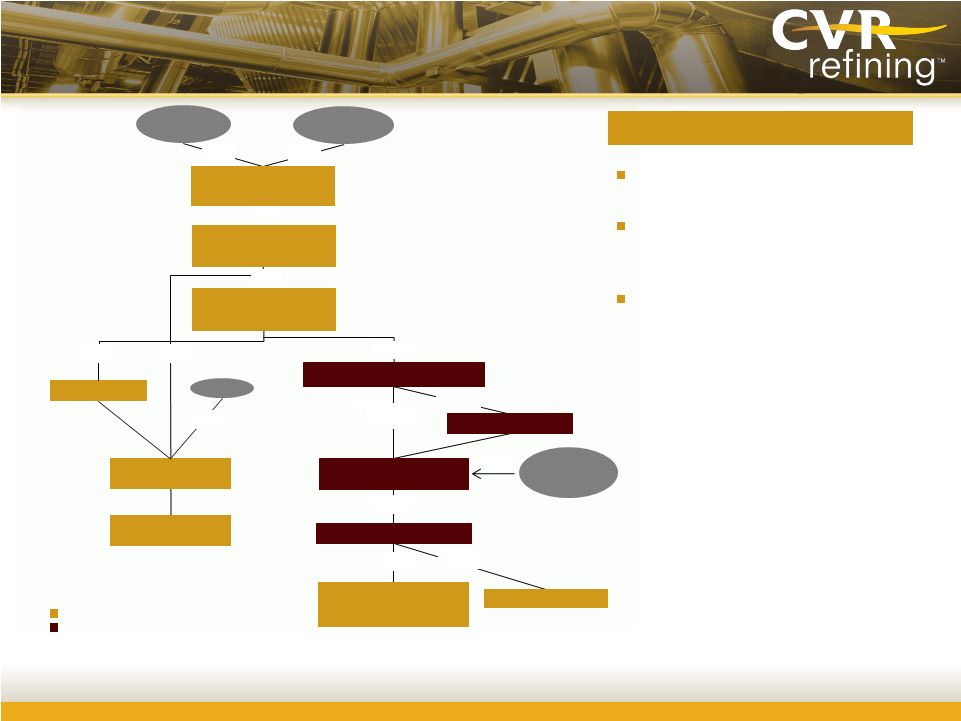 CVRR unit holders own units of CVR
Refining, LP
Liquidity supported by $400 million ABL
and $150 million inter-company credit
facility
Second Lien Notes due 2022 became
unsecured Notes upon IPO
Organizational Structure
16
Petroleum Refining and
Logistics Operating
Subsidiaries
(4)
CVR Refining, LLC
CVR Refining, LP (MLP)
(CVRR)
Coffeyville Finance Inc.
CVR Refining Holdings, LLC
100%
100%
100%
CVR Partners, LP
100%
Public
Public
30.3%
100%
Common
Units
Public
Offering
CVR GP, LLC
100%
CVR Energy, Inc. (CVI)
Coffeyville Resources, LLC
(CRLLC)
69.7%
IEP
82.0%
18.0%
100%
Existing entities
New entities created in conjunction with the MLP IPO
(1)
Includes Wynnewood Insurance Corporation, Coffeyville Nitrogen Fertilizers, Inc., CL
JV Holdings, LLC, Coffeyville Refining & Marketing Holdings, Inc., Coffeyville Refining & Marketing, Inc., Coffeyville
Terminal, Inc., Coffeyville Crude Transportation, Inc., and Coffeyville Pipeline,
Inc. (2)
Includes 12,000 common units issued to its wholly-owned subsidiary, CVR Refining
Holdings Sub, LLC. (3)
Includes Coffeyville Resources Nitrogen Fertilizers, LLC.
(4)
Includes Wynnewood Energy Company, LLC, Wynnewood Refining Company, LLC, Coffeyville
Resources Refining & Marketing, LLC, Coffeyville Resources Crude Transportation, LLC, Coffeyville
Resources Terminal, LLC, and Coffeyville Resources Pipeline, LLC.
Key structuring considerations
Fertilizer Operating
Subsidiaries
(3)
Holding Companies
(1)
100%
81.3%
Common
Units
18.7%
CVR Refining GP, LLC
(2) |
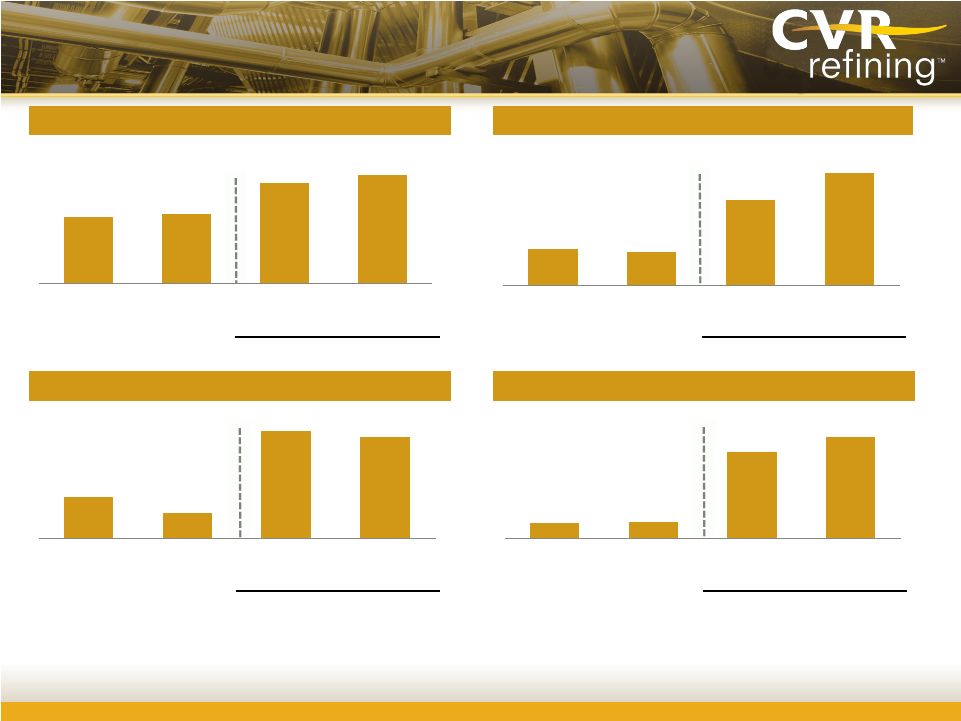 Historical Financial Summary
Refinery crude throughput
Refining gross margin
(1)
Capital expenditures
17
Adjusted EBITDA
(2)
(mbpd)
($ in millions)
($/bbl)
($ in millions)
Pro forma for Wynnewood acquisition
Pro forma for Wynnewood acquisition
Pro forma for Wynnewood acquisition
Pro forma for Wynnewood acquisition
$8.93
$8.07
$20.67
$27.46
2009
2010
2011
Nine months
ended
Sept 30, 2012
108.2
113.4
162.4
176.6
2009
2010
2011
Nine months
ended
Sept 30, 2012
$34.0
$21.2
$87.6
$82.8
2009
2010
2011
Nine months
ended
Sept 30, 2012
$147
$153
$843
$989
2009
2010
2011
Nine months
ended
Sept 30, 2012
Source:
Company filings.
Note:
2009 and 2010 numbers for Coffeyville only. 2011 carve-out values shown.
(1)
Refining margin per crude oil throughput barrel adjusted for FIFO impact. Calculated as the difference
between net sales and cost of product sold (exclusive of depreciation and amortization)
adjusted for FIFO impacts. (2)
Represents EBITDA adjusted for FIFO impacts, share-based compensation, loss on extinguishment of
debt, major scheduled turnaround expenses, Wynnewood acquisition transaction fees and
integration expenses, loss on disposition of assets and net unrealized gain (loss) on derivatives. |
 Hedging Policy Locks in Attractive Spreads
Hedged an average of ~52,000 bpd of production for 2012 and ~62,000 bpd in
2013 Crack spreads hedged at an average $24.47/bbl for 2012 and $26.13/bbl
for 2013 Hedging provides protection in a downside scenario
Ability to cover costs in a severe downside scenario
18
(1)
Hedged
crack
spreads
represent
weighted-average
price
of
all
positions
for
respective
quarters.
2.9
5.3
5.0
5.9
6.5
5.8
5.6
4.8
$23.87
$26.67
$23.62
$23.50
$24.94
$27.18
$25.80
$26.88
$15.00
$17.00
$19.00
$21.00
$23.00
$25.00
$27.00
0.0
1.0
2.0
3.0
4.0
5.0
6.0
7.0
8.0
9.0
10.0
Q1 '12
Q2 '12
Q3 '12
Q4 '12
Q1 '13
Q2 '13
Q3 '13
Q4 '13
Hedged bbls (millions)
Hedged crack spread ($/bbl)
Historical
refining
margin
(1) |
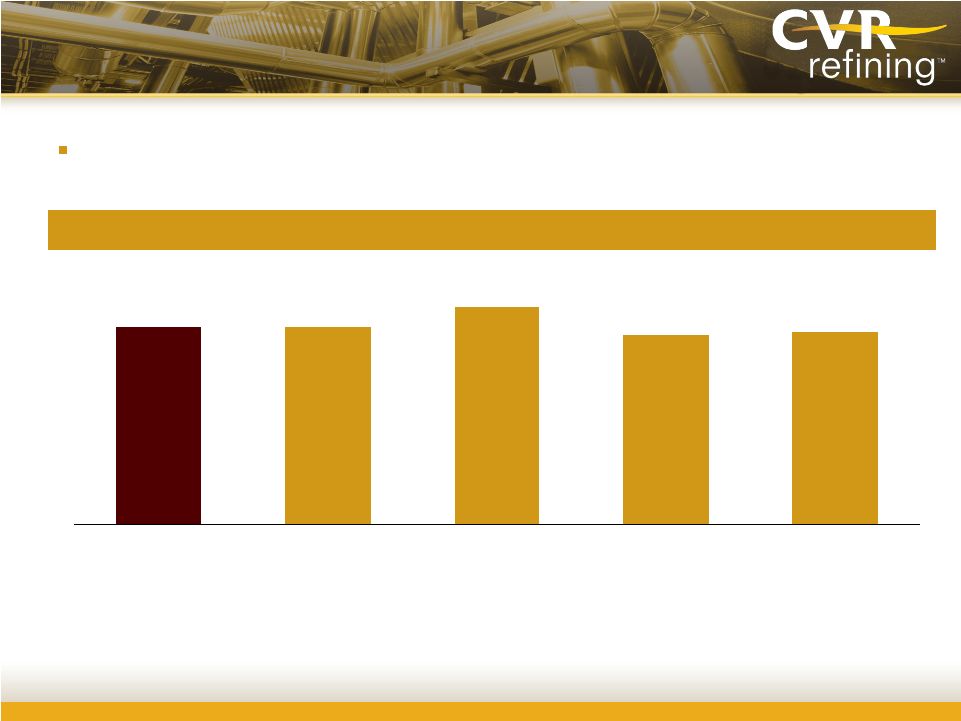
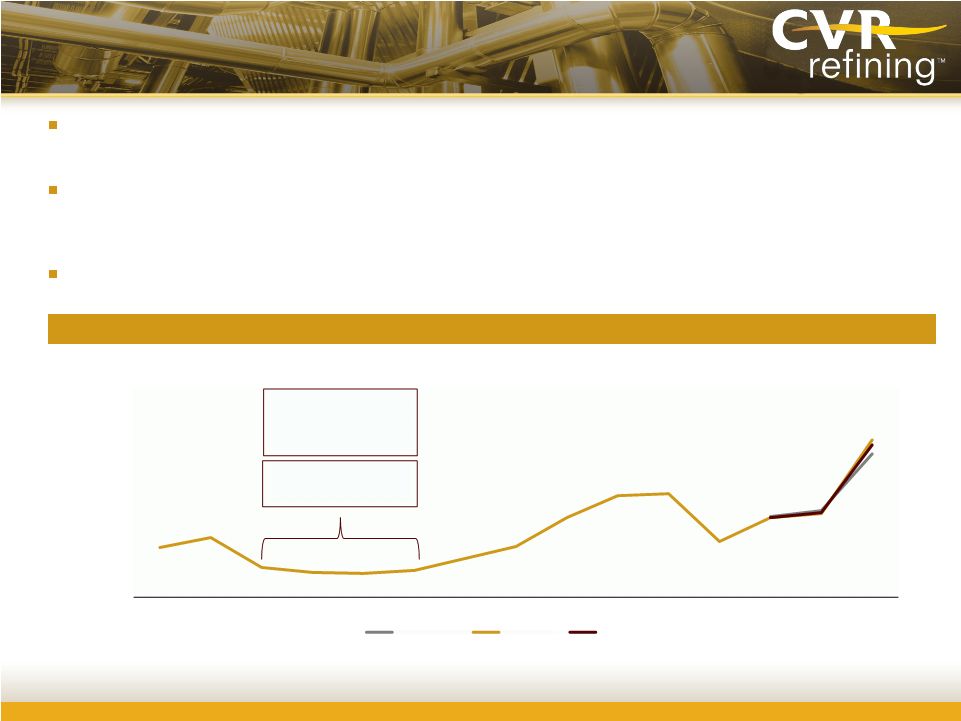 Ample
Liquidity, Sufficient to Sustain a
2009-style Downturn
Current local crude supply demand dynamics expected to be sustainable over longer
term and should support Brent – WTI differential
Average
refining
margin
over
Q3
2009
to
Q2
2010
(lowest
four
quarters
over
2009
–
Q3
2012)
of
$6.20/bbl
for
Coffeyville
refinery
versus
operating
expenses
(excl.
turnaround
expenses)
of
$4.52/bbl
over
nine
months
ended
September 30, 2012
Total liquidity of ~$863 million post-IPO; total debt of ~$553 million
post-IPO ($/bbl)
Historical refining margin
Source:
Company data.
19
$0.00
$5.00
$10.00
$15.00
$20.00
$25.00
$30.00
$35.00
$40.00
1Q '09
2Q '09
3Q '09
4Q '09
1Q '10
2Q '10
3Q '10
4Q '10
1Q '11
2Q '11
3Q '11
4Q '11
1Q '12
2Q '12
3Q '12
Wynnewood
Coffeyville
Combined
Lowest four quarters
over
Q3 '09 -
Q2 '10
Avg. refining margin:
$6.20/bbl |
 Financial Strategy
On the closing of the MLP IPO, the cash balance at CVRR was ~$340 million, which
includes amounts for unpaid Wynnewood turnaround expenses incurred in Q4
2012 Strong liquidity through committed credit facilities ($400 million
ABL) $150 million senior unsecured credit facility to fund future capex
program Intermediation arrangement with Vitol reduces working capital
requirements The New Notes are unsecured
Debt covenants allow for distributions when fixed charge coverage ratio is 2.5x or
higher (2013E forecast is 23.1x)
Variable
distribution
with
no
MQD
and
no
IDRs
–
100%
of
available
cash
to
be
distributed
Wynnewood turnaround expense in Q4 2012 to be paid and near term
environmental capex to be prefunded with IPO proceeds
Going forward, cash to be reserved for turnaround costs associated with both
refineries 20
Distributions
Capital structure
Liquidity
management |
 Appendix |
 Partnership Distribution Policy
22
CVR Refining intends to make distributions within 60 days after the end of each
quarter, beginning with the quarter ending March 31, 2013
Distributions
for
each
quarter
will
be
in
an
amount
equal
to
the
available
cash
generated
in
such
quarter
Available cash for each quarter will generally equal Adjusted EBITDA, less:
–
Maintenance and environmental capex reserves
–
Reserves for turnaround and related expenses
–
Debt service and other contractual obligations
Distributions per unit declared using available cash for each quarter divided by
total common units outstanding
CVRR does not intend to maintain excess distribution coverage for the purpose of
maintaining stability or growth in its quarterly distributions nor does it
intend to incur debt to pay quarterly distributions |
 Adjustments to reconcile Adjusted EBITDA to
estimated cash available for distribution
23
($ in millions)
2013E
Adjusted EBITDA
$900.8
Less:
Incremental general and administrative expenses
$5.0
Cash interest expense (net)
38.9
Maintenance capital expenditures
89.5
Environmental capital expenditures
94.7
Growth capital expenditures
47.5
Increase in reserves for environmental
and maintenance capital expenditures
125.0
Increase in reserves for future turnarounds
35.0
Plus:
Use of cash on hand to fund environmental
and maintenance capital expenditures
$184.2
Draw on $150mm senior unsecured credit facility
to fund growth capital expenditures
47.5
Total adjustments
$696.9 |
 24
Non-GAAP Financial Measures (cont’d)
EBITDA.
EBITDA
is
defined
as
net
income
before
income
tax
expense,
net
interest
(income)
expense
and
depreciation and amortization expense. EBITDA is not a recognized term under GAAP
and should not be substituted for net income as a measure of performance but
should be utilized as a supplemental measure of performance in evaluating
our business. Management believes that EBITDA provides relevant and useful
information that enables external users of our financial statements, such as industry analysts,
investors, lenders and rating agencies to better understand and evaluate our
ongoing operating results and
allows
for
greater
transparency
in
the
review
of
our
overall
financial,
operational
and
economic
performance. |
 25
Non-GAAP Financial Measures (cont’d)
Adjusted EBITDA.
Adjusted EBITDA represents EBITDA adjusted for FIFO impacts (favorable) unfavorable (as described below), share-based
compensation, and where applicable, loss on extinguishment of debt, major scheduled turnaround
expenses, Wynnewood acquisition transaction fees and integration expense, loss on disposition
of assets and unrealized gain (loss) on derivatives, net. Adjusted EBITDA is a supplemental
measure of our performance that is not required by, nor presented in accordance with,
GAAP. Management believes that Adjusted EBITDA provides relevant and useful information that
enables investors to better understand and evaluate our ongoing operating results and allows
for greater transparency in the reviewing of our overall financial, operational and economic
performance. |
 Direct Operating Expenses (Excluding Major Scheduled Turnaround Expenses) Per Crude
Oil Throughput
Barrel.
Direct
operating
expenses
excluding
major
scheduled
turnaround
expenses
per
crude oil throughput barrel is a measurement calculated by excluding major
scheduled turnaround expenses from direct operating expenses (exclusive of
depreciation and amortization) divided by our refineries’
crude oil throughput volumes for the respective periods presented. Direct
operating expenses excluding major scheduled turnaround expenses per crude
oil throughput barrel is a supplemental measure of our performance that is
not required by, nor presented in accordance with, GAAP. Management believes
direct operating expenses excluding major scheduled turnaround expenses per
crude oil throughput most directly represents ongoing direct operating expenses at
our refineries. 26
Non-GAAP Financial Measures (cont’d) |
 Gross Profit (Excluding Major Scheduled Turnaround Expenses and Adjusted for FIFO
Impacts) Per
Crude
Oil
Throughput
Barrel.
Gross
profit
excluding
major
scheduled
turnaround
expenses
and
adjusted for FIFO impacts per crude oil throughput barrel is calculated as the
difference between net sales, cost of product sold (exclusive of
depreciation and amortization) adjusted for FIFO impacts, direct operating
expenses (exclusive of depreciation and amortization) excluding scheduled turnaround
expenses
divided
by
our
refineries’
crude
oil
throughput
volumes
for
the
respective
periods
presented.
Gross profit excluding major scheduled turnaround expenses and adjusted for FIFO
impacts is a non- GAAP measure that should not be substituted for gross
profit or operating income. Management believes it is
important
to
investors
in
evaluating
our
refineries’
performance
and
our
ongoing
operating
results.
Our
calculation
of
gross
profit
excluding
major
scheduled
turnaround
expenses
and
adjusted
for
FIFO
impacts
per
crude
oil
throughput
may
differ
from
similar
calculations
of
other
companies
in
our
industry,
thereby
limiting its usefulness as a comparative measure.
27
Non-GAAP Financial Measures (cont’d) |
 28
Non-GAAP Financial Measures
Refining margin per crude oil throughput barrel is a
measurement calculated as the difference between net sales and cost of product sold (exclusive of
depreciation and amortization) divided by our refineries’ crude oil throughput volumes for
the respective periods presented. Refining margin per crude oil throughput barrel is a
non-GAAP measure that should not be substituted for gross profit or operating income.
Management believes this measure is important to investors in evaluating our refineries’
performance as a general indication of the amount above our cost of product sold that we are
able to sell refined products. Our calculation of refining margin per crude oil throughput
barrel may differ from similar calculations of other companies in our industry, thereby
limiting its usefulness as a comparative measure. We use refining margin per crude oil throughput
barrel as the most direct and comparable metric to a crack spread which is an observable market
indication of industry profitability.
Refining Margin Per Crude Oil Throughput Barrel.
|
 Refining
Margin
Per
Crude
Oil
Throughput
Barrel
Adjusted
for
FIFO
Impact.
Refining
margin
per
crude oil throughput barrel adjusted for FIFO impact is a measurement calculated as
the difference between net sales and cost of product sold (exclusive of
depreciation and amortization) adjusted for FIFO impacts
divided
by
our
refineries’
crude
oil
throughput
volumes
for
the
respective
periods
presented.
Refining margin adjusted for FIFO impact is a non-GAAP measure that we believe
is important to investors in evaluating our refineries’
performance as a general indication of the amount above our cost of product
sold
(taking
into
account
the
impact
of
our
utilization
of
FIFO)
that
we
are
able
to
sell
refined
products.
Our
calculation of refining margin adjusted for FIFO impact may differ from
calculations of other companies in our industry, thereby limiting its
usefulness as a comparative measure. Under our FIFO accounting method,
changes in crude oil prices can cause fluctuations in the inventory valuation of our crude oil, work
in process and finished goods, thereby resulting in favorable FIFO impacts when
crude oil prices increase and unfavorable FIFO impacts when crude oil prices
decrease. 29
Non-GAAP Financial Measures (cont’d) |
  ($ in millions)
CVR Refining, LP Historical Combined
CVR Refining LP
Combined Pro Forma
Year Ended
December 31,
Nine Months Ended
September 30,
Year Ended
December 31,
Nine Months Ended
September 30,
2009
2010
2011
2011
2012
2011
2012
(unaudited)
(unaudited)
Net
income
$64.6
$38.2
$480.3
$402.8
$540.7
$749.0
$565.1
Add:
Interest expense and other financing costs
43.8
49.7
53.0
39.2
56.0
41.7
31.6
Depreciation and amortization
64.4
66.4
69.8
50.9
80.4
98.9
80.4
EBITDA
$172.8
$154.3
$603.1
$492.9
$677.1
$889.6
$677.1
Add:
FIFO impacts (favorable),
unfavorable
(a)
(67.9)
(31.7)
(25.6)
1.5
54.3
(46.6)
54.3
Share-based compensation
2.5
11.5
8.9
8.0
15.6
8.9
15.6
Loss on disposition of assets
–
1.3
2.5
1.5
–
2.5
–
Loss on extinguishment of debt
2.1
16.6
2.1
2.1
–
2.1
–
Wynnewood acquisition transaction fees and integration expense
–
–
5.2
–
10.3
5.2
10.3
Major scheduled turnaround expenses
–
1.2
66.4
12.2
34.6
66.4
34.6
Unrealized (gain) loss on derivatives, net
37.8
(0.6)
(85.3)
6.8
197.0
(85.4)
197.0
Adjusted EBITDA
$147.3
$152.6
$577.3
$525.0
$988.9
$842.7
$988.9
Non-GAAP Financial Measures (cont’d)
30
(a)
FIFO is our basis for determining inventory value on a GAAP basis. Changes in crude oil prices can
cause fluctuations in the inventory valuation of our crude oil, work in process and finished goods
thereby resulting in favorable FIFO impacts when crude oil prices increase and unfavorable FIFO impacts
when crude oil prices decrease. The FIFO impact is calculated based upon inventory values at the
beginning of the accounting period and at the end of the accounting period. |
  ($ in millions, except
per barrel data) CVR Refining, LP Historical Combined
CVR Refining LP
Combined Pro Forma
Year Ended
December 31,
Nine Months Ended
September 30,
Year Ended
December 31,
Nine Months Ended
September 30,
2009
2010
2011
2011
2012
2011
2012
(unaudited)
(unaudited)
Direct operating expenses
$142.2
$153.1
$247.7
$144.0
$253.1
$345.0
$253.1
Less: Major scheduled turnaround expense
–
(1.2)
(66.4)
(12.2)
(34.6)
(66.4)
(34.6)
Direct operating expenses excluding
major scheduled turnaround expenses
142.2
151.9
181.3
131.8
218.5
278.6
218.5
Crude oil throughput(bpd)
108,226
113,365
103,702
107,070
176,589
162,437
176,589
Direct operating expenses excluding major
scheduled turnaround expenses per crude oil throughput barrel
$3.60
$3.67
$4.79
$4.51
$4.52
$4.70
$4.52
Non-GAAP Financial Measures (cont’d)
31 |
  ($ in millions, except
per barrel data) CVR Refining, LP Historical Combined
CVR Refining LP
Combined Pro Forma
Year Ended
December 31,
Nine Months Ended
September 30,
Year Ended
December 31,
Nine Months Ended
September 30,
2009
2010
2011
2011
2012
2011
2012
(unaudited)
(unaudited)
Net sales
$2,936.5
$3,905.6
$4,752.8
$3,773.3
$6,465.5
$7,398.3
$6,465.5
Cost of product sold
2,515.9
3,539.8
3,927.6
3,078.5
5,191.0
6,126.0
5,191.0
Direct operating expenses
142.2
153.1
247.7
144.0
253.1
345.0
253.1
Depreciation and amortization
64.4
66.4
69.8
50.9
80.4
98.9
80.4
Gross profit
214.0
146.3
507.7
499.9
941.0
828.4
941.0
Add:
Major scheduled turnaround expense
–
1.2
66.4
12.2
34.6
66.4
34.6
FIFO impacts (favorable)/unfavorable
(67.9)
(31.7)
(25.6)
1.5
54.3
(46.6)
54.3
Gross profit excluding major scheduled turnaround expenses
and adjusted for FIFO impacts
146.1
115.8
548.5
513.6
1,029.9
848.2
1,029.9
Crude oil throughput(bpd)
108,226
113,365
103,702
107,070
176,589
162,437
176,589
Gross profit excluding major scheduled turnaround expenses
and adjusted for FIFO impact per crude oil throughput barrel
$3.70
$2.80
$14.49
$17.57
$21.29
$14.31
$21.29
Non-GAAP Financial Measures (cont’d)
32 |
  ($ in millions, except
per barrel data) CVR Refining, LP Historical Combined
CVR Refining LP
Combined Pro Forma
Year Ended
December 31,
Nine Months Ended
September 30,
Year Ended
December 31,
Nine Months Ended
September 30,
2009
2010
2011
2011
2012
2011
2012
(unaudited)
(unaudited)
Net sales
$2,936.5
$3,905.6
$4,752.8
$3,773.3
$6,465.5
$7,398.3
$6,465.5
Less: cost of product sold (exclusive of depreciation and amortization)
2,515.9
3,539.8
3,927.6
3,078.5
5,191.0
6,126.0
5,191.0
Refining margin
420.6
365.8
825.2
694.8
1,274.5
1,272.3
1,274.5
FIFO impacts (favorable), unfavorable
(67.9)
(31.7)
(25.6)
1.5
54.3
(46.6)
54.3
Refining margin adjusted for FIFO impact
352.7
334.1
799.6
696.3
1,328.8
1,225.7
1,328.8
Crude oil throughput(bpd)
108,226
113,365
103,702
107,070
176,589
162,437
176,589
Refining margin per crude oil throughput barrel
$10.65
$8.84
$21.80
$23.77
$26.34
$21.46
$26.34
Refining margin per crude oil throughput barrel adjusted for FIFO impact
$8.93
$8.07
$21.12
$23.82
$27.46
$20.67
$27.46
Non-GAAP Financial Measures (cont’d)
33 |