Attached files
| file | filename |
|---|---|
| 8-K - FORM 8-K - LyondellBasell Industries N.V. | d477435d8k.htm |
| EX-99.1 - PRESS RELEASE DATED FEBRUARY 1, 2013 - LyondellBasell Industries N.V. | d477435dex991.htm |
 Jim
Gallogly, Chief Executive Officer Karyn Ovelmen, Chief Financial Officer
Doug Pike, VP -
Investor Relations
February 1, 2013
Fourth-Quarter 2012 Earnings
Exhibit 99.2
Sergey Vasnetsov, SVP - Strategic Planning and Transactions
|
 lyondellbasell.com
Cautionary Statement
2
The information in this presentation includes forward-looking statements. These
statements relate to future events, such as anticipated
revenues, earnings, business strategies, competitive position or other aspects of our
operations or operating results. Actual outcomes and results may differ materially from
what is expressed or forecast in such forward-looking statements. These statements are
not guarantees of future performance and involve certain
risks, uncertainties and assumptions that are difficult to predict. Factors
that could cause actual results to differ from forward-looking statements include, but are not
limited to, availability, cost and price volatility of raw materials and utilities;
supply/demand balances; industry production capacities and operating rates;
uncertainties associated with worldwide economies; legal, tax and environmental
proceedings; cyclical nature of the chemical and refining industries;
operating interruptions; current and potential governmental regulatory actions; terrorist
acts; international political unrest; competitive products and pricing; technological
developments; the ability to comply with the terms of our credit
facilities and other financing arrangements; the ability to implement business
strategies; and other factors affecting our business generally as set forth in the
“Risk Factors” section of our Form 10-K for the year ended
December 31, 2011, which can be found at www.lyondellbasell.com on the Investor
Relations page and on the Securities and Exchange Commission’s website at www.sec.gov.
This presentation contains time sensitive information that is accurate only as of the date
hereof. Information contained in this presentation is unaudited and
is subject to change. We undertake no obligation to update the information
presented herein except as required by law. |
 Information Related to Financial Measures
3
We have included EBITDA in this presentation, which is a non-GAAP measure, as we believe
that EBITDA is a measure commonly used by investors. However, EBITDA, as presented
herein, may not be comparable to a similarly titled measure reported by other
companies due to differences in the way the measure is calculated. For purposes of
this presentation, EBITDA means net income before net interest expense, income taxes,
depreciation and amortization, reorganization items, income from equity investments,
income(loss) attributable to non-controlling interests, net income (loss) from discontinued
operations, plus joint venture dividends, as adjusted for other items management does not
believe are indicative of the Company’s underlying results of operations such as
impairment charges, asset retirement obligations and the effect of
mark-to-market accounting on our warrants. The specific items for which
EBITDA is adjusted in each applicable reporting period may only be relevant in certain periods and
are disclosed in the reconciliation of non-GAAP financial measures. EBITDA should not be
considered an alternative to profit or operating profit for any period as an
indicator of our performance, or as an alternative to operating cash flows as a
measure of our liquidity. See Table 9 of our accompanying earnings release for
reconciliations of EBITDA to net income. While we also believe that free cash flow (FCF) measure is commonly used by investors, free
cash flow, as presented herein, may not be comparable to similarly titled
measures reported by other companies due to differences in the way
the measure is calculated. For purposes of this presentation, free cash flow means
net cash provided by operating activities minus capital expenditures. lyondellbasell.com |
 lyondellbasell.com
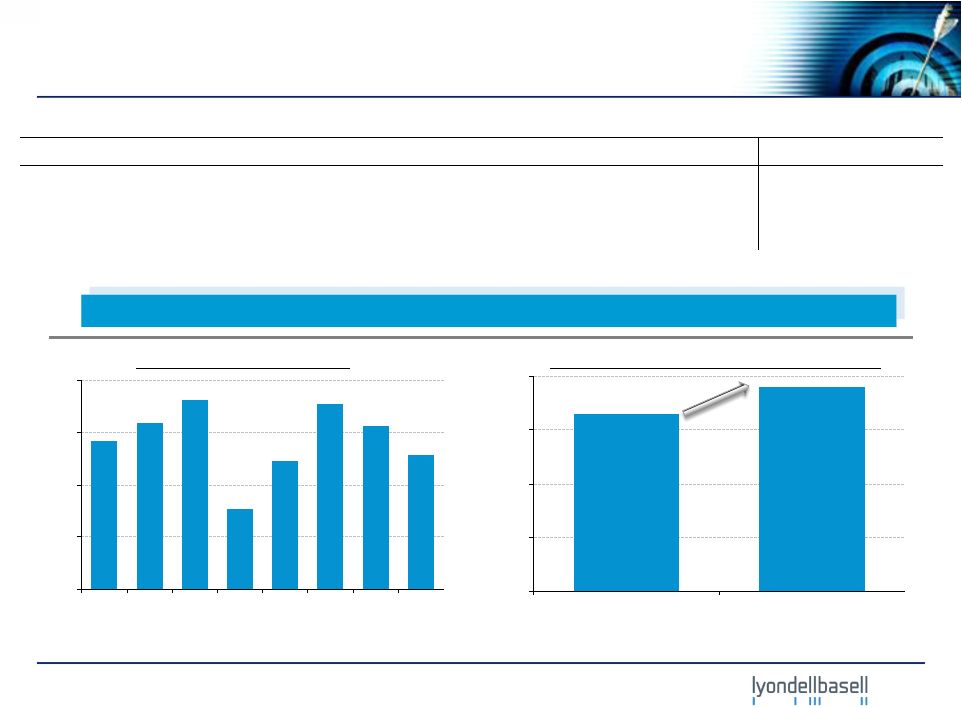
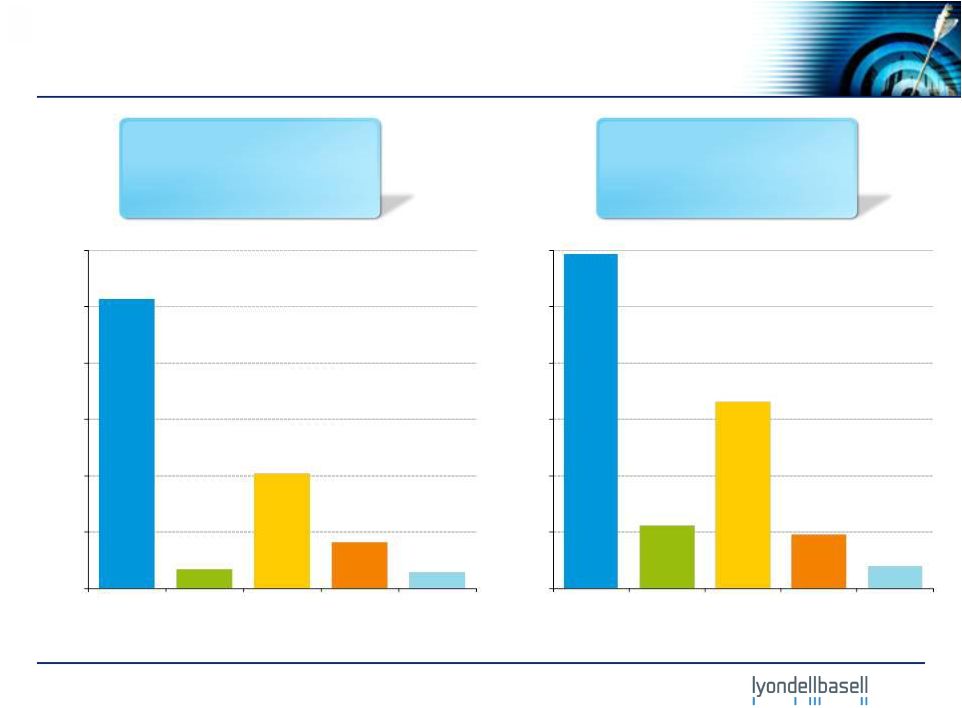
Highlights
EBITDA
(1)
1Q’11
–
4Q’12
FY
2012
Record
Earnings
–
16%
growth
in
Income
from
Continuing
Operations
vs.
2011
($ in millions)
4
500
1,000
1,500
$2,000
1Q'11
2Q'11
3Q'11
4Q'11
1Q'12
2Q'12
3Q'12
4Q'12
Income from Continuing Operations
750
1,500
2,250
$3,000
2011
2012
16%
($ in millions, except per share data)
4Q'12
3Q'12
4Q'11
FY 2012
FY 2011
EBITDA
(1)
$1,289
$1,565
$766
$5,856
$5,585
Income from Continuing Operations
$645
$851
$27
$2,858
$2,472
Diluted Earnings ($ / share) from Continuing Operations
$1.13
$1.47
$0.05
$4.96
$4.32
(1)
(1)
1)
The third quarter 2012 includes a $71 million market price recovery that offset second quarter 2012
lower of cost or market adjustment (LCM). |
 lyondellbasell.com
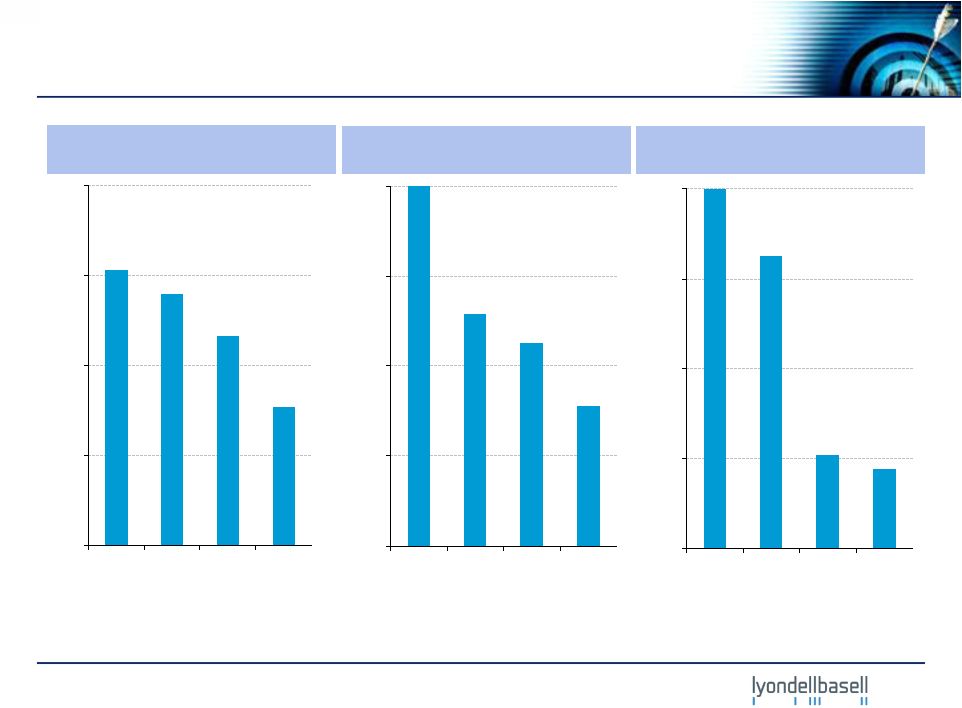
Record Health, Safety and Environmental Performance
1) Includes employees and contractors.
Injuries per 200,000 Hours
Worked
(1)
Indexed Environmental Incidents
Indexed Process Incidents
5
0.00
0.15
0.30
0.45
0.60
2009
2010
2011
2012
0%
25%
50%
75%
100%
2009
2010
2011
2012
0%
25%
50%
75%
100%
2009
2010
2011
2012 |
 lyondellbasell.com
Finance
•
Generated $4.8 billion cash
from operations
•
Paid $2.4 billion in
dividends, equivalent to ~
7% dividend yield
(2)
•
Increased quarterly interim
dividend to $0.40 per share
•
Reduced net annual interest
expense by $367 million
•
Received $147 million in JV
dividends
•
S&P 500 index inclusion
2012 Accomplishments
Manufacturing
•
Increased NGL cracking by
10% to 85% of North
American ethylene
production
•
Second half of the year,
North American ethylene
production exceeded
nameplate capacity
•
Completed two key
maintenance turnarounds at
two of our largest sites
•
Manufacturing achieved
multiple production records
Commercial
•
All major expansion
projects on schedule
•
Defined next phase of
ethylene expansions
•
Advanced European
restructuring and
optimization
•
Signed China Propylene
Oxide joint venture MOU
Record Results, continued progress made across the company
($ in millions)
Overall
•
Record earnings
•
89%
total
return
vs.
13%
for
S&P 500
(1)
•
Outstanding HSE
performance
•
Normalized fixed costs
managed flat since 2009
•
Ceased operations at the
Berre refinery
1)
Based
on
CapIQ
dividend
adjusted
beginning
and
closing
prices
for
2012.
2)
Dividend Yield data means the total 2012 dividends divided by the company market
capitalization. The market cap is calculated based on December 31, 2012 closing stock price and approximately 577 million outstanding shares.
6
Segment EBITDA
2011 EBITDA
2012 EBITDA
Y-o-Y Change
Y-o-Y Change, %
Olefins & Polyolefins - Americas
$2,140
$2,963
$823
38%
Olefins & Polyolefins - EAI
894
561
(333)
-37%
Intermediates & Derivatives
1,392
1,653
261
19%
Refining
977
481
(496)
-51%
Technology
214
197
(17)
-8%
Total
$5,585
$5,856
$271
5% |
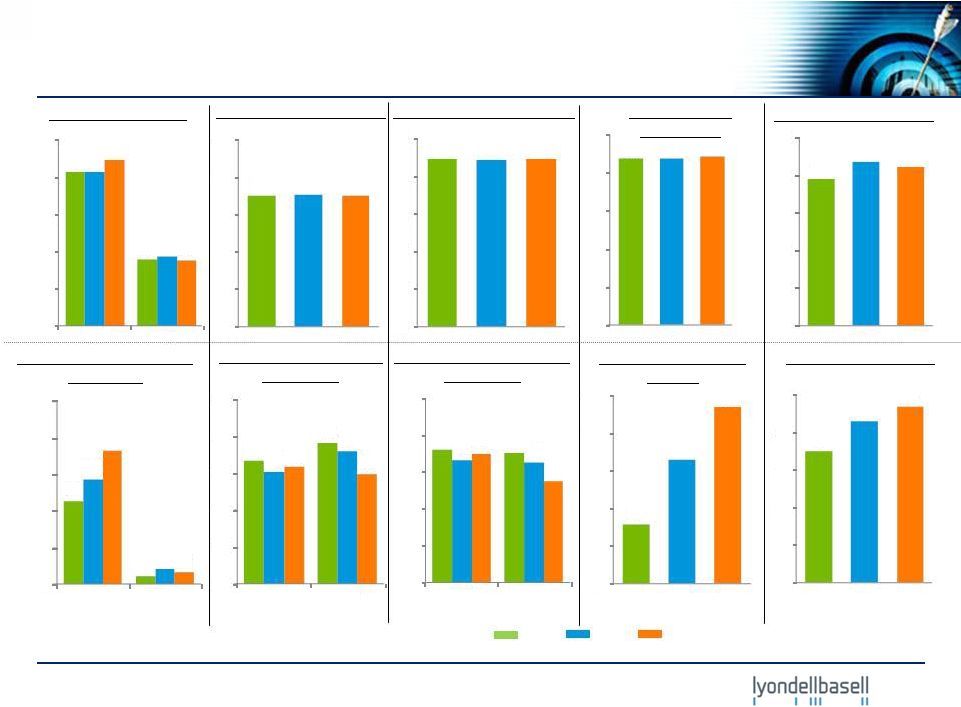 lyondellbasell.com
Key
Volumes
and
Margins:
2010
-
2012
HRO Crude Oil Rates
Polyethylene Volumes
Polypropylene Volumes
Maya 2-1-1 Spreads
Indexed Polyethylene
Spreads
(3)
Indexed Polypropylene
Spreads
(3)
Ethylene Volumes
Indexed Ethylene Cash
Margins
(2)
2010
2011
I&D Chemical
Volumes
(1)
MTBE Raw Material
Margin
MBPD
($/bbl)
billion lbs
billion lbs
billion lbs
billion lbs
(Cents/gal)
7
2012
1) I&D volumes exclude oxyfuels
2) EU ethylene cash margins normalized to 2009 US margins. 2009 indexed margin is
equal to 1.0 3) Polyethylene and Polypropylene spreads indexed to 2009;
2009 indexed margins are equal to 1.0 10.6
10.5
10.7
0
2
5
7
10
12
236
263
255
0
60
120
180
240
300
9.0
8.9
9.0
0
2
4
6
8
10
10.5
10.6
10.6
0
3
6
9
12
15
8.4
3.6
8.4
3.7
9.0
3.5
0
2
4
6
8
10
US
EU
2.3
0.2
2.9
0.5
3.7
0.3
0
1
2
3
4
5
US
EU
1.0
1.2
0.9
1.1
1.0
0.9
0.0
0.3
0.6
0.9
1.2
1.5
US
EU
1.1
1.1
1.0
1.0
1.1
0.8
0.0
0.3
0.6
0.9
1.2
1.5
US
EU
40
83
118
0
25
50
75
100
125
18
22
24
0
5
10
15
20
25 |
 lyondellbasell.com
FY 2012 EBITDA
Fourth-Quarter 2012 and FY 2012 Segment EBITDA
Fourth-Quarter 2012 EBITDA
($ in millions)
($ in millions)
8
Q4’12 EBITDA
$1,289 million
Q4’12 Operating Income
$959 million
FY 2012 EBITDA
$5,856 million
FY 2012 Operating Income
$4,676 million
150
300
450
600
750
$900
Olefins &
Polyolefins -
Americas
Olefins &
Polyolefins -
EAI
Intermediates
& Derivatives
Refining
Technology
500
1,000
1,500
2,000
2,500
$3,000
Olefins &
Polyolefins -
Americas
Olefins &
Polyolefins -
EAI
Intermediates
& Derivatives
Refining
Technology |
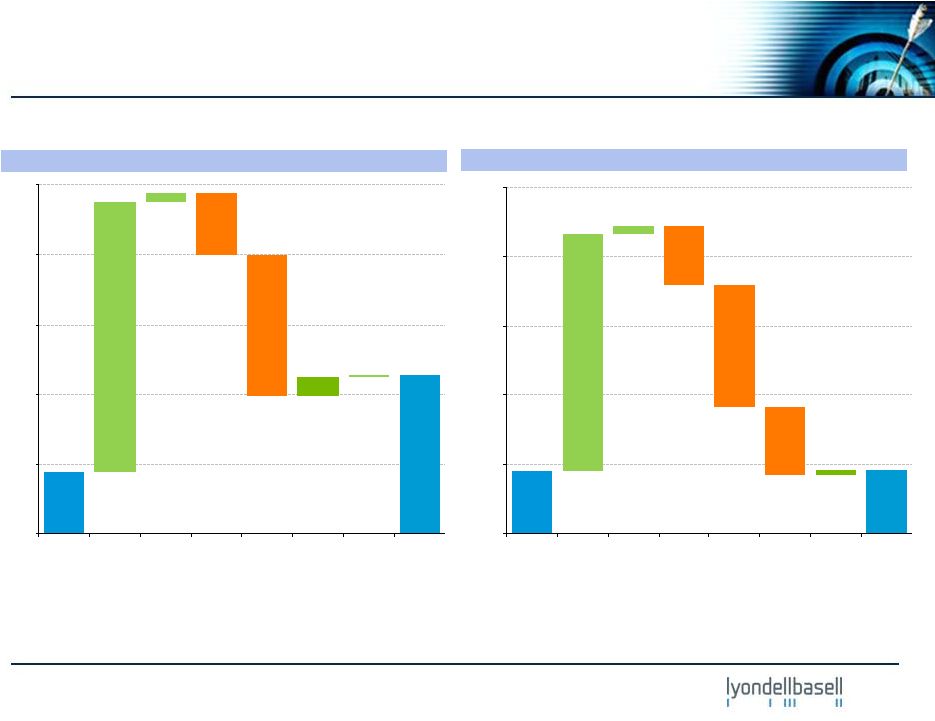 lyondellbasell.com
$2,711
$2,732
0
3,000
6,000
9,000
12,000
$15,000
May 2010
Begin.
Cash
Balance
CF from
Operations
excl.
Working
Capital
Working
Capital
Changes
Capex
Dividends
Net Debt
Repayment
Other
2012
Ending
Cash
Balance
$1,065
$2,732
0
1,200
2,400
3,600
4,800
$6,000
2012
Beginning
Cash
Balance
CF from
Operations
excl.
Working
Capital
Working
Capital
Changes
Capex
Dividends
Net Debt
Repayment
Other
2012
Ending
Cash
Balance
1) Beginning and ending cash balance includes cash and cash equivalents; 2)
Includes inventories, accounts payable and accounts receivable; 3) Includes capital and maintenance
turnaround spending.
(3)
(2)
(1)
($ in millions)
(2)
(1)
FY 2012
May 2010 –
December 2012
(3)
(1)
9
(1)
Cash Flow |
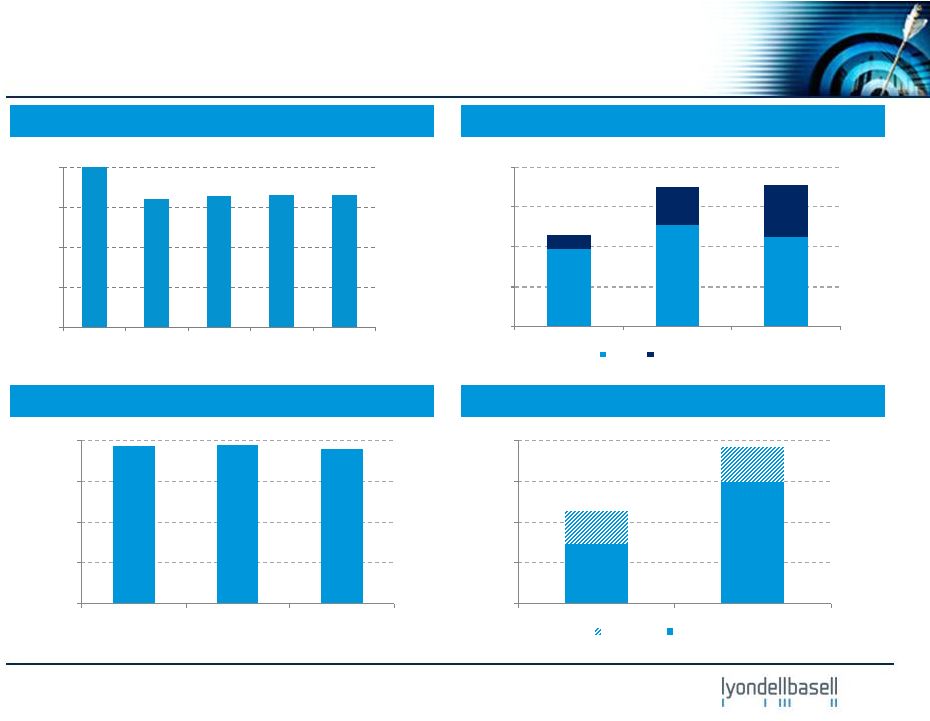 lyondellbasell.com
0
300
600
900
$1,200
2010
2011
2012
Base
Growth
10
Indexed
Cash
Fixed
Cost
(1)
Working
Capital
(2)
Capital Expenditures
Free
Cash
Flow
(3)
Working Capital and Key Financial Statistics
0
1,500
3,000
4,500
$6,000
2010
2011
2012
($ in millions)
($ in millions)
($ in millions)
0
1,250
2,500
3,750
$5,000
2011
2012
Capex
Free Cash Flow
1) Cash fixed costs include costs related to compensation, travel, insurance, third
party services, maintenance, marketing, selling, and administration; 2) Figures depicted represent
end
of
year
balances;
3)
Free
Cash
Flow
=
net
cash
provided
by
operating
activities
–
capex
0%
25%
50%
75%
100%
2008
2009
2010
2011
2012
(2008 index = 100%) |
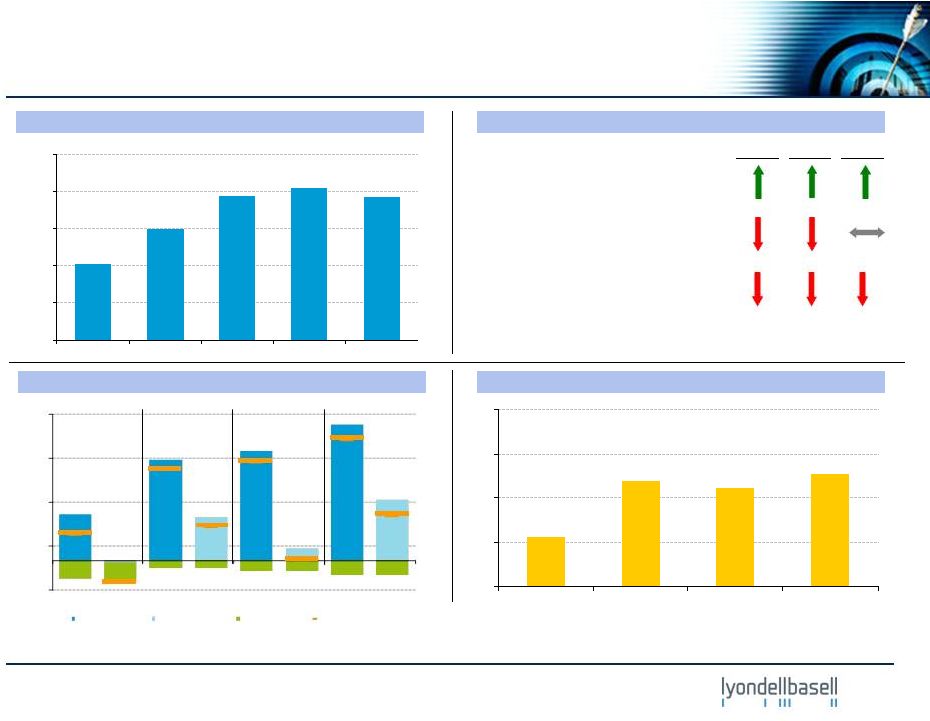 lyondellbasell.com
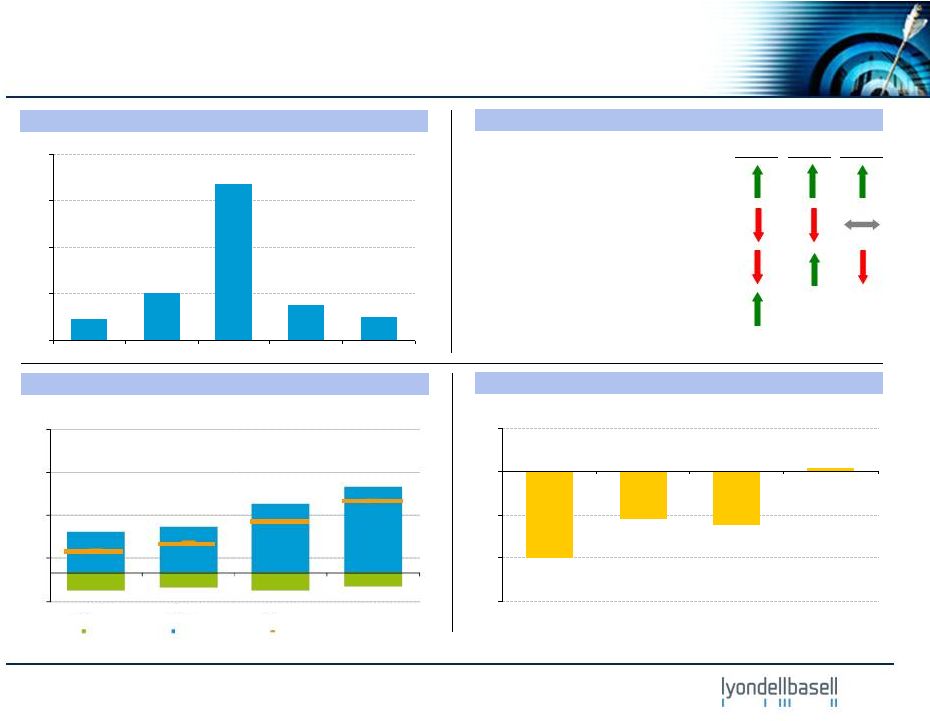
Olefins & Polyolefins -
Americas
Highlights and Business Drivers -
4Q’12
U.S. Olefins
•
100% capacity utilization
•
Margin up driven by higher ethylene
price
Polyethylene
•
Volumes relatively steady
•
Spread down 1¢/lb
Polypropylene (includes Catalloy)
•
Volumes down ~ 6%
•
Spread down 1¢/lb
Ethylene Chain Margins (per IHS)
EBITDA
(1)
Performance vs. 3Q’12
Polypropylene Margins (per IHS)
EBITDA
Margin
Volume
($ in millions)
(cents / lb)
(cents / lb)
11
1) Q3’12 EBITDA includes a $71 million non-cash LCM reversal of Q2’12
LCM inventory valuation adjustment. Q2’12 results include $29 million proceeds from hurricane
insurance settlement. Q1’12 and Q3’12 include $10 million each in
dividends from Indelpro joint venture. (1)
0
1
2
3
4
4Q'11
3Q'12
4Q'12
Jan'13
0
200
400
600
800
$1,000
4Q'11
1Q'12
2Q'12
3Q'12
4Q'12
(10)
5
20
35
50
4Q’11
3Q’12
4Q’12
Jan’13
Ethane Margin
Naphtha Margin
HDPE Margin
Ethylene/HDPE Chain |
 lyondellbasell.com
EBITDA
Margin
Volume
100
200
300
$400
4Q'11
1Q'12
2Q'12
3Q'12
4Q'12
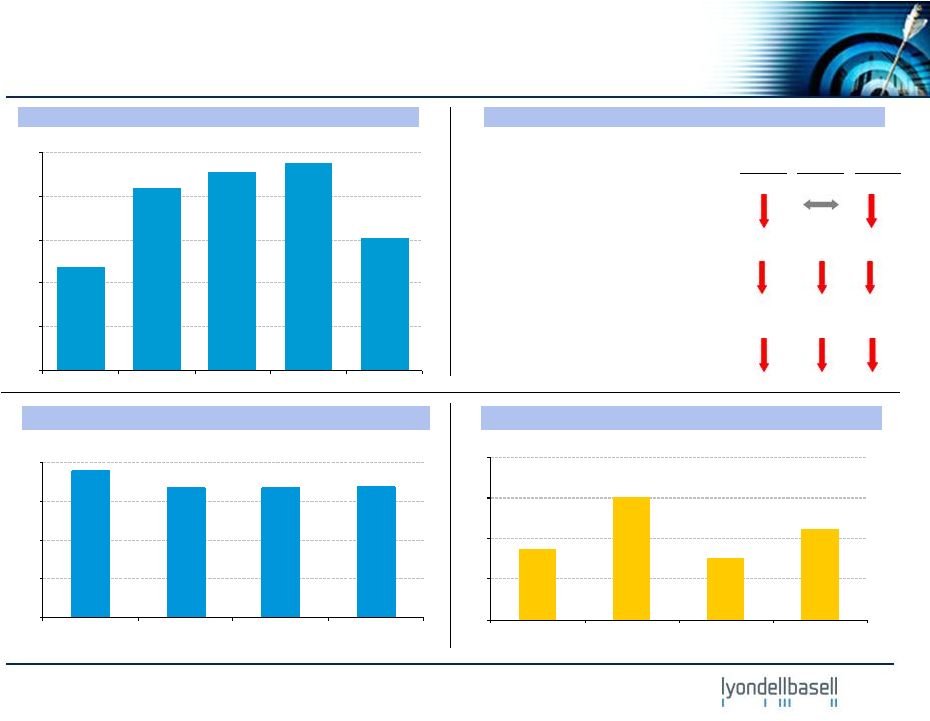
Olefins & Polyolefins -
Europe, Asia, International
Highlights and Business Drivers -
4Q’12
EU Olefins
•
Margin near breakeven
•
Completed Wesseling turnaround
Polyethylene
•
Volumes relatively unchanged
Polypropylene (includes Catalloy)
•
Volumes down ~ 4%
JV dividends
•
Equity income relatively unchanged
•
$50 million in dividends received
European Ethylene Chain Margins (per IHS)
EBITDA
Performance vs. 3Q’12
European Polypropylene Margins (per IHS)
($ in millions)
(cents / lb)
(cents / lb)
12
(6)
(4)
(2)
0
2
4Q'11
3Q'12
4Q'12
Jan'13
(10)
5
20
35
50
4Q'11
3Q'12
4Q'12
Jan'13
HDPE Margin
Naphtha Margin
Ethylene/HDPE Chain |
 lyondellbasell.com
0
11
22
33
44
4Q11
3Q12
4Q12
1Q13 E
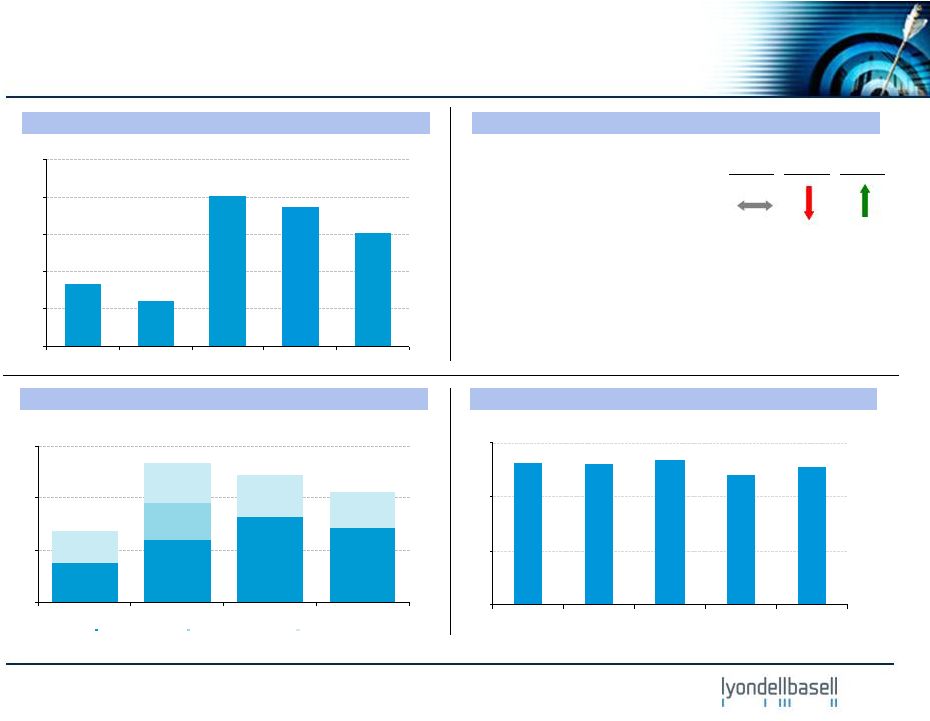
Intermediates & Derivatives
Highlights and Business Drivers -
4Q’12
EBITDA
Propylene Oxide and Derivatives
•
Seasonal impact on volumes
•
Slow aircraft deicer sales
Intermediates
•
Seasonal impact on volumes and C4
chemical margins
Oxyfuels
EBITDA
Margin
Volume
Performance vs. 3Q’12
($ in millions)
13
EU MTBE Raw Material Margins (per Platts)
(cents / gallon)
P-Glycol Raw Material Margins (per Chemdata)
(cents / lb)
0
50
100
150
200
4Q'11
3Q'12
4Q'12
Jan'13
100
200
300
400
$500
4Q'11
1Q'12
2Q'12
3Q'12
4Q'12
•
Seasonal impact on volumes and
gasoline to butane spread |
 lyondellbasell.com
0
100
200
300
4Q'11
1Q'12
2Q'12
3Q'12
4Q'12
0
10
20
30
4Q'11
3Q'12
4Q'12
Jan'13
Lt-Hvy
Lt-Gasoline
Lt-Heating Oil
40
80
120
160
$200
4Q'11
1Q'12
2Q'12
3Q'12
4Q'12
Refining Highlights and Business Drivers -
4Q’12
Houston Refinery
•
Underlying EBITDA is relatively
unchanged
•
Q4 crude throughput: 255 MBPD;
refinery operational limitations
•
Maya 2-1-1: $24.36 per bbl
Refining Spreads (per Platts)
(2)
EBITDA
(1)
Performance vs. 3Q’12
EBITDA
Margin
Volume
($ in millions)
($ / bbl)
1) Q3’12 includes $24 million of restitution while Q2’12 includes
$53 million of hurricane insurance settlement; Underlying EBITDA is relatively unchanged exclusive of these items.
2) Light Louisiana Sweet (LLS) is the referenced light crude.
14
HRO Operating Rate
(MBPD)
(1) |
 lyondellbasell.com
–
Benefitting from low ethane and propane
costs, increasing co-product values
–
Positive momentum building in:
•
U.S. ethylene, propylene, and polyethylene
–
European olefins chain remains weak
–
Houston refinery and I&D turnarounds in
the first quarter
–
Growth projects remain on schedule
15
Fourth-Quarter Summary and Outlook
–
Strong U.S. Olefins results
•
Continued U.S. NGL advantage
–
Business declines driven by seasonal
effects such as:
•
Lower oxyfuels margins
•
Lower polyolefin and I&D volumes
–
Minimal EBITDA generated in:
•
European olefins and commodity
polyolefins
–
Dividends
•
Paid $2.75 per share special dividend in
addition to interim dividend of $0.40 per
share
Fourth-Quarter Summary
Near-term Outlook |
 lyondellbasell.com
Save the Date
16
Save the Date!
We cordially invite you to attend LyondellBasell's Investor Day on March 13,
2013, in New York. At this half-day session, you will have an
opportunity to interact with members of our leadership team and get an
update on current results, near-term outlook and long-term plans
for profitable growth. We hope you can join us to learn more about how we
are seizing the moment to secure our future success.
LOCATION
New York Marriott Marquis
Astor Ballroom
1535 Broadway,
New York, NY
10036
Invitation and additional information to follow. |