Attached files
| file | filename |
|---|---|
| 8-K - FORM 8-K - FIRST MARBLEHEAD CORP | form8k.htm |
Exhibit 99.1

ASF 2013 Presentation
January 28 - 30, 2013

ASF 2013 Investor Presentation - *
Forward-Looking Statements
Statements in this presentation regarding First Marblehead’s strategy and the characteristics, pricing or performance of future Monogram®-based private
education loan portfolios, and our expectations as to future financial success, as well as any other statements in this presentation that are not purely historical,
constitute forward-looking statements for purposes of the safe harbor provisions of The Private Securities Litigation Reform Act of 1995. These forward-looking
statements are based on our historical performance and on our plans, estimates and expectations as of January 28, 2013. The inclusion of this forward-looking
information should not be regarded as a representation by us or any other person that the future results, plans, estimates and expectations expressed or
implied by us will be achieved. You are cautioned that matters subject to forward-looking statements involve known and unknown risks and uncertainties,
including economic, legislative, regulatory, competitive and other factors, which may cause our actual financial or operating results, facilitated loan volumes and
resulting cash flows or financing-related revenues, or the timing of events, to be materially different than those expressed or implied by our forward-looking
statements. Important factors that could cause or contribute to such differences include: market acceptance of, and demand for, our Monogram platform and
fee-based service offerings, including our success in negotiating loan program agreements with additional clients; the successful sales and marketing of
Monogram-based loan offerings, including the volume of loan applications and the extent to which loan applications ultimately result in disbursed loans; the
volume, timing and performance of disbursed loans; the size and structure of any credit enhancement provided by us in connection with our Monogram
platform; our success in designing, implementing and commercializing private education loan programs through Union Federal Savings Bank, including receipt of
and compliance with regulatory approvals and conditions with respect to such programs; capital market conditions and our ability to structure securitizations or
alternative financings; the size, structure and timing of any such securitizations or alternative financings; any investigation, audit, claim, regulatory action or
suit relating to the transfer of the trust certificate of NC Residuals Owner Trust or the asset services agreement between the purchaser and us, including any
challenge to tax refunds previously received as a result of the audit being conducted by the Internal Revenue Service; resolution of litigation and regulatory
proceedings pertaining to our Massachusetts state income tax returns; the estimates and assumptions we make in preparing our financial statements, including
quantitative and qualitative factors used in determining the estimate of the fair value of service revenue receivables; and the other factors set forth under the
caption "Part II - Item 1A. Risk Factors" in our quarterly report on Form 10-Q filed with the Securities and Exchange Commission on November 8, 2012.
Important factors that could cause or contribute to future adjustments to the estimates and assumptions we make in preparing our financial statements include:
actual transactions or market observations relating to asset-backed securities, loan portfolios or corporate debt securities; variance between our performance
assumptions and the actual performance of the loan portfolios held by the GATE Trusts, Union Federal Savings Bank or our clients (the "Portfolios"); economic,
legislative, regulatory, competitive and other factors affecting discount, default, recovery and prepayment rates on the Portfolios, including general economic
conditions, the consumer credit environment and unemployment rates; management's determination of which qualitative and quantitative factors should be
weighed in our estimates, and the weight to be given to such factors; capital markets receptivity to securities backed by private education loans; and interest
rate trends. We specifically disclaim any obligation to update any forward-looking statements as a result of developments occurring after January 28, 2013,
even if our estimates change, and you should not rely on those statements as representing our views as of any date subsequent to January 28, 2013.
Disclaimer
The information in this presentation is intended to provide a broad overview of a portfolio of private education loans previously facilitated by First Marblehead.
Neither First Marblehead nor any other party is offering any securities by making this presentation or soliciting any action based upon the information provided.
Nothing in this presentation should be relied upon as a representation by First Marblehead, or any other person, as to the future performance of any securities
that may be issued in the future. The information contained herein is intended to be illustrative only, and historical collateral pools may not be representative of
any future collateral pool.

ASF 2013 Investor Presentation - *
Section I
FMD Corporate Overview
Section II
UFSB Monogram® Portfolio Overview
TABLE OF CONTENTS
ASF 2013 Investor Presentation - *
Section I
FMD Corporate Overview

ASF 2013 Investor Presentation - *
Who We Are
v Leading provider of education finance solutions offering a complete and integrated
suite of outsourced services for private student loans
suite of outsourced services for private student loans
v Operate the credit-based Monogram platform—provides customizable loan programs
and portfolio management services, and exceptional application disclosures
and portfolio management services, and exceptional application disclosures
v Industry expert having processed over 6 million loan applications, funded $17b of
loans and executed 38 asset-backed securitizations
loans and executed 38 asset-backed securitizations
v Target responsible students and families at high quality schools
v Operate Cology LLC, a leading provider of end-to-end private student loan processing
solutions for credit unions
solutions for credit unions
v Operate TMS, a tuition payment plan provider serving over 700 schools and more
than 250,000 families
than 250,000 families
v Offer an array of personal banking products and services, including private student
loans, through our federally chartered thrift, Union Federal Savings Bank
loans, through our federally chartered thrift, Union Federal Savings Bank
v Founded in 1991; Publicly held (NYSE:FMD) since 2003
v Headquartered in Boston, MA
“The right loans for the right borrowers at the right schools for the right educations.”

ASF 2013 Investor Presentation - *
Diversified Revenue Sources
v Private Student Loan Origination
• Union Federal offers traditional higher education and K-12 loan programs nationally; earns net
interest margin by holding loans to term
interest margin by holding loans to term
v Partnered Lending
• Provide customized loan programs to lender clients; earn up-front fees for loan origination
and marketing; can earn a share of ongoing borrower interest income in exchange for
providing credit enhancement and portfolio management
and marketing; can earn a share of ongoing borrower interest income in exchange for
providing credit enhancement and portfolio management
v Capital Markets
• Long-term financing solutions for FMD-facilitated loan programs; earn ongoing fees for
portfolio management; earn net interest margin by retaining residual interests
portfolio management; earn net interest margin by retaining residual interests
v Fee-For-Service
• Services provided through Cology LLC, and in our Private Student Loan Origination, Partnered
Lending, and Capital Markets businesses available on an a la carte basis
Lending, and Capital Markets businesses available on an a la carte basis
v Tuition Payment Plans
• Offer schools a suite of outsourced billing, payment processing, refund management and
education payment counseling products and services from TMS
education payment counseling products and services from TMS

ASF 2013 Investor Presentation - *
Monogram Platform Incorporates FMD’s Core Competencies to
Source the Best Credits
Source the Best Credits
v Targeting and approving only higher
credit quality applicants
credit quality applicants
• Our Monogram platform’s underwriting
characteristics are derived from extensive
private student loan performance database
characteristics are derived from extensive
private student loan performance database
v Granular risk segmentation allows for
better risk-based pricing
better risk-based pricing
• Depth of credit risk knowledge used to
optimize profitability and manage risk
optimize profitability and manage risk
v Schools involved in loan process
• Schools certify student enrollment and
loan amount and receive funds directly
loan amount and receive funds directly
v Monitor results
• Daily review of actual portfolio distribution
• Flexible program design allows FMD to
adapt student loan product to meet
market needs in a timely manner
adapt student loan product to meet
market needs in a timely manner

ASF 2013 Investor Presentation - *
Section II
UFSB Monogram® Portfolio Overview

ASF 2013 Investor Presentation - *
UFSB Monogram Portfolio Highlights
(as of December 31, 2012)
v Current principal balance: $46.4 million
v Current accrued interest balance: $1.2 million
v Weighted average interest rate: one month LIBOR + 5.95%
v Percent cosigned: 92%
v Percent cash-flowing: 58%
v Percent school certified: 100%; all loan proceeds disbursed directly to school
v Weighted average FICO score: 750
v Percent homeownership:1 79%
v Average age of oldest trade line:1 20 years
v Average number of satisfactory trade lines opened for > 6 months:1 11
v Projected cumulative default rate: 6.5%
v Projected portfolio weighted average life: 5.6 years
1”Percent homeownership”: represents percentage of loans where either the borrower or cosigner (if applicable) is a homeowner; “Average age of oldest trade line” and “Average
number of satisfactory trade lines opened for > 6 months” use the higher of borrower or cosigner (if applicable). Source: December 31, 2012 servicer and origination data
number of satisfactory trade lines opened for > 6 months” use the higher of borrower or cosigner (if applicable). Source: December 31, 2012 servicer and origination data

ASF 2013 Investor Presentation - *
Underwriting Guidelines Reflect Market Demands
v Applicant(s) must pass initial knock-out criteria, including:
• Sufficient credit history
• No excessive or multiple delinquencies
• Acceptable performance on previous student loans
• No severely negative credit events such as bankruptcy
v Minimum FICO scores required
v Minimum threshold on First Marblehead proprietary risk score
v Proof of positive income and employment required
v U.S. citizen/permanent residency required
v Student must be age of majority at time of application
v Student must be enrolled at least half-time during current academic year
v School must be approved public or private, not-for-profit degree-granting institution
v Loan amount cannot exceed the school certified cost of education less any financial aid

ASF 2013 Investor Presentation - *
UFSB Monogram Portfolio Stratification
as of December 31, 2012
|
Top School Stratification (by volume)
|
||
|
School Name:
|
Current Principal
Balance: |
% of Total:
|
|
Drexel University
|
$724,922
|
1.6%
|
|
Ohio State University - Columbus
|
$683,450
|
1.5%
|
|
Pennsylvania State University
|
$574,591
|
1.2%
|
|
Temple University
|
$533,777
|
1.2%
|
|
Virginia Commonwealth University
|
$531,956
|
1.1%
|
|
Arizona State University
|
$526,719
|
1.1%
|
|
University Of Massachusetts - Amherst
|
$497,579
|
1.1%
|
|
Boston University
|
$468,711
|
1.0%
|
|
University Of California - Davis
|
$355,119
|
0.8%
|
|
Depaul University
|
$307,320
|
0.7%
|
|
OTHERS:
|
$41,172,549
|
88.8%
|
|
TOTALS:
|
$46,376,693
|
100.0%
|
|
School Type Stratification
|
||
|
School Type:
|
Current Principal
Balance: |
% of Total:
|
|
4 Year Private College
|
$20,991,983
|
45.3%
|
|
4 year Public College
|
$22,073,839
|
47.6%
|
|
OTHERS:
|
$3,310,871
|
7.1%
|
|
TOTALS:
|
$46,376,693
|
100.0%
|
|
Program Type Stratification
|
||
|
Program Type:
|
Current Principal
Balance: |
% of Total:
|
|
Graduate
|
$4,413,872
|
9.5%
|
|
Undergraduate
|
$41,962,821
|
90.5%
|
|
TOTALS:
|
$46,376,693
|
100.0%
|
|
Top Borrower State Stratification
|
||
|
Borrower State:
|
Current Principal
Balance: |
% of Total:
|
|
California
|
$4,761,881
|
10.3%
|
|
New York
|
$4,318,907
|
9.3%
|
|
Pennsylvania
|
$4,050,221
|
8.7%
|
|
Massachusetts
|
$3,556,999
|
7.7%
|
|
Illinois
|
$2,976,368
|
6.4%
|
|
New Jersey
|
$2,945,271
|
6.4%
|
|
Ohio
|
$2,379,862
|
5.1%
|
|
Texas
|
$2,062,747
|
4.4%
|
|
Michigan
|
$1,556,622
|
3.4%
|
|
Virginia
|
$1,356,420
|
2.9%
|
|
OTHERS:
|
$16,411,396
|
35.4%
|
|
TOTALS:
|
$46,376,693
|
100.0%
|
Source: December 31, 2012 servicer and origination data

ASF 2013 Investor Presentation - *
UFSB Monogram Portfolio Stratification
as of December 31, 2012
|
Repayment Margin Stratification
|
||
|
Repayment Margin:
|
Current Principal
Balance: |
% of Total:
|
|
Less than 3.0%
|
$544,862
|
1.2%
|
|
3.0% - 3.5%
|
$1,579,877
|
3.4%
|
|
3.5% - 4.0%
|
$3,701,844
|
8.0%
|
|
4.0% - 4.5%
|
$4,388,198
|
9.5%
|
|
4.5% - 5.0%
|
$5,531,436
|
11.9%
|
|
5.0% - 5.5%
|
$2,818,772
|
6.1%
|
|
5.5% - 6.0%
|
$4,561,261
|
9.8%
|
|
6.0% - 6.5%
|
$4,472,956
|
9.6%
|
|
6.5% - 7.0%
|
$4,860,491
|
10.5%
|
|
7.0% - 7.5%
|
$5,441,104
|
11.7%
|
|
7.5% - 8.0%
|
$3,549,760
|
7.7%
|
|
8.0% - 8.5%
|
$3,148,662
|
6.8%
|
|
Greater than 8.5%
|
$1,777,471
|
3.8%
|
|
TOTALS:
|
$46,376,693
|
100.0%
|
|
Current Principal Stratification
|
||
|
Segment:
|
Current Principal
Balance: |
% of Total:
|
|
Less than $5,000
|
$4,904,070
|
10.6%
|
|
$5,000 - $7,500
|
$6,430,834
|
13.9%
|
|
$7,500 - $10,000
|
$6,673,154
|
14.4%
|
|
$10,000 - $12,500
|
$6,582,083
|
14.2%
|
|
$12,500 - $15,000
|
$4,568,698
|
9.9%
|
|
$15,000 - $17,500
|
$4,346,733
|
9.4%
|
|
$17,500 - $20,000
|
$2,858,300
|
6.2%
|
|
$20,000 - $22,500
|
$2,416,077
|
5.2%
|
|
$22,500 - $25,000
|
$2,192,148
|
4.7%
|
|
Greater than $25,000
|
$5,404,597
|
11.7%
|
|
TOTALS:
|
$46,376,693
|
100.0%
|
|
Repayment Type Stratification
|
||
|
Repayment Type:
|
Current Principal
Balance: |
% of Total:
|
|
Full Deferment
|
$19,628,393
|
42.3%
|
|
Immediate Repay
|
$6,999,027
|
15.1%
|
|
Interest Only
|
$10,616,989
|
22.9%
|
|
Partial Interest
|
$9,132,284
|
19.7%
|
|
TOTALS:
|
$46,376,693
|
100.0%
|
|
Repayment Term Stratification
|
||
|
Repayment Term:
|
Current Principal
Balance: |
% of Total:
|
|
5 Years
|
$13,203,406
|
28.5%
|
|
10 Years
|
$18,452,647
|
39.8%
|
|
15 Years
|
$14,720,641
|
31.7%
|
|
TOTALS:
|
$46,376,693
|
100.0%
|
Source: December 31, 2012 servicer and origination data
ASF 2013 Investor Presentation - *
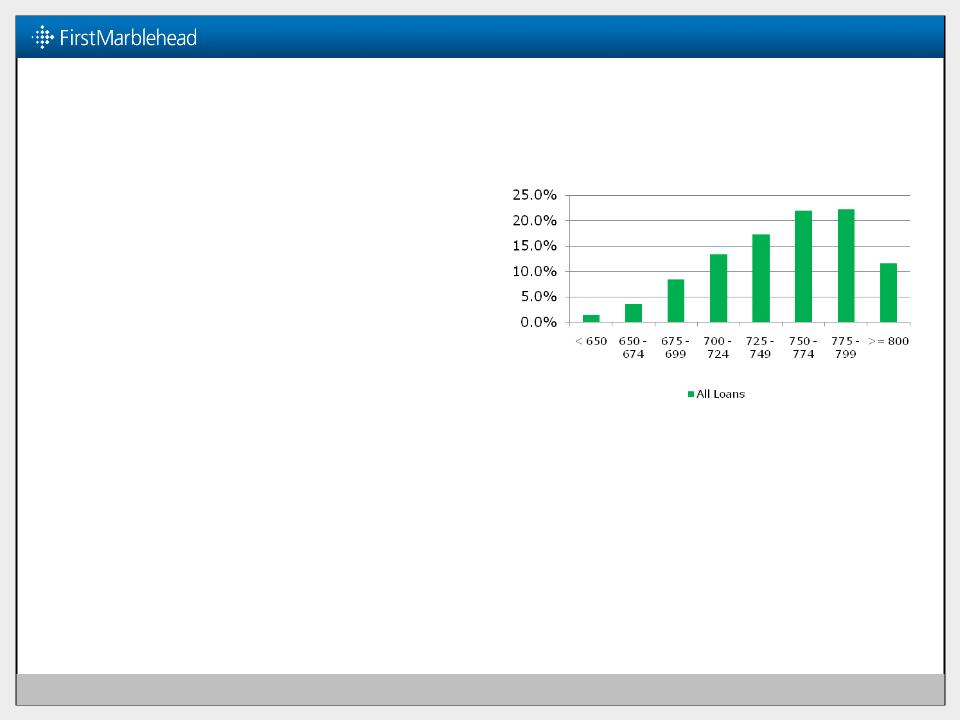
UFSB Monogram Portfolio Stratification
as of December 31, 2012
|
All Loans FICO Score Stratification
|
||
|
FICO Score Range:
|
Current Principal
Balance: |
% of Total:
|
|
< 650
|
$666,089
|
1.4%
|
|
650 - 674
|
$1,690,226
|
3.6%
|
|
675 - 699
|
$3,900,098
|
8.4%
|
|
700 - 724
|
$6,179,617
|
13.3%
|
|
725 - 749
|
$8,025,600
|
17.3%
|
|
750 - 774
|
$10,215,620
|
22.0%
|
|
775 - 799
|
$10,314,900
|
22.2%
|
|
>= 800
|
$5,384,542
|
11.6%
|
|
TOTALS:
|
$46,376,693
|
100.0%
|
FICO Score Stratification Chart
Source: December 31, 2012 servicer and origination data

ASF 2013 Investor Presentation - *
UFSB Monogram Portfolio Performance: Delinquency Rate
Nine month period ending December 31, 2012
1Delinquency rate on loans in repayment, including loans requiring interest only payments or partial interest payments during in-school period. Source: servicer data
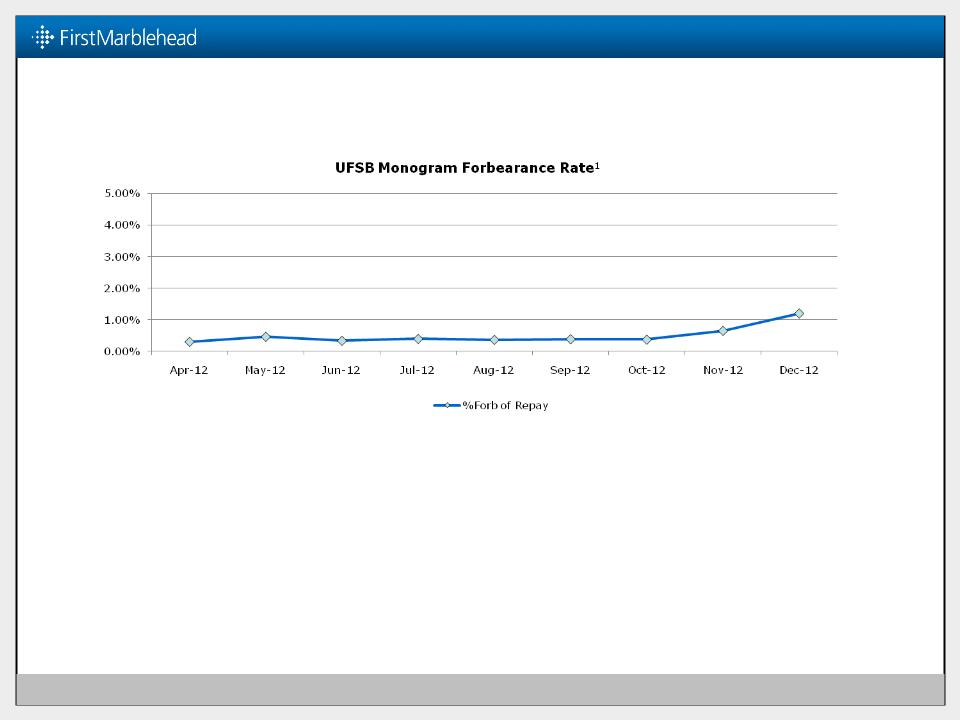
ASF 2013 Investor Presentation - *
UFSB Monogram Portfolio Performance: Forbearance Rate
Nine month period ending December 31, 2012
1Forbearance rate on loans in repayment, including loans requiring interest only payments or partial interest payments during in-school period. Source: servicer data

ASF 2013 Investor Presentation - *
UFSB Monogram Portfolio Performance: Prepayment Rate
Nine month period ending December 31, 2012
Source: servicer data

ASF 2013 Presentation
January 28 - 30, 2013