Attached files
| file | filename |
|---|---|
| 8-K - FORM 8-K - HANCOCK WHITNEY CORP | d472558d8k.htm |
Exhibit 99.1

For Immediate Release
January 24, 2013
For More Information
Trisha Voltz Carlson
SVP, Investor Relations Manager
504.299.5208
trisha.carlson@hancockbank.com
Hancock reports fourth quarter 2012 financial results
Results include impact of a bulk loan sale and associated loan loss provision
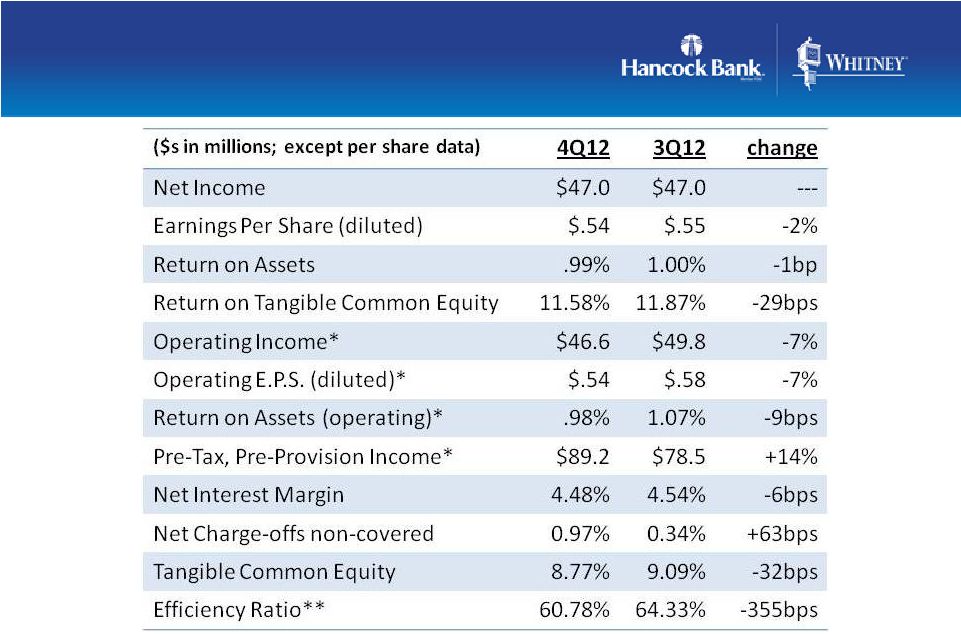
GULFPORT, Miss. (January 24, 2013)—Hancock Holding Company (Nasdaq: HBHC) today announced financial results for the fourth quarter of 2012. Net income for the fourth quarter of 2012 was $47.0 million, or $.54 per diluted common share, compared to $47.0 million, or $.55, in the third quarter of 2012. Net income was $19.0 million, or $.22, in the fourth quarter of 2011. Pre-tax earnings for the third and fourth quarters of 2012 included no merger-related costs. The fourth quarter of 2011 included pre-tax merger-related costs of $40.2 million.
Included in the Company’s fourth quarter of 2012 results are:
| • | A $13.7 million pre-tax, or $.10 per diluted common share, loan loss provision expense related to a bulk sale of loans with a net book value of approximately $40 million (details included in the asset quality discussion). The sale was completed near the end of the year. |
| • | Approximately $3.2 million, or $.04 per diluted common share, of one-time tax benefits mainly related to specific tax credits. |
| • | Approximately $.6 million of pre-tax securities transactions gains. |
| • | Realization of remaining cost synergies related to the Whitney acquisition. |
Return on average assets was 0.99% for the fourth quarter of 2012, compared to 1.00% in the third quarter of 2012, and 0.39% in the fourth quarter a year ago.
Operating income for the fourth quarter of 2012 was $46.6 million or $.54 per diluted common share, compared to $49.8 million, or $.58, in the third quarter of 2012. Operating income was $45.1 million, or $.53, in the fourth quarter of 2011. Operating income is defined as net income excluding tax-effected merger-related costs and securities transactions gains or losses. In addition, for the third quarter of 2012, operating income excluded the tax-effected expenses associated with the repurchase of a portion of Whitney Bank’s subordinated debt (sub debt). Included in the financial tables is a reconciliation of net income to operating income.
- 1 -
Hancock reports fourth quarter 2012 financial results
January 24, 2013
Hancock’s return on average assets, on an operating basis, was 0.98% for the fourth quarter of 2012, compared to 1.07% in the third quarter of 2012, and 0.93% in the fourth quarter a year ago.
The Company’s pre-tax, pre-provision profit for the fourth quarter of 2012 was $89.2 million compared to $78.5 million in the third quarter of 2012 and $76.5 million in the fourth quarter of 2011. Pre-tax pre-provision profit is total revenue (TE) less non-interest expense and excludes merger-related costs, securities transactions gains or losses and the sub debt redemption expenses. Included in the financial tables is a reconciliation of net income to pre-tax, pre-provision profit.
“The bulk loan sale completed at year-end was a prudent and effective use of the Company’s strong capital position in reducing both nonperforming assets and the costs associated with carrying these assets,” said Hancock’s President and Chief Executive Officer Carl J. Chaney. “This quarter we also realized the full level of expense savings that we had targeted for the Whitney acquisition. Now that we have reached this milestone and completed the systems integration back in March, we are fully focused on our future as one strong consolidated company.”
Highlights & Key Operating Items from Hancock’s Fourth Quarter Results
Total assets were $19.5 billion at December 31, 2012, up $0.9 billion from September 30, 2012. The increase is mainly related to temporary sources of excess liquidity as noted in the deposit section below.
Loans
Total loans at December 31, 2012 were $11.6 billion, up $143 million, or 1%, from September 30, 2012. Excluding the FDIC-covered portfolio, which declined approximately $40 million during the fourth quarter, and excluding the reduction from the bulk loan sale of approximately $40 million, total loans were up $223 million, or approximately 2%, linked-quarter. This compares to an increase of $388 million, or 4%, during the third quarter of 2012.
New originated loans and refinancings of over $500 million were funded in markets throughout the company’s footprint from both existing and new customers, exceeding regularly scheduled payoffs and paydowns. The net loan growth was mainly generated in the commercial and industrial (C&I) portfolio, up 5% linked-quarter. While most markets across the Company’s footprint reported C&I growth, the most significant activity came from Louisiana and Houston. These two markets are home to a significant part of the Gulf Coast’s energy sector, which again contributed to the growth during the quarter. The Company’s energy portfolio totaled $905 million as of December 31, 2012, up from $758 million at September 30, 2012.
For the fourth quarter of 2012, average total loans were $11.5 billion, an increase of $284 million compared to the third quarter of 2012.
- 2 -
Hancock reports fourth quarter 2012 financial results
January 24, 2013
Deposits
Total deposits at December 31, 2012 were $15.7 billion, up $1.0 billion, or almost 7%, from September 30, 2012. Average deposits for the fourth quarter of 2012 were $15.1 billion, up $287 million, or 2%, from the third quarter of 2012.
Noninterest-bearing demand deposits (DDAs) totaled $5.6 billion at December 31, 2012, up $473 million, or 9%, compared to September 30, 2012. DDAs comprised 36% of total period-end deposits at December 31, 2012, up slightly from September 30, 2012.
Interest-bearing public fund deposits totaled $1.6 billion at year-end 2012, up $259 million, or 20%, linked-quarter. DDA and public fund deposits typically reflect higher balances at year-end with subsequent reductions beginning in the first quarter.
Time deposits (CDs) totaled $2.5 billion at December 31, 2012, up $78 million, or 3%, from September 30, 2012. During the fourth quarter, approximately $492 million of time deposits matured at an average rate of .38%, of which approximately $380 million renewed at an average cost of .18%. Additionally, in November of 2012, the Company issued $200 million in brokered CDs. These CDs were issued as a temporary liquidity source related to the year-end expiration of the FDIC Transaction Account Guarantee (TAG) Program. Half of the deposits issued were 3-month CDs with a cost of .50%. The remaining deposits were 6-month CDs issued at a cost of .65%. The Company has not experienced any material outflow of deposits as a result of the TAG expiration.
Asset Quality
At the end of 2012, the Company completed a bulk sale of loans with a net book value of approximately $40 million. Approximately $36 million of the loans sold were previously reported as nonperforming loans. The remaining $4 million of loans sold were acquired credit-impaired credits that were not reported as nonperforming loans under purchase accounting. The sale added $13.7 million to the provision for loan losses, and $16.2 million to net charge-offs in the fourth quarter of 2012. Specific reserves totaling $2.5 million had been previously recorded on loans included in the sale. The credits sold had a total of approximately $56 million in remaining contractual principal.
Non-performing assets (NPAs), which exclude acquired credit-impaired loans from Whitney and People’s First, totaled $256 million at December 31, 2012, down $42 million from $298 million at September 30, 2012. Non-performing assets as a percent of total loans, ORE and foreclosed assets was 2.19% at December 31, 2012, compared to 2.58% at September 30, 2012. The decrease in overall NPAs reflects both the impact of the bulk sale and a net reduction of $28.5 million in other real estate (ORE) properties during the fourth quarter.
The Company announced last quarter that it had approximately $60 million of ORE under sales contracts which were expected to close during the fourth quarter of 2012. Approximately 70% of the total dollar amount of ORE under contract closed during the fourth quarter. The remaining contracts, plus an additional $15 million in new sales contracts entered into during the fourth quarter, are expected to close in the first quarter of 2013.
- 3 -
Hancock reports fourth quarter 2012 financial results
January 24, 2013
Management will continue to evaluate the costs and benefits of additional nonperforming loan and ORE sale opportunities as part of its normal credit risk management process.
The Company’s total allowance for loan losses was $136.2 million at December 31, 2012, compared to $135.6 million at September 30, 2012. The ratio of the allowance to period-end loans was 1.18% at December 31, 2012, virtually unchanged from 1.19% at September 30, 2012. The allowance maintained on the originated portion of the loan portfolio totaled $78.8 million, or 1.11% of related loans, at December 31, 2012, down from $79.7 million, or 1.21%, at September 30, 2012. Excluding the reduction in specific reserves related to the bulk loan sale, the allowance on originated loans increased $1.6 million, primarily due to this quarter’s strong loan growth. A $.8 million allowance was established in the fourth quarter for acquired performing loans that have become impaired. The allowance for the third quarter of 2012 reflected a $1.6 million reduction, due primarily to charge-offs on impaired loans with specific reserves. The allowance ratio for originated loans is expected to decline as the proportion of this portfolio representing new, high quality business grows, other factors held constant.
Net charge-offs from the non-covered loan portfolio were $28.0 million, or .97% of average total loans on an annualized basis in the fourth quarter. Excluding the impact of the bulk sale noted above, non-covered net charge-offs for the fourth quarter of 2012 were $11.8 million, or .41% of average total loans, compared to $9.7 million, or .34% of average total loans, for the third quarter of 2012.
Hancock recorded a total provision for loan losses for the fourth quarter of 2012 of $28.1 million, up from $8.1 million in the third quarter of 2012. Excluding the impact of the bulk sale noted above, provision expense for the fourth quarter of 2012 was $14.4 million. The provision for non-covered loans, excluding the impact of the bulk sale, increased to $14.2 million in the fourth quarter of 2012 from $8.1 million in the third quarter of 2012. This increase reflects the $2.1 million higher level of net charge-offs in the current quarter and the allowance build activity noted above.
During the fourth quarter of 2012, the Company recorded a $4.0 million increase in the allowance for losses related to impairment of certain pools of covered loans, with a related increase of $3.8 million in the Company’s FDIC loss share indemnification asset. The net impact on provision expense from the covered portfolio was $.2 million in the fourth quarter, compared to no provision impact for the third quarter of 2012.
Net Interest Income
Net interest income (TE) for the fourth quarter of 2012 was $182.8 million, up from $180.1 million in the third quarter of 2012. Average earning assets were $16.2 billion in the fourth quarter of 2012, up $416 million from the third quarter of 2012.
- 4 -
Hancock reports fourth quarter 2012 financial results
January 24, 2013
The net interest margin (TE) was 4.48% for the fourth quarter of 2012, down 6 basis points (bps) from 4.54% in the third quarter of 2012. The core margin of 3.61% (reported net interest income (TE) excluding total net purchase accounting adjustments, annualized, as a percent of total earning assets) compressed approximately 14bps during the fourth quarter, mainly from a decline in both the core yield on the loan and the securities portfolios. The margin was favorably impacted by changes in the mix of earning assets and funding sources and a slight decline in funding costs.
Whitney’s acquired loan portfolio continued to perform better than expected during the fourth quarter. As a result, re-projections of expected cash flows from both the acquired and covered portfolios led to approximately $4 million of additional loan accretion during the fourth quarter of 2012. The increase favorably impacted both net interest income and the net interest margin. Changes in activity related to prepayments and payoffs in the acquired portfolio can cause quarterly accretion levels to be volatile.
As earning assets continue to reprice at lower rates, and with little opportunity to further lower funding costs, management expects continued compression in the core margin in the near term. All else equal, compression in the reported margin in the near term is also anticipated.
Non-interest Income
Non-interest income totaled $64.9 million for the fourth quarter of 2012, up from $63.8 million in the third quarter of 2012. Included in the fourth and third quarters of 2012, respectively, were $.6 million and $.9 million of securities transaction gains.
Service charges on deposits totaled $20.2 million for the fourth quarter of 2012, slightly down from $20.8 million in the third quarter of 2012.
Fees from secondary mortgage operations totaled $5.2 million for the fourth quarter of 2012, up $.8 million, or 20%, linked-quarter. The increase reflects a higher volume of mortgage production during the fourth quarter mainly related to refinancing activity.
The linked-quarter changes related to trust, insurance, and investment and annuity lines of business all reflect the volatility and seasonality of those lines of business.
Non-interest Expense & Taxes
Operating expense for the fourth quarter of 2012 totaled $157.9 million, down $6.5 million, or 4%, from the third quarter of 2012. Operating expense excludes merger-related costs and, for the third quarter of 2012, $5.3 million of sub debt repurchase expenses. There were essentially no merger-related costs in the fourth or third quarters of 2012.
Total personnel expense was $87.4 million in the fourth quarter of 2012, a decrease of $.8 million, or 1%, from the third quarter of 2012. The linked-quarter decrease mainly reflects the staff reductions associated with previously announced branch consolidations.
- 5 -
Hancock reports fourth quarter 2012 financial results
January 24, 2013
Other operating expense totaled $45.1 million, down $4.9 million from the third quarter of 2012. The linked-quarter decrease was mainly related to reductions in professional service expense, telephone and data processing expense, advertising expense and ORE expense.
Amortization of intangibles totaled $7.7 million during the fourth quarter, down from $8.1 million in the third quarter of 2012.
Operating expense, excluding amortization of intangibles, was $150.2 million for the fourth quarter of 2012. The Company had previously provided operating expense guidance for the fourth quarter of 2012 of $149 million to $153 million, excluding amortization of intangibles. The fourth quarter’s operating expense level reflects realization of 100% of the cost savings targeted with the Whitney acquisition. As in previous years, management expects total noninterest expense will increase in the first quarter of 2013 due to the seasonal nature of certain line items.
The effective income tax rate for the fourth quarter of 2012 was 20%, down from 26% in the third quarter of 2012. The linked-quarter decline is mainly related to additional new markets tax credits and historical rehabilitation tax credits added in the fourth quarter. Management expects the effective tax rate to approximate 26-28% in 2013. The effective income tax rate continues to be less than the statutory rate of 35%, due primarily to tax-exempt income and tax credits.
Capital
Common shareholders’ equity totaled $2.5 billion at December 31, 2012. The Company remained well-capitalized, and its tangible common equity (TCE) ratio of 8.77% remained strong at December 31, 2012. The linked-quarter decline in the TCE ratio of 32 bps was mainly related to the $0.9 billion increase in total assets. Additional capital ratios are included in the financial tables.
Conference Call and Slide Presentation
Management will host a conference call for analysts and investors at 9:00 a.m. Central Time Friday, January 25, 2013 to review the results. A live listen-only webcast of the call will be available under the Investor Relations section of Hancock’s website at www.hancockbank.com. A slide presentation related to fourth quarter results is also posted as part of the webcast link. To participate in the Q&A portion of the call, dial (877) 564-1219 or (973) 638-3429. An audio archive of the conference call will be available under the Investor Relations section of our website. A replay of the call will also be available through February 1, 2013 by dialing (855) 859-2056 or (404) 537-3406, passcode 86033364.
About Hancock Holding Company
Hancock Holding Company, the parent company of Hancock Bank and Whitney Bank, operates across a Gulf south corridor comprising South Mississippi; southern and central Alabama; southern Louisiana; the northern, central, and Panhandle regions of Florida; and
- 6 -
Hancock reports fourth quarter 2012 financial results
January 24, 2013
Houston, Texas. The Hancock Holding Company family of financial services companies also includes Hancock Investment Services, Inc.; Hancock Insurance Agency and Whitney Insurance Agency, Inc.; corporate trust offices in Gulfport and Jackson, Miss., New Orleans and Baton Rouge, La., and Orlando, Fla.; and Harrison Finance Company. Additional information is available at www.hancockbank.com and www.whitneybank.com.
Forward-Looking Statements
This news release contains “forward-looking statements” within the meaning of section 27A of the Securities Act of 1933, as amended, and section 21E of the Securities Exchange Act of 1934, as amended, and we intend such forward-looking statements to be covered by the safe harbor provisions therein and are including this statement for purposes of invoking these safe-harbor provisions. Forward-looking statements provide projections of results of operations or of financial condition or state other forward-looking information, such as expectations about future conditions and descriptions of plans and strategies for the future.
Forward-looking statements that we may make include, but may not be limited to, comments with respect to future levels of economic activity in our markets, loan growth, deposit trends, credit quality trends, future sales of nonperforming assets, net interest margin trends, future expense levels and the ability to achieve additional cost savings, projected tax rates, future profitability, purchase accounting impacts such as accretion levels, the impact of the branch rationalization process, and the financial impact of regulatory requirements.
Hancock’s ability to accurately project results or predict the effects of future plans or strategies is inherently limited. Although Hancock believes that the expectations reflected in its forward-looking statements are based on reasonable assumptions, actual results and performance could differ materially from those set forth in the forward-looking statements. Factors that could cause actual results to differ from those expressed in Hancock’s forward-looking statements include, but are not limited to, those risk factors outlined in Hancock’s public filings with the Securities and Exchange Commission, which are available at the SEC’s internet site (http://www.sec.gov).
You are cautioned not to place undue reliance on these forward-looking statements. Hancock does not intend, and undertakes no obligation, to update or revise any forward-looking statements, whether as a result of differences in actual results, changes in assumptions or changes in other factors affecting such statements, except as required by law.
- 7 -
Hancock Holding Company
Financial Highlights
(amounts in thousands, except per share data and FTE headcount)
(unaudited)
| Three Months Ended | Twelve Months Ended | |||||||||||||||||||
| 12/31/2012 | 9/30/2012 | 12/31/2011 | 12/31/2012 | 12/31/2011 | ||||||||||||||||
| Per Common Share Data |
||||||||||||||||||||
| Earnings per share: |
||||||||||||||||||||
| Basic |
$ | 0.55 | $ | 0.55 | $ | 0.22 | $ | 1.77 | $ | 1.16 | ||||||||||
| Diluted |
$ | 0.54 | $ | 0.55 | $ | 0.22 | $ | 1.75 | $ | 1.15 | ||||||||||
| Operating earnings per share: (a) |
||||||||||||||||||||
| Basic |
$ | 0.54 | $ | 0.58 | $ | 0.53 | $ | 2.15 | $ | 2.03 | ||||||||||
| Diluted |
$ | 0.54 | $ | 0.58 | $ | 0.53 | $ | 2.13 | $ | 2.02 | ||||||||||
| Cash dividends per share |
$ | 0.24 | $ | 0.24 | $ | 0.24 | $ | 0.96 | $ | 0.96 | ||||||||||
| Book value per share (period-end) |
$ | 28.91 | $ | 28.71 | $ | 27.95 | $ | 28.91 | $ | 27.95 | ||||||||||
| Tangible book value per share (period-end) |
$ | 19.27 | $ | 18.97 | $ | 17.76 | $ | 19.27 | $ | 17.76 | ||||||||||
| Weighted average number of shares: |
||||||||||||||||||||
| Basic |
84,798 | 84,777 | 84,696 | 84,767 | 65,590 | |||||||||||||||
| Diluted |
85,777 | 85,632 | 85,332 | 85,588 | 66,070 | |||||||||||||||
| Period-end number of shares |
84,848 | 84,782 | 84,705 | 84,848 | 84,705 | |||||||||||||||
| Market data: |
||||||||||||||||||||
| High sales price |
$ | 32.50 | $ | 33.27 | $ | 33.72 | $ | 36.73 | $ | 35.68 | ||||||||||
| Low sales price |
$ | 29.47 | $ | 27.99 | $ | 25.38 | $ | 27.96 | $ | 25.38 | ||||||||||
| Period end closing price |
$ | 31.73 | $ | 30.98 | $ | 31.97 | $ | 31.73 | $ | 31.97 | ||||||||||
| Trading volume |
20,910 | 26,877 | 41,076 | 119,519 | 137,360 | |||||||||||||||
| Other Period-end Data |
||||||||||||||||||||
| FTE headcount |
4,235 | 4,290 | 4,736 | 4,235 | 4,736 | |||||||||||||||
| Tangible common equity |
$ | 1,634,833 | $ | 1,608,285 | $ | 1,504,671 | $ | 1,634,833 | $ | 1,504,671 | ||||||||||
| Tier I capital |
$ | 1,666,042 | $ | 1,631,372 | $ | 1,506,218 | $ | 1,666,042 | $ | 1,506,218 | ||||||||||
| Goodwill |
$ | 628,877 | $ | 628,877 | $ | 651,162 | $ | 628,877 | $ | 651,162 | ||||||||||
| Amortizing intangibles |
$ | 189,409 | $ | 197,139 | $ | 211,075 | $ | 189,409 | $ | 211,075 | ||||||||||
| Performance Ratios |
||||||||||||||||||||
| Return on average assets |
0.99 | % | 1.00 | % | 0.39 | % | 0.80 | % | 0.52 | % | ||||||||||
| Return on average assets (operating) (a) |
0.98 | % | 1.07 | % | 0.93 | % | 0.97 | % | 0.90 | % | ||||||||||
| Return on average common equity |
7.67 | % | 7.77 | % | 3.11 | % | 6.32 | % | 4.26 | % | ||||||||||
| Return on average common equity (operating) (a) |
7.60 | % | 8.24 | % | 7.39 | % | 7.66 | % | 7.40 | % | ||||||||||
| Return on average tangible common equity |
11.58 | % | 11.87 | % | 4.75 | % | 9.72 | % | 5.98 | % | ||||||||||
| Return on average tangible common equity (operating) (a) |
11.48 | % | 12.59 | % | 11.32 | % | 11.78 | % | 10.37 | % | ||||||||||
| Tangible common equity ratio |
8.77 | % | 9.09 | % | 7.96 | % | 8.77 | % | 7.96 | % | ||||||||||
| Earning asset yield (TE) |
4.76 | % | 4.84 | % | 4.83 | % | 4.80 | % | 4.82 | % | ||||||||||
| Total cost of funds |
0.28 | % | 0.30 | % | 0.44 | % | 0.32 | % | 0.57 | % | ||||||||||
| Net interest margin (TE) |
4.48 | % | 4.54 | % | 4.39 | % | 4.48 | % | 4.25 | % | ||||||||||
| Efficiency ratio (b) |
60.78 | % | 64.33 | % | 65.39 | % | 64.63 | % | 66.35 | % | ||||||||||
| Allowance for loan losses as a percent of period-end loans |
1.18 | % | 1.19 | % | 1.12 | % | 1.18 | % | 1.12 | % | ||||||||||
| Allowance for loan losses to non-performing loans + accruing loans 90 days past due |
81.40 | % | 76.72 | % | 101.40 | % | 81.40 | % | 101.40 | % | ||||||||||
| Average loan/deposit ratio |
76.29 | % | 75.85 | % | 72.80 | % | 74.68 | % | 72.67 | % | ||||||||||
| Noninterest income excluding securities transactions as a percent of total revenue (TE) |
26.02 | % | 25.86 | % | 25.05 | % | 25.88 | % | 27.91 | % | ||||||||||
| (a) | Excludes tax-effected merger related expenses, debt early redemption costs and securities transactions. Management believes that this is a useful financial measure because it enables investors to assess ongoing operations. |
| (b) | Efficiency ratio is defined as noninterest expense as a percent of total revenue (TE) before amortization of purchased intangibles, securities transactions, merger related expenses and debt redemption costs. |
- 8 -
Hancock Holding Company
Financial Highlights
(amounts in thousands)
(unaudited)
| Three Months Ended | Twelve Months Ended | |||||||||||||||||||
| 12/31/2012 | 9/30/2012 | 12/31/2011 | 12/31/2012 | 12/31/2011 | ||||||||||||||||
| Asset Quality Information |
||||||||||||||||||||
| Non-accrual loans (c) |
$ | 121,837 | $ | 135,499 | $ | 99,128 | $ | 121,837 | $ | 99,128 | ||||||||||
| Restructured loans (d) |
32,215 | 32,339 | 18,145 | 32,215 | 18,145 | |||||||||||||||
|
|
|
|
|
|
|
|
|
|
|
|||||||||||
| Total non-performing loans |
154,052 | 167,838 | 117,273 | 154,052 | 117,273 | |||||||||||||||
| ORE and foreclosed assets |
102,072 | 130,613 | 159,751 | 102,072 | 159,751 | |||||||||||||||
|
|
|
|
|
|
|
|
|
|
|
|||||||||||
| Total non-performing assets |
$ | 256,124 | $ | 298,451 | $ | 277,024 | $ | 256,124 | $ | 277,024 | ||||||||||
|
|
|
|
|
|
|
|
|
|
|
|||||||||||
| Non-performing assets as a percent of loans, ORE and foreclosed assets |
2.19 | % | 2.58 | % | 2.44 | % | 2.19 | % | 2.44 | % | ||||||||||
| Accruing loans 90 days past due (c) |
$ | 13,244 | $ | 8,906 | $ | 5,880 | $ | 13,244 | $ | 5,880 | ||||||||||
| Accruing loans 90 days past due as a percent of loans |
0.11 | % | 0.08 | % | 0.05 | % | 0.11 | % | 0.05 | % | ||||||||||
| Non-performing assets + accruing loans 90 days past due to loans, ORE and foreclosed assets |
2.31 | % | 2.66 | % | 2.50 | % | 2.31 | % | 2.50 | % | ||||||||||
| Net charge-offs—non-covered |
$ | 28,038 | $ | 9,728 | $ | 11,298 | $ | 55,031 | $ | 33,805 | ||||||||||
| Net charge-offs—covered |
3,230 | 3,550 | 11,100 | $ | 26,069 | 11,475 | ||||||||||||||
| Net charge-offs—non-covered as a percent of average loans |
0.97 | % | 0.34 | % | 0.40 | % | 0.49 | % | 0.40 | % | ||||||||||
| Allowance for loan losses |
$ | 136,171 | $ | 135,591 | $ | 124,881 | $ | 136,171 | $ | 124,881 | ||||||||||
| Allowance for loan losses as a percent of period-end loans |
1.18 | % | 1.19 | % | 1.12 | % | 1.18 | % | 1.12 | % | ||||||||||
| Allowance for loan losses to non-performing loans + accruing loans 90 days past due |
81.40 | % | 76.72 | % | 101.40 | % | 81.40 | % | 101.40 | % | ||||||||||
| Provision for loan losses |
$ | 28,051 | $ | 8,101 | $ | 11,512 | $ | 54,192 | $ | 38,732 | ||||||||||
| Allowance for Loan Losses |
||||||||||||||||||||
| Beginning Balance |
$ | 135,591 | $ | 140,768 | $ | 118,113 | $ | 124,881 | $ | 81,997 | ||||||||||
| Provision for loan losses before FDIC benefit—covered loans |
3,996 | — | 18,990 | 41,021 | 52,437 | |||||||||||||||
| Benefit attributable to FDIC loss share agreement |
(3,797 | ) | — | (17,654 | ) | (38,198 | ) | (49,431 | ) | |||||||||||
| Provision for loan losses—non-covered loans (e) |
27,852 | 8,101 | 10,176 | 51,369 | 35,726 | |||||||||||||||
| Net provision for loan losses |
28,051 | 8,101 | 11,512 | 54,192 | 38,732 | |||||||||||||||
| Increase in indemnification asset |
3,797 | — | 17,654 | 38,198 | 49,431 | |||||||||||||||
| Charge-offs—non-covered (e) |
30,172 | 12,211 | 22,561 | 64,760 | 58,788 | |||||||||||||||
| Recoveries—non-covered |
(2,134 | ) | (2,483 | ) | (11,263 | ) | (9,729 | ) | (24,984 | ) | ||||||||||
| Net charge-offs—covered |
3,230 | 3,550 | 11,100 | 26,069 | 11,475 | |||||||||||||||
| Net charge-offs |
31,268 | 13,278 | 22,398 | 81,100 | 45,279 | |||||||||||||||
| Ending Balance |
$ | 136,171 | $ | 135,591 | $ | 124,881 | $ | 136,171 | $ | 124,881 | ||||||||||
| Net Charge-off Information |
||||||||||||||||||||
| Net charge-offs—non-covered: |
||||||||||||||||||||
| Commercial/real estate loans |
$ | 23,090 | $ | 3,905 | $ | 7,903 | $ | 36,902 | $ | 23,638 | ||||||||||
| Residential mortgage loans |
1,372 | 2,012 | 799 | 5,951 | 1,529 | |||||||||||||||
| Consumer loans |
3,576 | 3,811 | 2,596 | 12,178 | 8,638 | |||||||||||||||
|
|
|
|
|
|
|
|
|
|
|
|||||||||||
| Total net charge-offs—non-covered |
$ | 28,038 | $ | 9,728 | $ | 11,298 | $ | 55,031 | $ | 33,805 | ||||||||||
|
|
|
|
|
|
|
|
|
|
|
|||||||||||
| Average loans: |
||||||||||||||||||||
| Commercial/real estate loans |
$ | 8,262,736 | $ | 8,018,634 | $ | 7,989,294 | $ | 8,061,887 | $ | 5,967,995 | ||||||||||
| Residential mortgage loans |
1,613,919 | 1,573,559 | 1,492,347 | 1,571,465 | 1,137,922 | |||||||||||||||
| Consumer loans |
1,667,134 | 1,667,399 | 1,660,547 | 1,651,387 | 1,408,104 | |||||||||||||||
|
|
|
|
|
|
|
|
|
|
|
|||||||||||
| Total average loans |
$ | 11,543,789 | $ | 11,259,592 | $ | 11,142,188 | $ | 11,284,739 | $ | 8,514,021 | ||||||||||
|
|
|
|
|
|
|
|
|
|
|
|||||||||||
| Net charge-offs—non-covered to average loans: |
||||||||||||||||||||
| Commercial/real estate loans |
1.11 | % | 0.19 | % | 0.39 | % | 0.46 | % | 0.40 | % | ||||||||||
| Residential mortgage loans |
0.34 | % | 0.51 | % | 0.21 | % | 0.38 | % | 0.14 | % | ||||||||||
| Consumer loans |
0.85 | % | 0.91 | % | 0.62 | % | 0.74 | % | 0.61 | % | ||||||||||
|
|
|
|
|
|
|
|
|
|
|
|||||||||||
| Total net charge-offs—non-covered to average loans |
0.97 | % | 0.34 | % | 0.40 | % | 0.49 | % | 0.40 | % | ||||||||||
| (c) | Non-accrual loans and accruing loans past due 90 days or more do not include acquired credit-impaired loans which were written down to fair value upon acquisition and accrete interest income over the remaining life of the loan. |
| (d) | Included in restructured loans are $15.8 million, $21.6 million, and $4.1 million in non-accrual loans at 12/31/12, 9/30/12, and 12/31/11, respectively. Total excludes acquired credit-impaired loans. |
| (e) | Net charge-offs related to the bulk loan sale in December 2012 were approximately $16.2 million with an estimated impact on the provision of $13.7 million. |
- 9 -
Hancock Holding Company
Financial Highlights
(amounts in thousands)
(unaudited)
| Three Months Ended | Twelve Months Ended | |||||||||||||||||||
| 12/31/2012 | 9/30/2012 | 12/31/2011 | 12/31/2012 | 12/31/2011 | ||||||||||||||||
| Income Statement |
||||||||||||||||||||
| Interest income |
$ | 191,140 | $ | 189,205 | $ | 196,500 | $ | 762,549 | $ | 592,204 | ||||||||||
| Interest income (TE) |
194,075 | 192,071 | 199,453 | 774,134 | 604,129 | |||||||||||||||
| Interest expense |
11,275 | 11,949 | 18,131 | 51,682 | 70,970 | |||||||||||||||
| Net interest income (TE) |
182,800 | 180,122 | 181,322 | 722,452 | 533,159 | |||||||||||||||
| Provision for loan losses |
28,051 | 8,101 | 11,512 | 54,192 | 38,732 | |||||||||||||||
| Noninterest income excluding securities transactions |
64,308 | 62,842 | 60,592 | 252,195 | 206,426 | |||||||||||||||
| Securities transactions gains/(losses) |
623 | 917 | (20 | ) | 1,552 | (91 | ) | |||||||||||||
| Noninterest expense |
157,920 | 169,714 | 205,610 | 713,067 | 594,014 | |||||||||||||||
| Income before income taxes |
58,825 | 63,200 | 21,819 | 197,355 | 94,823 | |||||||||||||||
| Income tax expense |
11,866 | 16,216 | 2,854 | 45,613 | 18,064 | |||||||||||||||
|
|
|
|
|
|
|
|
|
|
|
|||||||||||
| Net income |
$ | 46,959 | $ | 46,984 | $ | 18,965 | $ | 151,742 | $ | 76,759 | ||||||||||
|
|
|
|
|
|
|
|
|
|
|
|||||||||||
| Merger-related expenses |
— | (38 | ) | 40,202 | 45,789 | 86,762 | ||||||||||||||
| Securities transactions gains/(losses) |
623 | 917 | (20 | ) | 1,552 | (91 | ) | |||||||||||||
| Debt early redemption |
— | 5,336 | — | 5,336 | — | |||||||||||||||
| Taxes on adjustments |
(218 | ) | 1,533 | 14,078 | 17,350 | 30,398 | ||||||||||||||
|
|
|
|
|
|
|
|
|
|
|
|||||||||||
| Operating income (f) |
$ | 46,554 | $ | 49,832 | $ | 45,109 | $ | 183,965 | $ | 133,214 | ||||||||||
|
|
|
|
|
|
|
|
|
|
|
|||||||||||
| Difference between interest income and interest income (TE) |
$ | 2,935 | $ | 2,866 | $ | 2,953 | $ | 11,585 | $ | 11,925 | ||||||||||
| Provision for loan losses |
28,051 | 8,101 | 11,512 | 54,192 | 38,732 | |||||||||||||||
| Merger-related expenses |
— | (38 | ) | 40,202 | 45,789 | 86,762 | ||||||||||||||
| Less securities transactions gains/(losses) |
623 | 917 | (20 | ) | 1,552 | (91 | ) | |||||||||||||
| Debt early redemption |
— | 5,336 | — | 5,336 | — | |||||||||||||||
| Income tax expense |
11,866 | 16,216 | 2,854 | 45,613 | 18,064 | |||||||||||||||
|
|
|
|
|
|
|
|
|
|
|
|||||||||||
| Pre-tax, pre-provision profit (PTPP) (g) |
$ | 89,188 | $ | 78,548 | $ | 76,506 | $ | 312,705 | $ | 232,333 | ||||||||||
|
|
|
|
|
|
|
|
|
|
|
|||||||||||
| Noninterest Income and Noninterest Expense |
||||||||||||||||||||
| Service charges on deposit accounts |
$ | 20,232 | $ | 20,834 | $ | 16,520 | $ | 78,246 | $ | 55,265 | ||||||||||
| Trust fees |
8,273 | 7,743 | 7,433 | 32,736 | 23,940 | |||||||||||||||
| Bank card fees |
7,591 | 7,568 | 8,338 | 31,698 | 28,879 | |||||||||||||||
| Insurance fees |
3,588 | 4,045 | 4,290 | 15,692 | 16,524 | |||||||||||||||
| Investment & annuity fees |
4,743 | 4,269 | 3,974 | 18,033 | 15,016 | |||||||||||||||
| ATM fees |
3,935 | 4,301 | 3,904 | 17,414 | 14,052 | |||||||||||||||
| Secondary mortgage market operations |
5,160 | 4,312 | 3,564 | 16,488 | 10,484 | |||||||||||||||
| Other income |
10,786 | 9,770 | 12,569 | 41,888 | 42,266 | |||||||||||||||
| Noninterest income excluding securities transactions |
$ | 64,308 | $ | 62,842 | $ | 60,592 | $ | 252,195 | $ | 206,426 | ||||||||||
| Securities transactions gains/(losses) |
623 | 917 | (20 | ) | 1,552 | (91 | ) | |||||||||||||
|
|
|
|
|
|
|
|
|
|
|
|||||||||||
| Total noninterest income including securities transactions |
$ | 64,931 | $ | 63,759 | $ | 60,572 | $ | 253,747 | $ | 206,335 | ||||||||||
|
|
|
|
|
|
|
|
|
|
|
|||||||||||
| Personnel expense |
$ | 87,358 | $ | 88,176 | $ | 88,485 | $ | 356,734 | $ | 272,642 | ||||||||||
| Occupancy expense (net) |
12,683 | 13,169 | 14,398 | 53,856 | 42,890 | |||||||||||||||
| Equipment expense |
5,051 | 5,010 | 3,625 | 21,862 | 13,808 | |||||||||||||||
| Other operating expense |
45,098 | 49,951 | 51,681 | 197,423 | 161,361 | |||||||||||||||
| Amortization of intangibles |
7,730 | 8,110 | 7,219 | 32,067 | 16,551 | |||||||||||||||
| Debt early redemption |
— | 5,336 | — | 5,336 | — | |||||||||||||||
| Merger-related expenses |
— | (38 | ) | 40,202 | 45,789 | 86,762 | ||||||||||||||
|
|
|
|
|
|
|
|
|
|
|
|||||||||||
| Total noninterest expense |
$ | 157,920 | $ | 169,714 | $ | 205,610 | $ | 713,067 | $ | 594,014 | ||||||||||
|
|
|
|
|
|
|
|
|
|
|
|||||||||||
| (f) | Net income less tax-effected merger costs, debt early redemption costs, and securities gains/losses. Management believes that this is a useful financial measure because it enables investors to assess ongoing operations. |
| (g) | Pre-tax pre-provision profit (PTPP) is total revenue less noninterest expense, merger items, debt early redemption costs, and securities transactions. Management believes that PTPP profit is a useful financial measure because it enables investors and others to assess the Company’s ability to generate capital to cover credit losses through a credit cycle. |
- 10 -
Hancock Holding Company
Financial Highlights
(amounts in thousands)
(unaudited)
| Three Months Ended | Twelve Months Ended | |||||||||||||||||||
| 12/31/2012 | 9/30/2012 | 12/31/2011 | 12/31/2012 | 12/31/2011 | ||||||||||||||||
| Period-end Balance Sheet |
||||||||||||||||||||
| Commercial non-real estate loans |
$ | 4,433,288 | $ | 4,235,823 | $ | 3,800,230 | $ | 4,433,288 | $ | 3,800,230 | ||||||||||
| Construction and land development loans |
989,306 | 1,044,637 | 1,263,005 | 989,306 | 1,263,005 | |||||||||||||||
| Commercial real estate loans |
2,923,094 | 2,907,007 | 2,998,923 | 2,923,094 | 2,998,923 | |||||||||||||||
| Residential mortgage loans |
1,577,944 | 1,561,640 | 1,507,498 | 1,577,944 | 1,507,498 | |||||||||||||||
| Consumer loans |
1,654,170 | 1,685,341 | 1,607,370 | 1,654,170 | 1,607,370 | |||||||||||||||
|
|
|
|
|
|
|
|
|
|
|
|||||||||||
| Total loans |
11,577,802 | 11,434,448 | 11,177,026 | 11,577,802 | 11,177,026 | |||||||||||||||
|
|
|
|
|
|
|
|
|
|
|
|||||||||||
| Loans held for sale |
50,605 | 50,389 | 72,378 | 50,605 | 72,378 | |||||||||||||||
| Securities |
3,716,460 | 4,053,271 | 4,496,900 | 3,716,460 | 4,496,900 | |||||||||||||||
| Short-term investments |
1,500,188 | 320,057 | 1,184,419 | 1,500,188 | 1,184,419 | |||||||||||||||
| Earning assets |
16,845,055 | 15,858,165 | 16,930,723 | 16,845,055 | 16,930,723 | |||||||||||||||
| Allowance for loan losses |
(136,171 | ) | (135,591 | ) | (124,881 | ) | (136,171 | ) | (124,881 | ) | ||||||||||
| Other assets |
2,755,601 | 2,800,472 | 2,968,254 | 2,755,601 | 2,968,254 | |||||||||||||||
|
|
|
|
|
|
|
|
|
|
|
|||||||||||
| Total assets |
$ | 19,464,485 | $ | 18,523,046 | $ | 19,774,096 | $ | 19,464,485 | $ | 19,774,096 | ||||||||||
|
|
|
|
|
|
|
|
|
|
|
|||||||||||
| Noninterest bearing deposits |
$ | 5,624,127 | $ | 5,151,146 | $ | 5,516,336 | $ | 5,624,127 | $ | 5,516,336 | ||||||||||
| Interest bearing transaction and savings deposits |
6,038,003 | 5,876,638 | 5,602,962 | 6,038,003 | 5,602,962 | |||||||||||||||
| Interest bearing public fund deposits |
1,580,260 | 1,321,227 | 1,620,261 | 1,580,260 | 1,620,261 | |||||||||||||||
| Time deposits |
2,501,798 | 2,423,940 | 2,974,020 | 2,501,798 | 2,974,020 | |||||||||||||||
| Total interest bearing deposits |
10,120,061 | 9,621,805 | 10,197,243 | 10,120,061 | 10,197,243 | |||||||||||||||
| Total deposits |
15,744,188 | 14,772,951 | 15,713,579 | 15,744,188 | 15,713,579 | |||||||||||||||
| Other borrowed funds |
1,035,722 | 1,056,961 | 1,398,346 | 1,035,722 | 1,398,346 | |||||||||||||||
| Other liabilities |
231,297 | 258,646 | 295,008 | 231,297 | 295,008 | |||||||||||||||
| Common shareholders’ equity |
2,453,278 | 2,434,488 | 2,367,163 | 2,453,278 | 2,367,163 | |||||||||||||||
|
|
|
|
|
|
|
|
|
|
|
|||||||||||
| Total liabilities & common equity |
$ | 19,464,485 | $ | 18,523,046 | $ | 19,774,096 | $ | 19,464,485 | $ | 19,774,096 | ||||||||||
|
|
|
|
|
|
|
|
|
|
|
|||||||||||
| Capital Ratios |
||||||||||||||||||||
| Common shareholders’ equity |
$ | 2,453,278 | $ | 2,434,488 | $ | 2,367,163 | $ | 2,453,278 | $ | 2,367,163 | ||||||||||
| Tier 1 capital |
1,666,042 | 1,631,372 | 1,506,218 | 1,666,042 | 1,506,218 | |||||||||||||||
| Tangible common equity ratio |
8.77 | % | 9.09 | % | 7.96 | % | 8.77 | % | 7.96 | % | ||||||||||
| Common equity (period-end) as a percent of total assets (period-end) |
12.60 | % | 13.14 | % | 11.97 | % | 12.60 | % | 11.97 | % | ||||||||||
| Leverage (Tier 1) ratio |
9.18 | % | 9.17 | % | 8.17 | % | 9.18 | % | 8.17 | % | ||||||||||
| Tier 1 risk-based capital ratio (h) |
12.61 | % | 12.53 | % | 11.48 | % | 12.61 | % | 11.48 | % | ||||||||||
| Total risk-based capital ratio (h) |
14.23 | % | 14.19 | % | 13.59 | % | 14.23 | % | 13.59 | % | ||||||||||
| (h) | estimated for most recent period-end |
- 11 -
Hancock Holding Company
Financial Highlights
(amounts in thousands)
(unaudited)
| Three Months Ended | Twelve Months Ended | |||||||||||||||||||
| 12/31/2012 | 9/30/2012 | 12/31/2011 | 12/31/2012 | 12/31/2011 | ||||||||||||||||
| Average Balance Sheet |
||||||||||||||||||||
| Commercial non-real estate loans |
$ | 4,316,455 | $ | 4,056,457 | $ | 3,806,858 | $ | 4,007,506 | $ | 2,590,707 | ||||||||||
| Construction and land development loans |
1,035,401 | 1,092,181 | 1,259,063 | 1,157,064 | 1,022,344 | |||||||||||||||
| Commercial real estate loans |
2,910,880 | 2,869,996 | 2,923,373 | 2,897,317 | 2,354,944 | |||||||||||||||
| Residential mortgage loans |
1,613,919 | 1,573,559 | 1,492,347 | 1,571,465 | 1,137,922 | |||||||||||||||
| Consumer loans |
1,667,134 | 1,667,399 | 1,660,547 | 1,651,387 | 1,408,104 | |||||||||||||||
|
|
|
|
|
|
|
|
|
|
|
|||||||||||
| Total loans (i) |
11,543,789 | 11,259,592 | 11,142,188 | 11,284,739 | 8,514,021 | |||||||||||||||
|
|
|
|
|
|
|
|
|
|
|
|||||||||||
| Securities (j) |
3,732,815 | 4,039,191 | 4,224,492 | 4,063,817 | 3,074,373 | |||||||||||||||
| Short-term investments |
969,037 | 531,195 | 1,062,857 | 771,523 | 955,325 | |||||||||||||||
| Earning assets |
16,245,641 | 15,829,978 | 16,429,537 | 16,120,079 | 12,543,719 | |||||||||||||||
| Allowance for loan losses |
(136,254 | ) | (140,661 | ) | (118,245 | ) | (136,257 | ) | (102,784 | ) | ||||||||||
| Other assets |
2,855,565 | 2,909,649 | 3,020,087 | 2,951,547 | 2,281,136 | |||||||||||||||
|
|
|
|
|
|
|
|
|
|
|
|||||||||||
| Total assets |
$ | 18,964,952 | $ | 18,598,966 | $ | 19,331,379 | $ | 18,935,369 | $ | 14,722,071 | ||||||||||
|
|
|
|
|
|
|
|
|
|
|
|||||||||||
| Noninterest bearing deposits |
$ | 5,420,081 | $ | 5,076,152 | $ | 5,231,197 | $ | 5,251,391 | $ | 3,400,064 | ||||||||||
| Interest bearing transaction and savings deposits |
5,930,964 | 5,869,281 | 5,574,937 | 5,827,370 | 4,100,381 | |||||||||||||||
| Interest bearing public fund deposits |
1,332,163 | 1,426,405 | 1,344,422 | 1,451,459 | 1,314,633 | |||||||||||||||
| Time deposits |
2,448,694 | 2,473,450 | 3,155,007 | 2,579,963 | 2,901,475 | |||||||||||||||
|
|
|
|
|
|
|
|
|
|
|
|||||||||||
| Total interest bearing deposits |
9,711,821 | 9,769,136 | 10,074,366 | 9,858,792 | 8,316,489 | |||||||||||||||
|
|
|
|
|
|
|
|
|
|
|
|||||||||||
| Total deposits |
15,131,902 | 14,845,288 | 15,305,563 | 15,110,183 | 11,716,553 | |||||||||||||||
| Other borrowed funds |
1,168,771 | 1,112,304 | 1,322,237 | 1,182,673 | 1,000,998 | |||||||||||||||
| Other liabilities |
229,100 | 236,134 | 280,655 | 241,710 | 203,403 | |||||||||||||||
| Common shareholders’ equity |
2,435,179 | 2,405,240 | 2,422,924 | 2,400,803 | 1,801,117 | |||||||||||||||
|
|
|
|
|
|
|
|
|
|
|
|||||||||||
| Total liabilities & common equity |
$ | 18,964,952 | $ | 18,598,966 | $ | 19,331,379 | $ | 18,935,369 | $ | 14,722,071 | ||||||||||
|
|
|
|
|
|
|
|
|
|
|
|||||||||||
| (i) | Includes loans held for sale |
| (j) | Average securities does not include unrealized holding gains/losses on available for sale securities. |
- 12 -
Hancock Holding Company
Financial Highlights
(amounts in thousands)
(unaudited)
| Supplemental Asset Quality Information (excluding covered assets and acquired loans)k |
12/31/2012 | 9/30/2012 | 12/31/2011 | |||||||||
| Non-accrual loans (l) (m) |
$ | 87,651 | $ | 106,413 | $ | 79,164 | ||||||
| Restructured loans (n) |
27,451 | 32,339 | 18,145 | |||||||||
|
|
|
|
|
|
|
|||||||
| Total non-performing loans |
115,102 | 138,752 | 97,309 | |||||||||
| ORE and foreclosed assets (o) |
75,771 | 91,725 | 115,769 | |||||||||
|
|
|
|
|
|
|
|||||||
| Total non-performing assets |
$ | 190,873 | $ | 230,477 | $ | 213,078 | ||||||
|
|
|
|
|
|
|
|||||||
| Non-performing assets as a percent of loans, ORE and foreclosed assets |
2.66 | % | 3.45 | % | 4.26 | % | ||||||
| Accruing loans 90 days past due |
$ | 7,737 | $ | 6,423 | $ | 4,871 | ||||||
| Accruing loans 90 days past due as a percent of loans |
0.11 | % | 0.10 | % | 0.10 | % | ||||||
| Non-performing assets + accruing loans 90 days past due to loans, ORE and foreclosed assets |
2.77 | % | 3.55 | % | 4.36 | % | ||||||
| Allowance for loan losses (p) (q) |
$ | 78,774 | $ | 79,749 | $ | 83,246 | ||||||
| Allowance for loan losses as a percent of period-end loans |
1.11 | % | 1.21 | % | 1.70 | % | ||||||
| Allowance for loan losses to nonperforming loans + accruing loans 90 days past due |
64.13 | % | 54.93 | % | 81.47 | % | ||||||
| (k) | Covered and acquired credit impaired loans are considered performing due to the application of the accretion method under acquisition accounting. Acquired loans are recorded at fair value with no allowance brought forward in accordance with acquisition accounting. Certain acquired loans and foreclosed assets are also covered under FDIC loss sharing agreements, which provide considerable protection against credit risk. Due to the protection of loss sharing agreements and impact of acquisition accounting, management has excluded acquired loans and covered assets from this table to provide for improved comparability to prior periods and better perspective into asset quality trends. |
| (l) | Excludes acquired covered loans not accounted for under the accretion method of $4,100, $6,162, and $18,846. |
| (m) | Excludes non-covered acquired performing loans at fair value of $30,087, $22,924, and $1,118. |
| (n) | Excludes non-covered acquired performing loans at fair value of $4,764, $0, and $0. |
| (o) | Excludes covered foreclosed assets of $26,301, $38,888, and $43,982. |
| (p) | Excludes allowance for loan losses recorded on covered acquired loans of $56,609, $55,842, and $41,634. |
| (q) | Excludes allowance for loan losses recorded on non-covered acquired-performing loans of $788, $0 and $0. |
| 9/30/2012 | ||||||||||||||||
| Originated Loans | Acquired Loans (r) | Covered Loans (s) | Total | |||||||||||||
| Commercial non-real estate loans |
$ | 2,416,143 | $ | 1,797,827 | $ | 21,855 | $ | 4,235,825 | ||||||||
| Construction and land development loans |
628,067 | 368,476 | 48,094 | 1,044,637 | ||||||||||||
| Commercial real estate loans |
1,421,526 | 1,378,706 | 106,775 | 2,907,007 | ||||||||||||
| Residential mortgage loans |
757,471 | 532,551 | 271,618 | 1,561,640 | ||||||||||||
| Consumer loans |
1,357,987 | 219,962 | 107,390 | 1,685,339 | ||||||||||||
|
|
|
|
|
|
|
|
|
|||||||||
| Total loans |
$ | 6,581,194 | $ | 4,297,522 | $ | 555,732 | $ | 11,434,448 | ||||||||
|
|
|
|
|
|
|
|
|
|||||||||
| Change in loan balance from previous quarter |
$ | 770,336 | ($ | 382,032 | ) | ($ | 32,002 | ) | $ | 356,302 | ||||||
| 12/31/2012 | ||||||||||||||||
| Originated Loans | Acquired Loans (r) | Covered Loans (s) | Total | |||||||||||||
| Commercial non-real estate loans |
$ | 2,713,385 | $ | 1,690,643 | $ | 29,260 | $ | 4,433,288 | ||||||||
| Construction and land development loans |
665,673 | 295,151 | 28,482 | 989,306 | ||||||||||||
| Commercial real estate loans |
1,548,402 | 1,279,546 | 95,146 | 2,923,094 | ||||||||||||
| Residential mortgage loans |
827,985 | 486,444 | 263,515 | 1,577,944 | ||||||||||||
| Consumer loans |
1,351,776 | 202,974 | 99,420 | 1,654,170 | ||||||||||||
|
|
|
|
|
|
|
|
|
|||||||||
| Total loans |
$ | 7,107,221 | $ | 3,954,758 | $ | 515,823 | $ | 11,577,802 | ||||||||
|
|
|
|
|
|
|
|
|
|||||||||
| Change in loan balance from previous quarter |
$ | 526,027 | ($ | 342,764 | ) | ($ | 39,909 | ) | $ | 143,354 | ||||||
| (r) | Loans which have been acquired and no allowance brought forward in accordance with acquisition accounting. |
| (s) | Loans which are covered by loss sharing agreements with the FDIC providing considerable protection against credit risk. |
- 13 -
Hancock Holding Company
Average Balance and Net Interest Margin Summary
(amounts in thousands)
(unaudited)
| Three Months Ended | ||||||||||||||||||||||||||||||||||||
| 12/31/2012 | 9/30/2012 | 12/31/2011 | ||||||||||||||||||||||||||||||||||
| Interest | Volume | Rate | Interest | Volume | Rate | Interest | Volume | Rate | ||||||||||||||||||||||||||||
| Average Earning Assets |
||||||||||||||||||||||||||||||||||||
| Commercial & real estate loans (TE) |
$ | 113,004 | $ | 8,262,736 | 5.44 | % | $ | 109,069 | $ | 8,018,634 | 5.41 | % | $ | 116,800 | $ | 7,989,294 | 5.80 | % | ||||||||||||||||||
| Residential mortgage loans |
27,998 | 1,613,919 | 6.94 | % | 28,533 | 1,573,559 | 7.25 | % | 26,128 | 1,492,347 | 7.00 | % | ||||||||||||||||||||||||
| Consumer loans |
28,593 | 1,667,134 | 6.82 | % | 29,942 | 1,667,399 | 7.14 | % | 29,194 | 1,660,547 | 6.98 | % | ||||||||||||||||||||||||
| Loan fees & late charges |
3,098 | — | 0.00 | % | 891 | — | 0.00 | % | 753 | — | 0.00 | % | ||||||||||||||||||||||||
|
|
|
|
|
|
|
|
|
|
|
|
|
|
|
|
|
|
|
|||||||||||||||||||
| Total loans (TE) |
172,693 | 11,543,789 | 5.95 | % | 168,435 | 11,259,592 | 5.95 | % | 172,875 | 11,142,188 | 6.16 | % | ||||||||||||||||||||||||
| US Treasury securities |
2 | 150 | 4.65 | % | 2 | 150 | 4.64 | % | 6 | 2,460 | 0.97 | % | ||||||||||||||||||||||||
| US agency securities |
49 | 18,165 | 1.08 | % | 49 | 18,269 | 1.08 | % | 1,539 | 258,051 | 2.39 | % | ||||||||||||||||||||||||
| CMOs |
7,204 | 1,577,165 | 1.83 | % | 7,820 | 1,663,741 | 1.88 | % | 5,478 | 1,118,398 | 1.96 | % | ||||||||||||||||||||||||
| Mortgage backed securities |
10,475 | 1,891,704 | 2.22 | % | 12,530 | 2,097,097 | 2.39 | % | 15,163 | 2,526,939 | 2.40 | % | ||||||||||||||||||||||||
| Municipals (TE) |
2,942 | 238,733 | 4.93 | % | 2,864 | 252,771 | 4.53 | % | 3,358 | 297,648 | 4.51 | % | ||||||||||||||||||||||||
| Other securities |
94 | 6,898 | 5.43 | % | 63 | 7,163 | 3.58 | % | 351 | 20,996 | 6.69 | % | ||||||||||||||||||||||||
|
|
|
|
|
|
|
|
|
|
|
|
|
|
|
|
|
|
|
|||||||||||||||||||
| Total securities (TE) (t) |
20,766 | 3,732,815 | 2.21 | % | 23,328 | 4,039,191 | 2.30 | % | 25,895 | 4,224,492 | 2.45 | % | ||||||||||||||||||||||||
| Total short-term investments |
616 | 969,037 | 0.25 | % | 308 | 531,195 | 0.23 | % | 683 | 1,062,857 | 0.25 | % | ||||||||||||||||||||||||
| Average earning assets yield (TE) |
194,075 | $ | 16,245,641 | 4.76 | % | $ | 192,071 | $ | 15,829,978 | 4.84 | % | $ | 199,453 | $ | 16,429,537 | 4.82 | % | |||||||||||||||||||
| Interest-bearing Liabilities |
||||||||||||||||||||||||||||||||||||
| Interest-bearing transaction and savings deposits |
1,719 | 5,930,964 | 0.12 | % | 1,688 | 5,869,281 | 0.11 | % | 2,535 | 5,574,937 | 0.18 | % | ||||||||||||||||||||||||
| Time deposits |
4,507 | 2,448,694 | 0.73 | % | 4,829 | 2,473,450 | 0.78 | % | 9,412 | 3,155,007 | 1.18 | % | ||||||||||||||||||||||||
| Public Funds |
861 | 1,332,163 | 0.26 | % | 1,002 | 1,426,405 | 0.28 | % | 1,027 | 1,344,422 | 0.30 | % | ||||||||||||||||||||||||
|
|
|
|
|
|
|
|
|
|
|
|
|
|
|
|
|
|
|
|||||||||||||||||||
| Total interest bearing deposits |
7,087 | 9,711,821 | 0.29 | % | 7,519 | 9,769,136 | 0.31 | % | 12,974 | 10,074,366 | 0.51 | % | ||||||||||||||||||||||||
| Total borrowings |
4,188 | 1,168,771 | 1.43 | % | 4,430 | 1,112,304 | 1.58 | % | 5,157 | 1,322,237 | 1.55 | % | ||||||||||||||||||||||||
| Total interest bearing liabilities cost |
$ | 11,275 | $ | 10,880,592 | 0.41 | % | $ | 11,949 | $ | 10,881,440 | 0.44 | % | $ | 18,131 | $ | 11,396,603 | 0.63 | % | ||||||||||||||||||
| Net interest-free funding sources |
5,365,049 | 4,948,538 | 5,032,934 | |||||||||||||||||||||||||||||||||
| Total Cost of Funds |
$ | 11,275 | $ | 16,245,641 | 0.28 | % | $ | 11,949 | $ | 15,829,978 | 0.30 | % | $ | 18,131 | $ | 16,429,537 | 0.44 | % | ||||||||||||||||||
| Net Interest Spread (TE) |
$ | 182,800 | 4.35 | % | $ | 180,122 | 4.40 | % | $ | 181,322 | 4.20 | % | ||||||||||||||||||||||||
| Net Interest Margin (TE) |
$ | 182,800 | $ | 16,245,641 | 4.48 | % | $ | 180,122 | $ | 15,829,978 | 4.54 | % | $ | 181,322 | $ | 16,429,537 | 4.39 | % | ||||||||||||||||||
| (t) | Average securities does not include unrealized holding gains/losses on available for sale securities. |
- 14 -
Hancock Holding Company
Average Balance and Net Interest Margin Summary
(amounts in thousands)
(unaudited)
| Twelve Months Ended | ||||||||||||||||||||||||
| 12/31/2012 | 12/31/2011 | |||||||||||||||||||||||
| Interest | Volume | Rate | Interest | Volume | Rate | |||||||||||||||||||
| Average Earning Assets |
||||||||||||||||||||||||
| Commercial & real estate loans (TE) |
$ | 443,360 | $ | 8,061,887 | 5.50 | % | $ | 330,301 | $ | 5,967,995 | 5.53 | % | ||||||||||||
| Residential mortgage loans |
111,662 | 1,571,465 | 7.11 | % | 77,958 | 1,137,922 | 6.85 | % | ||||||||||||||||
| Consumer loans |
115,470 | 1,651,387 | 6.99 | % | 98,324 | 1,408,104 | 6.98 | % | ||||||||||||||||
| Loan fees & late charges |
6,335 | — | 0.00 | % | 1,815 | — | 0.00 | % | ||||||||||||||||
|
|
|
|
|
|
|
|
|
|
|
|
|
|||||||||||||
| Total loans (TE) |
676,827 | 11,284,739 | 6.00 | % | 508,398 | 8,514,021 | 5.97 | % | ||||||||||||||||
| US Treasury securities |
7 | 150 | 4.66 | % | 42 | 8,652 | 0.49 | % | ||||||||||||||||
| US agency securities |
2,097 | 98,986 | 2.12 | % | 5,628 | 277,509 | 2.03 | % | ||||||||||||||||
| CMOs |
29,790 | 1,545,531 | 1.93 | % | 18,900 | 742,508 | 2.55 | % | ||||||||||||||||
| Mortgage backed securities |
51,332 | 2,150,799 | 2.39 | % | 55,572 | 1,772,212 | 3.14 | % | ||||||||||||||||
| Municipals (TE) |
11,814 | 260,488 | 4.54 | % | 12,338 | 249,164 | 4.95 | % | ||||||||||||||||
| Other securities |
348 | 7,863 | 4.43 | % | 1,120 | 24,328 | 4.60 | % | ||||||||||||||||
|
|
|
|
|
|
|
|
|
|
|
|
|
|||||||||||||
| Total securities (TE) (t) |
95,388 | 4,063,817 | 2.35 | % | 93,600 | 3,074,373 | 3.04 | % | ||||||||||||||||
| Total short-term investments |
1,919 | 771,523 | 0.25 | % | 2,131 | 955,325 | 0.22 | % | ||||||||||||||||
| Average earning assets yield (TE) |
774,134 | $ | 16,120,079 | 4.80 | % | $ | 604,129 | $ | 12,543,719 | 4.82 | % | |||||||||||||
| Interest-Bearing Liabilities |
||||||||||||||||||||||||
| Interest-bearing transaction deposits |
$ | 7,353 | $ | 5,827,370 | 0.13 | % | $ | 8,472 | $ | 4,100,381 | 0.21 | % | ||||||||||||
| Time deposits |
21,242 | 2,579,963 | 0.82 | % | 42,071 | 2,901,475 | 1.45 | % | ||||||||||||||||
| Public Funds |
4,146 | 1,451,459 | 0.29 | % | 5,147 | 1,314,633 | 0.39 | % | ||||||||||||||||
|
|
|
|
|
|
|
|
|
|
|
|
|
|||||||||||||
| Total interest bearing deposits |
$ | 32,741 | $ | 9,858,792 | 0.33 | % | $ | 55,690 | $ | 8,316,489 | 0.67 | % | ||||||||||||
| Total borrowings |
18,941 | 1,182,673 | 1.60 | % | 15,280 | 1,000,998 | 1.53 | % | ||||||||||||||||
| Total interest bearing liabilities cost |
$ | 51,682 | $ | 11,041,465 | 0.47 | % | $ | 70,970 | $ | 9,317,487 | 0.76 | % | ||||||||||||
| Net interest-free funding sources |
5,078,614 | 3,226,232 | ||||||||||||||||||||||
| Total Cost of Funds |
$ | 51,682 | $ | 16,120,079 | 0.32 | % | $ | 70,970 | $ | 12,543,719 | 0.57 | % | ||||||||||||
| Net Interest Spread (TE) |
$ | 722,452 | 4.33 | % | $ | 533,159 | 4.06 | % | ||||||||||||||||
| Net Interest Margin (TE) |
$ | 722,452 | $ | 16,120,079 | 4.48 | % | $ | 533,159 | $ | 12,543,719 | 4.25 | % | ||||||||||||
| (t) | Average securities does not include unrealized holding gains/losses on available for sale securities. |
- 15 -
 Fourth Quarter 2012
Financial Results
January 24, 2013
Fourth Quarter 2012
Financial Results
January 24, 2013 |
 Forward-Looking
Statements
Forward-Looking
Statements
Certain of the statements or information included in this presentation
may constitute forward-looking statements.
Forward-looking statements include projections of revenue,
costs, results of operations or financial condition or statements
regarding future market conditions or our potential plans and
strategies for the future. Hancock’s ability to
accurately project results or predict the effects of future plans or
strategies is inherently limited.
We believe that the expectations reflected or implied by any
forward-looking statements are based on reasonable
assumptions, but actual results and performance could differ
materially from those set forth in the forward-looking
statements. Factors that could cause actual results or
outcomes to differ from those expressed in the Company's
forward-looking statements include, but are not limited to, those
outlined in Hancock's SEC filings, including the “Risk
Factors” section of the Company’s 10-K for the
year ended December 31, 2011 and form 10-Q for the quarter
ended September 30, 2012. Hancock undertakes no obligation
to update or revise any forward-looking statements, and you
are cautioned not to place undue reliance on such forward-looking statements.
2 |
 •
Net income $47 million or $.54 per diluted common share
•
Included in the Company’s fourth quarter of 2012 results
are: •
A $13.7 million pre-tax, or $.10 per diluted common share, loan
loss provision related to a bulk loan sale of approximately $40
million •
Approximately
$3.2
million,
or
$.04
per
diluted
common
share,
of
tax
benefits
•
Approximately $.6 million, pre-tax, of securities transactions
gains •
100% realization of previously projected merger cost savings
•
Loans up $223 million, or 2%, linked-quarter
•
Adjusted for FDIC-covered portfolio reductions and bulk loan sale
•
Deposits up $1 billion, or 7%, linked-quarter
•
Fundamentals remained solid
Fourth Quarter 2012
Fourth Quarter 2012
Highlights
Highlights
3 |
 Bulk Loan Sale
•
Completed the $40 million bulk loan sale at year-end 2012
•
Approximately $36 million of loans sold previously reported as
nonperforming •
$4 million of loans sold were acquired-impaired credits not
reported as nonperforming under purchase accounting
•
Sale added $13.7 million to the provision for loan losses and $16.2
million to charge-offs in the fourth quarter of 2012
•
Loans sold had total of approximately $56 million in remaining
contractual principal
•
Management will continue to evaluate the costs and benefits of
additional NPL and ORE sale opportunities as part of its normal
credit risk management process
4 |
 Fourth Quarter 2012
Earnings Summary
Fourth Quarter 2012
Earnings Summary
* A reconciliation of net income to operating income and pre-tax,
pre-provision income is included in the appendix. **
Noninterest
expense
as
a
percent
of
total
revenue
(TE)
before
amortization
of
purchased
intangibles,
securities
transactions,
sub
debt
redemption
costs
and
merger
expenses.
5 |
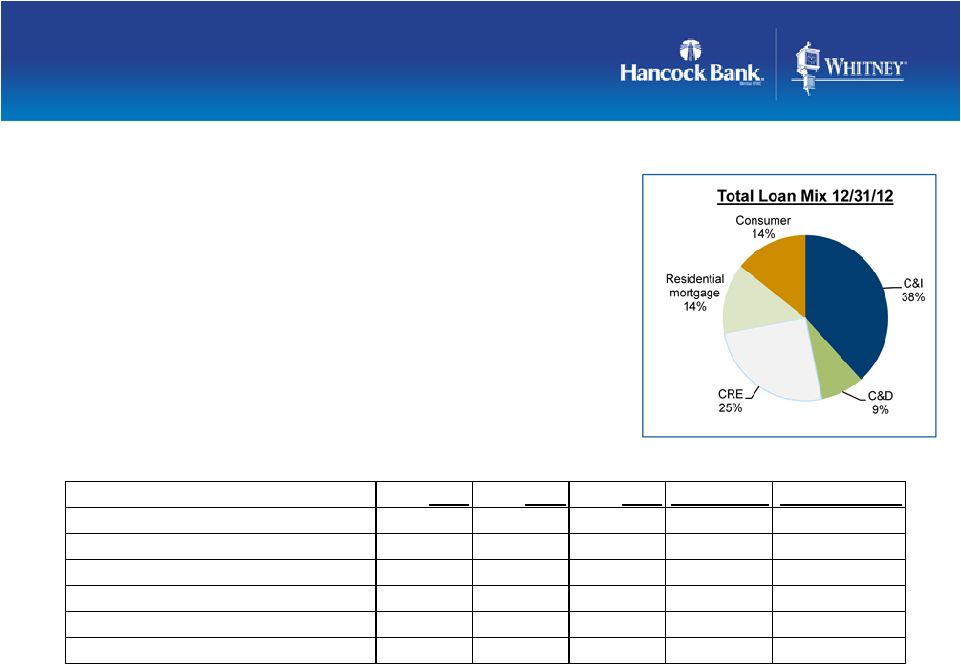 Growth Continues In C&I
Portfolio
Portfolio
•
Total loans $11.6B; up $143 million, or 1% linked-quarter
•
Compared to the same period last year non-covered loans are
up over $550 million, or 5%
•
Growth in C&I (+17%), residential mortgage (+8%), consumer
loans (+6%) offset by declines in construction (-16%) and
commercial real estate (-3%)
•
Net result is a more diversified portfolio
•
Net C&I loan growth in many markets across the footprint,
mainly Greater New Orleans and Houston
Period-end balances. As of December 31, 2012
6
$s in millions
4Q12
3Q12
4Q11
% Chg (QTR)
% Chg (Annual)
Loans (excluding covered portfolio)
11,062
$
10,879
$
10,506
$
1.7%
5.3%
Commercial
4,404
$
4,214
$
3,762
$
4.5%
17.1%
Construction and land development
961
$
997
$
1,144
$
-3.6%
-16.0%
Commercial real estate
2,828
$
2,800
$
2,916
$
1.0%
-3.0%
Residential mortgage
1,314
$
1,290
$
1,222
$
1.9%
7.6%
Consumer
1,555
$
1,578
$
1,461
$
-1.5%
6.4% |
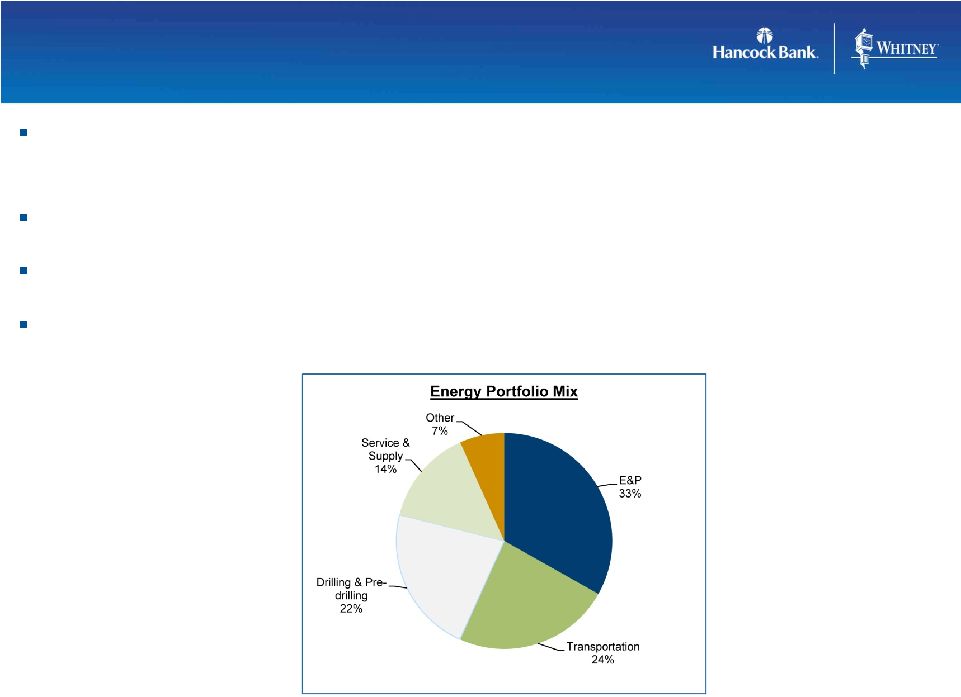 Loans outstanding to oil & gas industry customers totaled $905
million, or approximately 8% of total loans, at December 31,
2012 Balanced portfolio including many long-time
relationships Hired new energy lending team in May 2012
Energy portfolio increased $147 million from September 30, 2012 and
approximately $300 million from December 31, 2011.
Continued Growth In Energy
Continued Growth In Energy
Lending
Lending
7
Period-end balances. As of December 31, 2012
|
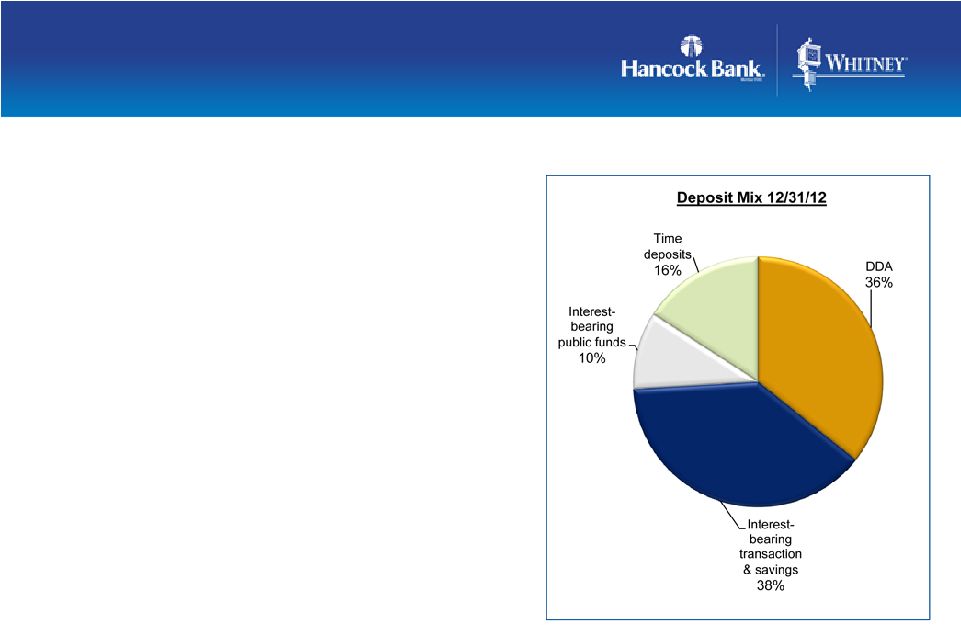 Strong Core Deposit
Funding
Funding
•
Total deposits $15.7 billion, up $1 billion,
or 7% linked-quarter
•
Increase related to year-end seasonality and
issuance of $200 million in brokered CDs
•
Funding mix remained strong
–
Shift continued from CDs to no or low cost deposits
–
Cost of funds 28bps, down 2bps from 3Q12
–
Noninterest-bearing demand deposits (DDA) comprised
36% of total period-end deposits
–
Continued favorable mix
•
Approximately $1.7B in CDs maturing over
the next 4 quarters at average rate of .44%
Period-end balances. As of December 31, 2012
8 |
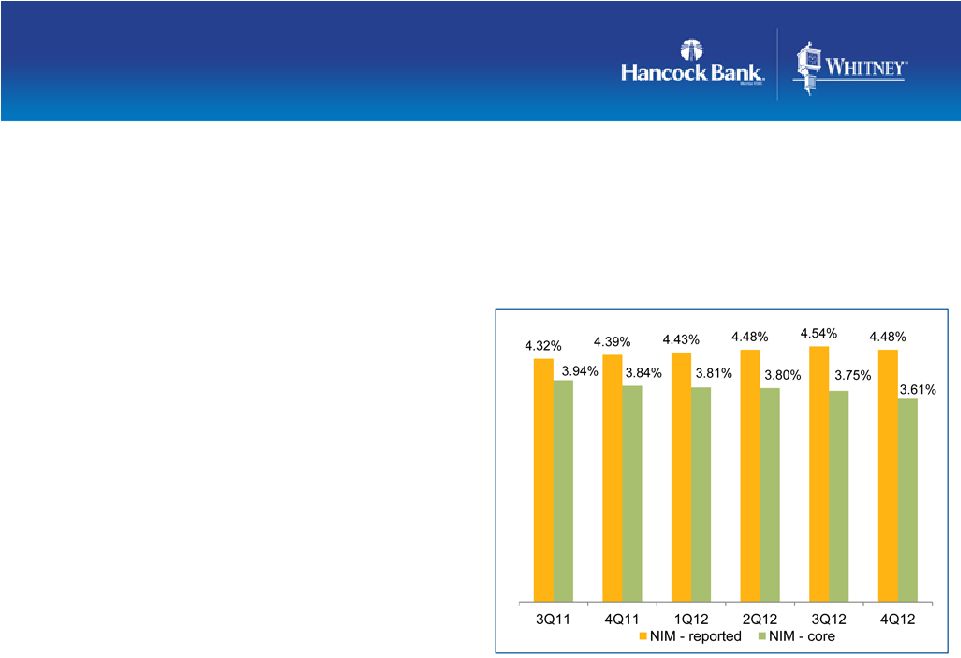 Net Interest Margin
•
Net interest margin (NIM) 4.48%, down 6bps linked-quarter
•
Core NIM compressed 14bps
–
Reflects a favorable shift in earning asset mix and funding sources and
a decline in funding costs, offset by a decline in the
securities portfolio yield and loan portfolio yield –
Increase
in
net
purchase
accounting
adjustments,
mainly
from
the
Whitney
transaction,
positively
impacted
net
interest
income
and
NIM
•
As earning assets continue to reprice
at lower rates, and with a diminished
opportunity to significantly lower
funding costs, continued compression
of the core margin in the near term
is expected
•
All else equal, compression of the reported
margin is also anticipated in the near term
As of December 31, 2012
9
Core
NIM
=
reported
net
interest
income
(TE)
excluding
total
net
purchase
accounting
adjustments,
annualized,
as
a
percent
of
total
earning
assets |
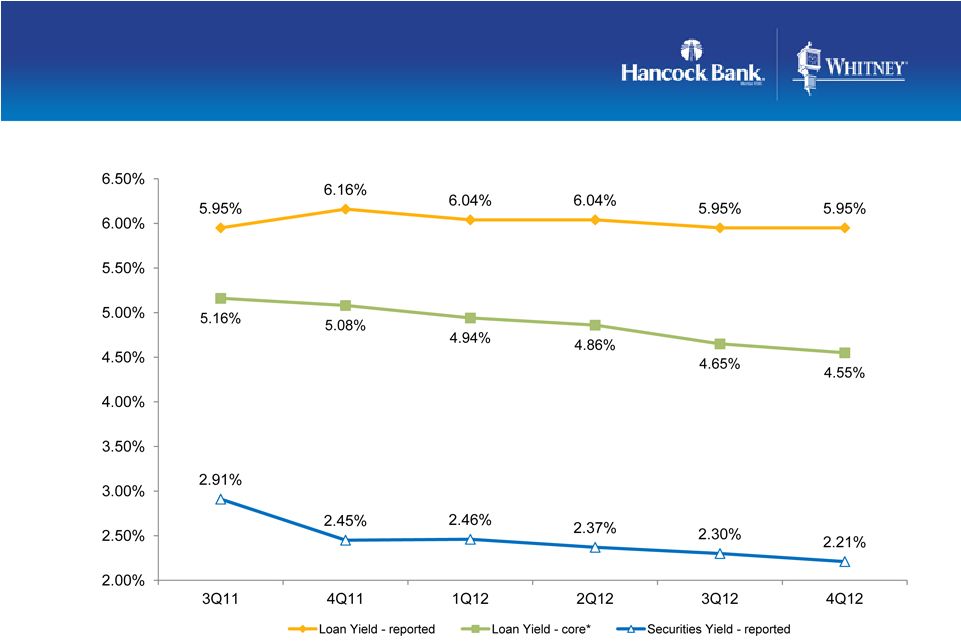 Core NIM Compression Related
to Lower Earning Asset Yields
to Lower Earning Asset Yields
10
*Core loan yields exclude purchase accounting accretion
|
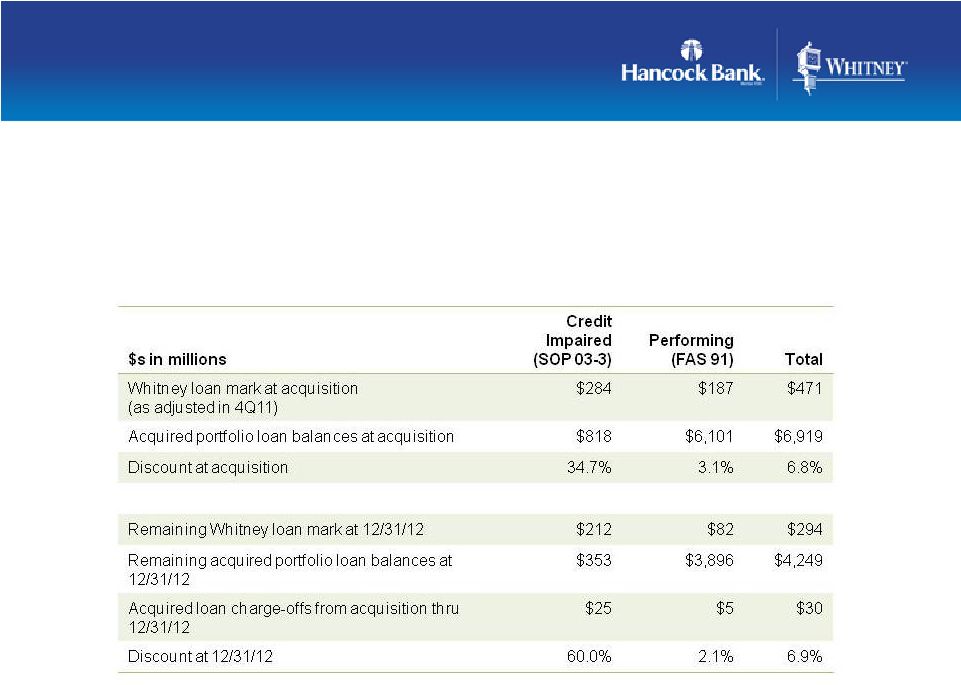 Whitney Portfolio Performing
Better Than Expected
Better Than Expected
•
FAS 91 mark accreted into earnings over the life of the portfolio
•
Credit impaired mark available for charge-offs; if not needed for
charge-offs then accreted into income
•
Quarterly reviews of accretion levels and portfolio performance will
impact reported margin As of December 31, 2012
11 |
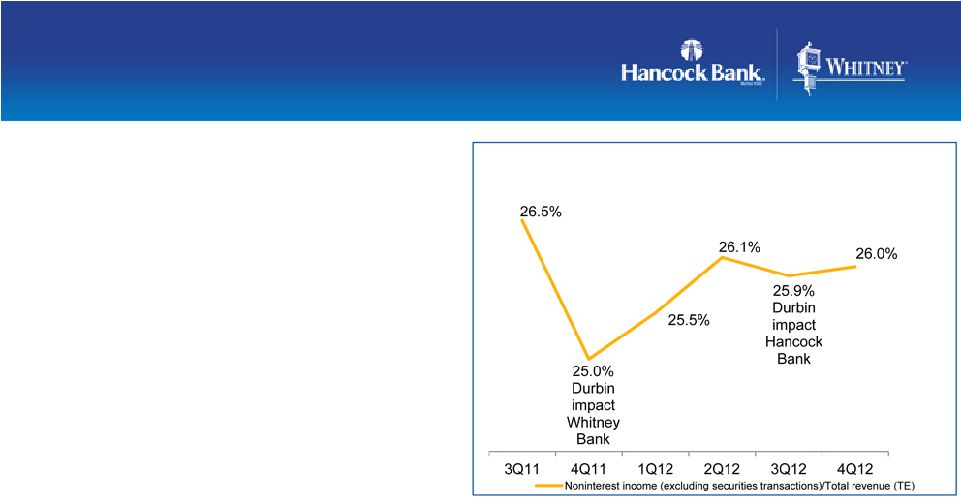 Working To Enhance
Fee Growth
Fee Growth
•
Noninterest income totaled $64.9
million, up $1.2 million linked-quarter
•
Includes $.6 million of securities gains in
4Q12 and $.9 million in 3Q12
•
Fees from secondary mortgage
operations totaled $5.2 million, up
$.8 million linked-quarter
•
Increase reflects a higher volume of
mortgage production during the fourth
quarter mainly from refinancing activity
•
Linked-quarter changes in trust,
insurance, and investment and annuity
fees reflect the volatility and
seasonality of those lines of business
12
As of December 31, 2012 |
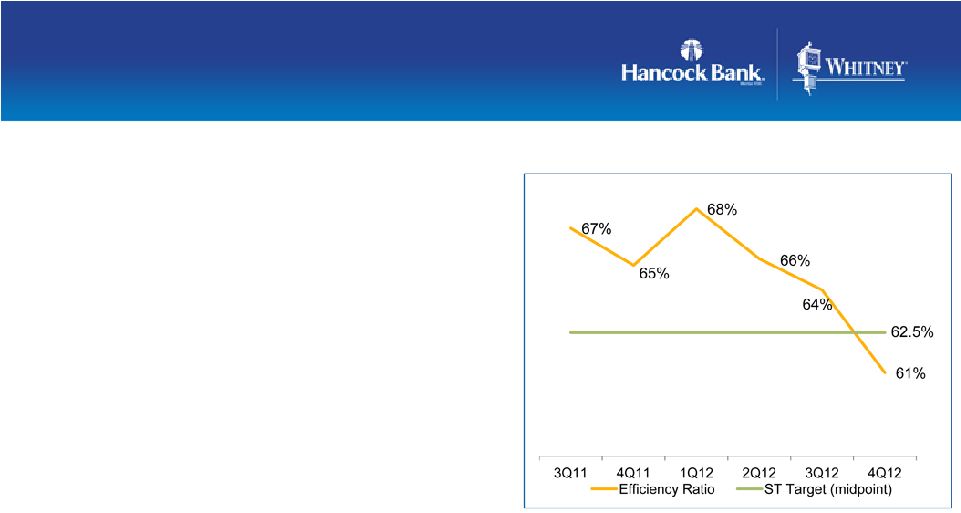 Improving Efficiency Ratio
•
Operating expense* totaled $158 million, down
$6.5 million, or 4%, from 3Q12
–
Amortization of intangibles totaled $7.7million
•
Other operating expense totaled $45.1 million,
down $4.9 million from 3Q12
•
Linked-quarter decrease was mainly related to
reductions in professional service expense,
telephone and data processing expense,
advertising expense and ORE expense.
•
Efficiency ratio 61%**
–
Longer term target: less than 60%
* Excludes merger costs and sub debt early redemption costs
** Noninterest expense as a percent of total revenue (TE) before
amortization
of purchased intangibles, sub debt redemption costs, securities
transactions and merger expenses
13
As of December 31, 2012
•
Personnel expense decreased $.8 million,
reflecting the reduction in FTE associated
with branch closings |
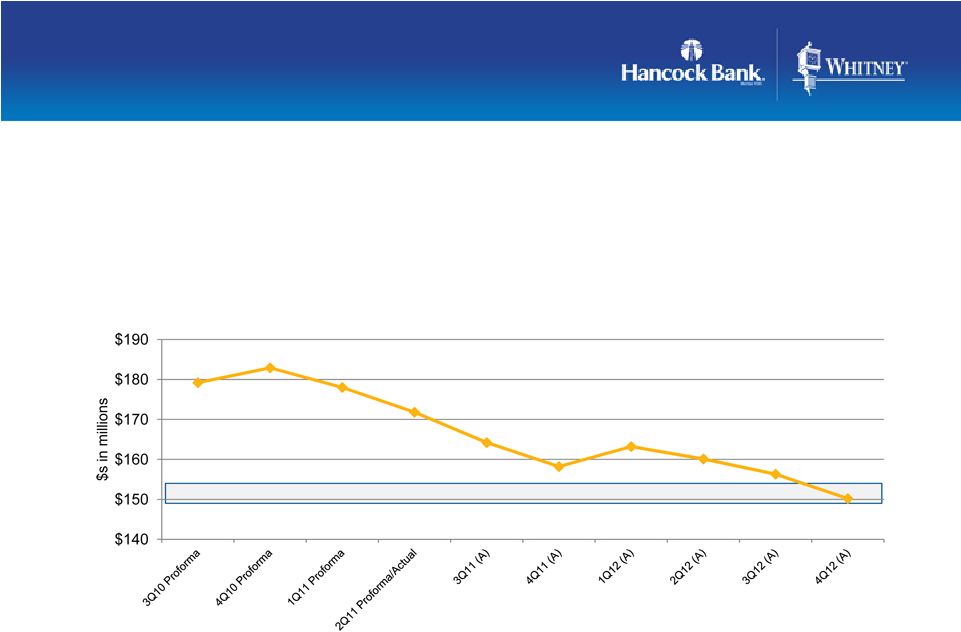 Met Operating Expense
Guidance for 4Q12
Guidance for 4Q12
•
Guidance: $149MM -
$153MM in 4Q12; Actual = $150.2 million
•
4Q12 reflects achievement of 100% of cost savings projected for the
Whitney acquisition •
1Q13 expenses will increase due to seasonality in certain line items
(ie. payroll taxes) As of December 31, 2012
14
Operating expense excludes merger costs and sub debt early redemption
costs. Table and guidance also excludes amortization of intangibles. |
 •
Provision for loan losses was $28.1 million, up from $8.1 million in
3Q12 •
Includes $13.7 million related to the bulk loan sale
•
Includes $.2 million from FDIC-covered loan portfolio
•
Linked-quarter increase mainly related to the higher level of
non-covered charge-offs and reserve build •
Net charge-offs totaled $28.0 million, or 0.97%, related to the
non-covered portfolio •
Includes $16.2 million related to the bulk loan sale
•
Linked-quarter increase of $2.1 million excluding impact of bulk
loan sale •
Excluding the impact of the bulk loan sale net charge-offs were
0.41% of average loans •
Allowance for loan losses/loans 1.18%
•
Excluding the impact of the Whitney acquired loans and FDIC covered
loans, allowance for loan losses was 1.11% Asset Quality Results
Impacted Asset Quality Results Impacted
By Bulk Loan Sale
By Bulk Loan Sale
As of December 31, 2012
15
$s in millions
Total
Bulk Sale
Covered
Non-covered
Provision
$28.1
$13.7
$.2
$14.2
Net Charge-offs
$31.2
$16.2
$3.2
$11.8 |
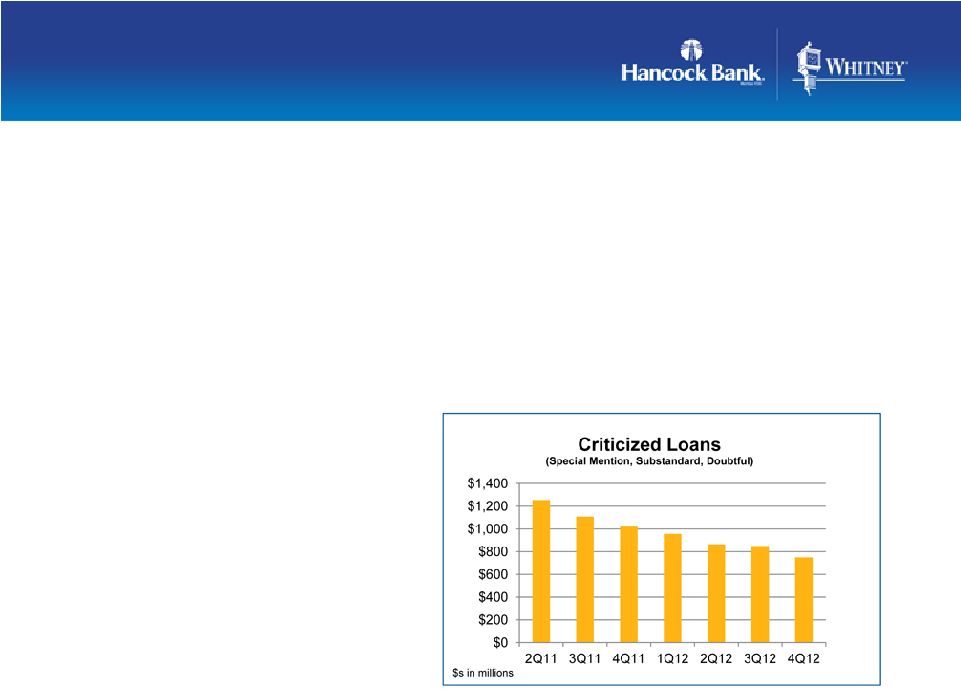 •
Total nonperforming assets totaled $256 million, a decrease of $42
million linked-quarter
•
Nonaccrual loans down $14 million mainly related to the bulk loan
sale •
Restructured loans flat
•
ORE
and
foreclosed
assets
down
$28
million
mainly
related
to
the
ORE
sales
during
the
fourth
quarter
•
Approximately $33 million of current ORE properties under sales
contracts, scheduled to close in 1Q13
•
Management will continue to
evaluate the costs and benefits of
additional NPL and ORE sale
opportunities as part of its
normal credit risk management
process
Asset Quality Results Impacted
Asset Quality Results Impacted
By Bulk Loan Sale
By Bulk Loan Sale
As of December 31, 2012
16
Excludes covered portfolio and gross of the Whitney loan mark
|
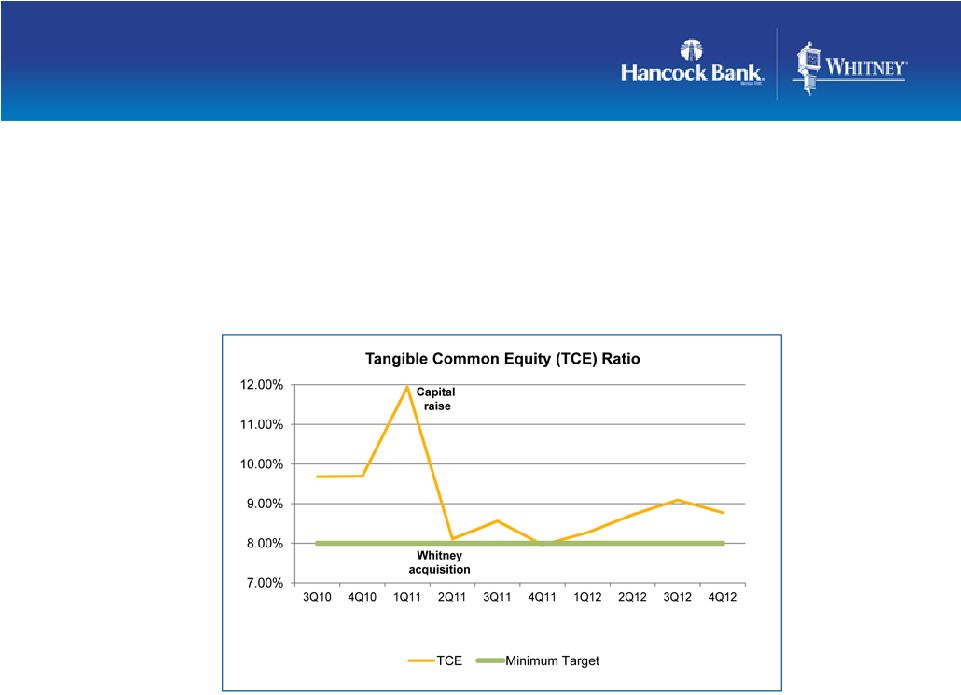 •
TCE ratio 8.77%; the decline from 3Q12 due to $.9 billion increase in
total assets •
Expect to continue to build capital in the near term
•
Will
continue
to
look
for
opportunities
to
deploy
excess
capital
and
liquidity
in
the
best
interest
of
the
Company
and
its
shareholders
Well-Capitalized
Well-Capitalized
Company
Company
As of December 31, 2012
17 |
 Appendix
18 |
       Non-GAAP
Reconciliation
Non-GAAP
Non-GAAP
Reconciliation
Reconciliation
19
(a) Net income less tax-effected merger costs, debt early redemption costs, and securities
gains/losses. Management believes that this is a useful financial measure because it
enables investors to assess ongoing operations.
(b) Pre-tax pre-provision profit (PTPP) is total revenue less noninterest
expense, merger items, debt early redemption costs, and securities transactions. Management believes
that PTPP profit is a useful financial measure because it enables investors and others to
assess the Company’s ability to generate capital to cover credit losses through a credit
cycle.
12/31/2012
9/30/2012
12/31/2011
12/31/2012
12/31/2011
Income Statement
Interest income
$191,140
$189,205
$196,500
$762,549
$592,204
Interest income (TE)
194,075
192,071
199,453
774,134
604,129
Interest expense
11,275
11,949
18,131
51,682
70,970
Net interest income (TE)
182,800
180,122
181,322
722,452
533,159
Provision for loan losses
28,051
8,101
11,512
54,192
38,732
Noninterest income excluding
securities transactions
64,308
62,842
60,592
252,195
206,426
Securities transactions gains/(losses)
623
917
(20)
1,552
(91)
Noninterest expense
157,920
169,714
205,610
713,067
594,014
Income before income taxes
58,825
63,200
21,819
197,355
94,823
Income tax expense
11,866
16,216
2,854
45,613
18,064
Net income
$46,959
$46,984
$18,965
$151,742
$76,759
Merger-related expenses
-
(38)
40,202
45,789
86,762
Securities transactions gains/(losses)
623
917
(20)
1,552
(91)
Debt early redemption
-
5,336
-
5,336
-
Taxes on adjustments
(218)
1,533
14,078
17,350
30,398
Operating income (a)
$46,554
$49,832
$45,109
$183,965
$133,214
Difference between interest income and interest income (TE)
$2,935
$2,866
$2,953
$11,585
$11,925
Provision for loan losses
28,051
8,101
11,512
54,192
38,732
Merger-related expenses
-
(38)
40,202
45,789
86,762
Less securities transactions gains/(losses)
623
917
(20)
1,552
(91)
Debt early redemption
-
5,336
-
5,336
-
Income tax expense
11,866
16,216
2,854
45,613
18,064
Pre-tax, pre-provision profit (PTPP) (b)
$89,188
$78,548
$76,506
$312,705
$232,333
Twelve Months Ended
Three Months Ended |
 Fourth Quarter 2012
Financial Results
January 24, 2013
Fourth Quarter 2012
Financial Results
January 24, 2013 |