Attached files
| file | filename |
|---|---|
| 8-K - 8-K - IHS Inc. | ihs8-k2013guidance.htm |
| EX-99.1 - 2013 GUIDANCE NEWS RELEASE - IHS Inc. | exh99112-12x12.htm |
2013 Guidance Call Supplemental Deck December 12, 2012
Copyright © 2012 IHS Inc. Safe harbor Statements in this presentation that are not reported financial results or other historical information are “forward-looking statements” within the meaning of the Private Securities Litigation Reform Act of 1995. They include, for example, statements about our business outlook, assessment of market conditions, anticipated trends in our business strategies, future plans, future sales, prices for our major products, capital spending, and tax rates. These forward-looking statements are not guarantees of future performance. They are based on management’s current expectations that involve a number of business risks and uncertainties, any of which could cause actual results to differ materially from those expressed in or implied by the forward- looking statements. The risks and uncertainties relating to the forward-looking statements in this presentation include, but are not limited to, our ability to successfully integrate acquisitions and manage risks associated with changes in demand for our products and services as well as changes in our targeted industries, our ability to develop new products and services, pricing and other competitive pressures, changes in laws and regulations governing our business, and the other factors described under the caption “Risk Factors” in IHS Inc.’s most recent annual report on Form 10-K along with our other filings with the U.S. Securities and Exchange Commission. Although we believe the expectations reflected in the forward-looking statements are reasonable, we cannot guarantee future results, level of activity, performance, or achievements. Moreover, neither we nor any other person assumes responsibility for the accuracy or completeness of any of these forward- looking statements. You should not rely upon forward-looking statements as predictions of future events. We are under no duty to update any of these forward-looking statements to conform our prior statements to actual results or revised expectations.
Copyright © 2012 IHS Inc. Seasonality Detail and GDP Outlook • Following are schedules that provide historic quarterly revenue and profit distribution for IHS and also GDP growth trends by region. • As discussed on the 2013 guidance call (on 12/12/12), we anticipate revenue and profit spreads to be approximately 1% less per quarter in the first half of 2013 than they were in previous years. • Similarly, we expect 2nd half quarterly spreads to be 1% higher per quarter than historical trends. • This view aligns with our Chief Economist’s belief that global growth is expected to gradually accelerate throughout 2013, with the pace of expansion in the second half being stronger than in the first.
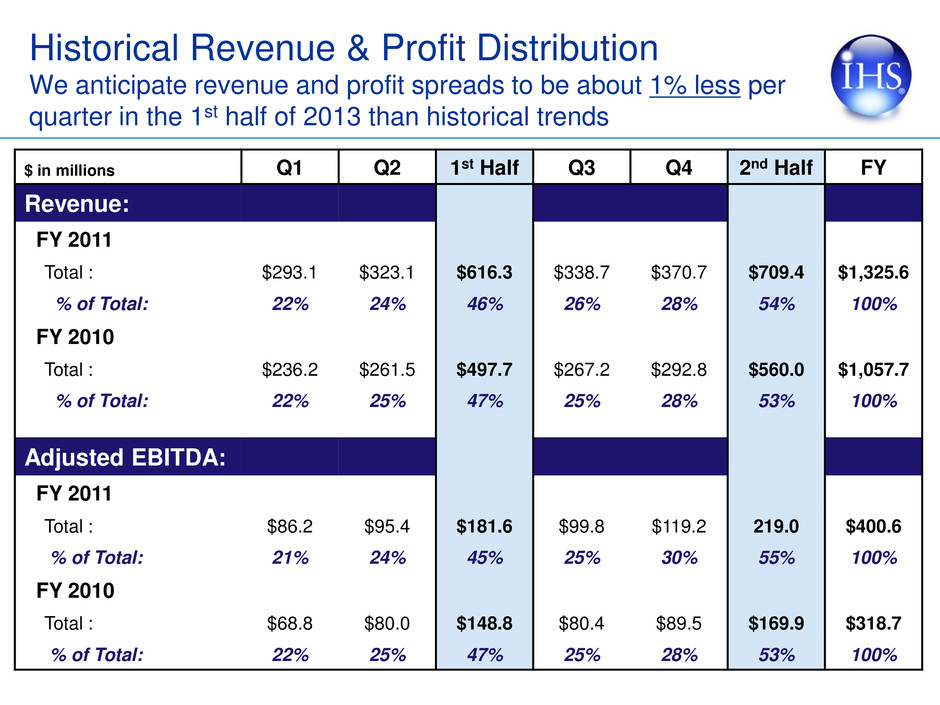
Copyright © 2012 IHS Inc. Historical Revenue & Profit Distribution We anticipate revenue and profit spreads to be about 1% less per quarter in the 1st half of 2013 than historical trends 4 $ in millions Q1 Q2 1st Half Q3 Q4 2nd Half FY Revenue: FY 2011 Total : $293.1 $323.1 $616.3 $338.7 $370.7 $709.4 $1,325.6 % of Total: 22% 24% 46% 26% 28% 54% 100% FY 2010 Total : $236.2 $261.5 $497.7 $267.2 $292.8 $560.0 $1,057.7 % of Total: 22% 25% 47% 25% 28% 53% 100% Adjusted EBITDA: FY 2011 Total : $86.2 $95.4 $181.6 $99.8 $119.2 219.0 $400.6 % of Total: 21% 24% 45% 25% 30% 55% 100% FY 2010 Total : $68.8 $80.0 $148.8 $80.4 $89.5 $169.9 $318.7 % of Total: 22% 25% 47% 25% 28% 53% 100%
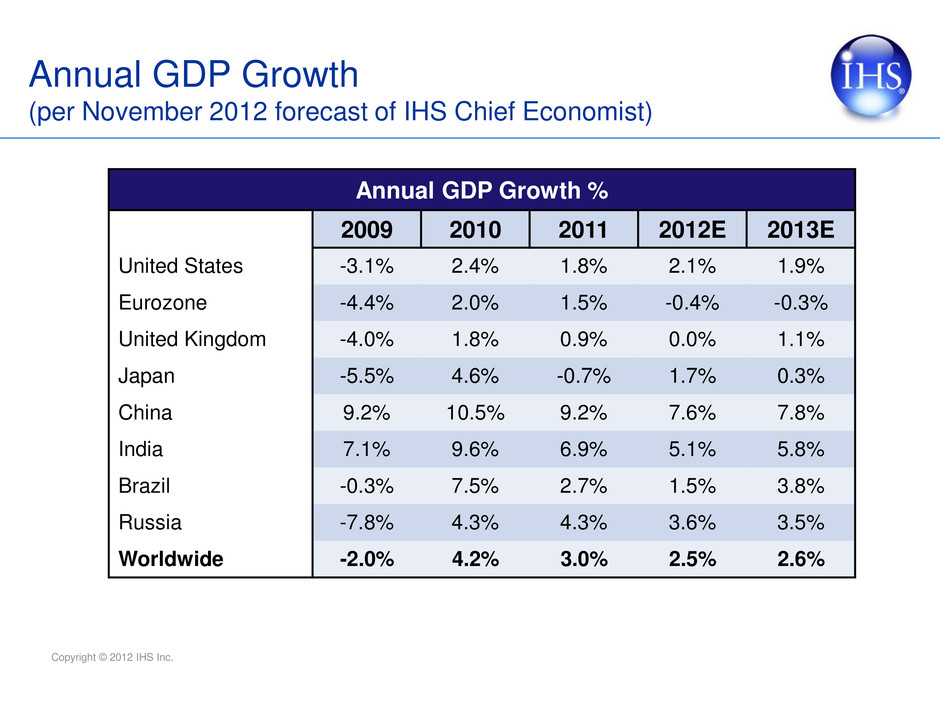
Copyright © 2012 IHS Inc. Annual GDP Growth (per November 2012 forecast of IHS Chief Economist) Annual GDP Growth % 2009 2010 2011 2012E 2013E United States -3.1% 2.4% 1.8% 2.1% 1.9% Eurozone -4.4% 2.0% 1.5% -0.4% -0.3% United Kingdom -4.0% 1.8% 0.9% 0.0% 1.1% Japan -5.5% 4.6% -0.7% 1.7% 0.3% China 9.2% 10.5% 9.2% 7.6% 7.8% India 7.1% 9.6% 6.9% 5.1% 5.8% Brazil -0.3% 7.5% 2.7% 1.5% 3.8% Russia -7.8% 4.3% 4.3% 3.6% 3.5% Worldwide -2.0% 4.2% 3.0% 2.5% 2.6%
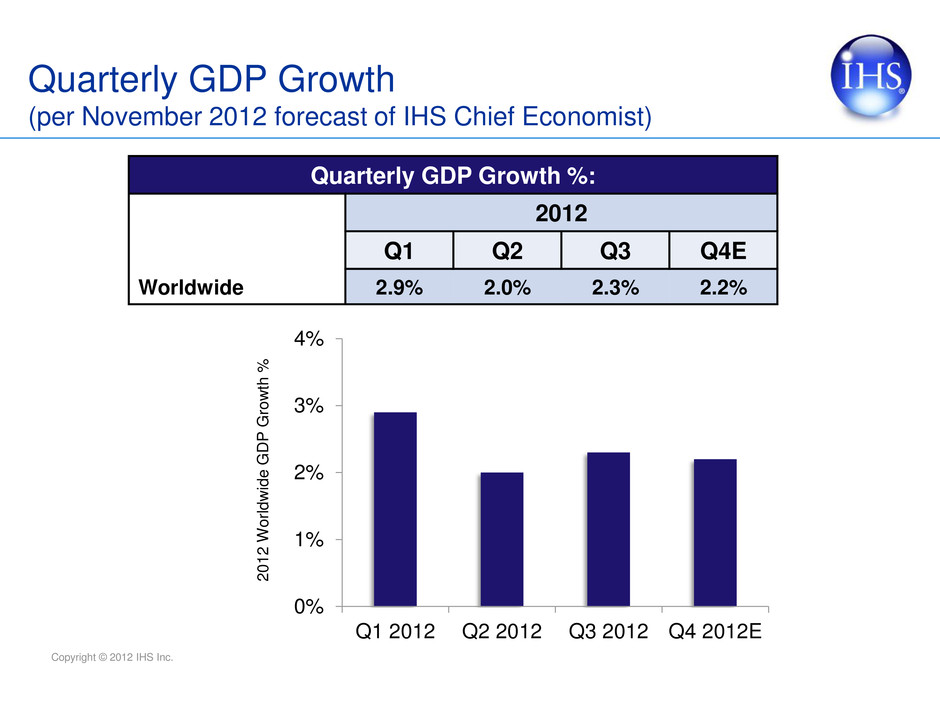
Copyright © 2012 IHS Inc. Quarterly GDP Growth (per November 2012 forecast of IHS Chief Economist) Quarterly GDP Growth %: 2012 Q1 Q2 Q3 Q4E Worldwide 2.9% 2.0% 2.3% 2.2% 0% 1% 2% 3% 4% Q1 2012 Q2 2012 Q3 2012 Q4 2012E 2 0 1 2 W o rl d w id e GD P G ro w th %
