Attached files
| file | filename |
|---|---|
| 8-K - FORM 8-K - S&T BANCORP INC | d449725d8k.htm |
| EX-99.2 - INVESTOR PRESENTATION - S&T BANCORP INC | d449725dex992.htm |
 Exhibit 99.1 |
 Todd
Brice President and
Chief Executive Officer |
 Forward Looking Statement
and Risk Factor
•
This presentation contains certain forward-looking statements within the
meaning of Section 27A of the Securities Act of 1933 and Section 21E of the
Securities Exchange Act of 1934. Forward- looking statements
include, among others, statements regarding trends, strategies, plans, beliefs,
intentions, expectations, goals and opportunities. Forward looking
statements are typically identified by words or phrases such as believe,
expect, anticipate, intend, estimate, assume, strategy, plan, outlook,
outcome, continue, remain, trend and variations of such words and similar
expressions,
or
future
or
conditional
verbs
such
as
will,
would,
should,
could,
may
or
similar
expressions. Actual results and performance could differ materially from
those anticipated by these forward-looking statements. Factors
that could cause such a difference include, but are not limited to, general
economic conditions, changes in interest rates, deposit flows, loan demand,
asset quality, including real estate and other collateral values, and
competition. •
S&T cautions that these forward-looking statements are subject to numerous
assumptions, risks and uncertainties, which change over time. These
forward-looking statements speak only as of the date hereof, and
S&T assumes no duty to update forward-looking statements. Subsequent
written
or
oral
statements
attributable
to
S&T
or
persons
acting
on
its
behalf
are
expressly
qualified in their entirety by the cautionary statements contained herein and
those in S&T’s reports previously and subsequently filed with the
Securities and Exchange Commission. 3 |
 4
Non-GAAP Financial Measures
•
In
addition
to
the
results
of
operations
presented
in
accordance
with
Generally
Accepted
Accounting Principles (GAAP), S&T management uses and this presentation
contains or references, certain non-GAAP financial measures, such as
net interest income on a fully taxable equivalent basis, that S&T
believes provide information useful to investors in understanding our
underlying operational performance and our business and performance trends as they
facilitate comparisons with the performance of others in the financial
services industry. Although S&T believes
that
these
non-GAAP
financial
measures
enhance
investors’
understanding
of
S&T’s
business and performance, these non-GAAP financial measures should not be
considered an alternative to GAAP. The non-GAAP financial
measures contained therein should be read in conjunction with the audited
financial statements and analysis as presented in the Annual Report on Form
10-K as well as the unaudited financial statements and analyses as presented in the
respective Quarterly Reports on Forms 10-Q for S&T Bancorp, Inc. and
subsidiaries. |
 5
Corporate Profile |
 6
Assets
ROA
ROE
FNB Corporation
$12.0
0.93%
7.93%
Northwest Bancshares
8.1
0.78
5.42
First Commonwealth Financial
6.0
0.75
5.75
S&T Bancorp
4.4
0.77
6.46
TriState Capital
2.0
0.61
5.86
Data source: Federal Reserve YTD as of 09.30.12
$ in billions
Western PA Bank Holding Companies |
 7
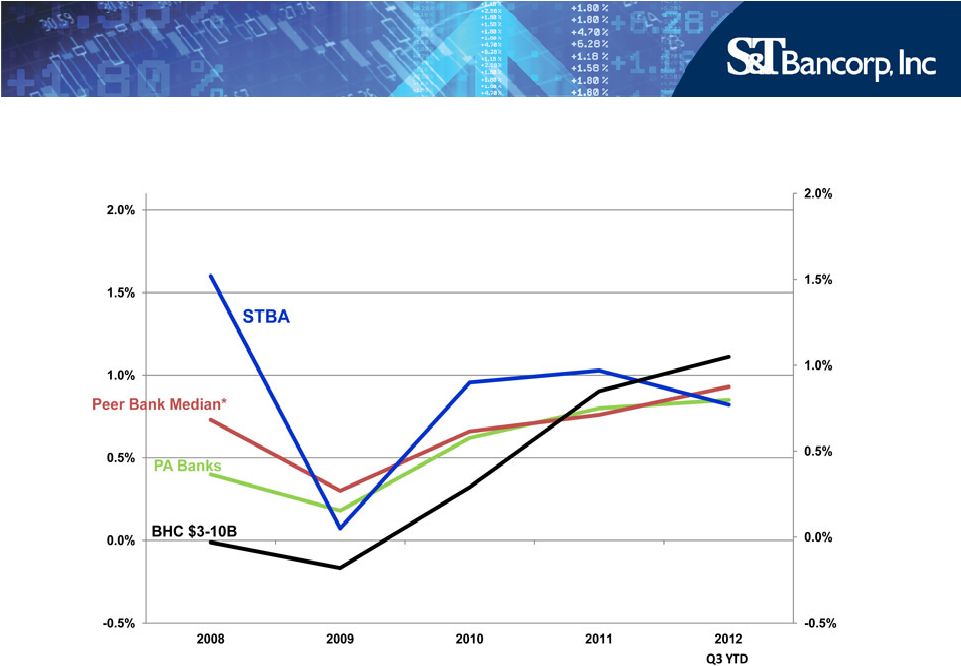
*
2012 peer banks per 2012 proxy statement
Common Return on Assets |
 8
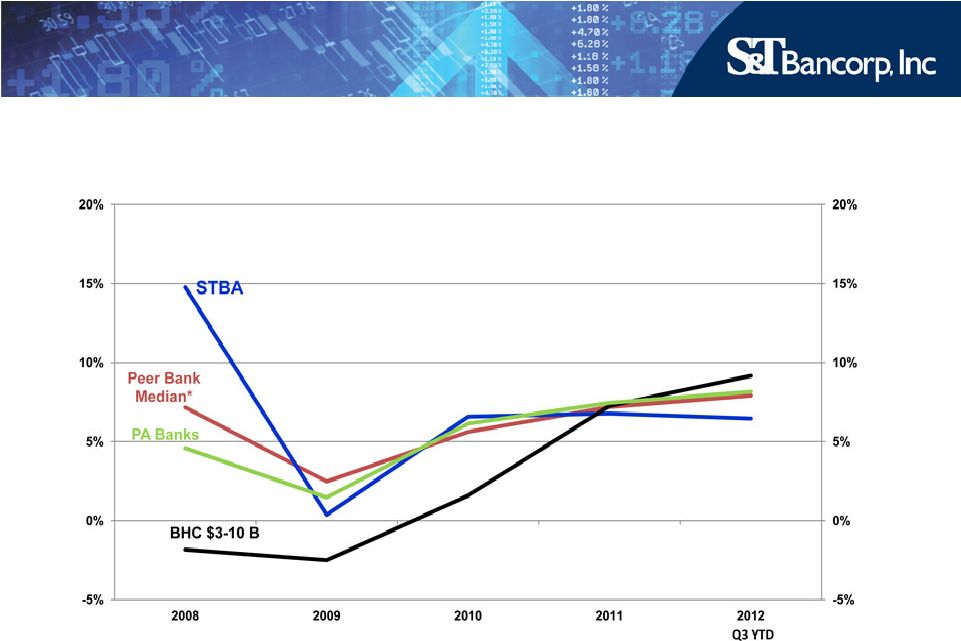
Common Return on Equity
*
2012 peer banks per 2012 proxy statement |
 9
4 Lines of Business |
 10
Commercial Banking |
 11
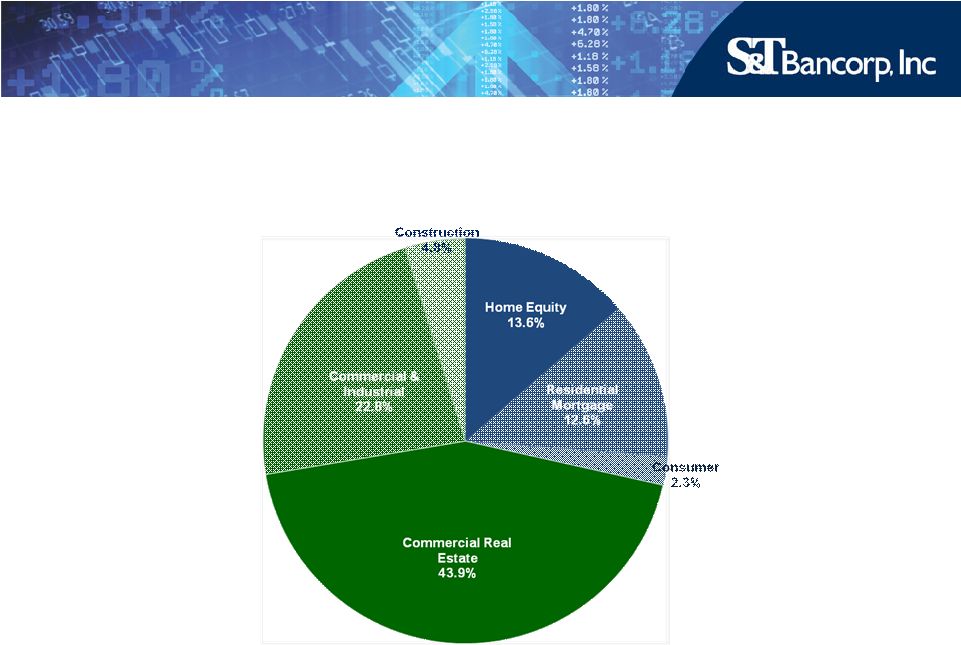
Loan Mix
Total Loans as of 09.30.12 = $3.3 Billion |
 Commercial Banking
•
31 commercial lenders
•
12 community lenders
•
Privately held companies with sales up to
$150 million
•
$1-7 million preferred facility
•
Growing pipeline
•
Adding producers
12 |
 13
Retail Banking |
 Retail Banking
•
Over 100,000 Households
•
59 branches
•
Average branch size of $61.5 million
•
Home Center
•
92% of customers highly satisfied
•
Over 70,000 customers enrolled in online banking
•
Over 9,500 customers enrolled in Mobile Banking
14 |
 15
Wealth Management |
 Wealth Management
•
$1.7 billion AUM
•
3 Divisions
–
S&T Trust
–
S&T Financial Services
–
RIA/Stewart Capital
•
Estimated annual revenue in excess of $10 million
•
Adding producers
16 |
 17
Insurance |
 Insurance
•
Purchased Evergreen Insurance in 2002
•
Full service agency
–
Commercial P&C (65%)
–
Group Life and Health (20%)
–
Personal Lines (15%)
•
Estimated annual revenue in excess of $5 million
18 |
 Growth –
Merger & Acquisition Activity
•
2012 -
Gateway Bank of Pennsylvania
•
2012 -
Mainline Bancorp
•
2008 –
IBT Bancorp
•
2002 -
Peoples Financial Corp
•
1997 -
Peoples Bank of Unity
•
1991 -
Atlantic Financial Savings Bank
•
1991 -
Vanguard Savings Bank
19 |
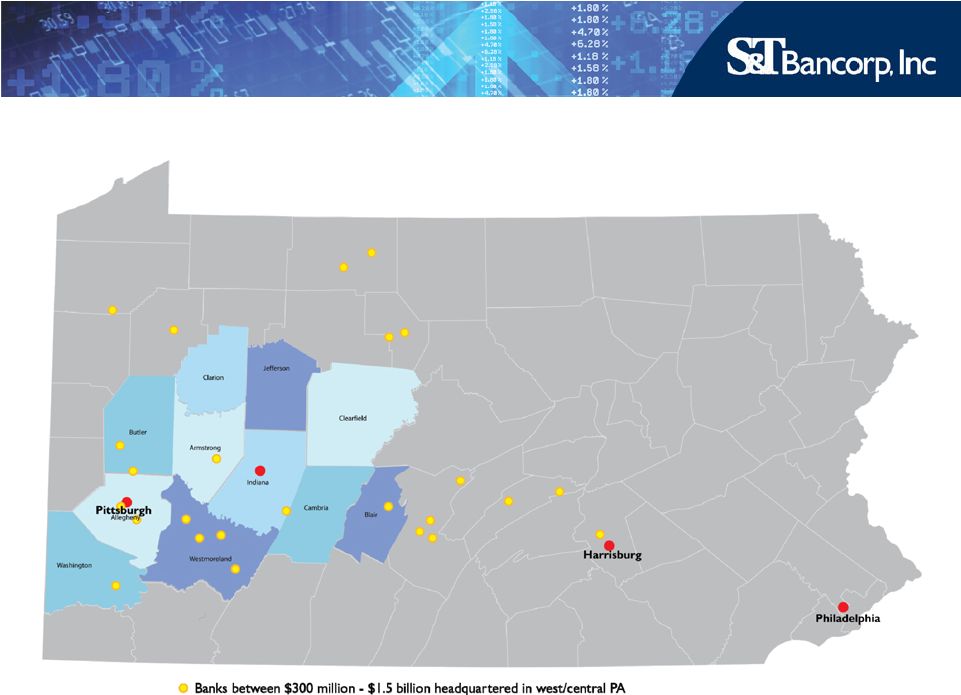 Growth –
Merger Opportunities
20 |
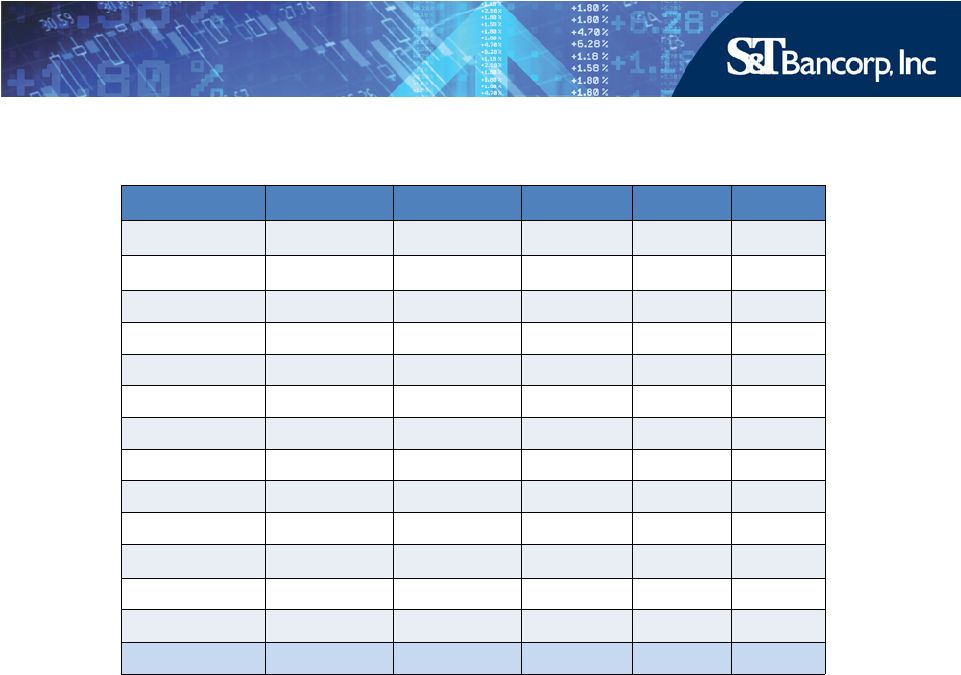 Growth -
Organic
County
Total Deposits*
S&T Deposits*
# Branches
Share
Rank
Allegheny
$76,568
$691
12
0.9%
10
Washington
4,525
89
1
2.0
10
Butler
3,458
34
2
1.0
15
Westmoreland
6,833
788
11
11.5
5
Cambria
2,776
179
7
6.4
5
Blair
2,182
52
3
2.4
9
Armstrong
1,114
82
2
7.4
4
Indiana
2,052
959
10
46.7
1
Clearfield
1,291
165
3
12.8
5
Jefferson
878
412
6
46.9
1
Clarion
800
180
2
22.5
1
Total
$102,477
$3,631
59
3.5%
21
* $ in millions
Source: Highline Financial as of 06.30.12 |
 22
The Right Size
•
Big Enough to:
–
Provide full complement of products and services
–
Access technology
–
Access Capital Markets
–
Attract talent
–
Expand –
Mergers and Acquisitions/DeNovo
•
Small Enough to:
–
Stay close to our customers
–
Understand our markets
–
Be responsive |
 |