Attached files
| file | filename |
|---|---|
| 8-K - FORM 8-K - SmartStop Self Storage, Inc. | d444758d8k.htm |
 November 28,
2012 Presented by
H. MICHAEL SCHWARTZ
President, CEO
Strategic Storage Trust, Inc.
Exhibit 99.1 |
 2
Disclaimers and Risk Factors
CAUTIONARY NOTE REGARDING FORWARD-LOOKING STATEMENTS
Certain statements contained in this material, other than historical facts, may be considered
forward-looking statements within the meaning of Section 27A of the Securities Act
of 1933, as amended (the “Securities Act”) and Section 21E of the Securities Exchange Act of 1934, as amended (the “Exchange Act”). We intend for all
such forward looking statements to be covered by the applicable safe harbor provisions for
forward-looking statements contained in Section 27A of the Securities Act and
Section 21E of the Exchange Act, as applicable. Such statements include, in particular, statements about our plans, strategies, and prospects and are subject to
certain risks and uncertainties, including known and unknown risks, which could cause actual
results to differ materially from those projected or anticipated. Therefore, such
statements are not intended to be a guarantee of our performance in future periods. Such forward-looking statements can generally be identified by our use of
forward-looking terminology such as “may,” “will,” “expect,”
“intend,” “anticipate,” “estimate,” “believe,” “continue,” or other similar words. Readers are cautioned not
to place undue reliance on these forward-looking statements, which speak only as of the
date this report is filed with the Securities and Exchange Commission. We cannot
guarantee the accuracy of any such forward looking statements contained in this material, and we do not intend to publicly update or revise any forward-looking
statements, whether as a result of new information, future events, or otherwise.
Any such forward-looking statements are subject to risks, uncertainties, and other factors
and are based on a number of assumptions involving judgments with respect to,
among other things, future economic, competitive, and market conditions, all of which are difficult or impossible to predict accurately. To the extent that our
assumptions differ from actual results, our ability to meet such forward-looking
statements, including our ability to generate positive cash flow from operations and
provide distributions to stockholders, and our ability to find suitable investment properties,
may be significantly hindered. All forward-looking statements should be read
in light of the risks identified in our prospectus and supplements.
•
See our Form 10-K and recent Form 10-Q for specific risks associated with an
investment in Strategic Storage Trust, Inc..
•
As of September 30, 2012, our accumulated deficit was approximately $58 million, and our
operations will not be profitable in 2012.
•
No public market currently exists for shares of our common stock and we may not list our
shares on a national securities exchange before three to five years after completion of
this offering, if at all. It may be difficult to sell your shares. If you sell your shares, it will likely be at a substantial discount.
•
We have paid distributions from sources other than our cash flows from operations, including
from the net proceeds from our initial public offering. We are not prohibited from
undertaking such activities by our charter, bylaws or investment policies, and we may use an unlimited amount from any source to pay our
distributions. Until we generate operating cash flows sufficient to pay distributions to you,
we may pay distributions from the net proceeds of this offering or from borrowings in
anticipation of future cash flows. We also may be required to sell assets or issue new securities for cash in order to pay distributions. Any such actions
could reduce the amount of capital we ultimately invest in assets and negatively impact the
amount of income available for future distributions.
•
We have no employees and must depend on our advisor to select investments and conduct our
operations, and there is no guarantee that our advisor will devote adequate time or
resources to us. •
Our board of directors may change any of our investment objectives, including our focus
on self storage facilities.
•
We will pay substantial fees and expenses to our advisor, its affiliates and participating
broker-dealers, which will reduce cash available for investment and distribution. •
There are substantial conflicts of interest among us and our sponsor, advisor, property
manager and dealer manager.
•
We may fail to remain qualified as a REIT, which could adversely affect our operations and our
ability to make distributions.
•
We may incur substantial debt, which could hinder our ability to pay distributions to our
stockholders or could decrease the value of your investment.
•
Future distribution declarations are at the sole discretion of our board of directors and are
not guaranteed. Since our inception, our cumulative distributions have exceeded
cumulative GAAP earnings. We cannot assure you that we will achieve any of our investment objectives.
Risk Factors
Disclaimers
•We
encourage
you
to
review
our
SEC
filings
at
www.sec.gov.
|
 3
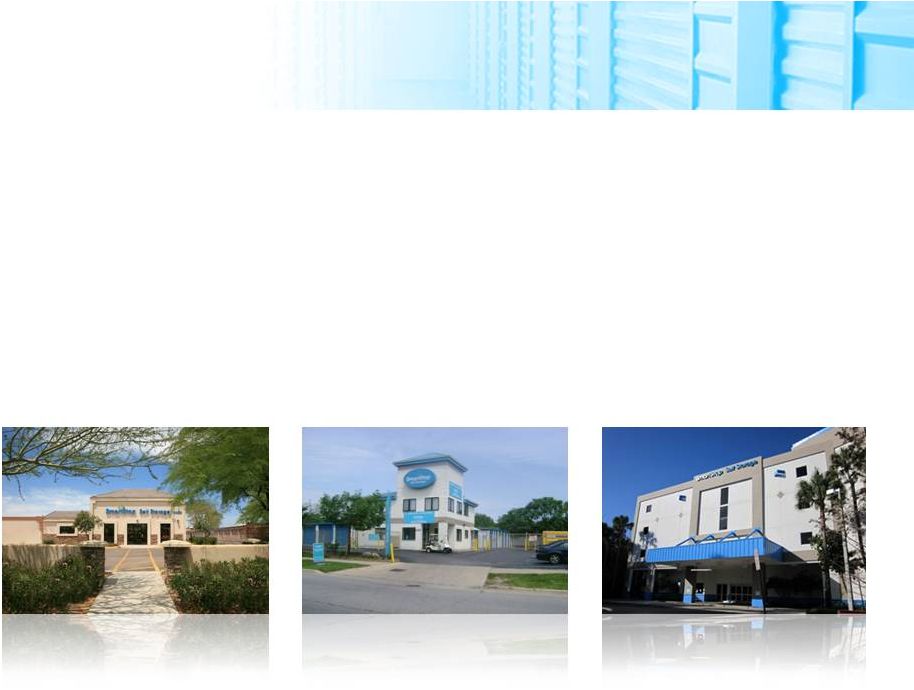
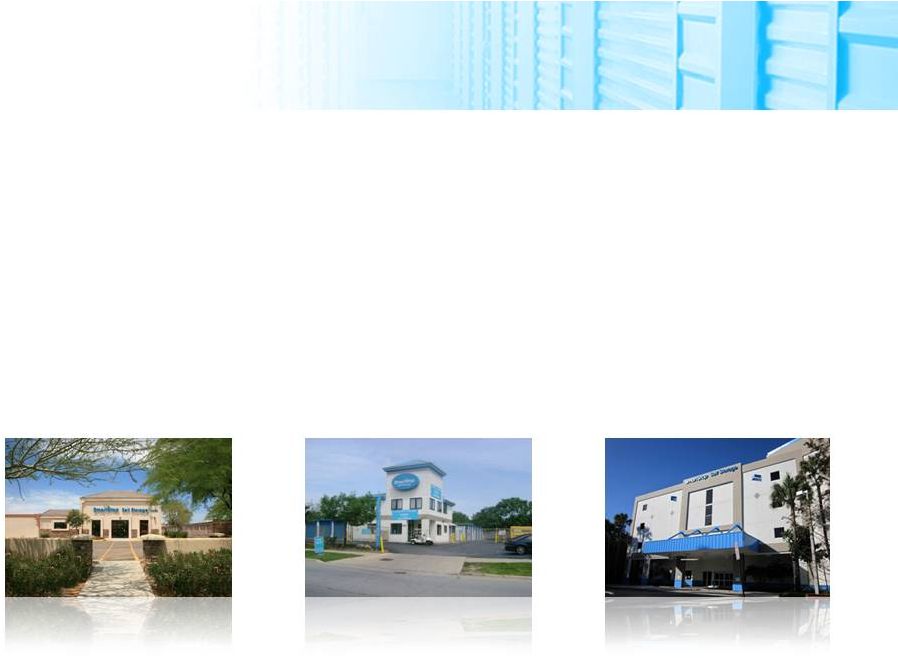
Strategic Storage Trust, Inc.
About Us
•First and only publicly registered non-traded REIT focused
on self storage
•Sponsor was ranked 7
th
in Mini-Storage Messenger’s Top
Operators List in 2012
•As of 11/5/12, SSTI wholly owns 108 properties in 17
states and Ontario, Canada with approximately 70,000
units and approximately 8.7 million rentable square feet |
 4
Agenda
•
Property Performance Highlights
•
Financial Snapshot
•
Acquisition Update
•
Strategic Vision |
 5
Property Performance Highlights
•
Same Store Performance
Revenues
Net Operating Income
•
Cash Flow from Operations
$1.2 million for nine months ending 9/30/2011
$6.4 million for nine months ending 9/30/2012
435%
•
IPA Modified Funds From Operations
172% increase in 3Q 2012 vs. 2Q 2012 |
 6
Property Performance Highlights
Same Store Performance
•
Revenues
5.5%
Net Operating Income
8.5%
Number of Facilities
72
Occupancy
83%
2012
vs.
79%
2011
Third Quarter 2012 vs. 2011 |
 7
Property Performance Highlights
Same Store Performance
•
Nine months ended September 2012 vs. 2011
Revenues
5.4%
Net Operating Income
8.8%
Number of Facilities
46
Occupancy
2012
80%
vs.
2011
76% |
 8
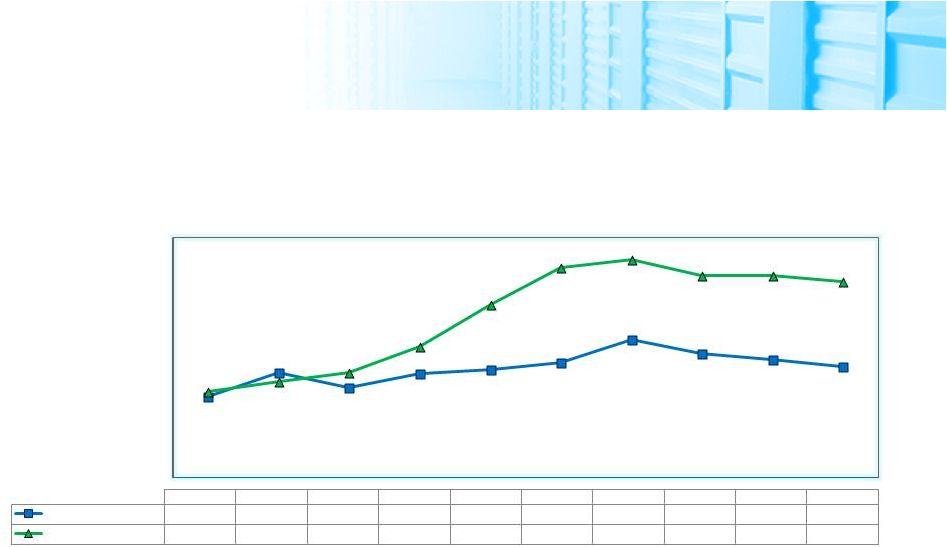
Property Performance Highlights
73.0%
74.0%
75.0%
76.0%
77.0%
78.0%
79.0%
80.0%
81.0%
82.0%
83.0%
84.0%
Jan-12
Feb-12
Mar-12
Apr-12
May-12
Jun-12
Jul-12
Aug-12
Sep-12
Oct-12
2011 Occ Sq Ft (%)
76.7%
77.8%
77.1%
77.8%
77.9%
78.3%
79.3%
78.7%
78.4%
78.1%
2012 Occ Sq Ft (%)
76.9%
77.4%
77.8%
79.0%
80.9%
82.6%
83.0%
82.2%
82.3%
82.0%
January -
October 2012 Same Store Occupancy
* Note: Highest occupancy achieved in 2011 was 79.3% on 7/31/11
Same Store: Jan
-
45 stores, Feb thru Mar –
55 stores, Apr thru Jun–
60 stores, Jul -
71 stores, Aug
-
75 stores, Sep thru Oct–
76 stores
Chart does not contain Canadian properties. |
 9
Property Performance Highlights
35.00%
40.00%
45.00%
50.00%
55.00%
60.00%
65.00%
70.00%
75.00%
Jan-12
Feb-12
Mar-12
Apr-12
May-12
Jun-12
Jul-12
Aug
-
12
Sep
-12
Oct-12
Move Ins
269
273
359
425
567
587
523
486
455
388
Move Outs
225
170
199
225
224
322
322
334
315
333
Net
44
103
160
200
343
265
201
152
140
55
Occ Sq Ft (%)
47.30%
48.80%
51.00%
53.10%
57.60%
61.00%
63.50%
65.50%
67.10%
67.30%
Former Homeland Stores
0
50
100
150
200
250
300
350
400
450
500
550
600
January
-
October
2012 |
 10
Agenda
•
Property Performance Highlights
•
Financial Snapshot
•
Acquisition Update
•
Strategic Vision |
 11
Financial Snapshot
•
Balance Sheet Debt
Lower leverage
Less short term debt
Lower interest rates |
 12
Financial Snapshot
Balance Sheet Debt
•$28 million bridge loan with KeyBank fully paid off
•Leverage decreased from 60% at 12/31/2011 to
53.2% as of 9/30/2012
•KeyBank
credit
facility
–
refinanced
$27
million
of
the
loan
to
longer
term
at
a
lower
interest
rate
–
4.65% |
 13
Financial Snapshot
As of
December 31,
2011
As of
March 31, 2012
As of
June 30, 2012
As of
September 30, 2012
2012
$65,286,402
$58,366,439
$45,626,812
$4,165,030
2013
$12,655,577
$12,820,529
$12,621,142
$19,687,374
Total
$77,941,979
$71,186,968
$58,247,954
$23,852,404
Short Term Debt –
Principal Payment Requirements |
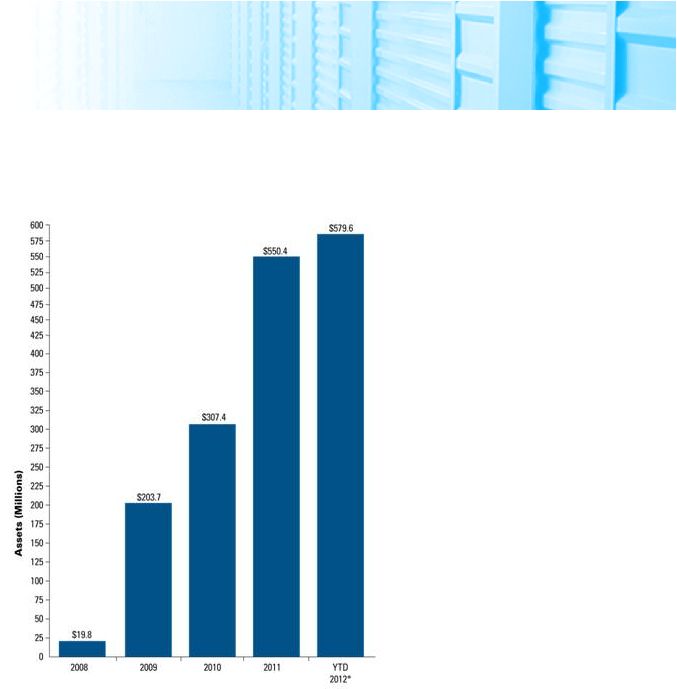 14
Financial Snapshot
Total Assets by Year
*YTD as of 9/30/12 |
 15
Financial Snapshot
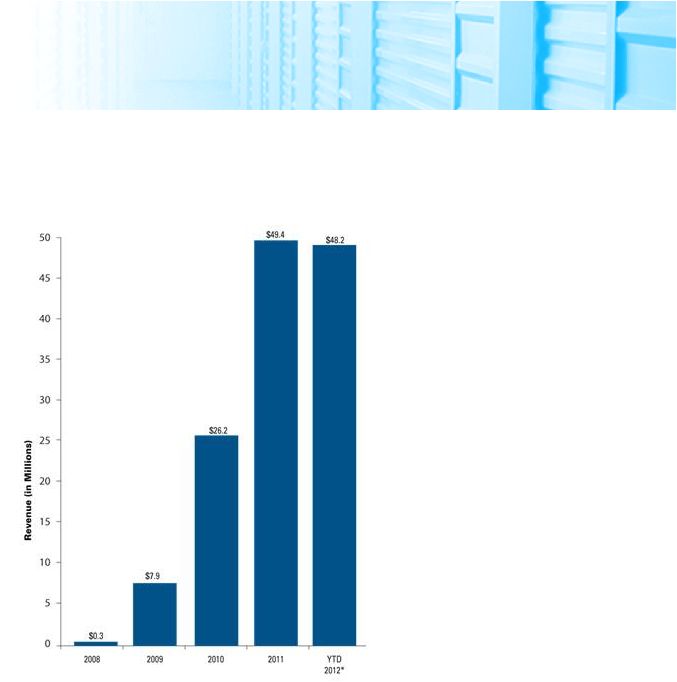
Total Revenues by Year
*YTD as of 9/30/12 |
 16
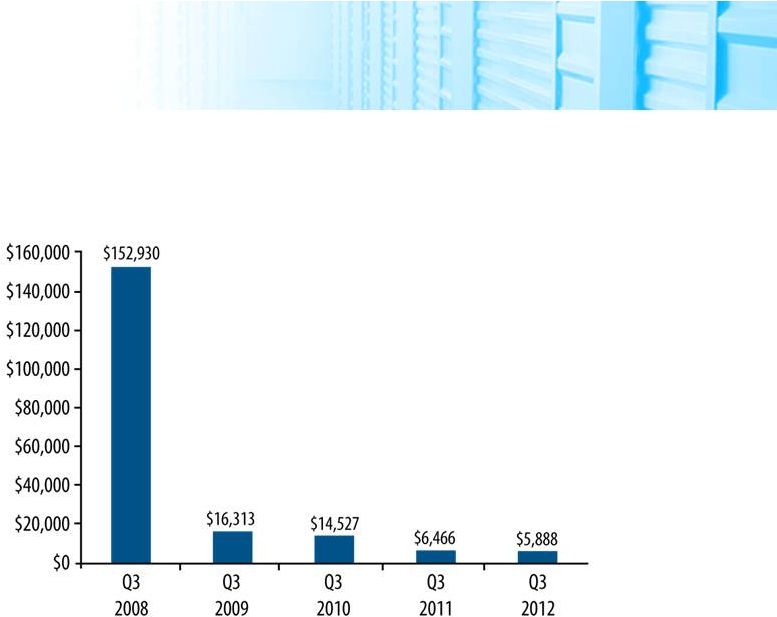
Financial Snapshot
G&A Per Property by Quarter |
 17
Agenda
•
Property Performance Highlights
•
Financial Snapshot
•
Acquisition Update
•
Strategic Vision |
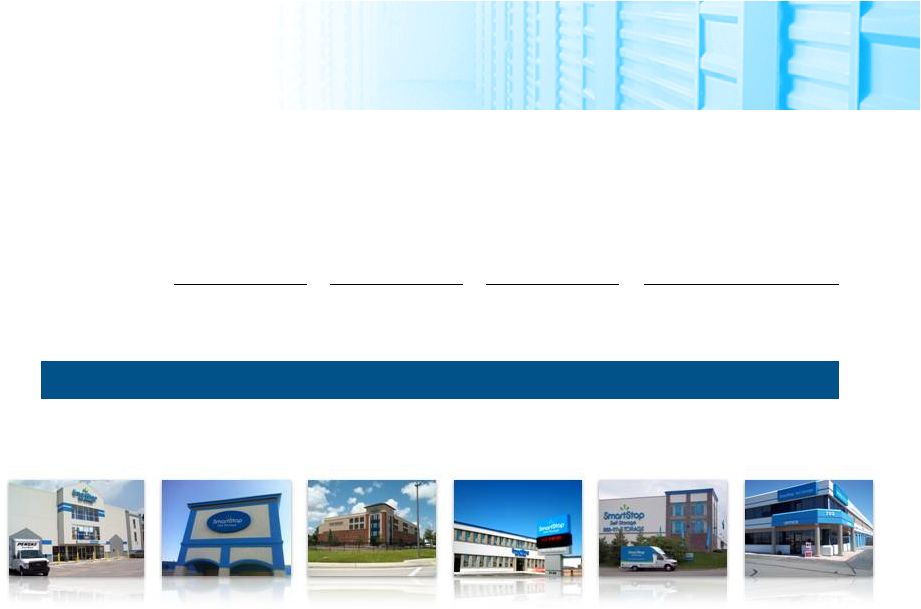
 18
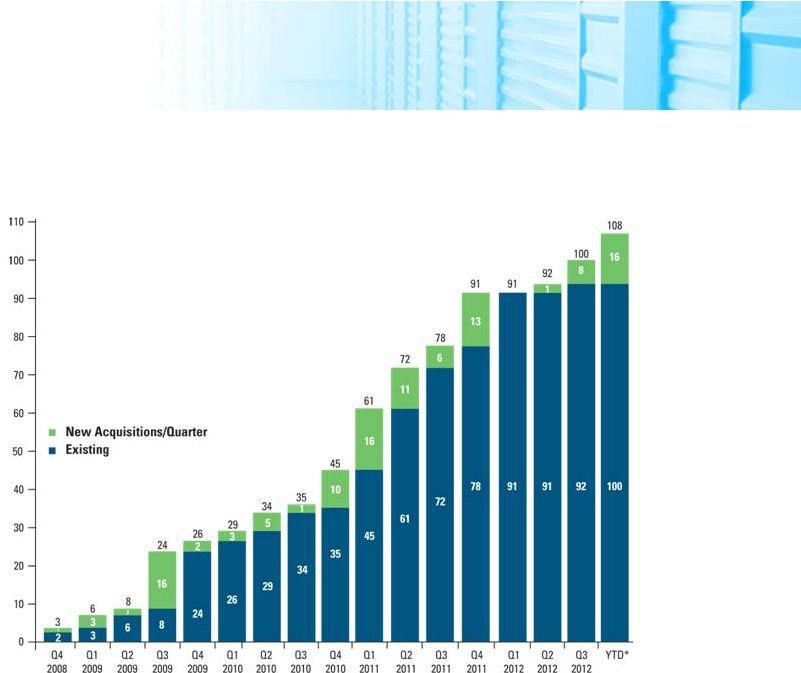
Acquisition Update
Wholly-Owned Properties by Quarter
*As of November 5, 2012 |
 19
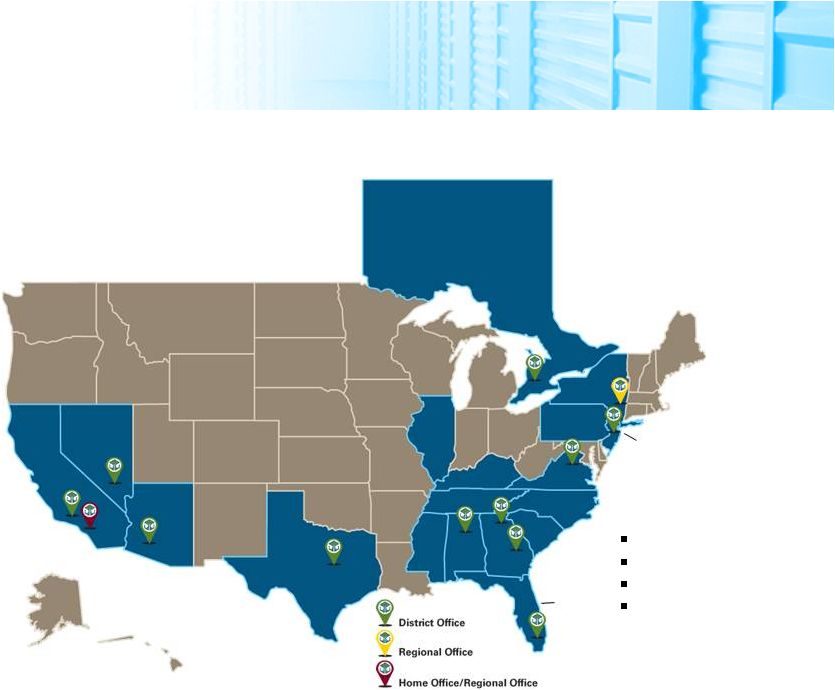
Rentable Square Feet by State
(as of 11/5/12)
Acquisition Update
108 properties
17 states, 1 province
70,000 units
8.7 million SF
6.5%
3.7%
4.3%
2.8%
9.6%
10.8%
1.7%
0.8%
19.5%
10.0%
1.1%
4.6%
3.9%
4.5%
3.1%
10.0%
2.1%
1.0% |
 20
Acquisition Update
Third Quarter Acquisitions
Property
State
Total
Savannah I
Georgia
$2,600,000
Savannah II
Georgia
$2,300,000
Columbia
South Carolina
$2,700,000
Lexington I
South Carolina
$2,000,000
Stuart I
Florida
$2,500,000
Lexington II
South Carolina
$4,300,000
Stuart II
Florida
$3,100,000
Bluffton
South Carolina
$5,500,000
Total
$25,000,000 |
 21
Acquisition Update
Fourth Quarter Acquisitions
Property
State
Total
Wilmington Island
Georgia
$8,100,000
Myrtle Beach
South Carolina
$3,300,000
Mt. Pleasant I
South Carolina
$3,000,000
Charleston I
South Carolina
$3,000,000
Charleston II
South Carolina
$3,300,000
Mt. Pleasant II
South Carolina
$6,700,000
Charleston III
South Carolina
$6,725,000
Mt. Pleasant III
South Carolina
$16,000,000
Total
$50,125,000 |
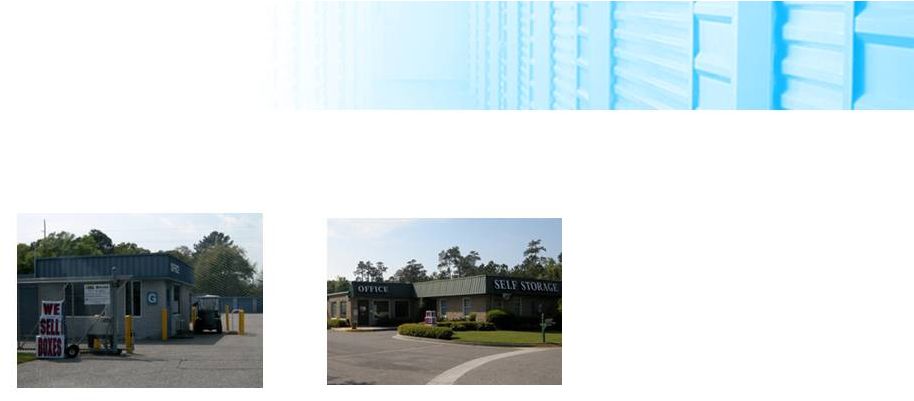
 22
Acquisition Update
4777 Highway 80,
E. Wilmington Island, Georgia
Units:
570
Year:
1999
Net Rentable:
69,400 SF
Acres:
3.48
3015 Ricks Industrial Park Dr.,
Myrtle Beach, South Carolina
Units:
480
Year:
2002
Net Rentable:
73,300 SF
Acres:
8.18
1117 Bowman Rd.,
Mt. Pleasant, South Carolina
Units:
390
Year:
1989
Net Rentable:
41,000 SF
Acres:
3.54
Stockade Properties |
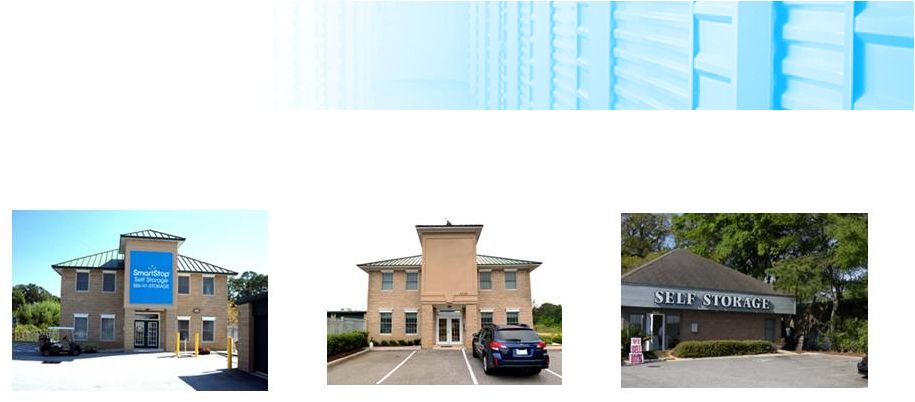
 23
Acquisition Update
2343 Savannah Hwy.,
Charleston, South Carolina
Units:
390
Year:
1975/1988/2001
Net Rentable:
46,700 SF
Acres:
2.31
1533 Ashley River Rd.,
Charleston, South Carolina
Units:
430
Year:
1992
Net Rentable:
46,400 SF
Acres:
2.96
Stockade Properties
1904 Hwy. 17 N.,
Mt. Pleasant, South Carolina
Units:
590
Year:
1995
Net Rentable:
63,600 SF
Acres:
5.04 |
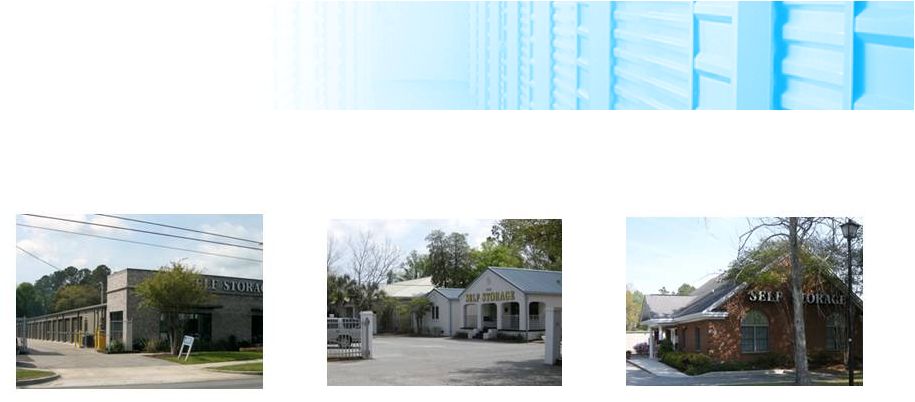
 24
Acquisition Update
1951 Maybank Hwy.,
Charleston, South Carolina
Units:
570
Year:
1986/1996
Net Rentable:
66,300 SF
Acres:
3.88
1108 Stockade Ln.,
Mt. Pleasant, South Carolina
Units:
1,370
Year:
1997/2007
Net Rentable:
195,100 SF
Acres:
11.70
Stockade Properties |
 25
Agenda
•
Property Performance Highlights
•
Financial Snapshot
•
Acquisition Update
•
Strategic Vision |
 26
Strategic Vision
•
Continued Revenue Growth
•
Occupancy Growth
•
Rental Rate Growth
•
Ancillary Sales |
 27
Strategic Vision
•
Stabilized Properties
•
70% occupancy
•
More predictable income
•
Lease-Up Properties
•
Occupancy below 70%
•
Greater opportunity for growth
Stabilized + Lease Up Properties
=
Income + Growth
=
Stockholder Value |
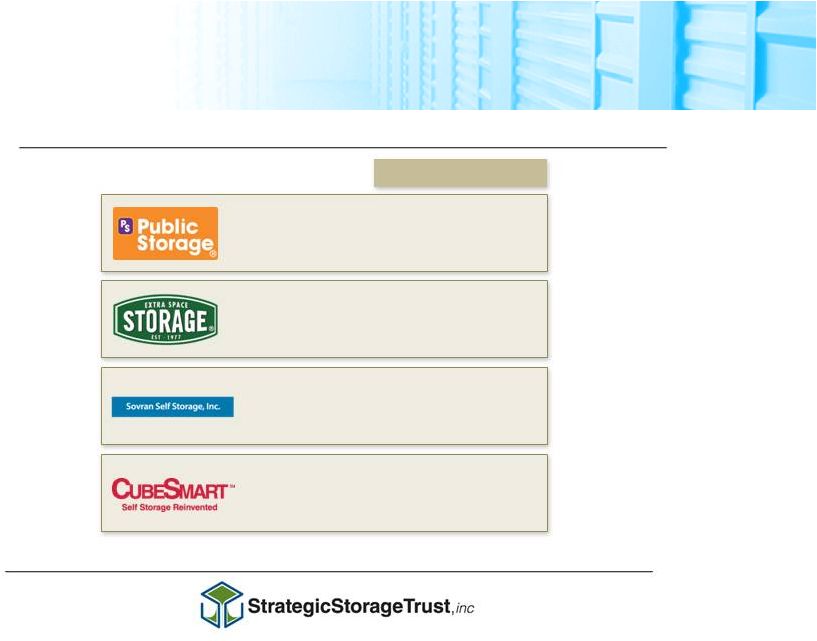 28
Strategic Vision
$3.72
(Billion)
$24.81
(Billion)
PUBLICLY TRADED SELF STORAGE REITS
Market Cap
(1)
PUBLIC NON-TRADED SELF STORAGE REIT
(1)
Bloomberg 11/20/2012
$1.83
(Billion)
$1.73
(Billion) |
 29
Questions? |
 30
Recap
•
Property Performance
•
Strategy is Working
•
Financials
•
Debt-Lower Interest Rates, Longer Terms
•
Acquisitions
•
Strong Assets in Key Locations
•
Vision
•
We are on Path |
 November 28,
2012 Presented by
H. MICHAEL SCHWARTZ
President, CEO
Strategic Storage Trust, Inc. |