Attached files
| file | filename |
|---|---|
| 8-K - FORM 8-K - Exelis Inc. | d445618d8k.htm |
 Exelis
Inc. 2012 Credit Suisse Aerospace & Defense Investor Conference
David F. Melcher, Chief Executive Officer & President
Peter Milligan, Chief Financial Officer and Senior Vice President
November 28, 2012
Exhibit 99.1 |
 SAFE
HARBOR
STATEMENT
Safe
Harbor
Statement
under
the
Private
Securities
Litigation
Reform
Act
of
1995
(the
“Act”):
Certain
material
presented
herein
includes
forward-looking
statements intended to qualify for the safe harbor from liability established by the Act. These
forward-looking statements include, but are not limited to, statements about the
separation of the Company from ITT Corporation, the terms and the effect of the separation, the nature and impact of such a separation,
capitalization of the Company, future strategic plans and other statements that describe the
Company’s business strategy, outlook, objectives, plans, intentions or
goals,
and
any
discussion
of
future
operating
or
financial
performance.
Whenever
used,
words
such
as
“anticipate,”
“estimate,”
“expect,”
“project,”
“intend,”
“plan,”
“believe,”
“target”
and other terms of similar meaning are intended to identify such forward-looking
statements. Forward-looking statements are uncertain and to some extent
unpredictable, and involve known and unknown risks, uncertainties and other important factors that could cause actual results to differ
materially from those expressed or implied in, or reasonably inferred from, such
forward-looking statements. Factors that could cause results to differ materially
from those anticipated include, but are not limited to:
In addition, there are risks and uncertainties relating to our separation from ITT Corporation
including whether those transactions will result in any tax liability, the operational
and financial profile of the Company or any of its businesses after giving effect to the separation, and the ability of the Company to operate as
an independent entity.
The Company undertakes no obligation to update any forward-looking statements, whether as
a result of new information, future events or otherwise, except as required by law. In
addition, forward-looking statements are subject to certain risks and uncertainties that could cause actual results to differ materially from
the Company’s historical experience and our present expectations or projections. These
risks and uncertainties include, but are not limited to, those described in Exelis
Inc.’s Annual Report on Form 10-K for the fiscal year ended December 31, 2011 and those described from time to time in our future reports filed with
the Securities and Exchange Commission.
Our dependence on the defense industry and the business risks
peculiar to that industry, including changing priorities or reductions
in the U.S.
Government or international defense budgets;
Government regulations and compliance therewith, including
changes to the Department of Defense procurement process;
Our international operations, including sales to foreign customers;
Competition, industry capacity and production rates;
Misconduct of our employees, subcontractors, agents and business
partners;
The level of returns on postretirement benefit plan assets and
potential employee benefit plan contributions and other
employment and pension matters;
Changes
in
interest
rates
and
other
factors
that
affect
earnings
and
cash flows;
The mix of our contracts and programs, our performance, and our
ability to control costs;
Governmental investigations;
Our
level
of
indebtedness
and
our
ability
to
make
payments
on
or
service
our
indebtedness;
Subcontractor performance;
Economic and capital markets conditions;
The availability and pricing of raw materials and components;
Ability to retain and recruit qualified personnel;
Protection of intellectual property rights;
Changes in technology;
Contingencies related to actual or alleged environmental contamination,
claims and concerns;
Security breaches and other disruptions to our information technology and
operations; and
Unanticipated changes in our tax provisions or exposure to additional
income tax liabilities.
2 |
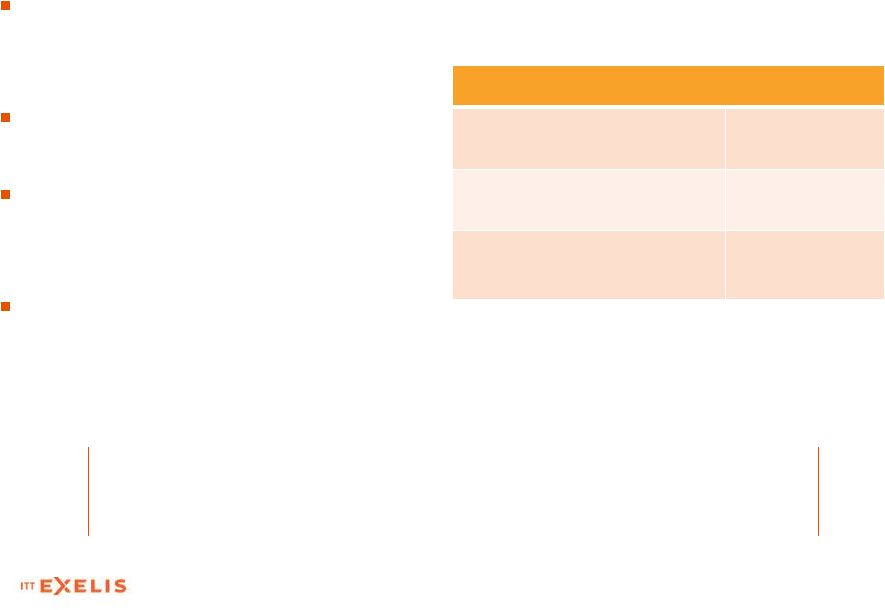 EXELIS – INVESTMENT
HIGHLIGHTS Diversified portfolio
with
attractive positions
in
enduring market segments
Mission-critical and affordable
ready-now solutions
Proven record of solid program
performance and operational
excellence
Large fielded base and platform-
agnostic solutions drive
sustainable revenue
3
(1)
See Appendix for non-GAAP reconciliations.
Diversified portfolio, strong cost controls,
Diversified portfolio, strong cost controls,
and solid FCF
and solid FCF
2012 Guidance
Revenue
$5.4B -
$5.5B
Adj. Operating Margin
(1)
10.6% -
10.8%
Adj. Earnings per Share
(1)
$1.80 -
$1.86 |
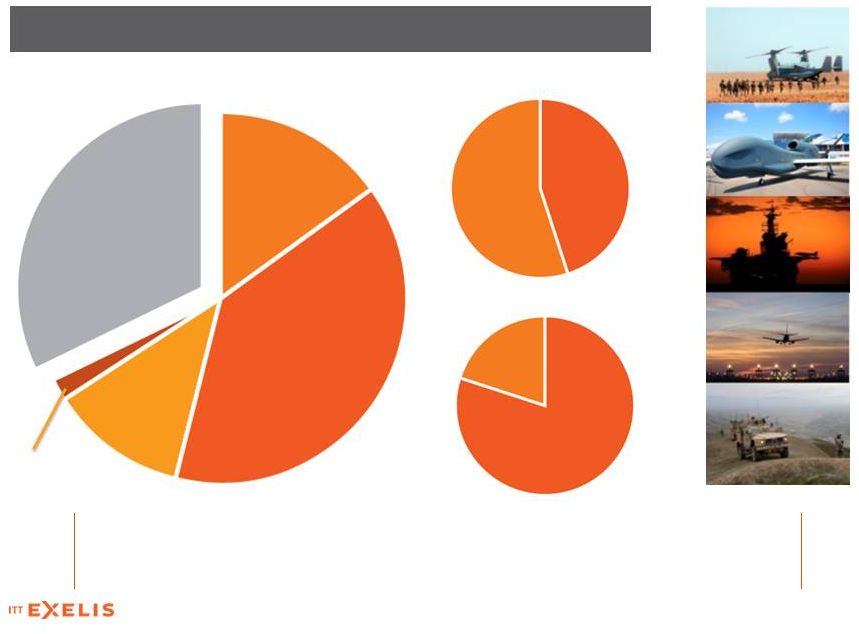 2011
REVENUE
BY
CUSTOMER
AND
CONTRACT
TYPE
4
Cost
Plus
55%
Fixed
Price
45%
Army
39%
Intel,
Special
Ops,
Other
DOD 2%
Navy
12%
Air Force
15%
International,
Other Non-DoD,
NASA,
Commercial, FAA
32%
CUSTOMERS
CONTRACT TYPE
CONTRACT POSITION
Customer and contract diversity provides
Customer and contract diversity provides
sustainability and mitigates against downside risk
sustainability and mitigates against downside risk
Sub
20%
Prime 80%
2011 Revenue $5.8B
2011 Revenue $5.8B |
 5
We are among the most agile C4ISR, aerospace, and information & technical services provider
with deep customer knowledge and technology expertise to deliver affordable,
mission-critical products and services. Information & Technical Services
(I&TS) C4ISR
Electronics
& Systems
>
Electronic warfare
>
Unmanned ISR
>
Force protection
>
Networked
communications
>
Radar
>
Composite structures
>
Reconnaissance &
surveillance
>
Acoustic systems
Information Systems
Mission Systems
Geospatial
Systems
Electronic
Systems
>Airborne
situational awareness
>Information
exploitation
>Space
-based
satellite imaging
>Weather
& climate monitoring
>
GPS
>
Night vision
>
Power solutions
>Information
-enabled
mission solutions
>High
-end engineering
services
>Air traffic
management systems
>Commercial
aviation solutions
>
Satellite ground
systems
>
Spectrum management
>
Space, ground & range
operations, sustainment,
upgrade & modernization
AGILITY AND INGENUITY FOR THE
21
CENTURY
ST
>
Global-base
operations and
infrastructure
support
>Battlefield
network communications &
information support
>Worldwide
logistics & deployment
support
>
Ground vehicle &
equipment
maintenance |
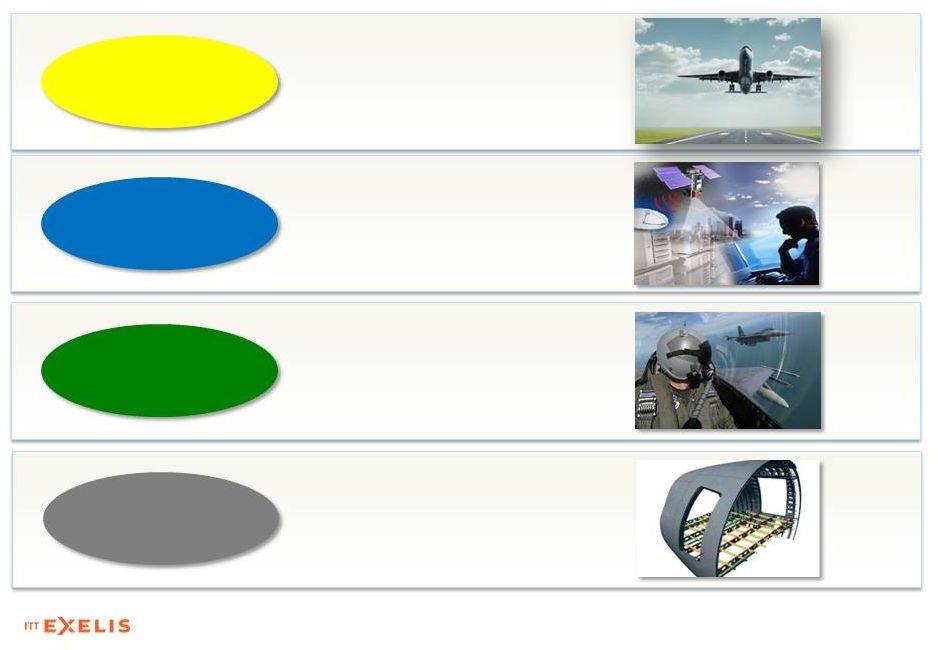 STRATEGIC
GROWTH
PLATFORMS
GUIDE
INVESTMENTS
6
Leverage deep technical expertise in
the electro-magnetic spectrum to
provide specialized systems and
components for critical missions
Provide key solutions in image
analysis, processing, exploitation
and dissemination
Design, build, operate and sustain
large, specialized and secure
communications networks for
customers for whom outages
are high-risk
Electronic
Warfare
Critical
Networks
Sensors to
Decisions
Invest and grow integrated
aerostructures assemblies
capabilities
Aerostructures |
 2012 PERFORMANCE (1)
Free Cash Flow = Cash Flow from Operations less Capital Expenditures plus Separation Costs.
Does not include dividend payments. For Non-GAAP reconciliations, refer to appendix
and www.exelisinc.com/investors 7
Performance in line with expectations
Performance in line with expectations
On track to achieve 2012 guidance
On track to achieve 2012 guidance
Revenue trending to high end of guidance range
Generated $167 of Free Cash Flow
(1)
in Q3
Positioning to perform in tighter U.S. DoD budget outlook
Key contract vehicles in place
Global Tactical Advanced Communications Systems (GTAC)
Enhanced Army Global Logistics Enterprise (EAGLE) Program
Adaptive Persistent Awareness System (APAS) |
 LOOKING AHEAD TO
2013
Positioning for greater flexibility in uncertain budget
environment
Anticipating pension headwind in 2013
Focused on cash generation -
managing cash obligations
8
Continue to deliver innovative, differentiated
Continue to deliver innovative, differentiated
and ready-now solutions
and ready-now solutions |
 9
|
 APPENDIX |
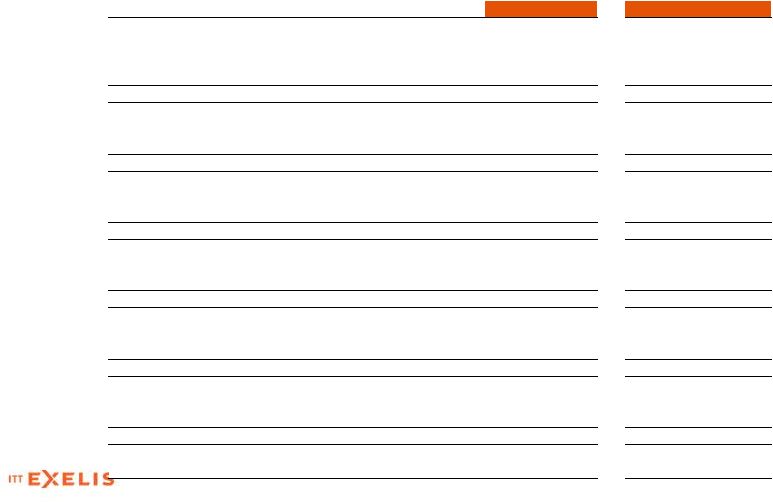
 RECONCILIATION OF
NON-GAAP
MEASURES
Management reviews key performance indicators including revenue,
segment operating income and margins, orders growth, and
backlog, among other metrics on a regular basis. In addition, we
consider certain additional measures to be useful to management
and investors evaluating our operating performance for the periods presented, and provide a
tool for evaluating our ongoing operations, liquidity and management of assets. This
information can assist investors in assessing our financial performance and
measures our ability to generate capital for deployment among competing strategic alternatives
and initiatives, including, but not limited to, acquisitions, and debt repayment. These
metrics, however, are not measures of financial performance under accounting principles
generally accepted in the United States of America (GAAP) and should not be considered
a substitute for sales, operating income, income from continuing operations, or net
cash from continuing operations as determined in accordance with GAAP. We consider the
following non-GAAP measures, which may not be comparable to similarly titled measures reported by
other companies, to be key performance indicators:
“adjusted net income”
defined as net income, adjusted to exclude items that include, but are not limited to
significant charges or credits that impact current results, but are not related to our
ongoing operations, unusual and infrequent non-operating items and
non-operating tax settlements or adjustments. A reconciliation of adjusted net income is
provided below. 11
($ million, except per share)
Q3 2012
Q3 2011
YTD Q3 2012
YTD Q3 2011
Net Income
88
101
244
262
Separation Costs, net of tax
4
6
19
15
Reversal of Separation Related Tax Receivable Write-down
(4)
-
(4)
-
Separation Related Tax Items
(4)
-
-
-
Adjusted Net Income
84
107
259
277
Net Income per fully diluted share
$0.47
$0.54
$1.30
$1.40
Adjusted Net Income per fully diluted share
$0.45
$0.57
$1.38
$1.48
Weighted Average Shares Outstanding, Diluted
188.7
187.1
188.3
187.1 |
 RECONCILIATION OF NON-GAAP
MEASURES “segment adjusted operating income”
defined as operating income of our two segments, adjusted to exclude items that
include, but are not limited to significant charges or credits that impact current results, but
are not related to our ongoing operations, unusual and infrequent non-operating
items and non-operating tax settlements or adjustments. A reconciliation of segment
operating income is provided below. “segment adjusted operating margin”
defined as segment adjusted operating income as defined above, divided by
revenue. A reconciliation of segment operating margin is provided below.
12
($ million)
Q3 2012
Q3 2011
YTD Q3 2012
YTD Q3 2011
Sales
1,361
1,529
4,161
4,359
C4ISR
611
746
1,884
2,114
I&TS
750
786
2,277
2,250
Eliminations
-
(3)
-
(5)
Segment Operating Income, As Reported
143
156
426
392
C4ISR
84
107
261
278
I&TS
59
49
165
114
Separation Costs
6
9
22
23
C4ISR
3
6
13
15
I&TS
3
3
9
8
Segment Operating Income, Adjusted
149
165
448
415
C4ISR
87
113
274
293
I&TS
62
52
174
122
Segment Operating Margin, As Reported
C4ISR
13.7%
14.3%
13.9%
13.2%
I&TS
7.9%
6.2%
7.2%
5.1%
Segment Operating Margin, Adjusted
C4ISR
14.2%
15.1%
14.5%
13.9%
I&TS
8.3%
6.6%
7.6%
5.4%
Operating Margin, As Reported
10.5%
10.2%
10.2%
9.0%
Operating Margin, Adjusted
10.9%
10.8%
10.8%
9.5% |
 “Free
cash flow” defined as GAAP cash flow from operating activities, less capital
expenditures plus separation costs. This metric does not include dividend
payments. 13
Free Cash Flow -
Quarterly
Q3 QTD 2012
Q3 YTD 2012
Q2 YTD 2012
($ million)
Cash Flow From Operating Activities
207
97
(110)
Subtract
Capital Expenditures
(36)
(86)
(50)
Free Cash Flow
171
11
(160)
Add:
Separation Costs, net of tax
4
19
15
Reversal of Separation Related Tax Receivable
(4)
(4)
-
Reversal of Separation Related Tax Items
(4)
-
4
Free Cash Flow, as Adjusted
167
26
(141)
RECONCILIATION OF
NON-GAAP MEASURES
|
 RECONCILIATION
OF
NON-GAAP
MEASURES
“Free cash flow”
defined as GAAP cash flow from operating activities, less capital expenditures plus separation
costs. This metric does not include dividend payments.
14
Free Cash Flow Year-to-Date
Q3 YTD 2012
Q3 YTD2011
($ million)
Cash Flow From Operating Activities
97
343
Subtract
Capital Expenditures
(86)
(55)
Free Cash Flow
11
288
Add:
Separation Costs, net of tax
19
15
Reversal Separation Tax Receivable
(4)
-
Separation Related Tax Items
-
-
Free Cash Flow, as Adjusted
26
303 |
 15
RECONCILIATION
OF
NON-GAAP
MEASURES
Operating Income, Operating Margin, & EPS Guidance Mid Point
($ million, except per share)
FY 2012
Sales, Guidance Mid Point Estimate
5,450
Operating Income, Guidance Mid Point Estimate
567
Separation Costs
27
Adjusted Operating Income, Guidance Mid Point Estimate
594
Operating Margin, Guidance Mid Point Estimate
10.4%
Adjusted Operating Margin, Guidance Mid Point Estimate
10.9%
Net Income, Guidance Mid Point Estimate
327
Separation Costs, net of tax
17
Adjusted Net Income, Guidance Mid Point Estimate
344
Net Income per fully diluted share, Guidance Mid Point Estimate
$1.74
Adjusted Net Income per fully diluted share, Guidance Mid Point Estimate
$1.83
Weighted Average number shares outstanding diluted
188.5 |