Attached files
| file | filename |
|---|---|
| 8-K - FORM 8-K - CommunityOne Bancorp | d442064d8k.htm |
 FNB
United Corp. Third Quarter 2012
November 19, 2012
Exhibit 99.1 |
 2
Presenters
Brian Simpson
Chief Executive Officer
David Nielsen
Chief Financial Officer
David Lavoie
Chief Risk Officer |
 3
Forward Looking Statements & Other Information
Forward Looking Statements
This
presentation
contains
certain
forward-looking
statements
within
the
safe
harbor
rules
of
the
federal
securities
laws.
These
statements
generally
relate
to
FNB’s
financial
condition,
results
of
operations,
plans,
objectives,
future
performance
or
business.
They
usually
can
be
identified
by
the
use
of
forward-looking
terminology,
such
as
“believes,”
“expects,”
or
“are
expected to,”
“plans,”
“projects,”
“goals,”
“estimates,”
“may,”
“should,”
“could,”
“would,”
“intends to,”
“outlook”
or “anticipates,”
or variations of these and similar words, or by discussions of strategies that
involve risks and uncertainties. Forward looking statements
are
subject
to
risks
and
uncertainties,
including
but
not
limited
to,
those
risks
described
in
FNB’s
Annual
Report
on
Form
10-K
for
the
year
ended
December
31,
2011
under
the
section
entitled
“Item
1A,
Risk
Factors,”
and
in
other
reports
that have been filed by FNB with the Securities and Exchange Commission. You are
cautioned not to place undue reliance on these forward-looking
statements, which are subject to numerous assumptions, risks and uncertainties, and which change
over time. These forward-looking statements speak only as of the date of this
presentation. Actual results may differ materially from those
expressed in or implied by any forward looking statements contained in this presentation. We assume
no duty to revise or update any forward-looking statements, except as required
by applicable law. Non-GAAP Financial Measures
In
addition
to
the
results
of
operations
presented
in
accordance
with
Generally
Accepted
Accounting
Principles
(GAAP),
FNB
management uses and this presentation contains or references, certain non-GAAP
financial measures, such as pre-tax, pre- credit &
non-recurring net income (PPNR), recurring non-credit, non-interest expense, recurring noninterest income, net
interest income on a fully taxable equivalent basis, proforma total loans, proforma
total ALL and fair value marks, proforma nonperforming
assets
and
tangible
shareholders’
equity.
FNB
believes
these
non-GAAP
financial
measures
provide
information useful to investors in understanding our underlying operational
performance and our business and performance trends as they facilitate
comparisons with the performance of others in the financial services industry. Although FNB believes
that
these
non-GAAP
financial
measures
enhance
investors’
understanding
of
FNB’s
business
and
performance,
these
non-
GAAP financial measures should not be considered an alternative to GAAP. The
non-GAAP financial measures contained within this presentation should be
read in conjunction with the audited financial statements and analysis as presented in
FNB’s Annual Report on Form 10-K as well as the unaudited financial
statements and analyses as presented in FNB’s Quarterly Reports on
Forms 10-Q. A reconciliation of non-GAAP measures to the most directly comparable GAAP measure
is included as an appendix to this presentation.
|
 4
Key Accomplishments
Execution of our key priorities
—
Reduced problem assets by $15 million or 9%, to $167 million
—
OREO reduced $6 million or 6%, to $81 million
—
$18 million of OREO was under contract at September 30,2012
—
Continued implementation of “Back to Business”
strategies:
—
Net loans and loans held for sale is up 2% in 2012 but fell by $36 million
or 3% in the 3rd quarter
—
Record quarter for originations and sales in our mortgage banking
business. Revenue increased 154% over 2Q 2012
—
Hired new bankers in key areas
—
Deposit mix continues to improve and cost decline, from 83 bps in 2Q to
76 bps in 3Q 2012. Since recap, deposit costs have declined by 54 bps as
a result of management strategies
—
Executing phased integration plan for the banks
—
Consolidated core data platform over Labor Day weekend
—
Conformed general ledgers in mid October
—
Heightened focus on reducing controllable expenses
—
Branch closures: 1 CommunityOne in July, 1 Granite in December
—
Cross-organization vendor expense review underway
—
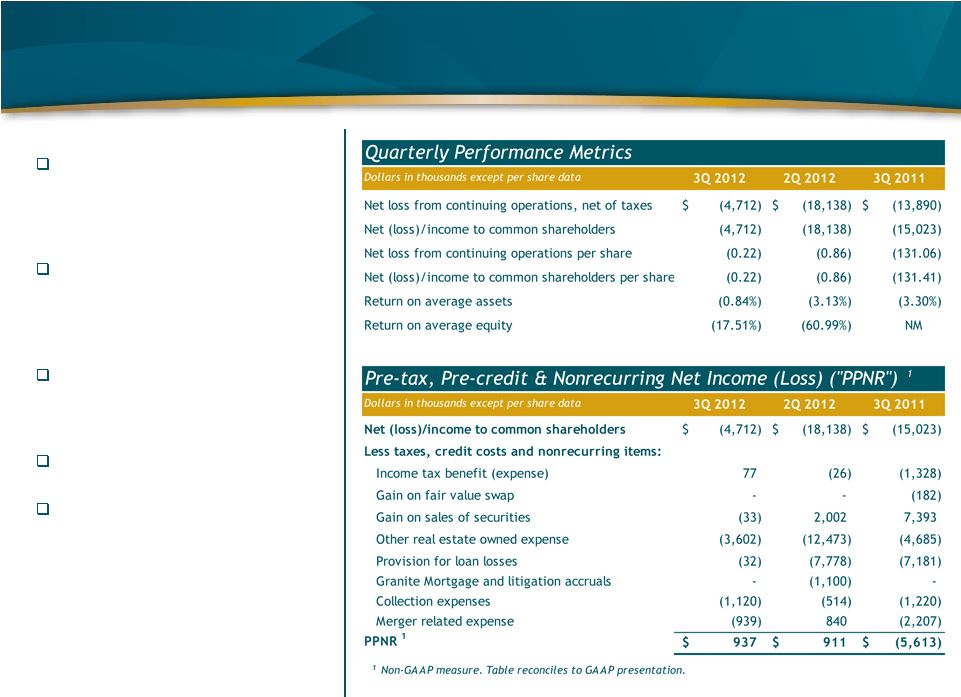
PPNR of $937 thousand in 3Q 2012 vs. $911 thousand in 2Q 2012 and
$(5.6) million in 3Q 2011
—
NIM declined from 3.06% to 2.95% on Granite Purchased Loan runoff
—
Up 91 bps since recap as a result of investment of excess liquidity and
reductions in nonperforming loans
Positive PPNR in 3Q 2012 |
 5
Quarterly Operating Highlights
3Q 2012 net loss from continuing
operations of $4.7 million, a $13.4
million decrease in net loss from 2Q
2012 and a $9.2 million improvement
in net loss from 3Q 2011
3Q 2012 net loss to common
shareholders of $4.7 million
compared to net losses to common
shareholders of $18.1 million in 2Q
2012 and $15.0 million in 3Q 2011
Net loss per common share of $0.22
per share compared to net losses of
$0.86 in 2Q 2012 and $131.41 in 3Q
2011
3Q 2011 does not reflect Granite
results
PPNR net income of $0.9 million in
3Q 2012 flat to the second quarter
and improved from a PPNR net loss
of $5.6 million in 3Q 2011 |
 6
Quarterly Operating Results
Net interest income in 3Q 2012
decreased $0.8 million (5%) to $15.2
million compared to 2Q 2012
Provision expense fell $7.7 million to
$32 thousand in 3Q 2012
—
Improved loan portfolio mix and
continued declines in non-
performing assets
Noninterest income fell $1.9 million
on $2.0 million in securities gains in
2Q, seasonal declines in service
charge income, partially offset by
strong mortgage banking related
income
Noninterest expense decreased $8.3
million (25%) in 3Q 2012 on $8.9
million decrease in OREO expenses
from 2Q 2012
Quarterly Results
Results of Operations
Dollars in thousands, except per share data
3Q 2012
2Q 2012
3Q 2011
Net interest income
15,202
$
16,049
$
7,739
$
Provision expense
(32)
(7,778)
(7,181)
Noninterest income
4,643
6,532
10,080
Noninterest expense
(24,602)
(32,915)
(23,200)
Net loss from continuing operations, net of taxes
(4,712)
(18,138)
(13,890)
Net loss from discontinued operations, net of taxes
-
-
(40)
Preferred stock gain and dividends, net
-
-
(1,093)
Net loss to common shareholders
(4,712)
$
(18,138)
$
(15,023)
$
(0.22)
$
(0.86)
$
(131.06)
$
Net loss to common shareholders per share
(0.22)
$
(0.86)
$
(131.41)
$
Weighted average basic and diluted shares outstanding
21,588,027
21,190,848
114,320
Net loss to common shareholders from
continuing operations per share |
 7
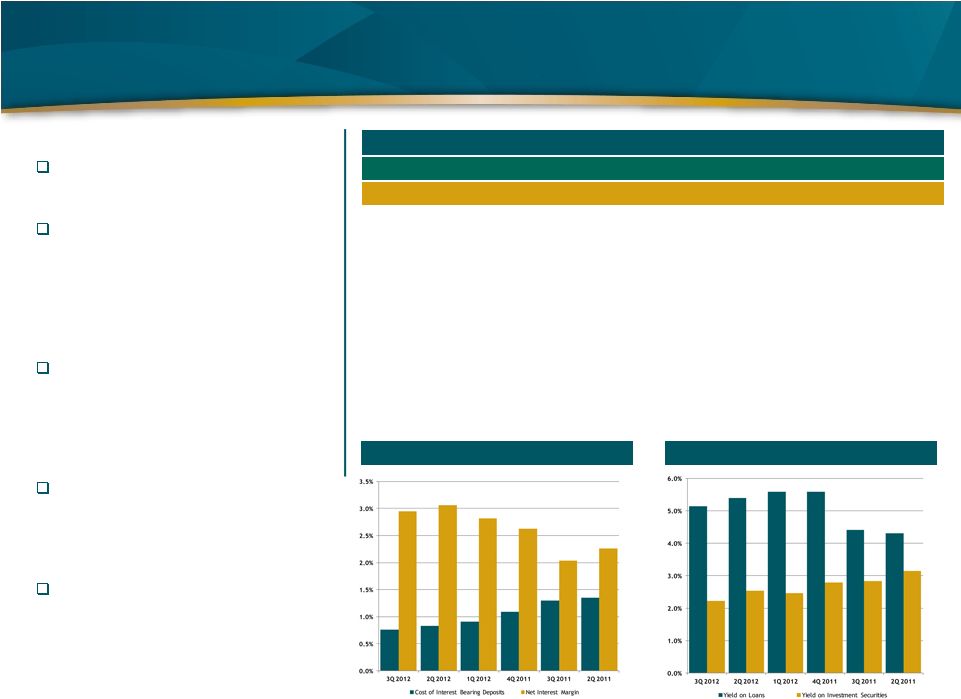
Net Interest Margin
Net interest margin declined 11 bps
to 2.95% from 3.06% in 2Q 2012
Average earning assets, net of low
yielding bank balances that declined
$52 million in the second quarter,
fell by $8 million in the quarter as a
result of loan runoff net of securities
portfolio growth
Average loan yield fell to 5.14% as a
result of the purchase of $36 million
of mortgage loan pools during the
third quarter of 2012, and the runoff
of higher yielding loans at Granite
Average loans fell $24.8 million (2%)
during 2Q 2012 on runoff of
purchases residential loan pools and
continued asset resolution
Improved deposit mix resulted in 7
bp decline in cost of deposits to 76
bps, down from 130 bps in 3Q 2011
NIM and Cost of Deposits
Loan and Securities Yields
Quarterly Results
Average Balances, Yields and Net Interest Margin
Dollars in thousands
3Q 2012
2Q 2012
3Q 2011
Average loans (includes loans held for sale)
1,262,229
$
1,287,022
$
992,096
$
Average yield
5.14%
5.40%
4.41%
Average earning assets
2,055,193
2,115,029
1,521,652
Average yield
3.73%
3.89%
3.50%
Average interest bearing liabilities
1,858,339
1,926,658
1,627,217
Average rate
0.86%
0.91%
1.37%
Average cost of deposits
0.76%
0.83%
1.30%
Net interest margin
2.95%
3.06%
2.04%
Net interest rate spread
2.87%
2.98%
2.13% |
 8
Noninterest Income
Recurring noninterest income
increased $146 thousand (3%) to $4.7
million from 2Q 2012
—
Nonrecurring securities gains of
$2.0 million during the second
quarter of 2012
Mortgage loan income increased
$441 thousand during the quarter
—
Sold $34 million of loans during
the quarter
Service charges on deposits declined
4% on seasonal declines
Quarterly Results
Noninterest Income
Dollars in thousands
3Q 2012
2Q 2012
3Q 2011
Service charges on deposit accounts
1,883
$
1,960
$
1,377
$
Mortgage loan income/(loss)
728
287
(116)
Cardholder and merchant services income
1,014
1,046
808
Trust and investment services
234
256
221
Bank-owned life insurance
290
314
262
Other service charges, commissions and fees
252
271
198
Securities (losses)/gains, net
(33)
2,002
7,393
Gain on fair value swap
-
-
(182)
Other income
275
396
119
Total noninterest income
4,643
$
6,532
$
10,080
$
Less:
Securities (losses)/gains, net
(33)
2,002
7,393
Gain on fair value swap
-
-
(182)
Recurring noninterest income
1
4,676
$
4,530
$
2,869
$
1
Non-GAAP measure. Reconciliation included in this table.
|
 9
Noninterest Expense
Noninterest expense fell $8.3 million
(25%) from 2Q 2012
—
OREO expense declined $8.9
million (71%) on reduced OREO
balances and stabilizing real
estate values
—
FDIC expense declined $0.2
million (14%)
—
Personnel expense declined $0.8
million (8%) during 3Q, primarily
on reduced benefits costs and
compensation accruals
—
Merger-related expenses
increased $1.8 million on merger
expense accrual reversals in the
second quarter of 2012
—
Other expenses declined $1.2
million on the accrual of $1.1
million of expense related to
Granite Mortgage and litigation
accruals in the second quarter
Excluding OREO, collection, non-
recurring merger, Granite Mortgage
and litigation accruals, and MSR
impairment, noninterest expense
declined by $726 thousand (4%)
Quarterly Results
Noninterest Expense
Dollars in thousands
3Q 2012
2Q 2012
3Q 2011
Personnel expense
9,717
$
10,541
$
6,453
$
Net occupancy expense
1,710
1,603
1,180
Furniture, equipment and data processing expense
2,012
2,020
1,561
Professional fees
1,336
1,109
1,339
Stationery, printing and supplies
152
153
100
Advertising and marketing
166
125
170
Other real estate owned expense
3,602
12,473
4,685
Credit/debit card expense
432
437
434
FDIC insurance
1,056
1,225
1,461
Loan collection expense
1,119
514
1,220
Merger-related expense
939
(840)
2,207
Loss on sale of loans held for sale
-
30
-
Core deposit intangible amortization
352
352
199
Other expense
2,009
3,173
2,191
Total noninterest expense
24,602
$
32,915
$
23,200
$
Other information:
Other real estate owned expense
3,602
$
12,473
$
4,685
$
Merger-related expense
939
(840)
2,207
Loan collection expense
1,119
514
1,220
Granite Mortgage and litigation accruals
-
1,100
-
Recurring non-credit noninterest expense
1
18,942
$
19,668
$
15,088
$
FTE Employees
637
635
462
1
Non-GAAP measure. Reconciliation included in this table.
|
 10
Balance Sheet
Total assets decreased $63.7 million
(3%)
—
Cash and interest bearing bank
balances decreased $36.0 million
(10%) on securities and loan
purchases and deposit actions
—
Investment securities increased
$15.3 million
—
Net loans decreased $35.5 million
(3%) on residential mortgage pool
runoff, problem asset resolution,
ALL charge offs, net of the
purchase of $36 million residential
mortgage portfolio during 3Q 2012
—
OREO decreased $5.4 million (6%)
on continued resolution and write
down activity
Deposits declined $59.5 million (3%)
—
Improved mix change from time
deposits to lower rate deposit
products
Balance sheet excludes reserved
deferred tax assets of $179 million,
including $34 million relating to the
Bank of Granite
Balance Sheet
Dollars in thousands
3Q 2012
2Q 2012
3Q 2011
Cash and interest bearing bank balances
327,870
$
363,879
$
364,011
$
Investment securities
492,386
477,136
199,271
Loans and loans held for sale, net
1,209,148
1,244,596
916,549
Other real estate owned
80,800
86,183
96,099
Intangible assets
11,574
11,678
3,577
Other assets
116,287
118,289
64,119
Assets from discontinued operations
-
-
268
Total assets
2,238,065
$
2,301,761
$
1,643,894
$
Deposits
1,982,253
$
2,041,770
$
1,565,636
$
Borrowings
124,474
126,507
184,957
24,465
25,482
22,141
-
-
1,092
Equity
106,873
108,002
(129,932)
Total liabilities and equity
2,238,065
$
2,301,761
$
1,643,894
$
Other liabilities
Liabilities from discontinued operations
Tangible Shareholders' Equity Rollforward
1
Dollars in thousands
Tangible shareholders' equity, December 31, 2011
116,933
$
Total comprehensive loss
(27,929)
Issuance of common stock, net of issuance costs
6,696
Expense related to 2011 issuance of common stock
(913)
Decrease/(increase) in intangible assets, net
508
Dividends, stock compensation expense and Series A preferred conversion, net
4
Tangible shareholders' equity, September 30, 2012
95,299
$
1
Non-GAAP measure. See Appendix for reconciliation to GAAP
presentation. |
 11
13%
13%
10%
18%
17%
15%
4%
4%
3%
23%
22%
18%
23%
23%
24%
3%
5%
8%
16%
17%
22%
0%
20%
40%
60%
80%
100%
3Q 2012
2Q 2012
3Q 2011
Noninterest-bearing demand
Interest-bearing demand
Savings
Money market
Time deposits < $100,000
Brokered
Time deposits > $100,000
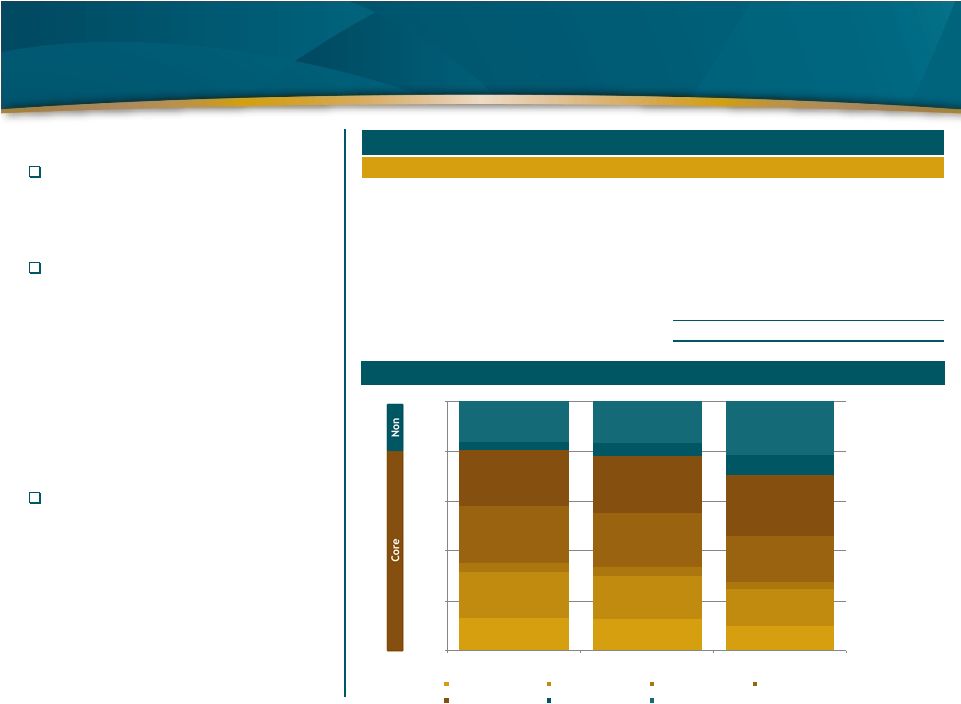
Deposits
Increased core deposits from 78% at
2Q 2012 to 81% of the total at 3Q
2012
Continued improved deposit mix
profile via management actions
—
Indeterminate term core now
represents 58% of deposits, up
from 55% in the prior quarter
—
Time deposits (including brokered
deposits) as a percentage of total
deposits declined from 45% at 2Q
2012 to 42% at 3Q 2012
Deposits declined by $59.5 million
(3%)
—
Brokered deposits fell by $33.3
million
Deposit Mix Composition
Deposits
Dollars in thousands
3Q 2012
2Q 2012
3Q 2011
Noninterest-bearing demand
264,370
$
262,087
$
157,207
$
Interest-bearing demand
358,376
353,586
231,467
Savings
73,382
72,925
46,168
Money market
450,164
441,824
288,345
Brokered
63,455
96,747
122,456
Time deposits < $100,000
449,542
471,366
383,259
Time deposits > $100,000
322,964
343,235
336,734
Total deposits
1,982,253
$
2,041,770
$
1,565,636
$ |
 12
Capital and Liquidity
Capital ratios at both banks
remain above the level
defined as “well capitalized”
under applicable law
Both banks, however, are
designated as “adequately
capitalized”
by their
regulators because they
remain subject to regulatory
orders
—
CommunityOne Bank and
Bank of Granite leverage
ratios are currently below
the levels required in their
respective regulatory
orders
—
CommunityOne Bank’s
total risk based capital
ratio is also below that
required by its order
The loans to deposits ratio
was stable at 62% at
September 30, 2012, and
improved from 57% at
September 30, 2011
Capital and Liquidity Ratios
Well
Regulatory
3Q 2012
2Q 2012
3Q 2011
Capitalized
Orders
FNB United Corp
Leverage
5.68%
5.83%
(8.54%)
5.00%
N/A
Tier 1 risk based capital
9.60%
9.62%
(13.48%)
6.00%
N/A
Total risk based capital
12.47%
12.19%
(13.48%)
10.00%
N/A
Tangible common equity/tangible assets
4.28%
4.21%
(8.14%)
N/A
N/A
Loans/deposits
62%
63%
57%
N/A
N/A
Cash and investment securities/deposits
41%
41%
36%
N/A
N/A
CommunityOne Bank
Leverage
6.46%
6.47%
(5.09%)
5.00%
9.00%
Tier 1 risk based capital
10.52%
10.45%
(8.06%)
6.00%
N/A
Total risk based capital
11.79%
11.73%
(8.06%)
10.00%
12.00%
Bank of Granite
Leverage
7.88%
7.61%
N/A
1
5.00%
8.00%
Tier 1 risk based capital
14.54%
13.37%
N/A
1
6.00%
N/A
Total risk based capital
15.57%
13.53%
N/A
1
10.00%
12.00%
1
FNB United Corp purchased Bank of Granite Corp and its bank subsidiary Bank of Granite
on October 21, 2011 |
 13
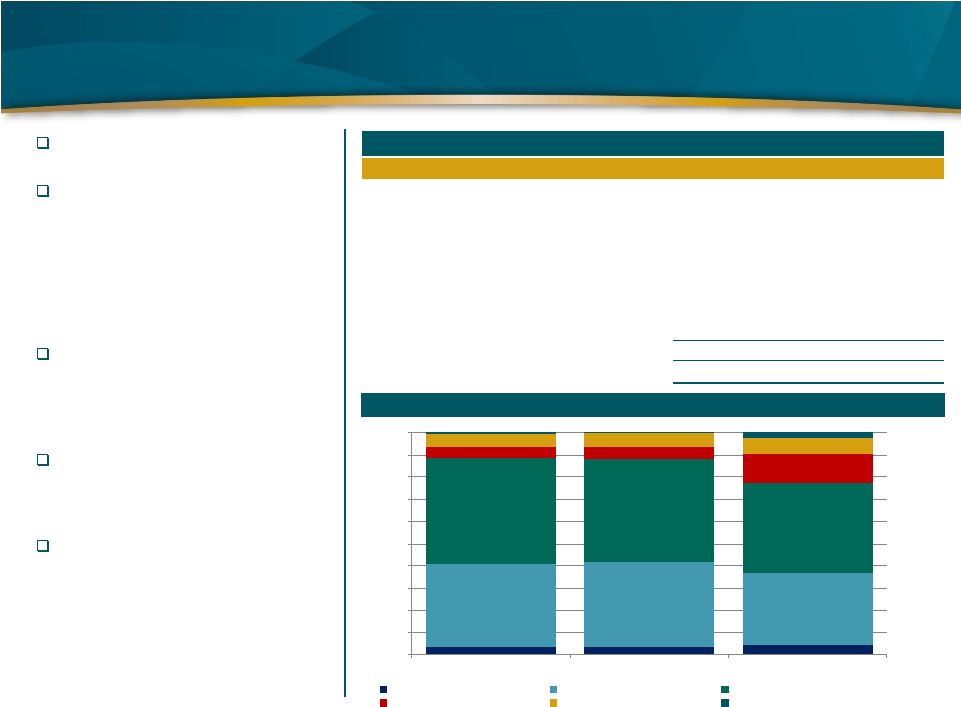
Loan Portfolio
Total loans, including loans held for
sale, decreased $43.1 million (3%)
1-4 family residential mortgage loans
portfolio were stable from 2Q 2012
—
Purchased a diversified pool of
loans totaling $36 million
—
Offset by prepayments and
amortization of previously
purchased pools
The Bank of Granite portfolio of
loans was added in the 4th quarter
of 2011 and was heavily weighted
toward commercial-purpose
mortgage loans
Real Estate Construction loans fell by
$14.3 million (19%) from 2Q 2012 to
5% of our total loans at 3Q 2012,
down from 13.7% a year ago
Credit costs for 3Q 2012 included net
charge-offs of $7.7 million and
write-downs and net loss on sale of
OREO of $1.6 million
Loan Portfolio Composition
4%
3%
5%
37%
38%
32%
48%
46%
40%
5%
6%
13%
6%
6%
7%
0%
10%
20%
30%
40%
50%
60%
70%
80%
90%
100%
3Q 2012
2Q 2012
3Q 2011
Consumer
CRE, OO and NOO
1-4 family residential
Real estate-construction
Commercial and agricultural
Loans held for sale
Loan Portfolio
Dollars in thousands
3Q 2012
2Q 2012
3Q 2011
Loans held for sale
8,212
$
1,324
$
25,661
$
Loans held for investment:
Commercial and agricultural
72,669
78,367
62,341
Real estate-construction
61,263
75,576
121,905
Real estate-mortgage:
1-4 family residential
590,251
589,972
369,093
Commercial
463,173
493,721
293,778
Consumer
44,439
44,187
43,771
Total Loans held for investment
1,231,795
1,281,823
890,888
Total loans
1,240,007
$
1,283,147
$
916,549
$ |
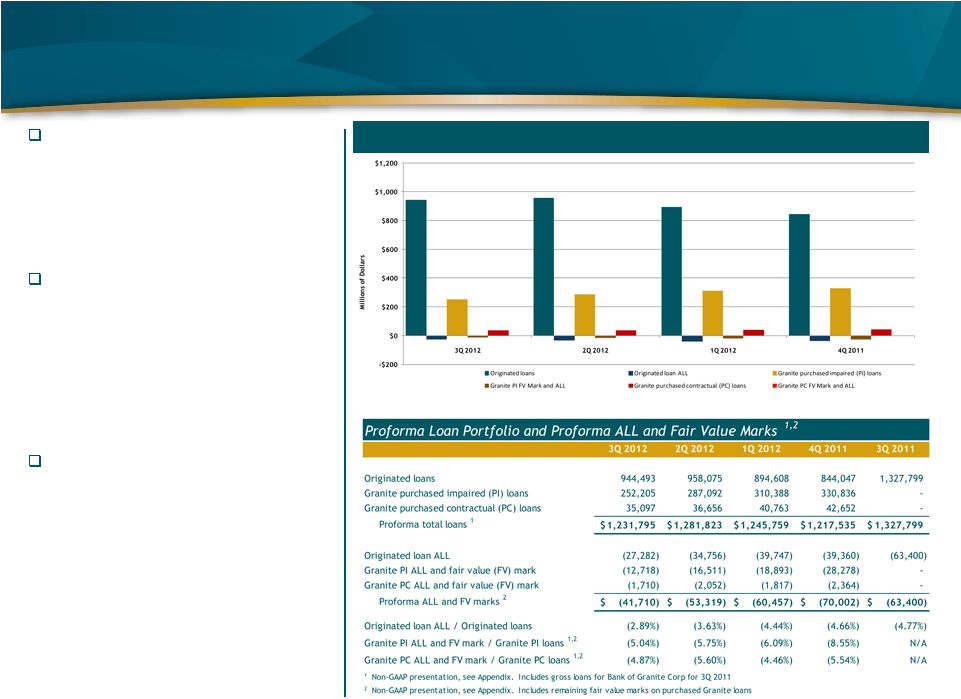 Portfolio
and Allowance For Loan Losses Originated loans (including purchased
mortgage pools) are accounted for
under ASC 310-20
—
ALL established via provision,
losses recognized via charge-offs
—
3Q 2012 ALL of $27.0 million
Granite purchased contractual (PC)
loans are accounted for under ASC
310-20
—
Subject to ALL as FV mark is
accreted
—
Total ALL and remaining
unaccreted FV mark of $1.7 million
at September 30, 2012
Granite purchased impaired (PI)
loans, are accounted for under ASC
310-30 (SOP-03-3)
—
ALL of $3.3 million established
during 2Q 2012 based on
reforecast of expected cash flows
—
Remaining FV mark of $9.4 million
at September30, 2012
—
Remaining projected accretion of
$36.6 million at the end of
September
Loan Portfolio and ALL By Origination Type
14 |
 15
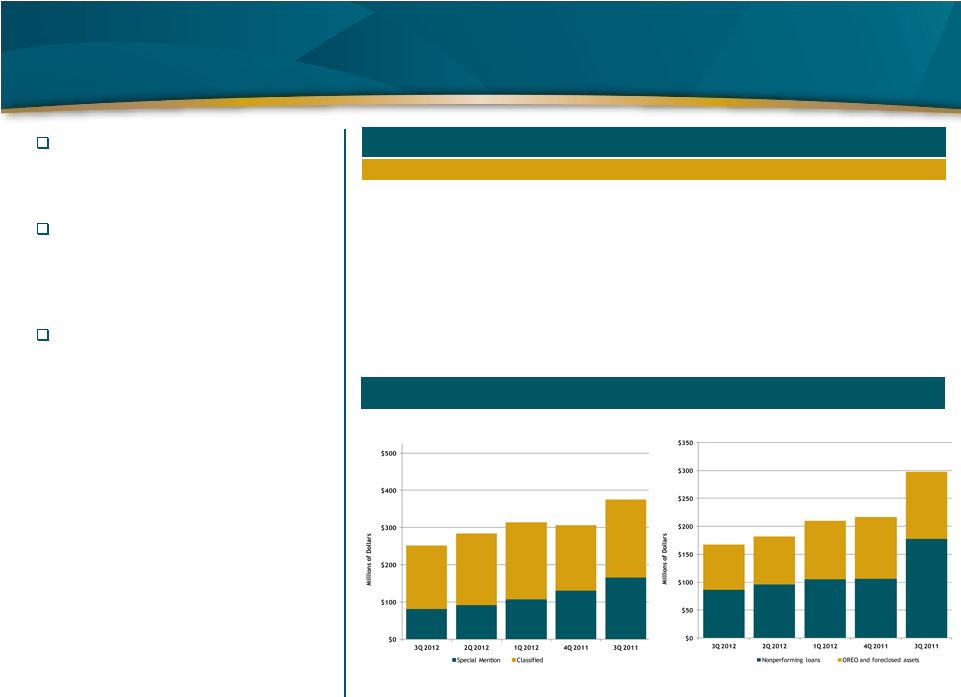
Asset Quality
The allowance has been reduced over
the last year, from $44 million to just
under $31 million, reflecting an
improvement in asset quality
The remaining fair value adjustment
on the acquired Granite portfolio fell
by $4 million as a result of accretion
and realization of expected loss
content
The Bank continues to be focused on
problem asset resolution, with a staff
of more than 20 in our Special Assets
Group.
—
$170 million of Classified loans and
$82 million of loans rated Special
Mention remain.
—
Reduction of problem loans will
continue to be one of our primary
objectives
Problem
Loan
and
Asset
Trends
¹
¹
Non-GAAP
presentation.
See
Appendix.
Charts
include
Bank
of
Granite
Corp
loans
and
OREO
in
3Q
2011
Asset
Quality
¹
Dollars in thousands
3Q 2012
2Q 2012
3Q 2011
Allowance for loan losses (ALL)
30,859
$
38,551
$
44,121
$
Remaining fair value (FV) mark on Granite portfolio
10,851
14,768
-
Nonperforming loans/Total loans
7.0%
7.5%
16.3%
Nonperforming assets/ Loans plus OREO
12.7%
13.3%
24.5%
Annualized net charge-offs/Average loans
2.46%
2.83%
9.07%
Allowance for loan loss/Total loans
2.51%
3.01%
4.95%
ALL
and
FV
mark/Total
loans
¹
3.39%
4.16%
4.95%
¹
Non-GAAP
presentation,
see
Appendix.
Includes
remaining
fair
value
marks
on
purchased
Granite
loans |
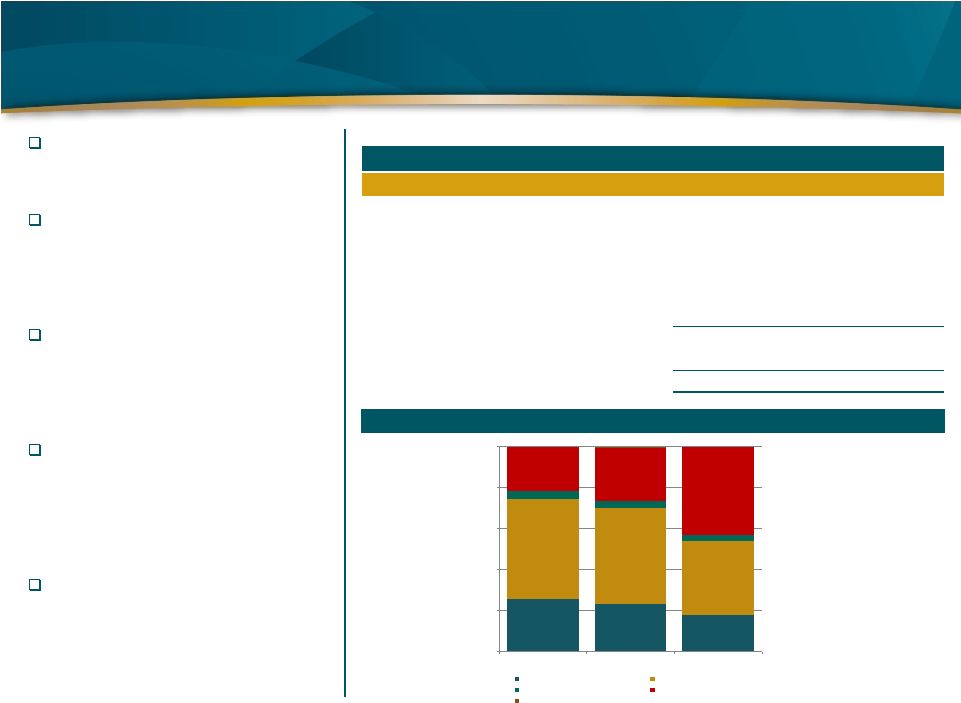 16
Non-Performing Assets
Nonperforming loans fell by $9 million
(11%) from 2Q 2012
Real estate construction loans remain
the most troubled category, but the
level of such loans has been reduced
68% since 3Q 2011
OREO dispositions have been
outpacing foreclosure additions.
OREO was reduced by $6 million (6%)
during the third quarter
OREO assets are carried at appraised
value less selling costs, and
sometimes adjusted further by
management due to age or other
market criteria
As of September 30, 2012, $18.2
million of OREO was under contract
for sale and carried at the net sales
price
Nonperforming Loans and OREO
Dollars in thousands
3Q 2012
2Q 2012
3Q 2011
Commercial and agricultural
3,147
$
2,934
$
4,126
$
Real estate - construction
18,506
24,853
62,203
Real estate - mortgage:
1-4 family residential
22,131
22,300
26,350
Commercial
42,133
44,817
52,361
Consumer
226
633
304
Total nonperforming loans
86,143
95,537
145,344
OREO, other foreclosed assets and disc ops assets
80,800
86,400
96,275
Total nonperforming assets
166,943
$
181,937
$
241,619
$
0%
20%
40%
60%
80%
100%
3Q 2012
2Q 2012
3Q 2011
RE -
1-4 Family
RE -
Commercial
Commercial and agricultural
Real estate -construction
Consumer
Nonperforming Loan Composition |
 Appendix |
 18
Non-GAAP Measures
Reconciles non-GAAP
measures to the most
directly comparable
GAAP measure
Reconciliation of Non-GAAP Measures
Dollars in thousands
3Q 2012
2Q 2012
3Q 2011
Total shareholders' equity
106,873
$
108,002
$
(129,932)
$
Less:
Goodwill
(4,205)
(4,205)
-
Core deposit and other intangibles
(7,369)
(7,473)
(3,577)
Tangible shareholders' equity
95,299
$
96,324
$
(133,509)
$
3Q 2012
2Q 2012
1Q 2012
4Q 2011
3Q 2011
Originated loan ALL
(27,282)
$
(34,756)
$
(39,747)
$
(39,360)
$
(44,121)
$
Purchased contractual (PC) loan ALL
(281)
(459)
(48)
-
-
Purchased impaired (PI) loan ALL
(3,296)
(3,336)
-
-
-
Total allowance for loan losses
(30,859)
(38,551)
(39,795)
(39,360)
(44,121)
Plus:
Pre purchase Bank of Granite Corp ALL
-
-
-
-
(19,279)
Fair value (FV) mark on PC loans
(1,429)
(1,593)
(1,769)
(2,364)
-
Fair value (FV) mark on PI loans
(9,422)
(13,175)
(18,893)
(28,278)
-
Proforma total ALL and FV mark
(41,710)
$
(53,319)
$
(60,457)
$
(70,002)
$
(63,400)
$
3Q 2012
2Q 2012
1Q 2012
4Q 2011
3Q 2011
Pass rated loans
979,993
$
998,025
$
931,211
$
910,650
$
952,668
$
Special mention rated loans
81,616
91,655
106,687
130,677
165,554
Classified loans
170,186
192,143
207,861
176,208
209,577
Total loans
1,231,795
1,281,823
1,245,759
1,217,535
890,888
Plus:
Pre purchase BOG Corp pass rated loans
-
-
-
-
274,465
Pre purchase BOG Corp special mention loans
-
-
-
-
79,961
Pre purchase BOG Corp classified loans
-
-
-
-
82,485
Proforma total loans
1,231,795
$
1,281,823
$
1,245,759
$
1,217,535
$
1,327,799
$
3Q 2012
2Q 2012
1Q 2012
4Q 2011
3Q 2011
Nonperforming Loans
86,143
$
95,537
$
105,341
$
105,973
$
145,344
$
OREO and Foreclosed Assets
80,800
86,400
104,379
110,386
96,275
Total nonperforming assets
166,943
181,937
209,720
216,359
241,619
Plus:
Pre purchase BOG Corp Nonperforming Loans
-
-
-
-
32,224
Pre purchase BOG Corp OREO
-
-
-
-
23,836
Proforma nonperforming assets
166,943
$
181,937
$
209,720
$
216,359
$
297,679
$ |