Attached files
| file | filename |
|---|---|
| 8-K - CURRENT REPORT - ASPIRITY HOLDINGS LLC | twin_8k.htm |
Exhibit 99.1
 |
16233 Kenyon Ave, Suite 210 Lakeville MN 55044 952-241-3103 main · 952-898-3571 fax |
| November 14, 2012 | PRESS RELEASE |
TCPH Reports Financial Results for 2012’s Third Quarter and First 9 Months
LAKEVILLE, MN – Twin Cities Power Holdings, LLC (“TCPH” or the “Company”) today announced its financial results for the third quarter and 9 months ended September 30, 2012:
| · | Total revenues for the third quarter were $5,130,000 compared to $6,849,000 for the same period in 2011, a decrease of 25.1%. |
| o | For the nine months, revenues were $12,555,000, down 66.5% from $34,470,000 for the same period in 2011. |
| · | Operating income for the third quarter of 2012 totaled $2,144,000, up 107.9% from $1,031,000 earned in the same period in 2011. |
| o | For the first nine months of 2012, operating income was $2,046,000, down 85.4% from the $13,999,000 earned in the same period last year. |
| · | Net income for the quarter totaled $1,936,000, up 173.1% from $709,000 in 2011. |
| o | For the nine months ended September 30, 2012, the Company recorded net income of $1,163,000, down 89.4% from the $10,594,000 earned in the same period last year. |
| · | The ratio of earnings to fixed charges1 for the trailing twelve months ended September 30, 2012 was 2.05 times. |
| · | With respect to our balance sheet: |
| o | At September 30, 2012, our liquidity ratio (cash, trading accounts and deposits, and trade receivables divided by total assets) declined very slightly to 92.2% compared to 92.5% at December 31, 2011; |
| o | Our debt-to-total capital ratio (total debt divided by total debt plus equity) improved to 53.8% at September 30, 2012 from 77.1% at year-end 2011; and |
| o | Our debt-to-equity ratio (total debt divided by equity) improved to 1.17 times at September 30, 2012 from 3.36 times at December 31, 2011. |
| · | Based on the NOAA forecast for the fourth quarter, we expect that the number of weather-driven trading opportunities will be below normal and are consequently forecasting that our earnings for 2012 will be in a range of $2.5 to $3 million on revenues of $17 to $20 million, a decrease from earlier guidance. |
In the short term, wholesale electricity price levels and changes are driven by supply and demand. Demand is affected by the weather while supply is driven by generation or transmission outages and fuel prices, particularly for natural gas. Generally, the Company’s greatest opportunities to generate trading revenues and profits occur during periods of market turbulence, when the near-term forecast for supply or demand is more likely to be inaccurate.
| 1 | "Earnings" are equal to income before taxes, interest expense, and one-third of operating lease rental expense to approximate the interest component attributable to such rent expense, with the remaining two-thirds considered to be depreciation. "Fixed charges" include interest expense plus one-third of operating lease rental expense. |
| Page 1 of 8 |
|
16233 Kenyon Ave, Suite 210 Lakeville MN 55044 952-241-3103 main · 952-898-3571 fax |
Normal weather (1980-2009 average) for the U.S. in the third quarter of the year is about 82 heating degree days and 810 cooling degree-days2. The third quarter of 2012 was about 10% warmer than normal with 78 HDD and 888 CDD and the same period in 2011 was 13% warmer than normal, with 73 heating degree days and 913 cooling degree-days.
Note that in terms of electricity consumption, cooling degree-days and heating degree-days are not necessarily equal. For example, many people will not turn on their air conditioners until the outside temperature reaches 75° or more and CDDs are measured from a base of 65°. Furthermore, while air conditioning always uses electricity, heating is often provided by other fuels such as natural gas or fuel oil.
At quarter-end, the benchmark Henry Hub spot price was $3.08/MMBtu and traded in a range of $2.64 to $3.20 during the quarter. Furthermore, weekly storage levels averaged 3,342 BCF for the period or about 27% above the 5-year average for the period of 2,687 BCF.
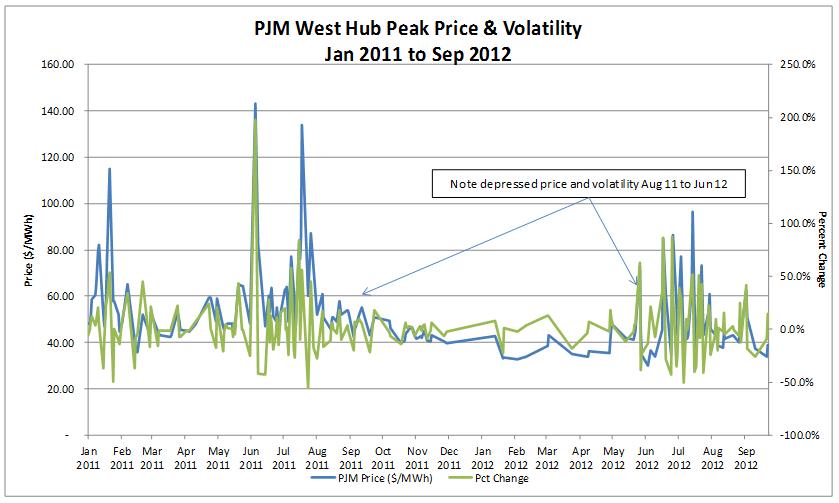
With respect to electricity markets, the average for the benchmark PJM West Peak price during the quarter was $49.29/MWh with a standard deviation of $13.14 and a trading range of $34.00 to $96.33. In Q3 2011, the PJM West Peak price averaged $59.50/MWh with a standard deviation of $17.84 and a trading range of $42.44 to $134.00.
"The big news for us during the quarter was our strategically important entry into the retail energy services business. On June 29, we closed on the acquisition of a small supplier serving residential and small commercial accounts in Connecticut. When we bought the business, it had only 148 customers, but by third quarter’s end, we had grown the number of customers receiving electricity generation service from us to over 2,000, and we had about 800 more awaiting service. Although revenues for the quarter were small at $134,000 and the business is not yet profitable, break-even is in sight; we intend to keep growing,” said Tim Krieger, TCPH’s Chief Executive Officer.
“With respect to our wholesale trading business, results year-to-date through the end of Q3 were somewhat impacted by the downsizing of our Canadian subsidiary, which began on February 1, 2011 and actually concluded during the quarter with our decision to cease operations in Canada. The unusual market conditions beyond our control that have characterized 2012 were the main reason for the decline in revenues compared to last year. The mild weather continued into the third quarter and natural gas is still cheap and abundant. These factors suppress the level of wholesale electricity prices, but we did see some volatility return to the market during the quarter. See the attached charts,” Mr. Krieger continued.
| 2 | A “degree-day” compares outdoor temperatures to a standard of 65°F. Hot days require energy for cooling and are measured in cooling degree-days (“CDD”) while cold days require energy for heating and are measured in heating degree-days (“HDD”). For example, a day with a mean temperature of 80°F would result in 15 CDD and a day with a mean temperature of 40°F would result in 25 HDD. |
| Page 2 of 8 |
|
16233 Kenyon Ave, Suite 210 Lakeville MN 55044 952-241-3103 main · 952-898-3571 fax |
“Finally, the NOAA three month forecast for November, December, and January calls for equal chances of above normal, normal, and below normal temperatures for much of the country, meaning that the mild weather is likely to continue for a while yet, and we may not see as many trading opportunities as we would like. Natural gas is also expected to continue trading below $4.00. Consequently, we are lowering our expected 2012 earnings range from $5 to $6 million to $2.5 to $3 million on revenues of $17 to $20 million, down from $20 to $25 million,” concluded Mr. Krieger.
About Twin Cities Power Holdings, LLC
Twin Cities Power Holdings, LLC is a Minnesota limited liability company that serves as a holding company for three wholly-owned subsidiaries - Twin Cities Power, LLC; Cygnus Partners, LLC; and Twin Cities Energy, LLC. The Company trades electricity for its own account in wholesale markets which are regulated by the Federal Energy Regulatory Commission as well as other energy-related contracts on exchanges regulated by the Commodity Futures Trading Commission. The Company is also authorized by the U.S. Department of Energy to export electricity to Canada and holds a retail electricity supplier license from the state of Connecticut. See www.townsquareenergy.com.
TCPH is headquartered at 16233 Kenyon Ave, Suite 210, Lakeville, MN 55044, telephone 952-241-3103. In addition to its headquarters, it also operates from four other locations – East Windsor, NJ; Tulsa, OK; Carlsbad, CA; and Newton, PA. More information about the Company is available at www.twincitiespower.com.
While the equity of TCPH is privately held, its Renewable Unsecured Subordinated Notes are registered with the SEC and may be purchased by residents of California, Colorado, Connecticut, Delaware, Florida, Georgia, Illinois, Indiana, Kansas, Michigan, Minnesota, Mississippi, Missouri, New Jersey, New York, Pennsylvania, South Dakota, Texas, Utah, Vermont, and Wisconsin. To obtain an investment kit, visit http://www.tcpnotes.com.
Forward Looking Statements
This press release contains forward-looking statements. Forward-looking statements can be identified by words such as: "may", "will", "expect", "anticipate", "believe", "estimate" "continue", "predict", or other similar words making reference to future periods, including expectations of 2012 revenues and earnings. Forward-looking statements appear in a number of places in this press release and include statements regarding our intent, belief, or current expectation about, among other things, trends affecting the markets in which we operate our business, financial condition, and growth strategies. Forward-looking statements are not guarantees of future performance and involve risks and uncertainties. Actual results may differ materially from those predicted in forward-looking statements as a result of various factors, including, but not limited to, those set forth in the "Risk Factors" sections of our filings with the Securities and Exchange Commission.
If any of the events described in these "Risk Factors" occur, they could have a material adverse effect on our business, financial condition, and results of operations. When considering forward-looking statements, you should keep these risk factors, as well as the other cautionary statements in our SEC filings in mind. You should not place undue reliance on any forward-looking statement. We undertake no obligation to update or revise publicly any forward-looking statements, whether as a result of new information, future events, or otherwise after the date of this press release.
| Page 3 of 8 |
|
16233 Kenyon Ave, Suite 210 Lakeville MN 55044 952-241-3103 main · 952-898-3571 fax |
Non-GAAP Financial Measures
TCPH’s press releases and other communications may include certain non-Generally Accepted Accounting Principles (“GAAP”) financial measures. A “non-GAAP financial measure” is defined as a numerical measure of a company's financial performance, financial position, or cash flows that excludes, or includes, amounts that are included in, or excluded from, the most directly comparable measure calculated and presented in accordance with GAAP in the company's financial statements.
Non-GAAP financial measures utilized by the Company include presentations of liquidity measures and debt-to-equity ratios. The Company’s management believes that these non-GAAP financial measures provide useful information and enables investors and analysts to more accurately compare the Company's ongoing financial performance over the periods presented.
Investor Relations Contact
Wiley H. Sharp III
VP - Finance & CFO, 952-241-3105
| Page 4 of 8 |
|
16233 Kenyon Ave, Suite 210 Lakeville MN 55044 952-241-3103 main · 952-898-3571 fax |
Twin Cities Power Holdings, LLC & Subsidiaries
| U.S. dollars in thousands | For 3 months ended Sep 30, | For 9 months ended Sep 30, | For year ended Dec 31, | |||||||||||||||||
| 2012 | 2011 | 2012 | 2011 | 2011 | ||||||||||||||||
| audited | ||||||||||||||||||||
| Statement of Operations Data | ||||||||||||||||||||
| Wholesale trading revenue, net | $ | 4,996 | $ | 6,849 | $ | 12,421 | $ | 37,186 | $ | 42,401 | ||||||||||
| Retail electricity revenue | 134 | – | 134 | – | – | |||||||||||||||
| Consulting fees | – | – | – | 284 | 312 | |||||||||||||||
| Net revenue | 5,130 | 6,849 | 12,555 | 37,470 | 42,713 | |||||||||||||||
| Total operating costs & expenses | 2,986 | 5,818 | 10,509 | 23,471 | 27,979 | |||||||||||||||
| Operating income | 2,144 | 1,031 | 2,046 | 13,999 | 14,734 | |||||||||||||||
| Interest expense | (248 | ) | (256 | ) | (836 | ) | (2,589 | ) | (3,028 | ) | ||||||||||
| Interest income | 6 | 8 | 24 | 21 | 60 | |||||||||||||||
| Other income (expense), net | – | – | (17 | ) | (69 | ) | (87 | ) | ||||||||||||
| Income before taxes | 1,902 | 783 | 1,217 | 11,362 | 11,679 | |||||||||||||||
| Tax provision (benefit) | (34 | ) | 74 | 54 | 408 | 458 | ||||||||||||||
| Net income | 1,936 | 709 | 1,163 | 10,954 | 11,221 | |||||||||||||||
| Preferred distributions | (137 | ) | – | (366 | ) | – | – | |||||||||||||
| Net income attributable to common | 1,799 | 709 | 797 | 10,954 | 11,221 | |||||||||||||||
| Foreign currency translation adjustment | (9 | ) | (78 | ) | (48 | ) | (116 | ) | 91 | |||||||||||
| Comprehensive income (loss | $ | 1,790 | $ | 631 | $ | 749 | $ | 10,838 | $ | 11,312 | ||||||||||
| Ratio of earnings to fixed charges | 7.54x | 3.66x | 2.26x | 5.20x | 4.66x | |||||||||||||||
| Ratio of earnings to fixed charges, trailing 12 months | – | – | 2.05x | – | 4.66x | |||||||||||||||
| At Sep 30, | At Sep 30, | At Dec 31, | ||||||||||
| 2012 | 2011 | 2011 | ||||||||||
| audited | ||||||||||||
| Balance Sheet Data | ||||||||||||
| Cash | $ | 1,357 | $ | 1,710 | $ | 971 | ||||||
| Trading accounts & deposits | 11,941 | 16,701 | 15,834 | |||||||||
| Trade receivables | 1,699 | 1,125 | 614 | |||||||||
| Prepaid expenses & other | 111 | 773 | 750 | |||||||||
| Total current assets | 15,108 | 20,309 | 18,169 | |||||||||
| Equipment & furnishings, net | 624 | 579 | 670 | |||||||||
| Intangible assets, net | 143 | – | – | |||||||||
| Deferred financing costs, net | 392 | – | – | |||||||||
| Total assets | $ | 16,267 | $ | 20,888 | $ | 18,839 | ||||||
| Trade payables | $ | 1,301 | $ | 932 | $ | 878 | ||||||
| Accrued expenses | 1,963 | 7,721 | 4,610 | |||||||||
| Notes payable, demand & current | 3,314 | 4,945 | 6,402 | |||||||||
| Total current liabilities | 6,578 | 13,598 | 11,890 | |||||||||
| Long term debt | 3,686 | – | 3,886 | |||||||||
| Total liabilities | 10,264 | 13,598 | 15,776 | |||||||||
| Redeemable preferred equity | 2,745 | – | – | |||||||||
| Common equity | 2,683 | 6,691 | 2,439 | |||||||||
| Accumulated comprehensive income | 575 | 599 | 624 | |||||||||
| Total equity | 6,003 | 7,290 | 3,063 | |||||||||
| Total liabilities & equity | $ | 16,267 | $ | 20,888 | $ | 18,839 | ||||||
| Liquidity, percent of total assets (2) | 92.2% | 93.5% | 92.5% | |||||||||
| Debt to total capital ratio | 53.8% | 40.4% | 77.1% | |||||||||
| Debt to equity ratio | 1.17x | 0.68x | 3.36x | |||||||||
1 - "Earnings" are equal to income before taxes, interest expense, and one-third of operating lease rental expense. "Fixed charges" include interest expense plus one-third of operating lease rental expense to approximate the interest component attributable to such rent expense, with the remaining two-thirds considered to be depreciation.
2 - "Liquidity" includes cash, trading accounts & deposits, and trade receivables.
| Page 5 of 8 |
|
16233 Kenyon Ave, Suite 210 Lakeville MN 55044 952-241-3103 main · 952-898-3571 fax |
This chart shows how the Company’s revenues (the blue bars) generally track changes in the price (light blue line) and volatility of power (green line), but other factors come into play as well, which might cause revenues to correlate less directly to volatility. Among others, these factors include the size and nature of the trades we may or may not have in place when and if the market moves, as well as the duration of profitable trading opportunities.

| Page 6 of 8 |
|
16233 Kenyon Ave, Suite 210 Lakeville MN 55044 952-241-3103 main · 952-898-3571 fax |
This chart shows the volatility in PJM West Hub Peak power prices from January 2011 to September 2012 as reported by ICE to EIA. Our revenues generally correspond to weather-driven volatility or lack thereof. The lack of normal volatility in the first half of 2012 reduced our revenues and profits; however volatility began returning to historical levels during late June and was near normal in the third quarter.
| Page 7 of 8 |
|
16233 Kenyon Ave, Suite 210 Lakeville MN 55044 952-241-3103 main · 952-898-3571 fax |
This chart shows the long term drivers of electricity prices, as represented by the monthly average PJM West Hub on-peak price (the marked blue line). These key price drivers include electricity use (the dotted red line), the price of natural gas (the solid yellow line), and the variance from the normal number of cooling degree-days (the blue bars). The pink bars show the variance of heating degree-days from normal. In general, power prices correlate very well with the price of natural gas, as it is the primary fuel for marginal electricity demand. Demand and prices increase or decrease when the weather is hotter or colder than normal.

Page 8 of 8