Attached files
| file | filename |
|---|---|
| 8-K - CURRENT REPORT OF MATERIAL EVENTS OR CORPORATE CHANGES - TIER REIT INC | a12-27042_18k.htm |
Exhibit 99.1
|
|
Behringer Harvard REIT I, Inc. Quarterly Update – Third Quarter 2012 The Terrace - Austin, TX |
|
|
Forward-Looking Statements This presentation contains forward-looking statements, including discussion and analysis of the financial condition of us and our subsidiaries and other matters. These forward-looking statements are not historical facts but are the intent, belief or current expectations of our management based on their knowledge and understanding of our business and industry. Words such as “may,” “anticipates,” “expects,” “intends,” “plans,” “believes,” “seeks,” “estimates,” “would,” “could,” “should” and variations of these words and similar expressions are intended to identify forward-looking statements. We intend that such forward-looking statements be subject to the safe harbor provisions created by Section 27A of the Securities Act of 1933 and Section 21E of the Securities Exchange Act of 1934. These statements are not guarantees of future performance and are subject to risks, uncertainties and other factors, some of which are beyond our control, are difficult to predict and could cause actual results to differ materially from those expressed or forecasted in the forward-looking statements. Forward-looking statements that were true at the time made may ultimately prove to be incorrect or false. We caution you not to place undue reliance on forward-looking statements, which reflect our management's view only as of the date of this presentation. We undertake no obligation to update or revise forward-looking statements to reflect changed assumptions, the occurrence of unanticipated events or changes to future operating results. 2 |
|
|
Forward-Looking Statements Forward-looking statements that were true at the time made may ultimately prove to be incorrect or false. We caution you not to place undue reliance on forward-looking statements, which reflect our management’s view only as of the date of this presentation. We undertake no obligation to update or revise forward-looking statements to reflect changed assumptions, the occurrence of unanticipated events or changes to future operating results. Factors that could cause actual results to differ materially from any forward-looking statements made in the presentation include but are not limited to: market and economic challenges experienced by the U.S. economy or real estate industry as a whole and the local economic conditions in the markets in which our properties are located; our ability to renew expiring leases and lease vacant spaces at favorable rates or at all; the inability of tenants to continue paying their rent obligations due to bankruptcy, insolvency or a general downturn in their businesses; the availability of cash flow from operating activities to fund distributions and capital expenditures; our ability to raise capital in the future by issuing additional equity or debt securities, selling our assets or otherwise to fund our future capital needs; our ability to strategically dispose of assets on favorable terms; our level of debt and the terms and limitations imposed on us by our debt agreements; our ability to retain our executive officers and other key personnel; the increase in our direct overhead as a result of becoming a self-managed company; conflicts of interest and competing demands faced by certain of our directors; limitations on our ability to terminate our property management agreement and certain services under our administrative services agreement; unfavorable changes in laws or regulations impacting our business or our assets; and factors that could affect our ability to qualify as a real estate investment trust. The forward-looking statements should be read in light of these and other risk factors identified in the “Risk Factors” section of our Quarterly Report on Form 10-Q for the quarter ended September 30, 2012 and our Annual Report on Form 10-K for the year ended December 31, 2011, as filed with the Securities and Exchange Commission. 3 |
|
|
Questions? During the call, please e-mail questions to: bhreit@behringerharvard.com 4 |
|
|
The Economy: October 2012 Sources: Bureau of Economic Analysis, Bureau of Labor Statistics, Thomson Reuters/University of Michigan Surveys of Consumers Third Quarter 2012 Private sector employment increased by 425,000 jobs in the third quarter 1.4 million private sector jobs added in first 9 months of 2012 Increases in consumer spending, government expenditures and residential investment lead to improved GDP in the third quarter Office markets stagnated amid sluggish growth in jobs U.S. Q3 2012 GDP +2.0% (advance estimate) up from Q2 revised GDP +1.3% U.S. September Unemployment Rate: 7.8% (October: 7.9% preliminary estimate) The Consumer Thomson Reuters/University of Michigan consumer sentiment index: 83.1 (October 2012) The highest index since September 2007 and up from 78.3 in September 2012 5 |
|
|
Consumer Sentiment Improving Source: Bloomberg, Thomson-Reuters/University of Michigan Surveys of Consumers Consumer Sentiment (Index) 6 |
|
|
Post-Recession Employment Slowly Recovering 7 |
|
|
Leading Indicators Improving at Moderate Pace Source: Conference Board, National Bureau of Economic Research, Bloomberg Index (2004=100) Recessions The Conference Board Leading Economic Index® The Conference Board Coincident Economic Index® ® Registered Trademark of The Conference Board Inc. 8 |
|
|
Funds from Operations (FFO*) and Modified Funds from Operations (MFFO*) FFO attributable to common shareholders for the third quarter 2012 was $21.9 million, or $0.07 per diluted share MFFO attributable to common shareholders for the third quarter 2012 was $15.4 million, or $0.05 per diluted share Excludes $2.9 million straight-line rent adjustment (including free rent) Excludes $3.6 million amortization of above / below market rent intangibles, net 9 *Reconciliations of net loss to FFO and MFFO are contained in the Current Report on Form 8-K that was filed on November 14, 2012 |
|
|
Same store occupancy was 84% at September 30, 2012 Decline of 1% as compared to September 30, 2011 Same store results include 48 properties comprising 17.9 million square feet Same store cash NOI* for third quarter 2012 was $50.4 million Increased $1.7 million, or 3.5%, as compared to third quarter 2011 Same store property revenue in third quarter 2012 totaled $102.5 million Increased $1.4 million, or 1.4%, as compared to third quarter 2011 primarily due to tenants transitioning from free rent into cash paying rent phase of leases Same store property expenses in third quarter 2012 were $52.1 million Decreased $0.3 million, or 0.5%, as compared to third quarter 2011 Same Store Results – 3rd Quarter 2012 vs. 3rd Quarter 2011 10 *Reconciliations of net loss to same store cash NOI are contained in the Current Report on Form 8-K that was filed on November 14, 2012 |

|
|
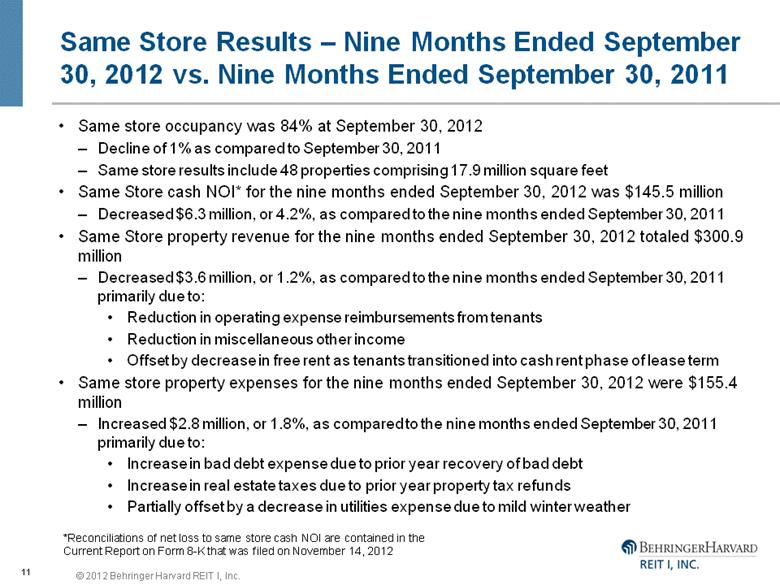
Same store occupancy was 84% at September 30, 2012 Decline of 1% as compared to September 30, 2011 Same store results include 48 properties comprising 17.9 million square feet Same Store cash NOI* for the nine months ended September 30, 2012 was $145.5 million Decreased $6.3 million, or 4.2%, as compared to the nine months ended September 30, 2011 Same Store property revenue for the nine months ended September 30, 2012 totaled $300.9 million Decreased $3.6 million, or 1.2%, as compared to the nine months ended September 30, 2011 primarily due to: Reduction in operating expense reimbursements from tenants Reduction in miscellaneous other income Offset by decrease in free rent as tenants transitioned into cash rent phase of lease term Same store property expenses for the nine months ended September 30, 2012 were $155.4 million Increased $2.8 million, or 1.8%, as compared to the nine months ended September 30, 2011 primarily due to: Increase in bad debt expense due to prior year recovery of bad debt Increase in real estate taxes due to prior year property tax refunds Partially offset by a decrease in utilities expense due to mild winter weather Same Store Results – Nine Months Ended September 30, 2012 vs. Nine Months Ended September 30, 2011 11 *Reconciliations of net loss to same store cash NOI are contained in the Current Report on Form 8-K that was filed on November 14, 2012 |
|
|
Same store occupancy was 84% at September 30, 2012 Decline of 1% as compared to June 30, 2012 Includes 49 properties comprising 18.2 million square feet Same store cash NOI* for third quarter 2012 was $51.8 million Increased $1.2 million, or 2.3%, as compared to second quarter 2012 Same store property revenue in third quarter 2012 totaled $105.3 million Increased $2.7 million, or 2.6%, as compared to second quarter 2012 primarily due to: Reduction in free rent as tenants transition into cash paying rent phase of leases Increase in occupancy throughout the quarter prior to the impact of two August 2012 lease expirations Increase in operating expense reimbursements from tenants Same store property expenses in third quarter 2012 were $53.5 million Increased $1.5 million, or 2.9%, as compared to second quarter 2012 primarily due to: Increase in real estate taxes related to refunds received in second quarter 2012 Seasonal increase in summer utilities expense Same Store Results – 3rd Quarter 2012 vs. 2nd Quarter 2012 12 *Reconciliations of net loss to same store cash NOI are contained in the Current Report on Form 8-K that was filed on November 14, 2012 |

|
|
Portfolio Characteristics As of September 30, 2012 52 properties 19.2 million square feet* 85% occupancy* 27 markets *Represents our pro rata ownership share United Plaza – Philadelphia, PA 13 |
|
|
Portfolio Characteristics – Core and Non-Core Properties As of September 30, 2012: Core Properties 24 operating properties 13.0 million square feet* 88% occupancy* 11 markets Non-Core Properties 28 operating properties 6.1 million square feet* 77% occupancy* 16 markets *Represents our pro rata ownership share 14 |

|
|
8 Largest Markets – by Percent of Net Operating Income *Represents NOI generated during the three months ended September 30, 2012 by properties owned as of September 30, 2012. 15 |
|
|
Highlights - Third Quarter and Year-to-Date Became a Self-Managed REIT Provides greater strategic flexibility to proactively pursue growth capital and liquidity options for our shareholders Eliminates various fees resulting in a more efficient cost structure with expected annual savings of $10 to $12 million Leasing Activity 975,000 square feet of leases expired during the quarter; leased 720,000 square feet bringing total 2012 leasing to 2.3 million square feet 2012 leasing efforts have resulted in 80,000 square feet of positive net absorption, increasing occupancy from 84% at year-end 2011 to 85% at September 30 Net cash rents for the 2.3 million square feet of leasing declined 5% from expiring cash rents; straight-lined net rents increased 3% from the straight-lined rents of expiring leases Beginning to see benefits of leasing efforts as certain tenants are moving from free rent to rent pay; free rent represented approximately 4.5% of contractual base rent during the third quarter compared to approximately 5.7% for the second quarter and 9.8% for the first quarter Due in part to tenants moving from free rent to rent paying, MFFO reached $15.4 million for the third quarter compared to $13.3 million for the second quarter and $7.5 million for the first quarter 16 |
|
|
Highlights - Third Quarter and Year-to-Date (continued) Property Disposition Activity Sold one property totaling 609,000 square feet during the third quarter bringing total dispositions for the first nine months to five properties totaling 1.2 million square feet Following quarter end, we sold one additional property in which we held an approximate 41% ownership interest 2012 disposition activity has allowed us to: Exit four markets during the year; and Reduce outstanding borrowings under our $340 million credit facility from a high of $298 million at March 31 to $208 million currently Investment Activity Began development of Two BriarLake Plaza, a 318,000 square foot property in Houston, Texas that is 50% pre-leased to Samsung Engineering America Inc. The development will complement our existing 502,000 square foot One BriarLake Plaza property that is currently 95% occupied and 100% leased 17 |
|
|
Leasing Cost Analysis – Q3 2012 Total of $17.6 million in leasing costs Renewals 400,000 square feet $8.9 million, or $4.44 per square foot per year of lease term, in tenant improvement and commission costs 5.0 years average term Expansions 89,000 square feet $3.3 million, or $4.96 per square foot per year of lease term, in tenant improvement and commission costs 7.5 years average term New leases 231,000 square feet $5.4 million, or $5.22 per square foot per year of lease term, in tenant improvement and commission costs 4.5 years average term Note: These figures include our pro rata share of leasing activity at all properties. 18 Bank of America Plaza – Charlotte, NC |

|
|
Significant Leases Significant new leases executed in 2012 Bank of America Plaza (Charlotte, NC) – New lease totaling 139,000 square feet bringing the property to 92% leased at September 30 5 & 15 Wayside (Burlington, MA) – Two new leases totaling 96,000 square feet backfilling the majority of the 107,000 square foot tenant contraction bringing the property to 96% leased at September 30 Eldridge Place (Houston, TX) – New lease totaling 89,000 square feet bringing the 824,000 square foot, three-building Eldridge Place portfolio to 98% leased at September 30 One BriarLake Plaza – Extension of 204,000 square foot tenant from 2018 expiration to 2024 Two BriarLake Plaza – 159,000 square foot lease providing the opportunity to develop Two BriarLake Plaza 19 |

|
|
Business Strategy – Position the Portfolio for Strategic Flexibility Cull the Portfolio (square feet at ownership share) We continue to focus on culling the portfolio and reducing our geographic footprint enabling us to: further deleverage the company; and position the company for liquidity opportunities for shareholders We began 2012 with 57 properties totaling 20.4 million square feet located in 30 markets. Through the end of October, we have disposed of six properties, including Minnesota Center, St. Louis Place, Southwest Center, 4440 El Camino Real, One City Centre and Alamo Plaza We have two properties totaling 743,000 square feet located in two non-core markets that are in various stages of the sales process We have eight additional properties in special servicing totaling 1.6 million square feet located in five non-core markets that we intend to exit in the next 12 months 20 |

|
|
Business Strategy – Position the Portfolio for Strategic Flexibility Strengthen the Balance Sheet Our pro rata share of outstanding debt at September 30 totaled $2.218 billion, a decrease from $2.339 billion at June 30 The decrease is attributable to the sale of One City Centre and third quarter principal amortization Based on our December 2011 estimated real estate value, our leverage on real estate stood at 63.7% at September 30 down from 64.7% at June 30 Completing the disposition of 2.4 million square feet of troubled properties will enable us to further reduce our leverage by approximately 2.5% 21 |

|
|
Business Strategy – Position the Portfolio for Strategic Flexibility Increase Occupancy Growing occupancy is a key area of focus for us During 2011, we had 2.6 million square feet of expiring leases, representing 11% of the then existing total square feet of the portfolio. Inclusive of early renewals, we leased 3.9 million square feet during 2011 representing approximately 18% of our total square feet During the third quarter, we had 975,000 square feet of expiring leases We leased 720,000 square feet resulting in net negative absorption of 255,000 square feet for the third quarter. The negative absorption for the quarter primarily resulted from the August 2012 lease expirations of two tenants totaling 396,000 square feet Our occupancy at September 30 stood at 85%, down from 86% at June 30 and up from 84% at December 31 Our average annual lease expirations through 2016 are fairly modest averaging 8.3% with highest year during this period totaling just 9.5% 22 |

|
|
Behringer Harvard REIT I, Inc. 250 West Pratt Baltimore, MD Colorado Building Washington, DC 1650 Arch Street Philadelphia, PA 500 East Pratt Street Baltimore, MD 5 & 15 Wayside Burlington, MA 1325 G Street, Washington, DC One BriarLake Plaza Houston, TX The Wanamaker Building Philadelphia, PA One Financial Place Chicago, IL Energy Centre New Orleans, LA 222 S. Riverside Chicago, IL Three Eldridge Place Houston, TX One & Two Eldridge Place Houston, TX United Plaza Philadelphia, PA Three Parkway Philadelphia, PA |
|
|
Questions? During the call, please e-mail questions to: bhreit@behringerharvard.com 24 |
|
|
Playback Information Representatives may log on to the protected portion of the Behringer Harvard website using their DST Vision ID for a playback of today’s call Shareholders should call toll free (855) 859-2056 and use passcode 25915205 Presentation available on our website at www.behringerharvard.com/reit1 under the heading ‘SEC Filings’ for the Form 8-K filing made today 25 |